Sfare Aid Rules Volume H Country Reports...
159
Competition between Airports and the Application of Sfare Aid Rules Volume H ~ Country Reports Italy Milan Linate (LIN) J Ownership and organisational structure The airport is part of Gruppo SEA (Milan Airports). Ownership is 14.6% local government and 84.6% City of Milan. Other shareholders hold the remaining 0.8%. Privatisation (partial) was scheduled for the end of 2001 but was stopped after the events of 11 th September. Now the proposed date is October 2002 but this has still to befinalised.Only 30% of the shareholding will be moved into the private sector with no shareholder having more than 5%. There are no legislative changes required. The provision of airport services is shared between ENAV (ATC), Italian police (police), SEA (security), ATA and SEA Handling (passenger and ramp handling), Dufntal (duty-free) and SEA Parking (car parking). There are no current environmental issues but, in the future, there is a possible night ban and charges imposed according to aircraft noise. 2 Type ofairpo Milan Linate is a city-centre (almost) airport that serves mainly the scheduled domestic and international market with a growing low-cost airline presence (Buzz, Go). There is very little charter and cargo traffic but some General Aviation. The airport is subject to traffic distribution rules imposed by the Italian government with the aim of 'encouraging' airlines to move to Malpensa. Traffic Data (2000) Domestic fíghts Terminal Passengers (arrivals) Terminal Passengers (departures) Cargo (tonnes - inbound) Cargo (tonnes - outbound) Aircraft movements (arrivals + departures) Scheduled 2 103 341 2 084 008 1093 1213 44 022 Charter _ . 7 4 8 Total 2 103 341 2 084 008 1 100 1217 44 030 Intemaüonal flights (Intra EU) Terminal Passengers (arrivals) Terminal Passengers (departures) Cargo (tonnes - inbound) Cargo (tonnes-outbound) Aircraft movements (arrivals + departures) Scheduled 915 656 920 653 3 446 4 054 21394 Charter 294 160 _ - 7 Total 915 950 920 813 3 446 4 054 21401 Л/г Transport Group, School of Engineering, Cranfield University ITL 13
Transcript of Sfare Aid Rules Volume H Country Reports...

Competition between Airports and the Application of Sfare Aid Rules Volume H ~ Country Reports Italy
Milan Linate (LIN)
J Ownership and organisational structure
The airport is part of Gruppo SEA (Milan Airports). Ownership is 14.6% local government and 84.6% City of Milan. Other shareholders hold the remaining 0.8%.
Privatisation (partial) was scheduled for the end of 2001 but was stopped after the events of 11th September. Now the proposed date is October 2002 but this has still to be finalised. Only 30% of the shareholding will be moved into the private sector with no shareholder having more than 5%. There are no legislative changes required.
The provision of airport services is shared between ENAV (ATC), Italian police (police), SEA (security), ATA and SEA Handling (passenger and ramp handling), Dufntal (duty-free) and SEA Parking (car parking).
There are no current environmental issues but, in the future, there is a possible night ban and charges imposed according to aircraft noise.
2 Type ofairpo
Milan Linate is a city-centre (almost) airport that serves mainly the scheduled domestic and international market with a growing low-cost airline presence (Buzz, Go). There is very little charter and cargo traffic but some General Aviation. The airport is subject to traffic distribution rules imposed by the Italian government with the aim of 'encouraging' airlines to move to Malpensa.
Traffic Data (2000)
Domestic fíghts Terminal Passengers (arrivals) Terminal Passengers (departures) Cargo (tonnes - inbound) Cargo (tonnes - outbound) Aircraft movements (arrivals + departures)
Scheduled 2 103 341 2 084 008
1093 1213
44 022
Charter _ .
7 4 8
Total 2 103 341 2 084 008
1 100 1217
44 030
Intemaüonal flights (Intra EU) Terminal Passengers (arrivals) Terminal Passengers (departures) Cargo (tonnes - inbound) Cargo (tonnes-outbound) Aircraft movements (arrivals + departures)
Scheduled 915 656 920 653
3 446 4 054
21394
Charter 294 160
_ -
7
Total 915 950 920 813
3 446 4 054
21401
Л/г Transport Group, School of Engineering, Cranfield University ITL-13

Competition between Airports and the Application of State Aid Rules Volume II ~ Country Reports Italy
International nights (non-EU) Terminal Passengers (arrivals) Terminal Passengers (departures) Cargo (tonnes - inbound) Cargo (tonnes - outbound) Aircraft movements (arrivals + departures)
Scheduled 166
_
4 1
37
Charter 489
1052 .
¡
Total 655
1052 4 1
51
3 Route structure and key airlines
Dominant airlines at Linate are Alitalia and Air One, both ól frating the Milan Linate ~ Rome shuttle. British Airways and Lufthansa have a relatively limfpl presence. Apart from Rome, the major routes from Linate serve London, Frankfurt and Pfis.
4 Catchment area
I J|
The catchment area for Linate is defined in the following Tal
Type of Traffic
Scheduled domestic
Scheduled international
(origin-destination traffic)
Scheduled international
(transfer traffic)
Charter international
Cargo (origin-destination traffic)
Cargo (transfer traffic)
Catchment area definition
30 minutes driving time
60 minutes driving time I
60 minutes driving time
Up to 120 minutes driving time I
Overlaps with other airports
Malpensa, Bergamo
Malpensa, Bergamo
Malpensa
Malpensa, Bergamo
Malpensa, Bergamo
Jnate does not have any real over all other airports. Linate is motorway and public transport
Ian prefers to be served by Linate
5 Competing airports
In terms of competing airports and market segments. competitor because its strategic position gives an advantaj only 7 km from the centre of Milan and is served by services. Most of the population in the catchment area of| instead of Malpensa or Bergamo (the two nearest airports)
6 Current andfiiture investment plans
There appears to have been no major investment undertaķfļj in the last few years nor is any planned in the future.
As for surface infrastructure, future plans include a pre-fe line linking the airport with the centre of Milan.
sility study for a new subway
ITL-14 Air Transport Group, School of Engineeringl roranfiė/cr University

Competition between Airports and the Application of State Aid Rules Volume II ~ Country Reports Italy
7 Airport charges
Airport charges include take-off, landing, passenger service, aircraft parking, air bridges and security. The principal charges are based on MTOW. Until 2002, the government, with the exception of air bridge charges (decided by the airport), set all charges. The charges are the same for all airlines. Starting from 2002 charges will be revised by each airport taking into account traffic levels and airport costs. The charges still have to be approved by government. There are no user discounts available.
8 Financial performance
The summary SEA Group Profit and Loss account (Euro) below is taken from the Annual Report of SEA Milan. Data is not broken down for individual airports (not in the public domain, anyway).
Year ending
Aeronautical income
Concession income
Other income
Tota income
Staff costs
Security costs
Policing costs
Depreciation
Other costs
Tota costs
Operating profir
Interest received
Interest paid
Extraordinary items
Pre-tax profit
Taxation
Net prom
2000
399 387 340
93175 468
46 631 958
539 194 765
251 028 151
56 798 173
143 734 232
451 560 556
87 634 209
12 569 117
17 316 057
77 190 108
160 077 377
76 721 587
83355 790
í 999
354 277 030
83 573 661
44 845 608
482 696 299
255 068 320
54 133 540
141 024 570
450226 430
32 469 868
21 289 137
14 541 908
42 767 543
81 984 641
39 106 855
42 877 785
1998
338 174 945
80 853 393
4 Í9 028 338
206 034 799
30 905 297
115 670 335
352 6 Í0 431
66 417 907
8 354 207
- 9 638 635
65 733 478
33 613 081
31 520 397
There is no data available on security costs but these are probably included in other staff costs.
Corporation tax is paid on earnings. Depreciation is based on straight line, for the following typical depreciation periods:
Terminal and buildings Runways, taxiways and aprons
100 years nil if paid for by Government
Air Transport Group, School of Engineering, Cranfíeld University ITL-15

Competition between Airports and the Application of State Aid Rules
Plant and machinery Terminal / airport systems Vehicles, equipment
3 -10 years 5 years 4 - 5 years
Volume II ~ Country Reports Italy
Sources offitnding
None reported
10 Public funding issues
There has been no significant investment at Linate foillmany years. In any case, the introduction of traffic distribution rules had the intention ó||ramferrmg airlines to Malpensa (being congested and suffering from environmental constrJJits!) with Linate being reserved solely for Alitalia and Air One operations. As it has turned otíjt, due to EU pressure, the major European airlines still have a presence at Linate, which is|ļie preferred airport for busmess traffic associated with Milan.
ITL-16 Air Transport Group, School of Engineering, Wkanfield University

Competition between Airports and the Application of State Aid Rules Volume II ~ Country Reports Italy
Milan Malpensa
Ownership and organisational structure
The airport is part of Gruppo SEA (Milan Airports). The main shareholders of SEA are the Municipality of Milan owning 84.559 % and the Province of Milan owning 14.558 %. Other shareholders hold the remaining 0.8%. Malpensa has an alliance with other important cargo hubs and is part of Galaxy bitemational Cargo Airport Alliance.
SEA also owns 49.98 % of Sacbo (the company handling Bergamo Orio al Serio airport), 12.5 % of Aeradria (the company handling Rimini airport), 5 % of Gesac (the company handling Napoli airport) and 0.96 % of Sagat (the company handling Torino Caselle airport).
Privatisation (partial) was scheduled for the end of 2001 but was stopped after the events of 11* September. Now the proposed date is October 2002 but this has still to be finalised. Only 30% of the shareholding will be moved into the private sector with no shareholder having more than 5%. There are no legislative changes required.
The provision of airport services is shared between ENAV (ATC), Italian police (police), SEA (security), ATA and SEA Handling (passenger and ramp handling), Dufiital (duty-free) and SEA Parking (car parking).
Environmental restrictions were imposed in late 2000. Runways have to be operated 8 hours for departures and then 8 hours for departures, alternatively on a continuous basis. There are other noise restrictions that are applied to flight paths, noise abatement and night flights.
2 Type of airport
Milan Malpensa is an international gateway airport serving the north of Italy. This airport caters for all market. In recent years Alitalia had thought about developing Malpensa as a hub for their international operations. However, due to environmental and infrastructure constraints this policy has had to be revised and hub operations now appear to be concentrated on Rome Fiumicino.
Traffic Data (2000)
Domestic flights Terminal Passengers (arrivals) Terminal Passengers (departures) Cargo (tonnes - inbound) Cargo (tonnes -outbound) Aircraft movements (arrivals + departures)
Scheduled 2 728 122 2 688 028
4 226 6 888
72 799
Charter 38 817 36 579
50 89
1368
Total 2 766 939 2 724 607
4 276 6 977
74167
Air Transport Group, School of Engineering, Cranfìeld University ITL-17

I Competition between Airports and the Application of State Aid Rules Volume II - Country Reports
Italy
International tiights (Intra EU) Terminal Passengers (arrivals) Terminal Passengers (departures) Cargo (tonnes - inbound) Cargo (tonnes - outbound) Aircraft movements (arrivals + departures)
Scheduled 3 647 805 3 623 655
16 522 23 214
109 526
Charter 366 793 376 203
91 128
! 5 882
Total 4 104 598 3 999 858
16 613 23 342
115 408 ! I
1
í International lights (non-EU)
ι Terminal Passengers (arrivals) Terminal Passengers (departures) Cargo (tonnes - inbound)
Cargo (tonnes - outbound) Aircraft movements (arrivals + departures)
Scheduled 2 735 700 2 687 493
108 868 128 939 47 965
I Charter ! 795 638 I
I I
I I
'| 815 307 668
I 1297 10 082
Total 3 531 338 3 502 800
109 536 130 236
58 047
Route structure and key airlines
Alitalia heavily dominates the scheduled domestic núujist segment and, likewise, the international scheduled and cargo market. Other airlinll with a reasonably significant presence include Air Europe, Lufthansa and EuroflyJ ļ||iajor destinations served from Malpensa include London, Naples, Paris and Catania.
4 Catchment area
The catchment area for Malpensa is defined in the followińj
Type of Trafíte
Scheduled domestic
Scheduled international
(origin-destination traffic)
Scheduled international
(transfer traffic)
Charter international
Cargo (origin-destination traffic)
Cargo (transfer traffic)
Catchment area definition
30 minutes driving time
60 minutes driving time
60 minutes driving time
Γ
Up to 120 minutes driving tirr J
able.
Overlaps with other airports
Milan Linate
Milan Linate
Milan Linate
Bergamo
Linate, Bergamo
Zurich, Frankfurt
The catchment areas for each traffic segment are móljtored by interviewing passengers directly about origin, destination, and purpose of journey means of access to the airport.
ITL-18 Air Transport Group, School of EngineeríngAmanfíeld University

Compétition between Airports and the Application of Stete Aid Rules Volume II ~ Country Reports Italy
5 Competing airports
The principal competitor to Milan Malpensa is Milan Linate (located 50 km to the SE and part of the same ownership group). The two airports compete for scheduled services to common destinations, some of which are operated by the same airlme and others offering a choice of low-cost versus main-line carrier. The two airports effectively have a common catchment for scheduled services. Note also, that Malpensa has environment and slots constraints, whereas Linate just has slot constraints. The element of competition has also been distorted by the imposition of traffic rules in order to encourage EU airlines to transfer their operations from Linate to Malpensa.
The second airport competitor is Paris Charles de Gaulle. It was the intention the develop Malpensa as an Alitalia hub (before the environmental constraints surfaced) in competition to Charles De Gaulle. The latter is considered to be the main alternative for Italian connecting traffic due to the destination network offered by CdeG and the number of flights between Italian cities (and therefore the Italian market) and Paris.
Other competing airports include Madrid, Frankfurt, Zurich and Munich. These airports are also hubs and the nature and scope of the competition meludes additional routes offered by other airports, lower fares, preferred airlines and increased flight frequencies.
6 Current andfiiture investment plans
The major investment in the last ten years has been the completion of the Malpensa 2000 project. The Malpensa 2000 project saw the development of a new Passenger (West) Terminal in addition to the existing North Terminal at the airport. Two thirds of the new Passenger Terminal opened in October 1998, with two satellites and the respective aircraft aprons. In this phase there were 26 docking bridges from the satellites and remote aircraft parking around the aprons. Additional new infrastructure also included the two original runways, which have been lengthened.
According to SEA's estimates the overall cost of the Malpensa 2000 Project amounted to ITL 1,990 billion broken down as follows:
Construction costs: ITL 1,780 billion approximately; Design, works supervision, trial tests, interest expense, land purchase: ПЪ 210 billion approximately
Under an Annex to Convention n. 4014 of December 16, 1986 signed with SEA ("Construction License for Malpensa Intercontinental Airport's Works and Infrastructures") the Italian government allowed an ITL 850 Bn financing for the execution of works through
Air Transport Group, School of Engineering, Cranfield University /71-Y 9

Competition between Airports and the Application of State Aid Rules Volume II ~ Country Reports Italy
the funds allocated under Act 449/85 and 67/88. This wasJIowever, insufficient to finance the entire project.
This required SEA to seek additional fonds from the moni Malpensa 2000 Project as one of EU high-priority projectsļ 400 billion loan from the European Investment Bank. In Ì ITL 200 billion to SEA Milan. The loan followed on fro billion in 1994. In connection with financing for Malpen available towards the Milan-Laghi motorway. If one coni granted by the Italian government, it becomes clear that Malpensa 2000 Project accounted for by the private proportion of the total construction costs.
markets. The EU rating of the ibled SEA to qualify for a ITL
the ЕШ advanced a loan for initial instalment of ITL 200
the ЕЮ has also made funds lers that ITL 850 billion were share of the investment for the
:or accounted for a significant
There are no current plans for firture major investment progflfmmes at Malpensa.
Associated surface access infrastructure constructed up tdļlļEOOl included the rail link from Milan to the airport and the road network linking the exişllig (north) terminal with the new terminal. The capital costs of the former were met by local lovernment (Regione Lombardia) and central government. There was no financial contribution | y the airport company.
Future surface access infrastructure meludes a new road Mian - Turin), consisting of 19 km of dual carriageway The sources of fonding will again be met by local goy< central government and the airport will, once again, make
7 Airport charges
Airport charges include take-off, landing, passenger servii security. The principal charges are based on MTOW. Ui exception of air bridge charges (decided by the airport), same for all airlines. Starting from 2002 charges will be account traffic levels and airport costs. The charges still hi
In the future discounts will be available for airlines bal discounts will be available for handling charges in the case
8 Financial performance
Refer to Section 8, Milan Linate
ram Malpensa to A4 (motorway fth a completion date 2005 / 06.
lent (Regione Lombardia) and Ifinancial contribution.
1, aircraft parking, air bridges and 2002, the government, with the all charges. The charges are the
l vised by each airport taking into Í to be approved by government.
on traffic volume. In addition, ? long-term contracts.
ITL-20 Air Transport Group, School of EngineeringĄWranfield University

Competition between Airports and the Application of State Aid Rules Volume II - Country Reports Italy
9 Sources of funding
Apart from the ЕШ loans discussed in Section 6, the following TEN-Т grants have also been made:
TEN-T1996 Malpensa 2000 M€2.000 TEN-T 1997 Malpensa 2000 M€4.000 TEN-T 1998 Malpensa 2000 M€8.000 TEN-T 1999 Interest rate subsidy (fifth year) M€l 1.000
10 Public funding issues
Due to environment and congestion problems Malpensa is not presently in a position to become more competitive with other international airports. Local competition is between Malpensa and other regional airports (Turin, Bergamo), the latter have the chance to grow their traffic base especially in the low-cost airline market. Future capital mvestment at Malpensa is most likely going to be covered by m-house ftindmg now that the Malpensa project is substantially complete.
Air Transport Group, School of Engineering, Cranfield University ITL-21

Competition between Airports and the Application of State Aid Rules
Rome Fiumicino
Volume II ~ Country Reports Italy
I I
Ownership and organisational structure
Rome Fiumicino airport is a private sector company whosalhareholding is divided between local government (4%), Gemina (42%), Falk (31%), Italpejļ>li (16%), bnpregilo (11%) and others.
The airport company is also a shareholder in other акроЩ: Goa (15%), SUF (16%) and ACSA [a South African airport management company] (2(Ж
ι II
The provision of airport services is shared between E N A | | (ATC), Italian police (police), Third-party companies (security, passenger and ramp handļ||ļg, and duty free), and the airport company (duty-free, car parking).
There are no current environment restrictions and / or chargj|| but this could change in the future.
Type of airport
Rome Fiumicino is the international gateway to Italy aridi she headquarters of Alitalia. The main market segments at Fiumicino are scheduled doMsstic and international passenger traffic plus cargo. Similar to other gateway airports, the (¡¡¡arter market is relatively small as most inbound tourists use scheduled airlines.
Traffic Data (2000)1
Domestic mghts Terminal Passengers (arrivals) Terminal Passengers (departures) Transit Passengers Cargo (tonnes - inbound) Cargo (tonnes - outbound) Aircraft movements (arrivals + departures)
Scheduled 6 210 000 6 240 000
30 000 4 282 I 6 233 !
148 221
Charter 30 000
I | 20 000
9 37
726
Total 6 240 000 6 240 000
50 000 4 291 6 270
148 947
International flights (Intra EU) Scheduled Charter Total Terminal Passengers (arrivals) 3 800 000 60 000 3 860 000 Terminal Passengers (departures) 3 730 000 70 000 3 800 000 Transit Passengers 100 000 2 000 102 000 Cargo (tonnes - inbound) 11 707 6 11713 Cargo (tonnes - outbound) 16 826 17 16 843 Aircraft movements (arrivals + departures) 82 163 1232 83 395
/71-22 Air Transport Group, School of Engineering, flranffe/d University

Competition between Airports and the Application of State Aid Rules Volume II ~ Country Reports Italy
International lïïghts (non-EU)
Terminal Passengers (arrivals)
Terminal Passengers (departures)
Transit Passengers
Cargo (tonnes - inbound)
Cargo (tonnes - outbound)
Aircraft movements (arrivals + departures)
Scheduled
2 910 000
2 740 000
190 000
42 803
70 674
43 772
Charter
210 000
190 000
30 000
38
211
2 705
Total
3 120 000
2 930 000
220 000
42 841
70885
46 477
3 Route structure andL·}/ airlines
The following Table confirms that Alitalia (AZ) dominates most markets with the exception of charter traffic; this is a limited market anyway.
Traffic type
Scheduled domestic
Scheduled intra-EU
Scheduled international (non-EU)
Charter intra-EU
Charter international (intra-EU)
Cargo (all)
f a t ø e
AZ
AZ
AZ
BV
PE
AZ
%
80
36
29
42
27
28
2 n d a/W/ne
AP
BA
SR
AP
BV
CO
%
9
10
6
20
17
6
3"* airline
IG
LH
DL
AZ
AZ
DL
%
5
9
5
17
16
6
Catchment area
The catchment area for Rome Fiumicino is defined in the following Table.
Type of Traffic
Scheduled domestic
Scheduled international
(origin-destination traffic)
Scheduled international
(transfer traffic)
Catchment area definition
60 minutes driving time (3 million people)
120 minutes driving time (12 million people)
120 minutes driving time (12 million people)
The catchment area was determined by marketing analysis and passenger surveys.
5 Competing airports
The only competing airport is Milan Malpensa (located 600 km to the NW) for all market segments but intercontinental flights in particular. Both Malpensa and Fiumicino airports are an Alitalia base for long-haul services.
Air Transport Group, School of Engineering, Cranfield University ITL-23

Competition between Airports and the Application of Stete Aid Rules \\\\¡ Volume II - Country Reports Haly
Uli o Current and fiiture investment plans
Recent capital investment includes:
Improvements to domestic terminal Construction of new international terminal Construction of cargo city in eastern area
No information on capital costs is available but 55% government. Future investment includes further developifllnt of the cargo city and new
the funding was from central
facilities to Terminal A. Again, there is no information on government support.
)ital costs, sources of funds and
Surface access construction in recent years includes the raf link from the airport to Termini Station. This was funded by the state (Italian Railways),! ¡Ipept for the internal link to the terminals, and no information on capital costs was m| |e available. No surface access construction is planned for the future.
aircraft parking, air bridges and idges. The principal charges are exception of air bridge charges
[the same for all airlines. Starting into account traffic levels and
sovernment. There are no user
7 Airport charges
Airport charges include take-off, landing, passenger servii security. There are peak period supplements for the air based on MTOW. Until 2002, the government, with tl (decided by the airport), set all charges. The charges an from 2002 charges will be revised by each airport t airport costs. The charges still have to be approved b discounts available.
8 Financial performance
Corporation tax at 40.25% is paid on earnings. Depreciáffn is based on straight line, for the following typical periods:
Terminal and buildings 10 years Runways, taxiways and aprons 25 years Plant and machinery 4 - 1 0 years Terminal / airport systems 4-10 years Vehicles, equipment 4 years
/71-24 fit Transport Group, School of BigineeringMranfiefd University

Competition between Airports and the Application of State Aid Rules Volume II ~ Country Reports Italy
Summary Profit and Loss Account (Euro)
Year ending
Total income
Staff costs
Security costs
Policing costs
Depreciation
Other costs
Total costs
Operating proñ
Interest received
Interest paid
Extraordinary items
Pre-tax profít
Taxation
Net profit
2000
506 229 000
157 871 000
na
na
45 648 000
199 196 000
402 7Í5 000
f 03 5-Í3 000
2 383 000
-9 431 000
-29 670 000
66 795 000
31 746 000
35 049 000
1999
599 663 000
210 834 000
na
na
53 400 000
239 982 000
504 216 000
95 445 000
2 009 000
-13 155 000
4 983 000
89 282 000
37 712 000
51 570 000
1998
570 859 000
220 058 000
na
na
36 730 000
208 869 000
465 657 000
105 202 000
22 445 000
-23 724 000
-1 598 000
Í02 325 000
52 651 000
49 674 000
9 Sources of funding
Total investments in 2000 amounted to 165 billion ITL, of which 55% is provided by the State.
In 1999 ЕШ announced a loan for 155 million Euro to upgrade the airport including reconstruction of a runway, reconfiguration of the engine testing area, expansion of the existmg passenger handling facilities, a fully-fitted new pier, including baggage handling system, and a moving walkway, these projects to be completed by Dec. 2002.
10 Public funding issues
The state has invested considerable funds into Fiumicino airport. However, much of the funding appears to be repayable and in any case there appear to be no competition issues as, compared with Linate, Fiumicino does appear to have the ability to expand to meet growth in traffic levels.
Air Transport Group, School of Engineering, Cranfíeld University /71-25

Competition between Airports end Ote Application of State Aid Rules
Türin
Ownership and organisational structure
Volume II ~ Country Reports Italy
Turin is a regional airport with a complicated mixed State The shareholding is as follows:
Local or regional government j City or town authority j Turin Chamber of Commerce | Private shareholding Į
lership and private ownership.
.2%
.0% ' 1 % .29%
The private shareholding includes: Edizione Holding SpA 14.39%, Aeroporto G. Marconi Bologna SpA 4.13%, Sicid SpA 2%, SEA SpA 0.96%, Aviilartner SpA 0.41%, NHS Nuova Holding San Paulo bni SpA 12.4%. Note that the airppll is partiaUy owned by Bologna airport, which is an industrial partner. The objective is lib create a national network of regional airports.
It is not expected that further privatisation will occur in thé :
The provision of airport services is shared between EN¡¿ airport (security, passenger and ramp handling, and car pi ramp handling) and concessionaire (duty-free).
There are no current environmental issues but a night-ban i
Type of airport
Turin is a regional airport with mainly scheduled domei low-cost airline market is starting to develop at this airp relatively small.
(ATC), Italian police (police), ţ), Aviapartner (passenger and
»ossible in the future.
and international services. The Charter and cargo markets are
Traffic Data Í2000)
Domestic flights Scheduled Charter Total
Terminat Passengers (arrivals) 737 722 1671 73Θ 393 Terminal Passengers (departures) 732 076 1882 733 958 Transit Passengers 49 49 Cargo (tonnes - inbound) 355 355 Cargo (tonnes - outbound) 355 343 ATMs (arrivals * departures) 18 042 72 18114 Aircraft movements (arrivals + departures) 30 307
ITL-26 Air Transport Group, School of Engineering, mķanfield University

Competition between Airports and the Application of State Aid-Rules Volume II ~ Country Reports Italy
International flights (Intra EU)
Terminal Passengers (arrivals)
Terminal Passengers (departures)
Transit Passengers
Cargo (tonnes - inbound)
Cargo (tonnes - outbound)
ATMs (arrivals + departures)
Aircraft movements (arrivals + departures)
Scheduled
506 868
499 065
2 803
946
784
22 834
Charter
96 416
95188
1306
774
1713
2 178
Total
603 284
594 253
4109
1720
2 497
25 012
28 724
International flights (non-EU)
Terminal Passengers (arrivals)
Terminal Passengers (departures)
Transit Passengers
Cargo (tonnes - inbound)
Cargo (tonnes - outbound)
ATMs (arrivals + departures)
Aircraft movements (arrivals + departures)
Scheduled
43 798
46 076 _
194
108
2 559
Charter
13 770
13 795
593
228
140
306
Total
57 568
59 871
593
422
248
2 865
2 943
3 Route structure and key airlines
Alitalia dominates the domestic scheduled market while Lufthansa, Air France and Ryanair are the major players in the international scheduled market.
Traffic type
Scheduled domestic
Scheduled intra-EU
Scheduled international (non-EU)
Charter intra-EU
Charter international (intra-EU)
Cargo (all)
1st airline
AZ
LH
SR
DP
TU
UPS
2nd airline
AP
AF
/
BY
6H
TNT
ЗГ* airline
IG
FR
/
JM
BU
/
Catchment area
The catchment area for Turin for different market segments is determined by interviews. The actual catchment area definition is not clear but competing airports for origin / destination scheduled international traffic include Malpensa, Genoa and Lyon (France) while Malpensa is the prime competitor for international transfer traffic. Lyon is the main competitor for charter traffic while Malpensa is the main competitor for cargo traffic.
5 Competing airports
The principal competitor for Turin is Milan Malpensa, located about 100 km to the northeast. The competing market segments are charter and scheduled traffic and Malpensa enjoys an
Air Transport Group, School of Engineering, Cranfíeld University ITL-27
Competition between Airports and the Application of State Αία Rules Volume II ~ Country Reports Italy
advantage being an mternational hub served by Alitalia, lftie second competitor is Lyon airport located 300 km to the west of Turin. Lyon comlptes with Turin in the market segments of charter and international scheduled traffic. The Inird competitor is Nice, located 200 km to the southwest, where the competing market segmflt is international charter.
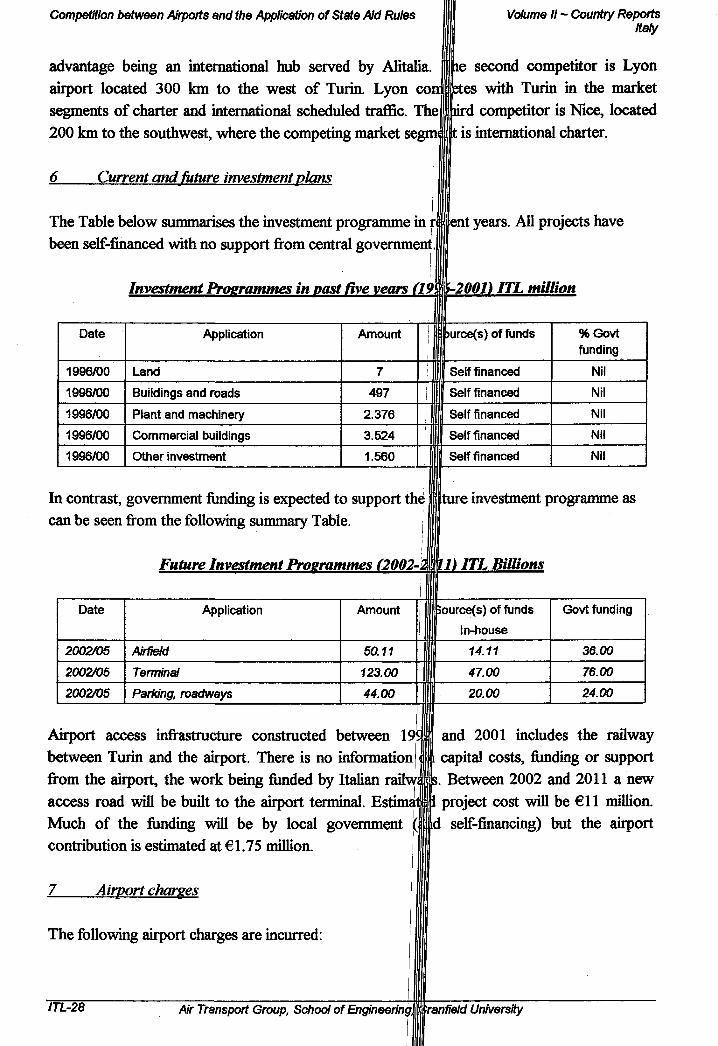
6 Current and future investment plans
The Table below summarises the investment programme in ff fent years. All projects have been self-financed with no support from central government.
Date
1996/00
1996/00
1996/00
1996/00
1996/00
Investment Programmes in vast five vears (19
Application
Land
Buildings and roads
Plant and machinery
Commercial buildings
Other investment
Amount
7
497
2.376
3.524
1.560
j
1
ι 1
m-2001í ITL million
I purce(s) of funds
| Self financed
Į Self financed
I Į Self financed
Į Self financed
[J Self financed
%Govt funding
Nil
Nil
Nil
Nil
Nil
In contrast, government funding is expected to support thé fffture investment programme as can be seen from the following summaiy Table.
Future Investment Programmes (2002-Ęfl) ITL Billions
Date
2002/05
2002Ю5
20О2Ю5
Application
Airfield
Terminal
Parking, roadways
Amount
50.11
123.00
44.00
:
Bource(s) of funds
| In-house
14.11
47.00
\ 20.00
Govt funding
36.00
76.00
24.00
Airport access infrastructure constructed between 19' between Turin and the airport. There is no information from the airport, the work being funded by Italian railwi access road will be built to the airport terminal. Estimai Much of the funding will be by local government (j contribution is estimated at €1.75 million.
and 2001 includes the railway capital costs, funding or support Between 2002 and 2011 a new
project cost will be €11 million. d self-financing) but the airport
Airport charges
The following airport charges are incurred:
/71-28 Air Transport Group, School of En&neenngmįranlield University
Competition between Airports and the Application of Sfare Aid Rules Volume II ~ Country Reports Italy
Take off Landing Passenger service charge Aircraft parking ATC (Approach Control) Air bridges Security Noise or night flight supplements Peak period supplements
The principal charges are based on MTOW. Until 2002, the government, with the exception of air bridge charges (decided by the airport), set all charges. The charges are the same for all airlines. Starting from 2002 charges will be revised by each airport taking into account traffic levels and airport costs. The charges still have to be approved by government. There are no user discounts available.
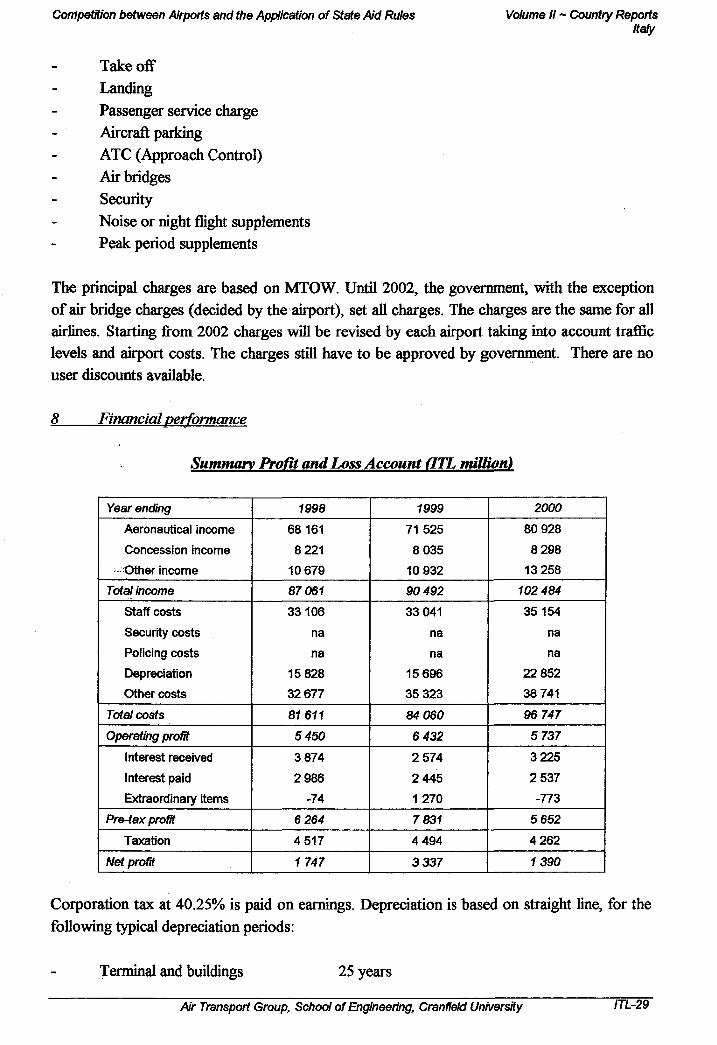
8 Financial performance
Summary Profit and Loss Account (TTL million)
Year ending
Aeronautical income
Concession income
Other income
Total income
Staff costs
Security costs
Policing costs
Depreciation
Other costs
Total costs
Operating profit
Interest received
Interest paid
Extraordinary items
Pre-tax profit
Taxation
Net proñt
1998
68 161
8 221
10 679
87 061
33 106
na
na
15 828
32 677
81611
5450
3 874
2 986
-74
6 264
4 517
1747
1999
71 525
8 035
10 932
90 492
33 041
na
na
15 696
35 323
84 060
6 432
2 574
2 445
1270
7 83Í
4 494
3337
2000
80 928
8 298
13 258
Ï02 484
35 154
na
na
22 852
38 741
96 747
5 737
3 225
2 537
-773
5 652
4 262
í 390
Corporation tax at 40.25% is paid on earnings. Depreciation is based on straight line, for the following typical depreciation periods:
Terminal and buildings 25 years
Air Transport Group, School of Engineering, Cranfield University /71-29

Competition between Airports and the Application of Stete Aid Rules Volume II - Country Reports Italy
Runways, taxiways and aprons Plant and machmery Terminal / airport systems Vehicles, equipment
concession end |¡l035) 3 years 25 years 5 years
9 Sources of funding
The following public sector grants (ITL million) have been álikded between 1996 and 2001
CIPE - Piedmont Region - Technological improvemail AVL 19.556 Transport Ministry - Giubileo 2000 ' 17.000 Transport Ministry - Infrastructure for water supply J 20.000 Environment Ministry - Noise monitoring ! J 700 FIP - Improvement Safety i III 6.576
None expected are expected in the next few years.
10 Public ňmding issues
None at present.
ITL-30 Air Transport Group, School of Engineering, iranfiefcr University

Competition between Airports and the Application of State Aid Rules Volume II ~ Country Reports Luxembourg
LUXEMBOURG (LUX)
1 Government Policies
J.J Organisational Structure
The Ministry of Transport is responsible for the overall policy issues and the regulation of civil aviation within the Luxembourg. Within the Ministry, a special department, the Civil Aviation Authority, is responsible for day-to-day policy and planning matters including the bilateral route negotiations, air safety regulation and the strategic planning and financial management of Luxembourg's only airport (Findel).
J. 2 Regulatory Environment
The Ministry of Transport covers all regulatory issues concerning airport policy, although other government ministries may also have some influence on related matters e.g. the Ministry of the Environment and the Ministry of Public Works. Luxembourg has no air code and most legislation, including EU directives, is integrated within the overall legal framework for the country.
/. 3 Airport Ownership Policy
Although still government-owned, Luxembourg Airport has recently been estabHshed as a separate state corporation. Under new legislation, the technical and operational aspects are now covered by a state-owned airport operating company, with the Civil Aviation Authority retaining responsibility for strategic planning, financial management and marketing. A separate company, under state control but with some limited private funding, has also been established to design, construct and eventually to operate a new terminal at the airport. The government has no plans to relinquish control of the airport to the private sector.
/. 4 Air Service Agreements
Luxembourg has developed a relative liberal approach towards traffic rights with third countries. Air Service Agreements have primarily focussed on cargo traffic and, in general, a policy has been adopted which protects the position of Cargolux. However, a number of other non-Luxembourg carriers have also been given rights for fifth freedom traffic.
Air Transport Group, School of Engineering, Cranfield University LUX-1

Competition between Airports and the Application of State Aid Rules Volume II ~ Country Reports Luxembourg
2 Air Traffic Statistics
Traffic throughput at Luxembourg Findel Airport in 1999 гЦр 2000 is indicated in the table below:
Luxembourg Findel Airport - Annual Traffmr 1999 and 2000
! 11
Total Passengers
Total Cargo
(tonnes)
Í999 (000)
1584
448
, + Ω s.«,«-.™ io „ ; „
2000(000)
1662
501
Source - ACI Europe
Ą\ \s(000)-\ j í999
! 41 ι II
I I 8
ATMs (000) -2000
43
8
2000, Luxembourg was the sixth busiest cargo airport in the Ilu.
LUX-2 Air Transport Group, School of Engineering, tranfie/d University

Competition between Airports and the Application of State Aid Rules Volume II ~ Country Reports Luxembourg
3 Airline Market
3.1 Luxair
Luxair is Luxembourg's main scheduled passenger airline. Based at Luxembourg Airport, it provides a range of European services (mainly to the principal EU airport hubs), primarily carrying point-to-point traffic. During the summer, Luxair also operates charter services to the main short-haul holiday destinations e.g. the Mediterranean, North Africa, Madeira, the Canaries etc.
Luxair is part of the Lufthansa-Star alliance and feeds inter-continental traffic through Frankfurt. It is part owned by the Luxembourg government (23.1%) and the State Bank (13.4%). Lufthansa also has a 12% stake.
3.2 Cargolux
Cargolux is a Luxembourg-registered all cargo airline operating scheduled and ad-hoc charter services throughout the world, based from their hub at Luxembourg Airport. Most flights are inter-continental, although there are a small number of scheduled EU services (e.g. to Vitoria in Spain). Cargolux has recently set up a second European base at Maastricht-Aachen Airport after obtaining unused traffic rights relinquished by Martinair. The airline has stated that it supports government's policy and has no complaints about the level of airport charges, which are relatively competitive in comparison with its neighbouring airports (e.g. Liege).
Cargolux is owned by Luxembourg financial institutions (33.1%) and Luxair (34.9%), with the balance (34.0%) held by various private conceras.
3.3 Other Carriers
Most European national carriers operate to and from Luxembourg including British Airways, Lufthansa, TAP, Tyrolean, KLM, and VLM Airlines etc. Other all-cargo airlines using the airport include Atlas Air and China Airlines Cargo.
AJr Transport Group, School of Engineering, Cranfíeld University LUX-3
Competition between Airports and the Application of State Aid Rules Volume II ~ Country Reports Luxembourg
Airports
Luxembours Findel
Ownership and Organisational Structure
As indicated above, the airport is owned by the Luxembouil government, with a day-to-day operational issues handled by a state-owned corporatiq)| reporting to the Ministry of Transport. To develop and manage the proposed new ter established which currently functions alongside the existk longer term, these two parallel companies will be mérgedj for all landside, terminal and airside operational activities.
al, a separate company has been operating corporation. In the o a single company responsible
2 Route Structure and Key Airlines
The airport offers scheduled passenger services to Copenhagen, Frankfurt, Geneva, Hamburg, Madrid, Stockholm, Turin and Vienna. Primarily Cargolux ani provide cargo services to a wide variety of international dei
pndon, Amsterdam, Barcelona, ¡¡ehester, Munich, Palma, Paris, rther specialist all-cargo airlines lations.
Catchment Area
Luxembourg Airport is the gateway to the Saar-Lor-b catchment area of 8-9 million people. Road access is connecting through to the main networks in France, Gei is some transfer cargo, the majority is trucked to or from! Netherlands and Belgium. There is currently no direct r¡ for this have been approved by the government and are plan.
4 Competing Airports
region, representing a potential )d, with direct motorway access ay and Belgium. Although there cembourg, France, Germany, the
to the airport, although plans icorporated in the airport master
Luxembourg Airport's main competitors are Frankfurt (d and frequencies), Liege (particularly for cargo traffic),
5 Current and Future Investment Plans
Apart from its access roads, much of the airport's infrasti indicated above, a special company has recently been Under the latest master plan, a new passenger termin
to its increased range of services srdam and Brussels.
re dates back to the 1970s. As |ablished to redevelop the airport.
be constructed, together with
LUX-4 Air Transport Group, Schod of Engineering, ¡manfield University

(competition between Airports and Oie Application of State Aid Rules Volume II ~ Country Reports Luxembourg
improvements to the apron, car parking and access roads. In the longer term, a new rail link to the airport is planned. Under a separate scheme, a new business park focussing on logistics is to be developed alongside the airport. This is to be financed by a combination of public and private finance.
6 Airport Charges
Airport charges include landing fees, passenger departure tax, aircraft parking and cargo handling/throughput charges. These are regarded to be relatively competitive in comparison with neighbouring airports.
7 Financial Performance
Neither the state-owned operating company or the Civil Aviation Authority publishes financial accounts nor these have not been made available for the purposes of this study.
8 Sources of Funding
It is unclear as to the extent to which Luxembourg Airport is self-financed through its own revenues - although it is probable that the State of Luxembourg provides strong financial support for most infrastructure projects. This is likely to continue as the proposed new company established to redevelop the airport is effectively under the control of the Luxembourg government and state-owned financial institutions.
9 Public Funding Issues
As indicated above, in common with certain other EU airports, there is a strong element of public funding at Luxembourg Findel Airport. It should also be pomted out that both Cargolux and Luxair are also effectively under state-ownership, thus theoretically giving the government control over its civil aviation sector.
Air Transport Group, School of Engineering, Cranfíeld University LUX-5

Competition between Airports and the Application of State Aid Rules Volume II ~ Country Reports Netherlands
THE NETHERLANDS (NLD)
I I
1 Government Policies
J. J Organisational Structure
The Netherlands has seven significant civil airports. These are the main international gateway (Amsterdam Airport Schiphol), five regional airports (Rotterdam Airport, Gronmgen Airport Eelde, Maastricht-Aachen, Eindhoven and Twente and a small business airport (Lelystad). Of these, Amsterdam Airport Schiphol handles a substantial majority of the country's traffic (it is the ELPs busiest passenger airport), with Rotterdam and Maastricht the second and third most important airport in terms of total traffic. A new route to London Stansted operated by the low-cost carrier, Ryanair, has recently boosted traffic at Eindhoven.
/. 2 Regulatory Environment
The Dutch Ministry of Transport and Water Management is the competent authority for overall policy in civil aviation. The Ministry was reorganised on 1st July 2001 under a new structure, which included a Directorate General of Civil Aviation (DGCA-NL) and the Civil Aviation Authority of the Netherlands (CAA-NL). The DGCA-NL is responsible for the development of policy and the creation of an efficient and sustainable aviation sector. The CAA-NL is an independent authority responsible for monitoring and implementing this policy and ensuring safe operations.
The legislative framework for civil aviation is embodied in the Luchvaartwet (Dutch Civil Aviation Codé) and its implementing secondary legislation. Current policy issues evaluated by DGCA-NL in the airport sector include airport noise (new standards will introduced when the fifth runway at Amsterdam Schiphol Airport opens in 2003, airport capacity (the possibility of building a new airport in the North Sea has been assessed as an option) and the decentralisation of regional airport policy. At present, government policy on regional airports is set out in the Civil Aerodromes Structure Plan. This ceases to be valid in 2003 as current developments have necessitated a review of policy.
Under the recently revised Aviation Act, the Netherlands Antitrust Authority (NMA) will shortly take over responsibility for the supervision of airport charges. It is expected that these will operate under a dual till basis.
J. 3 Airport Ownership Policy
The Dutch government and the Municipalities of Amsterdam and Rotterdam currently jointly own Amsterdam Airport Schiphol. There have been discussions since the early 1990s about the possible privatisation of Amsterdam Schiphol Airport. Hitherto, government policy has
Air Transport Group, School of Епдпееппд, Cranfield University NLD-1

Competition between Airports and the Application of Sfare Aid Rules Volume II ~ Country Reports Netherlands
been that the airport would be sold through an IPO of not f ļore than 49% of total equity by 2001-2002.
Although much of the legal/regulatory framework for this some legal and political hurdles in respect of the necess; remains to be seen whether the new Dutch government process.
Rotterdam and Lelystad airports are 100% owned ani Amsterdam Airport Schiphol. As far as the other Dutch ré¡ legislation was drafted in 1997, which outlined their fin Central Government. This legislation was designed to ei and the possibility that some regional airports e.g. Maastrii the future either through a trade sale or through a strat operator.
1.4 Air Service Agreements
Air Service Agreements within the Netherlands are under í Although Dutch aviation policy is designed to liberalise rol in practical terms it is unlikely that services from Dut) destinations would be financially viable in the near future.
now established, there are still reform of the Air Code. It
proceed with the privatisation
iindhoven is 50% owned by Į>nal airports are concerned, new
financial relationship between surage financial self-sufficiency -Aachen might be privatised in
Sc alliance with another airport
ι jurisdiction of the DGC A-NL. networks with third countries, regional airports to non-EU
7.5 Public Service Obligation (PSO) Routes
The Netherlands has no Public Service Obligation routesjlļļklthough some discussions took place several years ago when KLM discontinued its flights ffIom Groningen (Eelde) airport to Amsterdam for slot-related reasons.
NLD-2 Air Transport Group, School of Engineering, Cmifield University

Competition between Airports and the Application of State Aid Rules Volume II ~ Country Reports Netherlands
Airport Traffic Statistics
Passenger traffic levels at the main Dutch airports are shown in the table below:
Annual Traffic Levels - Selected Airvorts -The Netherlands - 2001 and 2000
Amsterdam Schiphol
Rotterdam
Groningen-Eelde
Maastricht
Eindhoven
Passengers (000)
2001
40,811
827
n/a
n/a
279
Passengers (000)
2000
39,607
776
112
384
341
ATMs(OOO) 2001
432
93
n/a
n/a
18
ATMs(OOO) 2000
432
114
n/a
n/a
23
Sources - AAS & ACI Europe
In terms of cargo traffic, AAS is the only significant airport, handling 1,1183,203 tonnes in 2001 (a decline of 3.2% in comparison with 2000). The airport is the fourth largest cargo hub in Europe.
Air Transport Group, School of Engineering, Cranfìeld University NLD-3

Competition between Airports and the Application of State Aid Rules Volume II ~ Country Reports Netherlands
Airline Market
3.1 KLM
KIM and its subsidiary/alliance partner airlines, Martinair, low-cost airline Buzz and Northwest Airlines, represent soi main airport, Amsterdam Airport Schiphol. Some restra« has taken place in the past two years with the loss of Euri
¡
China Southern into the grouping. This has influenced Kli patterns at AAS.
3.2 Other Carriers
savia, KLM Cityhopper, the 170% of passenger traffic at the ag of the KLM Wings' alliance ags and the entry of MAS and own route network and traffic
Other major carriers operating within the Dutch market iMude Lufthansa, British Airways and the low-cost operator, EasyJet, which moved from 1Ó|| position in 2000 to 4th position in 2001 m terms of total passenger traffic at AAS.
The major Dutch charter operators are Dutch Bird and registered carrier, Hapag Lloyd is also a key player.
Holland, although the German-
NLD-4 Air Transport Group, School of EngineeringMranMd University
Competition between Airports and the Application of State Aid Rules Volume II ~ Country Reports Netherlands
4 Airņoris
Amsterdam Schiphol
1 Ownership and Organisational Structure
Amsterdam Airport Schiphol is owned and operated by the Schiphol Group (N.V.Luchthaven Schiphol). The issued share capital is EUR 77.7 million.
The current shareholders in the group are the State of the Netherlands (75.8%), the City of Amsterdam (21.8%) and the City of Rotterdam (2.4%), although these proportions would change as a result of the planned IPO.
The Schiphol Group is organised m a number of busmess areas including Aviation (covering airport operations). Consumers (retail and other concessions), Schiphol Real Estate and Alliances and Participations (overseas interests). An Executive Board and a Board of Supervisory Directors manage it. The latter has several representatives appointed by the three shareholders.
2 Τψβ of Airport
Amsterdam Airport Schiphol is a major European international passenger and cargo gateway. Transfer passengers represent a high proportion of total traffic (42.1% in 2001). The national carrier KLM carries some 70% of all airport passengers. Despite some slot and noise constraints, the airport also operates as a significant EU regional hub and is the main Dutch charter airport.
3 Route Structure and Key Airlines
Amsterdam Airport Schiphol serves over 200 destinations in nearly 90 countries worldwide representing the fourth widest route network amongst EU airports in terms of destinations and service frequencies. KLM and its partners in the Wings Alliance (including Northwest, MAS and China Southern) dominate the market, although their route networks were restructured following the withdrawal of Alitalia from the group. The London-Amsterdam route is one of the busiest in the EU, and traffic levels have been boosted by the introduction of the low-cost carrier, EasyJet. EasyJet have recently also commenced services to Geneva and Barcelona. Two key Dutch charter operators. Martinair and Transavia, also operate services on behalf of KLM.
Air Transport Group, School of Engineering, Cranfield University NLD-5

Competition between Airports and the Application of Stete Ad Rules Volume II ~ Country Reports Netherlands
Catchment Area
About 80% of all origin/destination passengers are trav¡ Randstad area (represented by a ring of cities including Rotterdam Delft and Utrecht). About 40% of this traffi« airport has good road and rail connections with most parts destination and frequency, is normally the first choice of areas of the Netherlands and northern Belgium.
Competitive Airports
J
Amsterdam Airport Schiphoľs main competitors are Fra major mtercontinental and transfer traffic, although Bruss limited range of intercontinental routes, particularly for ό| southern part of Amsterdam's Airport's catchment area.
ig to or from the so-called terdam, Leiden, The Hague,
iriginates in Amsterdam. The ie country, dependent on flight )ort for people living in most
and London Heathrow for competes on European and a -destination traffic within the
Current and Future Investment Plans
The principal investment projects are the construction of t i l fifth runway (EUR 91.8 million in 2001) and improvements to airport security (EUR 241 million), the baggage handling system (EUR 12.7 million) and fire safety (EUR IS.sļļļļļnillion). The fifth runway is scheduled to be completed by November 2002.
All infrastructure investment is funded by internal generagli funds or by normal commercial loans.
7 Airpo Charges
Airport charges at Amsterdam Airport Schiphol consisfj of aircraft take-off" and landing charges, parking fees and passenger service charges. Th the use of less noisy aircraft. Airport charges were m
decrease is planned in 2002 as a result of current mark! change is due to be introduced during this year.
8 Financial Performance
is a rate differential to encourage sed by 3.5% in 2001, although a
Icoriditions. An aviation security
Schiphol Group's net profit rose to EUR 183 million m 2001, despite limited passenger growth, declining cargo volumes and the overall impact |§¡f September 11. The return on net assets (RONA) was 8.6%.
In view of the prevailing market conditions, the Gró| growth and a number of short-term projects (e.g. a ter
is now focussing on sustainable extension and the construction of
NLD-6 Air Transport Group, School of Engineeringsmranfield University

Competition between Airports and the Application of State Aid Rules Volume II ~ Country Reports Netherlands
a new pier) have been put on hold. Longer term projects such as the construction of a fifth runway and improved baggage facilities are proceeding according to schedule. Schiphol Group's financial performance in 2001 is summarised below:
Schiphol Group - Annual Accounts - Financial Years 2001 & 2000
Balance sheet
Fixed assets
Current assets
Total assets
Shareholders' equity
Minority interests
Provisions
Long-term liabilities
Current liabilities
Total liabilities
Profit and loss account
Operating income
Operating charges
Operating profit
Net profit
2001 -EUR (000)
2,617,682
150,258
2,845,152
1,778,450
7,530
127,474
394,073
537,625
706,051
494,796
211,255
182,805
2000-EUR (000)
2,283,760
187,373
2,471,133
1,543,717
7,330
134,129
382,085
403,872
646,530
458,224
188,306
143,745
9 Sources of Funding
The Schiphol Group is financially self-sufficient and finances its infrastructure development through internally generated fimds and normal commercial loans, including a recent Euro Medium Term Note Programme generating some EUR 500 million. There are no financial guarantees available through the Dutch government.
Although the main Amsterdam Airport has operated at a profit for several years, it is not clear from the available financial reports and other information as to whether this has been used to cross-subsidise the smaller regional airports in the group (Rotterdam, Eindhoven and Lelystad).
Air Transport Group, School of Engineering, Cranfield University NLD-7

Competition between Airports and the Application of State Aid Rules Volume II ~ Country Reports Netherlands
Rotterdam
1 Ownership and Organisational Structure
Rotterdam Airport is currently 100% owned and operated) the airport land is owned by the Municipality of Rotterdia Group. In November 2001, the Netherlands government : which included stringent nighttime flying time restrictio| negotiated for airside land and a 50-year lease for other airpc
the Schiphol Group although and is leased to the Schiphol
ķotiated a new operating licence, A new 99-year lease was
land.
2 Type of Airport \
The airport is a relatively small regional airport offering routes by mainly by smaller regional airlines. There is charter flights. Currently there are no low-cost services froi
3 Route Structure and Key Airlines
The airport operates a range of EU scheduled and chļ Alicante, Antwerp, Birmingham, Gerona, Guernsey, Hamţ Manchester. Key airline operators include KLM City Hot Iberworld, Dutchbird and Trans Travel Airlines.
limited range of scheduled EU sizeable programme of summer [the airport.
Iter flights including services to rg, Jersey, London, Malaga and ¡r, VLM, Transavia, Air Europa,
4 Catchment Area
Rotterdam Airport is situated to the west of Rotte i
Rotterdam/The Hague/Delft/Dordrecht conurbation ré community within the Netherlands and some routes are gea
Competitive Airports
The main competitive airport is Amsterdam itself due t | routes and service frequencies. Potentially there could als Antwerp Airport to the south and from Eindhoven to th| commenced a limited low-cost service between Emdhover
Current and Future Investment Plans
km towards The Hague. The resents an important business
towards this type of traffic.
the significantly greater range of | be some limited competition from southwest. (Ryanair has recently id London Stansted).
As a small airport, infrastructure investment has been reiitively limited. In 1991, however, the main airport departures hall was renovated and rė-lpened at a cost of some EUR 14
NLD-8 Adr Transport Group, Schod of Engineering, franffe/d University

Competition between Airports and the Application of State Æd Rufes Volume II ~ Country Reports Netherlands
million. There are plans to develop some 100,000 sq metres of commercial offices in front of the main terminal building.
7 Financial Performance
As indicated above, the Schiphol Group's annual accounts do not show a breakdown by individual airports within, so it is not possible to comment on this.
Air Transport Group, School of Engineering, Cranfield University NLD-9

I Competition between Airports and the Application of State Aid Rules Volume II ~ Country Reports
Portugal
PORTUGAL (PRT)
1 Government Policy
1.1 Organisational structure
Portugal's airports are owned by the state. A 100% state-owned pic, ANA (Aeroportos S.A.), operates the three airports of mainland Portugal (Faro, Lisbon and Porto), and four airports in the autonomous region of the Azores (Flores, Horta, Ponta Delgada and Santa Maria). The regional government and the regional airline operate the remaining Azorean airports, except m the case of Terceira that is operated in co-operation with the Portuguese air force. ANAM, a company formed by the Portuguese state, ANA and the regional government of Madeira operate the airports of Funchal and Porto Santo, in the Madeira archipelago.
NAVEP provides air navigation services within Portuguese air space and over a large section of the southern part of the North Atlantic.
1.2 Regulatory environment
Airport charges are proposed annually by ANA and subject to the approval of government, advised by ШАС (National Institute of Civil Aviation). The structure of user charges is similar for all ANA airports, but there are differences in the level of charge. INAC (the Portuguese Directorate of Civil Aviation) is the regulatory body covering licensing and technical regulation.
./. 3 Airport ownership policy
There is some discussion on possible privatisation in 2003 or 2004. If privatisation were proposed, it is not known as to what legislative changes would be required. In any case, should construction of the new Lisbon airport be given the go-ahead, the new airport company would be separate from ANA and, at least in part, in the private sector.
1.4 Air Service Agreements
Airlines from EU countries may freely operate air transport services in the EU and may themselves determine the fares they wish to charge. Portugal signed an Open Skies agreement with the USA in 2000. For most countries, Lisbon is the designated point of entry for Portugal.
Air Transport Group, School of Engineering, Cranfíeld University PRT-1

Competition between Airports and the Application of Sfare Aid Rules Volume II ~ Country Reports Portugal
1.5 Public Service Obligation (PSO) routes
PSOs are imposed on 10 domestic routes withm Pertugi ι
mainland (Lisbon, Porto) with airports in the Azores archi] Horta, Terceira) located 1400km west of the mainland in PSOs linking both Lisbon and Porto with Funchal in the PSO linking Funchal with Porto Santo (also in the Madei mainland PSO that links Lisbon with Villa Real and Brag imposed on services between Ponta Delgada (Azores) and Portugal account for 36% of domestic flights and 39% of doj
Four of these routes link the [lago of islands (Ponta Delgada, Atlantic Ocean. There are two
Ideira archipelago and a further | archipelago). There is also one
in the North. PSOs are also ichal (Madeira). PSO routes in
Jestic seating capacity.
There is also a network of intra-island services in the Azoj within a PSO framework.
s, which are subsidised, but not
The total subsidy awarded in 1999 was £16.9 million. these routes in 1999 was 1.4 million. PSOs are issued, ad Aviation Administration of Portugal (INAC).
total number of passengers on ļistered and financed by the Civil
PRJ-2 Air Transport Group, Schod of Engineering, ČMnfíeld University
I

Competition between Airports and the Application of State Aid Rutes Volume // - Country Reports Portugal
Airport Traffic Statistics
Passeneers (Tkousandsí on commerciai fliehts
Airport
Faro
Funchal
Lisbon
Ponta Delgada
Porto
í 999
Dom./ Transit
348
997
215
544
987
Int.
4 176
905
6 553
81
1846
Total
4 524
1902
8668
625
2 833
2000
Dom./ Transit
406
1057
2 356
577
987
int.
4 306
963
7040
105
1951
Total
4 712
2 020
9396
682
2 938
Sources: Various
Commercial Aircraft Movements (Thousands)
Airport
Faro
Funchal
Lisbon
Ponta Delgada
Porto
Í999
Sched. & Charter
29.8
21.1
102.0
8.5
ΑΛΛ
Other Commercial
m
0.0
1.2
0.1
1.7
Total Commercial
29.8
21.1
103.2
8,6
42.9
2000
Sched. & Charter
31.4
19.7
103.4
8.8
40.4
Other Commerdai
0.1
0.0
2.1
0.0
2.9
Total Commercial
31.5
19.
105.5
8.8
43.3
Sources: Various
Freight and Mail (Thousands of tonnes)
Airport
Faro
Funchal
Lisbon
Ponta Delgada
Porto
f999
Freight
2.2
6.8
97.0
7.9
34.3
na
2.5
11.8
1.7
0.6
Total Cargo
2.2
9.3
108.8
9.6
34.9
2000
Freight
2.6
6.4
104.3
7.5
40.8
Май
na
2.1
11.4
1.7
0.3
Total Cargo
2.6
8.5
115.7
9.2
41.1
Sources; Various
Air Transport Group, School of Engineering, Cranfíeid University PRT-3

Competition between Airports and the Application of State Aid Rules Volume II - Country Reports Portugal
Airline market
3.1 TAP Áir Portugal
TAP serves destinations in Europe, Africa, North Central & Į by a number of destinations operated in code share). TAPi 19 September 1946, linking Lisbon and Madrid under its oij Portugueses (TAP). The airline began domestic services TAP was nationalised in 1975 and became a Sociedade Ariel 1991.
3uth America (ftirther increased Portugal began operations on
banner Transportes Aéreos [947 and joined IATA in 1948.
(public limited company) in
3.2 Portugalia PGA
PGA operates scheduled international and domestic flights Iom Lisbon. Destinations include Barcelona, Basle, Bilbao, Cologne, Mulhouse, Marseille,; fjpro, Lyon, Madrid, Manchester, Milan, Munich, Nice, Porto, Stuttgart and Turin.
Although PGA was established as a joint-stock company ļļii 25th July 1988, the airline did not start operating until 1990 due to a delay market libe with scheduled domestic and international charter flightsj were not permitted under Portuguese legislation. commenced in June 1992, from Lisbon and Porto.
isation. PGA started operations ks scheduled international flights theduled International services
Щ I Portugalia initially planned to float on the Lisbon Stock raise money to expand the airline, but in July 1999, Poi Espirito Santo, announced it intended sell 42% of European Commission (EC) regulators then launched citing possible negative effects on local market comp controlled 34% of rival Portuguese carrier TAP. In Ai withdraw from the deal.
3.3 SATA Air Azores
SATA operates scheduled passenger, cargo and mail (including Corvo, Flores, Graciosa, Faial, Pico, Sao Terceira). It has its own maintenance services, which ari has handling services in all Azorean airports assisting i also the management of four regional airports.
Established in 1941, the company changed its name t scheduled flight on 15th June that year. Having been ini it was transformed into a state owned company in 1980.
Ixchange by the end of 1998, to (igalia's main share holder Grupo
to Switzerland's SAirGroup. ivestigation into the transaction,
MI given that SAirGroup already ist 2000 SAirGroup decided to
jrvices in the Azores archipelago el, Santa Maria, Sao Jorge and
AR 145 compliant. The company own flights, other companies and
5ATA in 1947 and made its first ¿ted as privately owned company,
PRT-4 Air Transport Group, School of Engineeringi franffefcf University

Competition between Airports and the Application of State Aid Rules Volume II ~ Country Reports Portugal
3.4 SATA International
SATA International is a wholly owned, independent subsidiary of SATA Air Açores, created for the international charters market. SATA International operates regular charters to Funchal, Porto, Faro and Lisbon, and has operated to other destinations in Europe. SATA International was first incorporated in December 1990 under the name of OceanAir, and in 1991 was authorised by the Secretary of State of Transportation to perform air transportation services as a non-scheduled carrier. After three years of operation it suspended its operation in 1994. SATA Air Açores became the major shareholder and later on became the owner of 100% of the capital stock.
In February 1998 the name of the company was changed to SATA International and the capital stock increased. The company was authorised on April 8th 1998 to perform both scheduled and non-scheduled domestic and international air transportation services. SATA Air Azores has made a cession of its charter division to its subsidiary SATA International who started operating two 737-300s in domestic and international European routes. Following its bid on a public tender, SATA International was awarded Lisbon / Ponta Delgada / Lisbon, Porto / Ponta Delgada / Porto and Funchal / Ponta Delgada / Funchal routes'from 1st January 1999 to 31st December 2001. SATA International now operates 3 Boeing 737-300S and one Airbus A310-300 dry-leased.
Air Transport Group, School of Engineering, Cranfíeld University PRT-5

Competition between Airports end the Application of State Aid Rules Volume II ~ Country Reports Portugal
4 Airports
Lisbon
J Ownership ami organisational structure
Lisbon airport is 100% owned by the national government on possible privatisation in 2003 or 2004. If privatisation wj what legislative changes would be required.
Airport services such as police and security are provided TAP, the other majority owned by ANA) provide passengei responsible for car parking and concessionaires are involļ free. The state air traffic sendees provider provides ATC »
Corporate objectives are: growth of total turnover development of demand; improvement of service qi development of non-aviation business; development o | motivation and qualification of human resources.
though there is some discussion proposed, it is not known as to
the state. Two companies (one id ramp handling. The airport is
also in car parking and duty ces.
reinforcement of profitability; ty; productivity development;
an international presence; and
ANA is also a shareholder in other airport groups and airpq|ļ-related companies including:
Shareholder in Macau airport (49%) Shareholder in Madeira airports (ANAM) 70% Co-operative arrangement in East Timor Shareholder in Port-Way (handling Company) (№/Ą Shareholder in NAER (new Lisbon airport compańp 80%
Note that ANAM is not profitable, as it receives no si||ļsidy although the airlines serving ANAM airports do receive a subsidy.
Environmental issues currently have some impact with the 14 May 2002 and Faro airport (same ownership gri 0600 hrs.
2 Type of airport
Lisbon is the international gateway airport for Portug Portugal and Portugalia operations. The principal tr¡ domestic and international together with cargo. The chi
pter 2 aircraft being banned from p) is closed between midnight and
and the home base for TAP Air markets are those of scheduled
br market is not strong at Lisbon as
PRJ-6 Air Transport Group, School of EngineennmEranfìeld University

Competition between Airports and the Application of Stete Aid Rules Volume II ~ Country Reports Portugal
most travellers use scheduled airlines. The low-cost airline market has started to develop with services by Go (now part of the easyJet Group) to Faro from the United Kingdom.
Annual Traffic Data for January - December 2000
Domestic flights
ļ Terminal Passengers (arrivals)
| Terminal Passengers (departures)
Į Transfer Passengers
Į Transit Passengers
| Cargo (tonnes - inbound)
Cargo (tonnes - outbound)
ATMs (arrivals+departures)
Aircraft movements (arrivals + departures)
In
Scheduled
1 041 877
1 106 301
na
na
11 333
6 297
na
23 956
Charter
11686
13 454
na
na
348
15
na
725
Total
1 053 563
1119 755
na
na
11681
6 312
na
24 681
(*) only commercial movements (not including GA)
Į International flights (Intra EU)
Terminal Passengers (arrivals)
Terminal Passengers (departures)
Transfer Passengers
Transit Passengers
Cargo (tonnes - inbound)
Cargo (tonnes - outbound)
ATMs (arrivals+departures)
Aircraft movements (arrivals + departures)
in
Scheduled
2 353 001
2 326 772
na
na
14 255
24 373
na
58 241
Charter
144 636
143 742
na
na
366
2 622
na
4 301
Total
2 497 637
2 470 514
na
na
14 621
26 995 ļ
na I
62 542
International flights (non-EU)
Terminal Passengers (arrivals)
Terminal Passengers (departures)
Transfer Passengers
Transit Passengers
Cargo (tonnes - inbound)
Cargo (tonnes - outbound)
ATMs (arrivals+departures)
Aircraft movements (arrivals + departures)
Π
Scheduled
963 995
926 712
na
na
22645
13 471
na
16 668
Charter
90118
91 430
na
na
1307
7 221
na
1612
Total Į
1054113 |
1 018 142 ļ
na
na
23 952 |
20 692 |
na
18.280
Air Transport Group, School of Engineering, Cranfìeld University PRT-7

Competition between Airports and the Application of State Aid Ruies Volume II - Country Reports Portugal
3 Route structure and key airlines
Most routes and markets are dominated by TAP Air Portugal and Portugalia as can be seen from the following Table.
Traffic type
Scheduled domestic
Scheduled intra-EU
Scheduled international (non-EU)
Charter intra-EU
Charter international (intra-EU)
Cargo (all)
hairline
TAP
TAP
TAP
CORSE A.
TRANSAT
TAP
%
64
34
42
8
11
49
2nd airi nļļļ
PGA
PGA
SWISS/j ||
HELIAV |
CAN. 3 ip
BCS ||
%
22
21
12
8
8
8
3rd airline
SATA INT.
IBERIA
REG. A. L
TAP
PGA
Volare
%
9
8
8
7
7
4 Catchment area
The catchment area for different market segments, expresse! minutes driving time, is shown in the following Table.
ι terms of passengers within 60
Traffic type
Scheduled domestic
Scheduled international (origin / destination)
Scheduled intematipnal (transfer)
Charter international
Cargo (origin / destination)
Cargo (transfer)
— m ļļlparcnmenr area
70%
j
ll 50%
I 5%
50%
| 80%
III 10%
The passenger catchment area is measured by survey.
Competing airports
The principal competing airport is Madrid, located 600 kņļļ lo the east. Madrid competes with Lisbon in all market segments m as much that the formei Jean offer additional routes, more choice of airline and increased flight frequencies. Lowffost carriers also operate out of Madrid.
The second competing airport is Porto, located 300 km scheduled market segment by offering additional routes.
6 Current and future investment plans
the north. Porto competes in the
There have been no major investment programmes over file last five years (1996 - 2001) as construction of the new airport has been a question not if but when. This position is likely
PRT-& Air Transport Group, School of EngineenhgĄmranfield University

Competition between Airports and the Applicathn of State Aid Rules Volume II ~ Country Reports Portugal
to continue at the existing airport for the future. Should the new airport be constructed then 80% of the funding will come from private investment and 20% from government.
The existing airport is located close to the city and access to the airport is primarily by car, taxis and bus. Surface transport and airport access is not ANA responsibility as far as support funding is concerned.
Investment in surface transport for the new airport will depend on the new airport company. Since the location of new airport is 35km from Lisbon, it is assumed that the airport will be connected to the city by rail link.
7 Airport charges
The airport authority charges for take-off, landing, passenger service, aircraft parking, air bridges and night ffights. Security is the responsibility of the INAC and police whereas ANA are responsible for the equipment and maintenance. In more detail, take-off and landing charges are based on aircraft MTOW. The passenger service charge is a fonction of passenger numbers and destination. Aircraft parking charges are according to aircraft MTOW and duration of parking period. Air bridge charges are according to duration of docking operation. Night flights attract a fixed fee.
Airport charges are proposed annually by ANA and subject to the approval of government, advised by INAC (National Institute of Civil Aviation). The structure of user charges is similar for all airports, but the levels of charges are slightly different.
However, it has been proposed to introduce discounts for landing and take-off charges at Porto in order to attract traffic from Lisbon. There are no new route or volume discount charges, the latter being dropped recently as it was seen to favour Portuguese airlines.
8 Financial performance
Depreciation policy varies with asset, as below:
Terminals and buildings Runways, taxiways and aprons Plant and machinery Terminal / airport systems Vehicles Office equipment Computer software
Straight line Reducing balance Reducing balance Reducing balance Straight line Straight line Straight line
The summary profit and loss account for Lisbon airport is shown
50 years 20 years 5 - 8 years 5 - 8 years 3 - 8 years 8 years 3 years
in the following table.
Air Transport Group, School of Engineering, Cranfield University PRT-9

Competition between Airports and the Application of State Aid Rules Volume II ~ Country Reports Portugal
Summary of Profit and Løss AccounWEuros)
Уеаг
Aeronautical income
Concession income
Other income
Total income
Staff costs
Security costs
Policing costs
Depreciation
Other costs
Total costs
Operating profit
Interest received
Interest paid
Extraordinary items
Pre-tax profit
1998
46 719 980
22 120 170
27 733 103
93 573253
12 930 035
na
na
22 558 093
16 313113
51 801 241
41 772 013
95 206
40 587
-584 706
41 241 925
f88j I
52 80
19 29
27 55
99 65
13 39
24 80
17 70(
55 90
43 75
ë 5
-1531
42 22
4 ķ>o
21
J 9 8 \l9
97
Ina
Ina
Ì04 f ho f12
p07
Й20
¡'983
i r8 4
1860
2000
63 010 077
17135 873
25 086 964
105232 913
17 663 496
na
na
26 985 576
18 331 890
62 980 963
42251950
32 686
58 040
-655 716
41 570 881 |
Total costs do not include overheads, for example the AŅ taxation. The government meets security and policinį centralised. Only the gross part of interest can be seen oii rate corporation tax is paid at 35%.
9 Sources of funding
general headquarters and general ists. Financial management is
ie corporate statements. Standard
During the period 1996 - 2001, TEN-Т external funding studies:
TEN-T 1997 Lisbon Airport: Expansion Studies: TEN-T 1997 New Lisbon Airport: Location Studil TEN-T 1998 Nova Aeroporto da area metropolita TEN-T 1998 Aeroporto de Lisboa (ALS) Phase 2,|] TEN-T 1999 Aeroporto de Lisboa (ALS): Expansi TEN-T 2000 Lisbon Airport: Capacity Expansion, TEN-T 2000 Nuevo Aeroporto de Lisboa Phase з( TEN-T 2001 Plano de Contingencia do Aeroportjc
is been received for the following
isel,€1.2m Phase 1, €0.74m de Lisboa Phase 2, €1. lm
11.7m Studies Phase 3, €1.75m
|1.0m 2.0m le Lisboa, €2.0m
There is no information about external funding for the peiffd 2002 to 2011 although it is expected that such funding will be required for the constrfftion of the new Lisbon airport.
PRT-10 Air Transport Group, School of Engineeringimranfìeld University
Competition between Airports and the Application of State Aid Rules Volume II ~ Country Reports Portugal
10 Public fimding issues
None at the present time.
Air Transport Group, School of Engineering, Cranfield University PRT-11

Competition between Airpotts and the Application of State Aid Rules Volume H ~ Country Reports Spain
SPAIN (SPA)
1 Government Policy
I.J Organisational structure
The public entity Aeropuertos Españoles y Navegación Aérea, Aena, was created according to Article 82 of the Law 4/1990, 29 June, National Budget 1990. Aena takes the shape of a public law entity attached to the Ministry of Development. Aena is in charge of the civil airports and air navigation being allowed to develop related activities in order to achieve profitability. Aena manages 43 airports including the major international airports of Madrid Barajas, Palma de Mallorca and Barcelona. Many of the airports serve the in-bound charter market. Madrid Barajas is a domestic and international hub being the home base of the national carrier Iberia.
The financial performances (profit and loss account) of individual Aena airports are not published. The Table below shows only annual Group details including ATC, airports and other investments. Aena enjoys lull financial autonomy apart from the need for State approval of its budget.
Summary Profit and Loss Account (Million Euro)
Year ending
Aeronautical income
Concession income
Other income
Total income
Staff costs
Security costs
Policing costs
Depreciation
Other costs
Total costs
Operating proñ
Interest received
Interest paid
Extraordinary items
Pre-tax profit
Taxation
Net profít
2000
587.1
332.8
517.8
1437.8
505.1
na
na
na
na
1240.6
205.6
na
na
na
164.1
55.9
708.2
f999
547.9
296.2
405.8
1249.9
420.7
na
na
na
na
1107.1
147.3
na
na
na
139.3
na
na
Air Transport Group, School of Engineering, Cranfíeld University SPA-1
I

Competition between Airports and the Appfication of State Aid Rules Volume II ~ Country Reports Spain
Through its daughter company, Aena Desarrollo Intemacio||l S.A, Aena has several shares outside Spain:
38% of ACS A, the Barranquilla airport operator, in Ç lumbia 40% of SACSA, the Cartagena de Indias airport op« or, in Columbia 33.34% of AeroCali SA, the Cali airport operator, in olumbia 25.5% of AMP SA, the Pacific Airports operator in 'Ęjpcico (12 airports)
1.2 Regulatory environment i
DGAC (Dirección Generale de Aviación Civil) is the Deņiļ ment of the Transport Ministiy (Ministerio de Fomento) that manages and plans the Civil 1 dation Policy, including Airport policy and Regulation. The objective of DGAC is to guarajļ ee safety, efficiency, quality and profitability in Air Transport.
Government National Law or Decree ratifies airport d operates a national airport network, airport charges have n
There are no traffic distribution rules.
fes. It is believed that, as Aena apact on airport competition.
1.3 Airport ownership policy
Aena is 100% owned by the Spanish government and futui | privatisation plans are not on the agenda. However, it is planned to split the Air Navigation id Airport Divisions into separate divisions / public companies. The stated corporate objectij }s for Aena are that 'Aena should be an instrument for regional cohesion and social integration
1.4 Air Service Agreements
Airlines from EU countries may freely operate air traņiļļort services in the EU and may themselves determine the fares they wish to charge. Sp n has not signed an Open Skies agreement with the USA. At San Sebastian airport there \ ι maximum limit to the number of daily flights, as agreed with France, to minimise the numi r of overflights and environmental impact. For most countries, Madrid Barajas is the designat ļ | point of entry for Spain.
1.5 Public Service Obligation (PSOÌ routes
PSOs have been imposed on 13 routes within the Spanisi fcanary Islands. There are no PSOs on the Spanish mainland; neither are there any linking |he mainland with the Canary or Balearic Islands.
SPA-2 Air Transport Group, School of Engineering,\$į[anfield University

Competition between Airports and the Application of Stete Aid Rules Volume II ~ Country Reports Spain
The regional government of the Canary Islands administers PSOs. The PSO's are based on subsidies to passengers but never to airlines or airports. Nevertheless, the airlines and airports indirectly receive the subsidy by virtue of the service they provide the passenger. No subsidy data is available. The Canary Islands are a major European tourist destination. Traffic levels on the inter-island services are fairly significant, with the busiest route Gran Canaria -Lanzarote handling over 430,000 passengers in 2000. Other busy routes include Gran Canaria - Santa Cruz and Tenerife Norte - Santa Cruz. PSOs in Spain account for 12% of total domestic flights and 5% of total domestic seating capacity. The following table shows a selection of PSO routes with associated annual passenger traffic statistics.
Posseneer traffic in 2000 on intra-Canarv Islands routes
Routes
Gran Canaria - Lanzarote
Gran Canaria -Tenerife Norte
Tenerife Norte - Santa Cruz
Gran Canaria - Fuerteventura
Tenerife Norte - Lanzarote
Tenerife Norte - Fuerteventura
Gran Canaria - Santa Cruz
Passenger Trafík:
431,398
418,461
394,589
371,257
199,855
94,756
90,792
Air Transport Group, School of Engineering, Cranfíeld University SPA-3

Competition between Airports and the Applicaüon of Stete Aid Rules Volume II - Country Reports Spain
Airport Traffic Statistics
Passenęers (Thousands) on comi JUghţş
Airport
Alicante
Barcelona
Bilbao
Fuerteventura
Gran Canaria
Ibiza
Lanzarote
Madrid Barajas
Malaga
Menorca
Palma de
Mallorca
Seville
Tenerife N.
Tenerife S.
Valencia
Dom./ Trans»
1245
9 341
1548
686
2 930
1051
1357
14 214
2150
829
4 441
1550
2149
1556
1365
1999
Int.
4127
8 080
701
2 587
6284
3119
3 407
13 780
6 365
1785
14 577
248
35
7177
615
Total
5 372
17 421
2 249
3 273
9 214
4170
4 764
27 994
8 515
2 614
19 018
1798
2184
8 733
1980
Dcl /
jà ш
į 5
10 ¡6
1 i7
' Γ 3 p4
nb 1 172
ie 99
¡2 79
pi
i U :
'42
í J72
532
556
2000
Int.
4 575
9 352
807
2 656
6 221
3239
3 530
16 094
7158
1871
14 472
374
37
7 304
693
Total
6 010
19 808
2 554
3 467
9 375
4 461
5 002
32 893
9 437
2 772
19 417
2116
2 409
8 836
2 249
Sources: Various
SPA-4 Air Transport Group, School of ¡Engineering,mranfield University

Competition between Airports and the Application of State Aid Rules Volume II - Country Reports Spain
CommerdalAircrañ Movements (Thousands)
Airport
Alicante
Barcelona
Bilbao
Fuerteventura
Gran Canaria
Ibiza
Lanzarote
Madrid Barajas
Malaga
Menorca
Palma de
Mallorca
Seville
Tenerife N.
Tenerife S.
Valencia
fora/ Commercial
1999
44.5
228.9
36.0
28.0
91.3
39.5
43.9
302.7
73.4
24.5
159.8
22.3
33.3
58.3
40.4
Total Commercial
2000
49.2
253.8
40.8
29.8
93.3
46.4
42.7
357.6
83.2
30.2
172.5
26.8
36.5
59.1
44.4
Sources; Various
Air Transport Group, School of Engineering, Cranfield University SPA-5

Competition between Airports and the Application of State Aid Rules Volume II - Country Reports Spain
Freight and Mail (Thousands oftiķnes)
Airport
1 Alicante
Barcelona
Bilbao
Fuerteventura
Gran
Canaria
Ibiza
Lanzarote
Madrid Barajas
Malaga
Menorca
Palma de
Mallorca
Seville
Tenerife N.
Tenerife S.
Valencia
Sources: Varioi
1999
Freight
6.4
86.2
3.6
4.5
42.7
4.8
6.7
294.4
9.6
4.7
27.1
5.2
21.9
11.6
10.4
/s
na
5.0
na
0.3
6.4
0.4
0.2
24.0
0.1
0.4
1.7
0.1
4.5
0.4
na
Total Cargo
6.4
91.2
3.6
4.8
49.1
5.2
6.9
318.4
9.7
5.1
28.8
5.3
26.4
12.0
10.4
Fre, ft
7
ř ρ ' it
№ ! I
! 7
I o
! Γ 3 .0 :
I s
.5
2
p.o
! t-6 i
r l·
r
2000
na
4.0
na
na
5.3
0.3
0.3
26.5
0.2
0.3
2.5
0.2
4.2
0.4
na
Total Cargo
7.7
92.8
4.0
4.5
49.0
5.3
6.7
237.7
10.1
4.8
27.7
6.2
26.7
12.4
10.9
SPA-6 Air Transport Group, School of EngneeringMranfield University

Competition between Airports and the Application of State Aid Rules Volume II ~ Country Reports Spain
3 Airline market
3.1 Iberia
Iberia, Air Lines of Spain, began operations in 1927, providing a service between Madrid and Barcelona and now operates an mtemational scheduled network. In 1999 Iberia joined the Oneworld global airline alliance and was partially privatised; as part of the privatisation process, British Airways and American Airlines bought 10% of Iberia's capital. In November 2000 Iberia began takeover talks with fellow Spanish carrier Air Europa, but the talks collapsed in January 2001.
3.2 Other carriers
Air Europa is the operating title of Air Espafta. The airline specialises in inclusive-tour services between Northern and Western Europe and holiday resorts in the Canary and Balearic Islands. The airline also operates domestic scheduled flights and long haul scheduled services to North America and the Caribbean. Air Europa became active in 1986 as part of the Airlines of Europe Group. In January 1998 they signed a franchise agreement with Iberia. In 1999 KLM agreed to purchase equity in the airline, which would have become part of the stillborn Alitalia-KLM alliance. In April 2000 the Alitalia-KLM merger failed and in November 2000 Air Europa entered negotiations to be taken over by fellow Spanish carrier Iberia, but in January 2001 the talks collapsed.
3.3 Spanair
Spanair operates passenger services to destinations in Europe, the US, Argentina and Brazil. Its network links over 100 cities in Europe to the Spanish Archipelagos. Established as a joint venture between SAS and Teinver SA in December 1986, Spanair began operations as a charter airline at the end of March 1988 using a McDonnell Douglas MD-83. Long haul flights to the USA, Mexico and Dominican Republic were launched in 1991 after the airline introduced two Boeing 767s to its fleet. February 1994 saw the start of domestic scheduled flights and the launch of Spanair's own handling services. In addition, new scheduled services to London, Copenhagen and Havana were launched in 1997. Spanair's first intercontinental scheduled flights began in November 1997 with services between Madrid and Dulles International Airport in Washington.
Mr Transport Group, School of Engineering, Cranfíeld University SPA-7

Competition between Airports and the Application of Sfare Aid Rules Volume II ~ Country Reports Spain
Airports
Girona
1 Ownership and organisational structure
The airport is owned by Aena who are 100% owned by responsible for ATC, police, passenger handling and undertake ramp handling and concessionaires are responsiblJfbr duty-free
Spanish government. Aena is parking. Private companies
There are no environmental issues at present but there may
2 Type of airport
in the future.
Girona is primarily a charter airport serving the northeast; ffpast of Spain between Barcelona and the French border.
Annual traffic data for 19l
Domestic flights Terminal Passengers (arrivals) Terminal Passengers (departures) Transit Passengers Cargo (tonnes - inbound) Cargo (tonnes - outbound) Aircraft movements (arrivals + departures)
Scheduled 1510
923 34 32 3
158
International flights (Intra EU) Terminal Passengers (arrivals) Terminal Passengers (departures) Cargo (tonnes - inbound) Cargo (tonnes - outbound) Aircraft movements (arrivals + departures)
Scheduled 28 974 26 217
118 41 I
558 |
I | Charter I 1457 I 1547 ! I 425 ! I
" 148
Total 8 676 8 061
584 32 3
5104
I Charter 264 815 250 884
13 5
I 738
Total 296 072 279 707
131 46
2 581
111 International fíghts (non-EU) Aircraft movements (arrivals + departures)
Scheduled 11 !
ļ | Charter | 2 632
Total 2 829
3 Route structure and key airlines
The principal traffic segment is inbound tourism whether m scheduled or charter carrier. This is demonstrated by the dominant airlines that include Нащк Lloyd and Aero Lloyd (German-based charter); Britannia, Airtours and Flying Colouff (UK-based charter) and British Airways / easy Jet / Finnair (scheduled services).
SPA-8 Air Transport Group, School of Engineering, mranfíeld University

Competition between Airports and the Application of State Aid Rules Volume II ~ Country Reports Spain
Catchment area
The airport serves a major vacation area of Spain (Costa Brava) and therefore much if not most of the traffic is inboimd tourism. In this case the catchment is not the hinterland of Girona but the principal tourism markets of UK and Germany. Most domestic market travellers will head for Barcelona where there is a much wider range of services includmg the shuttle link to Madrid Barajas.
5 Competing airports
Main competing airport is Barcelona, located 100 km to the south, primarily for the low-cost and domestic market segments. It is assumed, but not confirmed, that there is cross-border competition with French airports primarily for inbound tourism to the border regions. Another way at looking at competition is to consider holiday charter airports, where the charges, facilities and services offered by the airport form part of the marketing package offered by the region. For example, the airports of the Balearics (and Canaries) could be considered to be in competition with those of airports at other Mediterranean tourist destinations.
6 Current and future investment plans
Airport investment in the last five years includes:
Electricity power generation, 1999(1.5M€) Terminal extension, 2000 (6.8M€)
Aena funded both of the above projects with no government funding. A number of minor projects are planned for the future including:
Airfield infrastructure, 2002 / 04 (0.7M€) Security, 2002 / 04 (0.16M€) Electricity suppUes, 2002 / 04 (2.4M€) Improvements to terminal building and other misc. investments, 2002 / 04 (10.8M6)
Again, Aena will fund all of these projects (total planned investments for this period total 16M6) with no government funding.
There have been no airport-related surface access construction programmes during the past ten years nor are any planned for the future.
Air Transport Group, School of Engineering, Cranfield University SPA-9

Competition between Airports and the Application of Stete Aid Rules Volume II ~ Country Reports Spain
7 Airport charges
Airport charges melude landing, aircraft pariring, ATC, ailļbridges, security, baggage and cargo handlmg and 400Hz electricity supply. Landing aņjļļ parking charges are based on MTOW, passenger charges apply per departing passenger.
8 Financial performance
Profit and loss accounts for individual Aena airports are h j | published (refer to Section 1.1 for Group accounts). Corporation tax is paid at a standard iwk of 35%.
Current accounting practice is to use straight-line depreciaţi« over the following periods:
Terminal and buildings Runways, taxiways and aprons Plant and machinery Terminal / airport systems Vehicles, equipment
Sources of funding
The Aena Group has access to loans from ЕШ at préférer to both past and future capital investments.
rates (around 5%); this applies
10 Public funding issues
Girona is part of the Spanish airport network administijed by Aena. Funding of airport infrastructure development by Aena is based on an aş||ssment of priorities in terms of capacity and condition; the issues of airport competition dlinot arise and therefore the source of funds, public or otherwise, makes little difference to am aspects of competition between one airport and another.
SPA-10 Air Transport Group, School of Engineering, ¡manfìeld University

Competition between Airports and the Application of State Aid Rules Volume II ~ Country Reports Spain
Ibiza
1 Ownership and organisational structure
The airport is owned by Aena who are 100% owned by the Spanish government. Aena is responsible for ATC, passenger handling and car parking. Private companies undertake ramp handlmg and concessionaires are responsible for duty-free. PoUcing is provided by the State and no service provider is mentioned for security.
There are no environmental issues at present but there may be in the future.
2 Type of carport
Ibiza is located on one of the Balearic Islands, east of Valencia and south of Barcelona, located in the Western Mediterranean. The principal market segments are scheduled domestic services, domestic cargo, and international scheduled and charter flights, as may be seen from the following Tables.
Traffic data for 1999
Domestic flights Terminal Passengers (arrivals) Terminal Passengers (departures) Transit Passengers Cargo (tonnes - inbound) Cargo (tonnes - outbound) Aircraft movements (arrivals + departures)
Scheduled 488 213 491 400
593 3 007
216 15 681
Charter 31 718 25 317 6 519
945 238
4 187
Tota 525 510 522 688
7134 3 952
454 24 865
International flights (Intra EU) Terminal Passengers (arrivals) Terminal Passengers (departures) Transit Passengers Cargo (tonnes - inbound) Cargo (tonnes - outbound) Aircraft movements (arrivals + departures)
Scheduled 399 424 401 242
1 116 293 23
4 377
Charter 1 118 038 1 105 529
11597 103
8 6 516
Total 1 520 251 1 508 191
13 314 396 31
11 914
International flights (non-EU) Aircraft movements (arrivals + departures)
Scheduled 128
Charter 7 375
Tora/ 7 754
Air Transport Group, School of Engineering, Cranfield University SPA-11
Competition between Airports and the Application of State Aid Rules
3 Route structure and key car lines
Airlines operating to Ibiza with the largest market share rei of the airport. Domestic scheduled services are shared bi (27%) and Air Europa (24%). Go and the charter carriers operate services to Ibiza from the United Kingdom. Condoí services from Germany. Iberia (56%) and Swiftair (25%) dpi
Venirne II ~ Country Reports Spain
;t the principal traffic segments ten Iberia (56%), Air Nostrum ritannia. Air 2000 and Airtours
apag Lloyd and LTU operate te the cargo market.
Catchment area
Apart from domestic services the main market segment is i Balearìcs has its own airport and inter-island airport comp were fost efficient connectmg shipping services available therefore, the airport catchment is the island alone for sch< Germany for the inbound tourism market.
5 Competing airports
Taking into consideration holiday charter airports, where offered by the airport form part of the marketing packa: airports of the Balearics (and Canaries also) could be co: those of airports at other Mediterranean tourist destination:
)und tourism. Each island in the ion would only be likely if there roughout the year. Eflfectively, led traffic and primarily UK and
e charges, facilities and services offered by the region then the
dered to be in competition with
6 Current and future investment plans
Airport investment in the last five years includes:
Handling building, 1999 (0.7M€) Car parking, 2000 (0.8M€)
Aena funded both of the above projects with no gove projects are planned for the future including:
Land purchase, 2002 / 04 (4.8M€) Check-in area, 2002 / 04 (4.15M€) Enlargement of passenger terminal, runway consti Aircraft parking area, 2002 / 04 (3.4M€) Car parking, 2002 / 04 (3.6M€) Security, 2002 / 04 (4.2M€)
Again, Aena will fiind all of these projects (total pla 46M€) with no government funding.
lent funding. A number of minor
tion, 2002/04 (13.3M€)
investments for this period total
SPA-12 Air Transport Group, School of Engineering, ¡Wranfíeld University

Competition between Airports and the Application of State Aid Rules Volume II ~ Country Reports Spain
There have been no airport-related surface access construction programmes during the past ten years nor are any planned for the future.
7 Airport charges
Airport charges include landmg, aircraft parking, ATC, air bridges, security, baggage and cargo handlmg and 400Hz electricity supply. Landing and parking charges are based on MTOW, passenger charges apply per departing passenger. The government reviews airport charges.
8 Financial per formance
Profit and loss accounts for individual Aena airports are not published (refer to Section 1.1 for Group accounts). Corporation tax is paid at a standard rate of 35%.
Current accounting practice is to use straight-line depreciation over the following periods:
Terminal and buildings 32 years Runways, taxiways and aprons 20 -25 years Plant and machinery 6-12 years Terminal / airport systems 15-18 years Vehicles, equipment 4-6 years
9 Sources of funding
The Aena Group has access to loans from ЕЮ at preferential rates (around 5%); this applies to both past and future capital investments.
10 Public funding issues
None
Air Transport Group, School of Engineering, Cranfield University SPA-13

Competition between Airports and the Application of State Aid Rules Volume II ~ Country Reports Spain
Modrìd Barai as
J Ownership and organisational structure
The airport is owned by Aena who are 100% owned by A Spanish government. Aena is responsible for ATC, passenger handling and car parking. P lp t e companies undertake ramp handling and concessionaires are responsible for duty-free.! Iblicing is provided by the State and security is shared between the state and specialist securit||pompanies.
There are no environmental issues at present but there may bjflļm the future.
2 Type of airport
Madrid Barajas is the international gateway airport for Sp||ļh and hub for Iberia operations. The principal traffic markets are those of scheduled domffftic, scheduled international and cargo. The charter market is not so strong at Madrid as mo| There is also a significant transfer market mainly involving
Traffic data for 1999
travellers use scheduled airlines. ria and code-sharing airlines.
Domestic flights Terminal Passengers (arrivals) Terminal Passengers (departures)
Transit Passengers Cargo (tonnes - inbound) Cargo (tonnes - outbound)
Aircraft movements (arrivals + departures)
Scheduled 7 030 934 6 887 980
148160 | 25 827 | 55 295 !
149 622 I
i
International mghts (Intra EU) Terminal Passengers (arrivals) Terminal Passengers (departures) Transit Passengers Cargo (tonnes - inbound) Cargo (tonnes - outbound)
Aircraft movements (arrivals + departures)
Scheduled I 4 026 294 3 993 124
59 555 | 36 602 | 26160 79 801 |
j
International flights (non-EU)
! Aircraft movements (arrivals + departures) Scheduled |
19 131
Charter 76 239 66 732
4 929 2 900 4168
I 6 520
Total 7111080 6 959 062
155 317 28 727 59 463
158 563
I | Charter
66 316 72 587
1093 3 637 2 579
| 1754
Total 4 098 973 4 067174
64 053 40 239 28 739
82 289 |
I || Charter
I 560 Total I
19 968 |
SPA-14 Air Transport Group, School of Engineering, franffefcr University

Competition between Airports and the Application of State Aid Rules Volume II ~ Country Reports Spain
3 Route structure and key airlines
The key airlines for the domestic market are Iberia (59%), Spanair (17%) and Air Nostrum (14%), each of which uses Madrid as a hub to serve the other major cities of Spain. Iberia, British Airways, Air France, and the emerging low-cost carriers Go and easyJet, dommate the scheduled mtemational market. Iberia (55%) dominates the cargo market.
4 Catchment area
Defining the Madrid catchment area is rather more complicated than the Balearic airports. Although Aena do not specify catchment areas for individual airports, it is probably reasonable to say that the most of the domestic passengers using the airport live within 120 minutes driving time of the Madrid. One reason is the size of the country and the population distribution and the other airports. Alternative forms of transportation tend to be used by those living in the more remote areas of Central Spain. The mtemational passengers (many of whom will be inbound tourism / business) will either be heading for the Madrid area or transferring to another flight at Barajas. There are a number of permutations and possibilities for hub passengers but the location of Barajas in the centre of the country and its geographical location in Europe make the airport an attractive hub with a large catchment area.
5 Competing airports
Aena's view on airport competition is that there is no competition between Spanish airports because Aena uses the airport network model. However, Barcelona is competing with Madrid for long-haul flights and Madrid is competing with other European hubs for transfer traffic, in particular, long-haul destinations in South and Central America. However, there is no competing airport for domestic scheduled flights.
6 Current andfiiture investment plans
The most important airport construction works that have been completed in the last five years are the enlargement, new distribution and improvement of drainage and water supply networks. These were completed in 2000 at a cost of 9.37 M€. Aena funded the construction works with no government funding. The following construction projects are planned to be concentrated in the period 2002 / 2004:
Air Transport Group, Schod of Engineering, Cranfìeld University SPA-15

Competition between Airports and the Application of State Aid Rules Volume II ~ Country Reports Spain
Date
2002
02/04
02Ю4
02/04
02Ю4
02/04
02Ю4
02/04
Application
Purchase and installation of an automated system for baggage handling
Maintenance of plant and buildings
PLAN BARAJAS: New terminal area
PLAN BARAJAS: Airfields
PLAN BARAJAS: Technology systems
Increase security systems, using new technology
Land expropriation
Radar systems
Amount
8.6Af€
75.8M€
1149.M€
690.6M€
499.8M€
35.2M€
401.5M€
4.6M€
•1 Aeį
Á1 \\\
|rce(s) of funds
i
Ati Αθ i
Ae h
A¿ h
T fr
%Govt funding
None
Nona
None
None
None \
None
None
None
Total planned investments for 2002-2004 will account for 3J |B4 M€ of expenditure.
Surface infrastructure constructed between 1992 and 200|Mlncluded extension of the Madrid Metro to the airport. There does not appear to have been Ipy financial contribution by Aena to this. Future surface infrastructure construction works' iipve been included in the 2002 / 2004 capital investment programme.
bridges, security, baggage and parking charges are based on
7 Airport charges
Airport charges include landing, aircraft parking, ATC, cargo handling and 400Hz electricity supply. Landing MTOW, passenger charges apply per departing passengefl The government reviews airport charges.
8 Financial performance
Profit and loss accounts for individual Aena airports are ¡lot published (refer to Section 1.3 for Group accounts). Corporation tax is paid at a standardllite of 35%.
Current accounting practice is to use straight-line depreciajfpn over the following periods
Terminal and buildings Runways, taxiways and aprons
32 y«
20-: s years
SPA-16 Air Transport Group, School of Engineering, \ anfield University

СотрвОкт between Airports and the Application of Sfafe Aid Rules Volume II - Country Reports Spain
Plant and machinery 6-12 years Terminal / airport systems 15-18 years Vehicles, equipment 4-6 years
9 Sources of funding
During the period 1996 to 2001, Aena have been able to draw on loans from the ЕШ at preferential rates (around 5%). Specific fimding has been for the following:
TEN-T 1997 Madrid-Barajas Airport: Urbanisation and access study, €1.5M TEN-T 1998 Aeropuerto de Madrid / Barajas, €0.9M ЕЮ 2000 Improvement and extension of airport, €480.0 million
In more general terms, in 1997, the European Investment Bank advanced a loan of ECU 68 million to Aena towards funding major improvement works at the airports on Lanzarote and Fuerteventura and both airports on Tenerife. The project includes construction of new passenger terminals and access roads at Tenerife-North, Lanzarote and Fuerteventura airports, a taxiway at Fuerteventura airport and improvement and extension works in one of the passenger terminals at Tenerife-South airport. The EIB's loan will complement the financmg provided by the EU via the ERDF and will attract a 2% interest rebate, the cost of which will be met from the Financial Mechanism of the European Economic Area. In addition, at the request of Spam's Ministty for economic and Financial Affairs, the works at Lanzarote airport received 1,050 million pesetas in grant aid under this Mechanism.
External fimding in the future will continue with loans from ЕЮ at different rates (around 5%)
JO Public fitnding issues
There are no public funding issues at present
Air Transport Group, School of Engineering, Cranfíeld University SPA-17

Competition between Airports and the Application of State Aid Rules Volume II ~ Country Reports Spain
Menorca
J Ownership caid organisational structure
The airport is owned by Aena who are 100% owned byíl¡|e Spanish government. Aena is ι ļ M l
responsible for ATC, passenger handling and car parking, flffvate companies undertake ramp handling and concessionaires are responsible for duty-free! Iolicing is provided by the State and security is shared between the state and specialist securit|Jcompames.
'l There are no environmental issues at present but there may bļ(|m the firture.
2 Type of airport
Menorca is located on one of the Balearic Islands, east ofļļfļfalencia and south of Barcelona, located in the Western Mediterranean. The principal markel Ipegments are scheduled domestic services, domestic cargo, and international scheduled and c|(|rter flights, as may be seen from the following Tables.
Traffic Data 1999
Domestic lights
Terminal Passengers (arrivals)
Terminal Passengers (departures)
Transit Passengers
Cargo (tonnes - inbound)
Cargo (tonnes - outbound)
Aircraft movements (arrivals + departures)
Scheduled
387 708
389 052
473
2 760
884
12 542
International flights (Intra EU)
Terminal Passengers (arrivals)
Terminal Passengers (departures)
Transit Passengers
Cargo (tonnes - inbound)
Cargo (tonnes - outbound)
Aircraft movements (arrivals + departures)
Scheduled
135 825
137 075
na
51
4
1269
Intemationat fìights (non-EU)
Aircraft movements (arrivals + departures)
Scheduled į
223 ί
I 1 Charter
\ • 26 424
I 21678
I I 4 703
I 635
I 251
111" 2022
Total
415 389
411 938
5 272
3 395
1 135
16 641
II ļ Charter
743 417
737 351
4 301
61
8
| 2 029
Total
879 721
875 029
4 301
112
12
3 912 |
J Charter
| 6 061
Total ļ
6 480 |
SPA-18 Air Transport Group, School of Engineehngj manfíeld University
Competition between Airports and the Application of State Aid Rules Volume II ~ Country Reports Spain
3 Route structure and key airlines
Airlines operating to Menorca with the largest market share reflect the principal traffic segments of the airport. Domestic scheduled services are shared between Iberia (50%), Spanair (17%) and Air Europa (21%). Charter carriers Monarch, Britannia, Air 2000 and Airtours operate services to Ibiza from the United Kingdom. Condor, Hapag Lloyd and LTU operate services from Germany. Iberia (56%) and European Air Transport (13%) dominate the cargo market.
4 Catchment area
Apart from domestic services the main market segment is inbound tourism. Each island in the Balcanes has its own airport and inter-island airport competition would only be likely if there were fast efficient connecting shipping services available throughout the year. Effectively, therefore, the airport catchment is the island alone for scheduled traffic and primarily UK and Germany for the inbound tourism market.
5 Competing airports
Taking into consideration hoüday charter airports, where the charges, faciüties and services offered by the airport form part of the marketing package offered by the region then the airports of the Balearics (and Canaries also) could be considered to be in competition with those of airports at other Mediterranean tourist destinations.
6 Current and future investment plans
The capital investment programme shown in the following Table was undertaken between 1999 and 2001.
Date
1999
1999
2000
Application
Car parking
Handling area
Taxiway improvements
Amount
1.4M€
1.6M€
12M€
Source(s) of funds
Aena
Aena
Aena
%Govt funding
None
None
None
Future capital investment between 2002 and 2004 is outlined in the following Table.
Air Transport Group, School of Engineering, Cranfìeld University SPA-19

Competition between Airports end (ΛΘ Application of Stete Ш Rules Volume H ~ Country Reports Spän
Dete
2002/04
2002/04
2002/04
2002/04
2002/04
Appticetion
Enlargement of Terminal area
Airfield improvements
Security
Remodelling of electrical power plant and new handling area
Improvement of taxiway at emergency runway etc.
Amount
43.6M€
4.1WI€
з.еме 2.9M€
5.7M€
S irce(s) of funds
Aena
Aena
Aena
¡ Aena
ι Aena
1
%Govt funding
None
None
None
None
None
Note that planned investments for Menorca between 200212004 will total 78.2M€. There have been no surface access infrastructure projects in the pfļjļļt 10 years nor are airy expected in the future.
7 Airport charges
Airport charges include landing, airaran parking, ATC, Л bridges, security, baggage and
cargo handling and 400Hz electricity supply. Landing ami parking charges are based on MTOW, passenger charges apply per departing passenger.ļ|ļ|he government reviews airport charges.
S Financial performance
Profit and loss accounts for individual Aena airports are nil published (refer to Section 1.3 for Group accounts). Corporation tax is paid at a standard ш § of 35%.
Current accounting practice is to use straight-line depreciatiJJ over the following periods:
Terminal and buildings Runways, taxiways and aprons Plant and machinery Terminal / airport systems Vehicles, equipment
Sources of funding
32yei I 20 -25
6-12 Ä r s 15- 181 ilars 4 - 6 yJrs
The Aena Group has access to loans from ЕШ at preferehf|ļl rates (around 5%); this applies to both past and future capital investments.
10 Public funding issues
None
SPA-20 Ak Transport Group, School of Engineering, Cfmfíeld University

Competition between Airports and the Application of State Aid Rules Volume II ~ Country Reports Spain
Palma de Mallorca
1 Ownership and organisational structure
The airport is owned by Aena who are 100% owned by the Spanish government. Aena is responsible for ATC, passenger handling and car parking. Private companies undertake ramp handling and concessionaires are responsible for duty-free. Policing is provided by the State and security is shared between the state and specialist security companies. In terms of traffic throughput, Palma de Mallorca is the second largest airport (along with Barcelona) in Spain and the headquarters of Spanair.
There are no environmental issues at present but there may be in the future.
2 Type of airport
Palma de Mallorca is located on one of the Balearic Islands, east of Valencia and south of Barcelona, located in the Western Mediterranean. The principal market segments are scheduled domestic services, domestic cargo, and international scheduled and charter flights, as can be seen from the following Tables.
Traffic Data 1999
Domestic nights
Terminal Passengers (arrivals)
Terminal Passengers (departures)
Transit Passengers
Cargo (tonnes - inbound)
Cargo (tonnes - outbound)
Aircraft movements (arrivals + departures)
Scheduled
2 013 925
2 003 002
37 594
10 675
4 698
51815
Charter
198 980
178 495
15 306
3 563
2 318
14 126
Total
2 245 058
2 260 079
56 594
14 238
7 016
69 347
International ISghts (Intra EU)
Terminal Passengers (arrivals)
Terminal Passengers (departures)
Transit Passengers
Cargo (tonnes - inbound)
Cargo (tonnes - outbound)
Aircraft movements (arrivals + departures)
Scheduled
3 446 250
3 402 434
11560
3 277
989
37 841
Charter
3 447 263
3 495 832
6 509
417
179
21357
Total
6 949 171
6 916 090
21369
3 694
1 168
60 996
International flights (non-EU)
Aircraft movements (arrivals + departures)
Scheduled
5 333
Charter
23 052
Total
29 664
Air Transport Group, School of Engineering, Cranfield University SPA-21

Competition between Airports and the Application of State Aid Rules
Route structure and key airlines
Volume II ~ Country Reports Spain
Airiines operating to Menorca with the largest market s' segments of the airport. Domestic scheduled services ari Spanair (16%) and Air Europa (31%). Charter carriers ι и services to Ibiza from the United Kingdom. Britannia and market. Condor, Hapag Lloyd and LTU operate services European Air Transport (21%) dominate the cargo market.
4 Catchment area
re reflect the principal traffic pared between Iberia (33%), itannia and Airtours operate
[let dominate the scheduled UK Germany. Iberia (22%) and
Apart from domestic services the main market segment is inflund tourism. Each island in the Balearics has its own airport and inter-island airport competi on would only be likely if there were fast efficient connecting shipping services available ļ||roughout the year. Effectively, therefore, the airport catchment is the island alone for sche(i|ļed traffic and primarily UK and Germany for the inbound tourism market.
charges, facilities and services (offered by the region then the lered to be in competition with
5 Competitive airports
Taking into consideration holiday charter airports, where tl offered by the airport form part of the marketing packagļj airports of the Balearics (and Canaries also) could be con: those of airports at other Mediterranean tourist destinations
6 Current and future investment plans
The capital investment programme, shown in the followiņ||Table, was undertaken between 1999 and 2001.
Date Application Amount )urce(s) of funds %Govt funding
1999 Industrial Area 12M€ Aena None
1999 Taxiway improvements 2.1M€ Aena None
1999 Electric central 6M€ Aena None
1999 10 Air bridges 4.5M€ Aena None
2000 Control and payment system of new parking area
1.88M€ Aena None
Future capital investment between 2002 and 2004 is outlinejf In the following Table
SPA-22 Air Transport Group, School of Engineering, ifield University

Competition between Airports and the Application of Stete Akt Rutes Volume li *- Country Reports Spain
Date
02/04
02/04
02/04
02/04
02/04
02/04
02/04
02/04
Application
Enlargement of passenger terminal
Airfields
Apron in industrial area etc.
New services building
Security
Local investments
Relocation of electric power plant
Automation new control centre
Amount
24.91 ме
15.0M€
15.42M€
10.0M€
22.0M€
22.2Μ€
5.87M€
7.3M€
Source(s) Of funds
Aena
Aena
Aena
Aena
Aena
Aena
Aena
Aena
%Govt funding
None
None
None
None
None
None
None
None
Note that planned investments for Palma de Mallorca between 2002-2004 will total 156M€. There have been no surface access infrastracture projects in the past 10 years nor are any expected in the future.
7 Airport charges
Airport charges indude landing, aircraft parking, ATC, air bridges, security, baggage and cargo handling and 400Hz electricity supply. Landing and parking charges are based on MTOW, passenger charges apply per departing passenger. The government reviews airport charges.
8 Financialperformance
Profit and loss accounts for individual Aena airports are not published (refer to Section 1.3 for Group accounts). Corporation tax is paid at a standard rate of 35%. Current accounting practice is to use straight-line depreciation over the following periods:
Terminal and buildings Runways, taxiways and aprons Plant and machinery Terminal / airport systems Vehicles, equipment
Sources of funding
32 years 20 -25 years 6-12 years 15- 18 years 4 -6 years
The Aena Group has access to loans from ЕЮ at preferential rates (around 5%); this applies to both past and future capital investments.
10 Public funding issues
None
Air Transport Group, School of Engineering, Cranfíeld University SPA-23
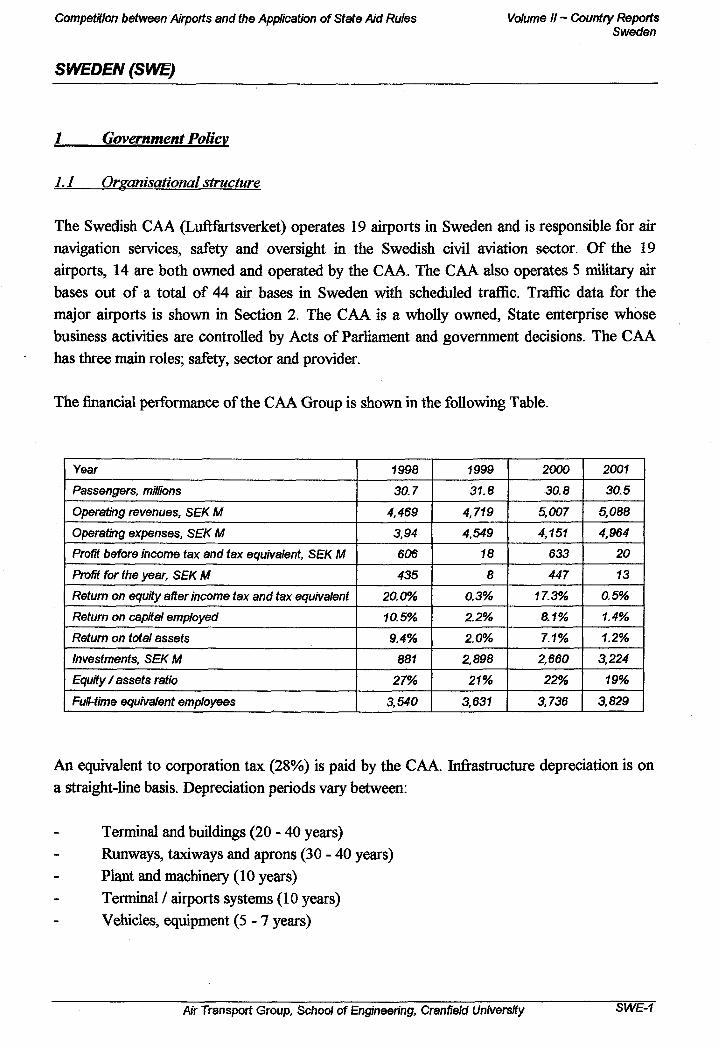
Competition between Airports and the Application of State Aid Rules
SWEDEN (SWE)
Volume II - Country Reports Sweden
1 Government Policy
I.I Organisational structure
The Swedish CAA (Luftfartsverket) operates 19 airports in Sweden and is responsible for air navigation services, safety and oversight in the Swedish civil aviation sector. Of the 19 airports, 14 are both owned and operated by the CAA. The CAA also operates 5 military air bases out of a total of 44 air bases in Sweden with scheduled traffic. Traffic data for the major airports is shown in Section 2. The CAA is a wholly owned. State enterprise whose business activities are controlled by Acts of Parliament and government decisions. The CAA has three main roles; safety, sector and provider.
The financial performance of the CAA Group is shown in the following Table.
Year
Passengers, millions
Operating revenues, SEK M
Operating expenses, SEK M
ProM before income tax and tax equivalent, SEK M
Profit for the year, SEK M
Return on equity after income tax and tax equivalent
Return on capital employed
Return on total assets
Investments, SEK M
Equity/assets ratio
Full-time equivalent employees
1998
30.7
4,469
3,94
606
435
20.0%
10.5%
9.4%
881
27%
3,540
1999
31.8
4,719
4,549
18
8
0.3%
2.2%
2.0%
2,898
21%
3,631
2000
30.8
5,007
4,151
633
447
17.3%
8.1%
7.1%
2,660
22%
3,736
2001
30.5
5,088
4,964
20
13
0.5%
1.4%
1.2%
3,224
19%
3,829
An equivalent to corporation tax (28%) is paid by the CAA Infrastructure depreciation is on a straight-line basis. Depreciation periods vary between:
Terminal and buildings (20 - 40 years) Runways, taxiways and aprons (30-40 years) Plant and machinery (10 years) Terminal / airports systems (10 years) Vehicles, equipment (5-7 years)
Air Transport Group, School of Engineering, Cranfìeld University SWE-1

Competition between Airports and the Application of State Aid Rules
1.2 Regulatory environment
Of the 19 State-run airports, 18 have received environ continuous changes in operations, it may for example, bee infrastructure, which requires new permit approval for all conditions. The permit application is submitted to the Envii Arlanda airport, modifies rules concerning flight paths caü study and to write a proposal for changes in the operating Earlier, Arlanda had asked the government to amend th« ceiling'. Also at Arlanda, environmental restrictions impose a
Environmental issues currently have a major impact on Bri politically driven limitation on the number of movements, annum including 16,500 for aircraft over 14 tonnes. The number to 65,000 movements per hour; this could only bei J of GA operations. Ultimately, the airport at Bromma will be ¡<
1.3 Airport ownership policy
Privatisation not on agenda at present
1.4 Air Service Agreements
Airlines from EU countries may freely operate air transp( themselves determine the fares they wish to charge. The thr negotiate agreements on air transport to countries outside t < agreement was signed with the USA in 1995.
1.5 Public Service Obligation (PSO) routes
Sweden has imposed only one PSO and this is in the Nortl This represents only 1% of total domestic departures and capacity. PSOs are being prepared for 10 other routes Stockholm Arlanda to small regional airports such as Galli1
Storuman. The existing PSO was tendered and subsidised Swedish government transport authority responsible for tr public transport within Sweden. It was set up with the inten transport system within the framework of economic, soc development policy objectives. The 2000 subsidy was equiy on the Umea - Östersund route is approximately 11,000, subsidy per passenger trip of £34.
Volume II - Country Reports Sweden
ental permit approvals. Given ne necessary to modify airport >perations or certain operating mental Court. For example, at d the CAA to revise its noise onditions for the third runway. terms of the airport's exhaust φ on aircraft movements.
una airport. There is a current \t present totalling 88,000 per
are proposals to reduce this hieved by reducing the number >sed possibly by 2011.
; services in the EU and may ! Scandinavian countries jointly ïU; for example, an Open Skies
between Umea and Östersund. 26% of total domestic seating seing primarily services from re, Hagfors, Sveg, Torsby and y the Rikstrafiken, which is a tsport policy and provision of m of establishing an integrated 1, environmental and regional int to £373,134. Annual traffic ivhich converts to an average
SWE-2 Air Transport Group, School of Engineering, Crai ild UniversRy

CompetŘkm between Airports and the Application of State Aid Rules Volume It - Country Reports Sweden
Airport Traffic Statistics
Passeneers (Thousandsì on commercial flights
Airport
Gőteburg-Landvetter
Luleå
Malmö-Sturup
Stockholm-Arlanda
Stockholm-Bromma
Urnea
Dom./ Transit
1332
891
1238
6 669
981
707
1999
int.
2 593
51
689
10 705
12
41
Tora/
3 925
942
1927
17 374
993
748
Dom./ Transa
1429
934
1303
6 942
983
718
2000
Int.
2 842
58
786
11504
16
46
Tora/
4 271
962
2 089
18 446
999
764
Source: Various
Commercial Aircraft Movements (Thousands)
Airport
Gõteburg-Landvetter
Luleå
Malmö-Sturup
Stockholm-Arlanda
Stockholm-Bromma
Urnea
1999
Sched. & Charter
62.3
15.2
27.3
256.3
25.8
13.5
Ořfter Commercial
3.9
0.6
1.9
9.5
na
2.5
Total Commerdat
66.2
15.8
29.2
265.8
25.8
16.0
2000
Sched. & Charter
64.0
13.6
29.1
259.6
26.0
9.7
Other Commercial
4.8
0.6
2.0
9.1
na
2.7
Total Commerdai
68.8
14.2
31.1
268.7
26.0
12.4
Source: Various
Air Transport Group, School of Engineering, Cranfíeid UnNersity SWE-3

Competition between Airports and the Application of State Aid Rules
Freieht and Moil (Thousands ofůmnes)
Volume II - Country Reports Sweden
Airport
Göteburg-Landvetter
Luleå
Malmö-Stump
Stockholm-Arlanda
Stockholm-Bromma
Urnea
Freight
44.0
1.0
3.7
112.7
na
1.6
f999
3.6
1.6
6.1
31.7
na
6.3
Total Cargo
47.6
2.6
9.8
144.4
na
7.9
fire« f
5 ¡
C ) I li' ļ m >
! ι
c ι ι
2000
3.8
1.7
6.0
33.2
na
5.8
Tora/ Cargo
61.3
2.6
10.7
153.7
na
6.6
Source: Various
SWE-4 Air Transport Group, School of Engineering, Crameld University

I I I I I I I I I I I I I I I I I I I I I
Competition between Airports and the Application of State Aid Rules Volume II ~ Country Reports Sweden
3 Airline market
3.1 SAS
SAS is the multinational airline for Norway, Denmark and Sweden. Serving almost 100 destinations in more than 33 countries, operating an average of 1,000 flights per day and carrying 265,000 tons of cargo per year.
Founded on 1st August 1946, SAS, the flag carrier of Norway, Sweden & Denmark ofíèrs air services within, to and from Scandmavia. The consortiums that own the airline are SAS Denmark A/S, SAS Norge ASA & SAS Sweden AB. These parent companies are owned fifty-fifty by private investors and their respectivi; governments. In late November 1997, SAS announced it would take a 29% stake in Norwel ian regional Wideroe Flyveselskap, in order to strengthen its presence in the Norwegian market. This stake was later increased to 63.2% in December 1998.
In May 1997 SAS formed a global network with Air Canada, Lufthansa THAI and United Airlines, named the STAR Alliance. January 1998 saw SAS acquire Air Botnia, a regional carrier based in Finland. SAS also increased its stake in Air Baltic from 28.5% to 38.16% following the acquisition of 9.66% from Baltic International USA
During June 2001 it was announced that SAS was to buy Norwegian airline Braathens for NKrl.l billion (121 million), including the 30% shareholding presently held by Dutch flag-carrier KLM.
The ownership structure of SAS was also changed in June 2001, with a holding company (SAS AB) being created in which the governments of Sweden, Norway and Denmark hold shares and the remaining 50% being publicly held and traded on the stock exchange.
Air Transport Group, School of Engineering, Cranfíeld University SWE-5

Competition between Airports end the Application of Stete Aid Rules Volume II ~ Country Reports Sweden
4 Airports
Malmö-Stump
Ownership and organisational structure
Malmö-Sturap airport, part of the Swedish Civil Aviation Iidministration, was opened for traffic in 1972 and replaced Bulltofta, the latter being lSlpden's first airport to handle scheduled traffic. Full time employment at the airport in 19Я was 239. The Stump Division of the CAA also includes Ängelholm, Holmstad and Ronnebjj lirports.
The provision of airport services is split between the CAJ (ATC), State (police). Airport (security, car parking) and other companies (passenger /пшУ handling and duty free).
Type of airport
Malmö-Stump is a small regional airport serving primarily with an increasing number of international operations, pn Ryanair. There is no significant transfer traffic. The followii data in detail.
Swedish domestic market but ly by the low-cost operator
Tables show the '2000' traffic
Do/nesfic nights
Terminal Passengers (arrivals)
Terminal Passengers (departures)
Transfer Passengers
Transit Passengers
Cargo (tonnes - inbound)
Cargo (tonnes - outbound)
ATMs (arrivals+departures)
Aircraft movements (arrivals + departures)
Scheduled
613573
606982
414
158
-
-
18602
18602
Charter
26955
12697
166
11541
436
638
2563
16471
Total
640528
619679
580
11691
436
638
21165
35073
II International flights (intra EU)
Terminal Passengers (arrivals)
Terminal Passengers (departures)
Transfer Passengers
Transit Passengers
Cargo (tonnes - inbound)
Cargo (tonnes - outbound)
ATMs (arrivals+departures)
Aircraft movements (arrivals + departures)
Scheduled
110061
110590
5
212
-
-
5019
5019
Charter
202767
217986
130
8429
1788
1410
| 4532
6972
Tora/
312828
328076
135
8641
1788
1410
9551
11991
SWE-6 Air Transport Group, School of Engineering, Crà ield University

Competition between Airports and the Application of State Aid Rules Volume II - Country Reports Sweden
International flights (non-EU)
Terminal Passengers (arrivals)
Terminal Passengers (departures)
Transfer Passengers
Transit Passengers
Cargo (tonnes - inbound)
Cargo (tonnes - outbound)
ATMs (arrivals+departures)
Aircraft movements (arrivals + departures)
Scheduled
5123
6031
-
104
-
-
1104
1104
Charter
44458
64921
304
2672
171
238
986
1304
Total
49581
70952
304
2776
171
238
2090
2408
3 Route structure and key airlines
The main international scheduled destination is London Stansted. The primary domestic destinations are Stockholm Arlanda, Bromma and Vasteras.
Scheduled domestic traffic is dominated by SAS (60%) followed by Malmö Aviation (30%) and Skyways. Scheduled intra-EU services used to be confined to a KLM turboprop operation to Amsterdam. With the opening of rail and road access to Copenhagen, KLM pulled off this route and the main international route is that to London Stansted operated by Ryanair.
During the year Malmö had 556,000 international charter passengers with a range of 34 holiday destinations m 15 countries. Charter operations (intra- / non- EU) are equally shared between Premiair and Britannia.
The global cargo company TNT has concentrated its operations in the region at Malmö airport. TNT shipments to Denmark now move by lorry across the bridge and TNT presently has about 80% of the cargo market.
4 Catchment area
The airports immediate catchment is that of South-west Sweden just across the straits from Denmark. The openmg of the Øresund road / rail bridge linking Denmark and Sweden has mixed implications for Malmö. On one hand, Copenhagen airport has increased its Swedish catchment area; on the other hand the low-cost operations at Malmö have to potential to attract custom from the Copenhagen hinterland. Joint studies carried out by Copenhagen and Stump airports indicated that the bridge, which opened in niid-2000, would lead to more rapid growth in air travel than in other regions of the two countries, but no major reallocation of passengers between the two airports has occurred, at least in the short term.
Air Transport Group, School of Engineering, Cranlield University SWE-7

Competition between Airports and the Application of State Aid Rules Volume il ~ Country Reports Sweden
Within one-hour drive of the airport, Malmö attracts aboi remaining 28% using Copenhagen, Kristianstad and Ani international traffic, Malmö attracts 22% of the market witl Much of the potential international market is attracted to larger number of international destinations. Both Copenhagei operations. The catchment of charter traffic is within 3 houli attracts about 70% of the market with the remainder going of the cargo withm the Malmö catchment uses Copenhagen through passenger surveys that are undertaken every 3 to 5 ýj
5 Competing carports
Malmö's main competitor is Copenhagen for all market s¡
some 40km to the west of Malmö and approximately 30 bridge. Obviously, in view of the comparative throughput offers a range of services and frequencies that is difficult t seriously compete on the low-cost and domestic markets Malmö. The first is Ängelholm / Helsingborg (CAA) locati (one hour driving time) that competes for the domestic Kristianstad (non-CAA), located 80 km to the north-east competes for the domestic scheduled and international charti
•I
72% of the market with the lohn airports. For scheduled
Į two hours drive of the airport. )penhagen, the latter having a (Go) and Malmö have low-cost
¡drive of Malmö, of this Malmö Copenhagen. The vast majority
Ifhe catchment area is monitored rs.
lents. Copenhagen is located tes driving time across the new the two airports, Copenhagen mpete with. Malmö can only
o other airports compete with some 85 km to the north-west eduled market. The second is
liso one hour driving time) that ket.
6 Current and future investment plans
There have been no major investments in the last ten years, Future planned investments include:
100% security system (90M Swedish Kroner / SEK) Rebuilding of existing terminal building to maximise Construction of rail link (80M SEK) [2008] Construction of second terminal building (100M SE Extension to taxiway system (100M SEK) [2011]
Je terminal being rebuilt in 1985.
|002] mcity (145M SEK) [2008]
|[2010]
Funding for the above projects is expected to come froira Group (CAA) funds with the exception of the railway that may be partially financed from| røtemal sources.
Airport Charges
Airport Charges are set out in the current Tariff RÍIulations as published by the Luftfartsverket (CAA). Charges include landing, passengelļ service (including air bridges), and aircraft parking, air-navigation, security and noise marges. Landing, parking and navigation charges are based on Maximum Take-ofF Ight (MTOW); passengers and
SVVE-8 Л/г Transport Group, School of Engineering, CrĘmeld University

Competition between Airports and the Application of State Aid Rules Volume II - Country Reports Sweden
security charges apply to each departing passenger. There are special off-peak tariffs. Charges are cost related including revenue neutral noise and emission supplements and are set according to ICAO principles.
In addition, emissions related surcharges are imposed on all aircraft with a MTOW exceeding nine tonnes as a supplement to the landing charge.
There is no cross-subsidisation of aeronautical charges between Malmö and other airports in the CAA group and commercial revenues have been increased in order to avoid additional increase in aeronautical charges.
8 Financial performance
Malmö airport is part of the CAA group and financial performance details are not available in detail for individual airports. Nevertheless, the 1999 Annual Report reported an operating profit of SEK 54M (SEK 55M in 1998) for the airport, being the third highest of the CAA airport system. However, in 2001 the operating profit fell to SEK 38M though still only one of three CAA airports to be profitable. Refer to Section 1.1 for details of Group financial performance.
9 Sources of funding
The only identified public sector grant was in 2000 towards a study for a railway connection between Malmo Stump and Copenhagen Airports (M€0.50,); this was partly financed by the European Commission (5M SEK) towards a total study cost of 10M SEK. No fiiture use of public sector grants is anticipated.
No airport-related surface infrastructure has been constructed in the last ten years and during the next ten-year period the only surface infrastructure under consideration appears to be the rail link and road access to the airport. If this were to go ahead, this would be funded by Group funds and / or external funds (loans etc.).
10 Public funding issues
The construction of the Øresund road / rail bridge, using public funding, could have significantly changed the catchinent area and traffic patterns at both Malmö and the dominant Copenhagen airports. In practice, both airports seem to have benefited from construction of the bridge and there is no evidence that a major re-allocation of passengers between the two airports has occurred, at least in the short term.
Air Transport Group, School of Engineering, Crantìeld University SWE-9

I Competition between Airports and the Application of Sfare Aid Rules Volume II ~ Country Reports
Sweden
Stockholm Arlanda
1 Ownership and organisational structure
Stockholm - Arlanda airport has been Sweden's largest mtémational airport since 1962 and is part of the Swedish Civil Aviation Administration and 100% state owned. Full time employment at the airport in 2001 was 806. The Arlanda tSilision of the CAA also includes Bromma airport.
The provision of airport services is split between the CÁ| | (ATC), State (police), Airport (security, car parking) and other independent companies (sqllluity, passenger / ramp handling and duty free).
2 Type of airport
Arlanda is a major international airport serving not only also as a hub for SAS. At present no low-cost operators usi
Swedish domestic market but rlanda but there is a significant
charter and transfer market. The following Tables show the liOOO' traffic data in detail.
Domestic flights
Terminal Passengers (arrivals)
Terminal Passengers (departures)
Transfer Passengers
Transit Passengers
Cargo (tonnes - inbound)
Cargo (tonnes - outbound)
ATMs (arrivals+departures)
Aircraft movements (arrivals + departures)
Scheduled
3370247
3362391
829611
559
2134
3489
na
110478
I Charter
15759
11730
¡ 17
2083
10242
13967
| na
9538
Total
3386006
3374121
829628
2642
12376
17456
na
124095
International flights (Intra EU) Scheduled Charter Total
Terminal Passengers (arrivals) 3237611 832664 4070275
Terminal Passengers (departures) 3120792 860123 3980915
Transfer Passengers 630021 246 630267
Transit Passengers 139590 7438 147028
Cargo (tonnes - inbound) 35792
Cargo (tonnes - outbound) 35096
ATMs (arrivals+departures) Na Na Na
Aircraft movements (arrivals + departures) 99963 10716 111140
SWE-10 Air Transport Group, School of Engineering, mfìeld University

Competition between Airports and the Application of State Aid Rules Volume II ~ Country Reports Sweden
Internationalffights (non-EU)
Terminal Passengers (arrivals)
Terminal Passengers (departures)
Transfer Passengers
Transit Passengers
Cargo (tonnes - inbound)
Cargo (tonnes - outbound)
ATMs (arrivals+departures)
Aircraft movements (arrivals + departures)
Scheduled
1365248
1321964
290226
22184
-
-
Na
3Θ288
Charter
373588
391809
1262
10529
-
-
Na
4664
Total
1738836
1713773
291488
32713
20818
32227
Na
44148
3 Route structure and key airlines
Arlanda is a major international airport with a significant number of transfer passengers. Much of this section is based on an analysis of operations post 11* September although quoted traffic data in the previous section is based on year '2000' data. During 2001 nearly 6.7 million people flew on domestic flights, an overall fall of 1% compared with 2000. Arlanda's three largest domestic destmations - Gothenburg, Luleå and Malmö had stable traffic levels. Domestic hub operations at Arlanda were therefore little affected by the events of2001.
The volume of international air cargo, which is connected to the macro-economic situation but not affected by increased concern about civil aviation as a mode of transport, declined by 5% on an annual basis.
American Airlines and Delta discontinued their flights to Stockholm after September 11 . Copenhagen was Arlanda's destination with the largest number of passengers, nearly 1.2 million, a reduction of 1% compared with the previous year. The second-largest destination was London with 1 million passengers, followed by Gothenburg with 947,000.
London previously topped the list as the largest destination of flights from Arlanda. The decline in passenger volume is attributed to currency fluctuations and mad cow disease. Low-cost flights to London from other airports in the Stockholm region may also have had an effect but it is believed by the CAA that these flights attract new travellers. In fact, this is not the whole story as many business travellers have been put off by the high fares charged by SAS and В A.
The largest decrease was to and from the United States where traffic was down by 22% compared with 2000. During 2001 Sabena stopped serving Arlanda and, overall, international traffic decreased by 1%. The total number of international passengers was 11,401,000 of whom 7,017,000 travelled outside the Schengen area.
Air Transport Group, School of Engineering, Cranfield University SWE-11

Competition between Airports and the Application of State Aid Rules Volume II ~ Country Reports Sweden
SAS has the highest market share (83%) of the domestic the Skyways Group. The scheduled intra-EU market is si (11%) and British Airways (10%). The scheduled intei dominated by SAS (48%), until recently Swissair (10%) market but the demise and re-branding ofthat airline will pi penetration in the future. Charter operations (both intra Premiair, Britannia and Nova in order of decreasing mi divided between belly-hold (50%), FedEx, TNT cargo freį is transhipped by road to Copenhagen and Hamburg.
4 Catchment area
rket, only being challenged by between SAS (46%), Finnair
lonal (non-EU) market is also ļ a significant share of the same sibly result in a reduced market
non- EU) are dominated by share. The cargo market is
(25%) and the remaining 25%
About 53% of the scheduled domestic market lives within | hinterland overlaps that with Stockholm-Bromma airport. (origin / destination) some 70% of the market lives within the charter market lives withm 80 km of Arlanda, once aį that of Bromma. No catchment areas are defined for the
km of Arlanda. The catchment scheduled international traffic km of Arlanda. Some 54% of
the catchment overlaps with market. The catchment area is
monitored by passenger surveys, the last being undertaken in llOOO.
Competitive airports
The principal airport competitor is Copenhagen, located Ц Arlanda. Copenhagen offers, by comparison with Arlanda and destinations especially to the southern EU regions. Stockholm Skavsta (located 150 km tot eh south of Arlana for example, Ryanair to London Stansted and Finnair to He| Vasteras (west of Arlanda) so there is now some fare compe
k 600 km to the southwest of larger number of frequencies second airport competitor is
for intra-EU scheduled traffic, á. Ryanair also operates from
Ion on specific markets.
Current and future investment plans
Investment programmes in the last five years include:
Arlanda Express (1,144M Swedish Kroner / SEK) [Í»9] Extension to Arlanda North and South including Scl||ngen and 100% security control (1,535MSEK)[1999/01] Control tower (367M SEK) [2001] Construction of third runway (587M SEK) [1998 / 0ļ
AU of the funding for the above projects has come from include:
¡mal funds. Future expenditures
SWE-12 Air Transport Group, School of Engineering, Crå leld University
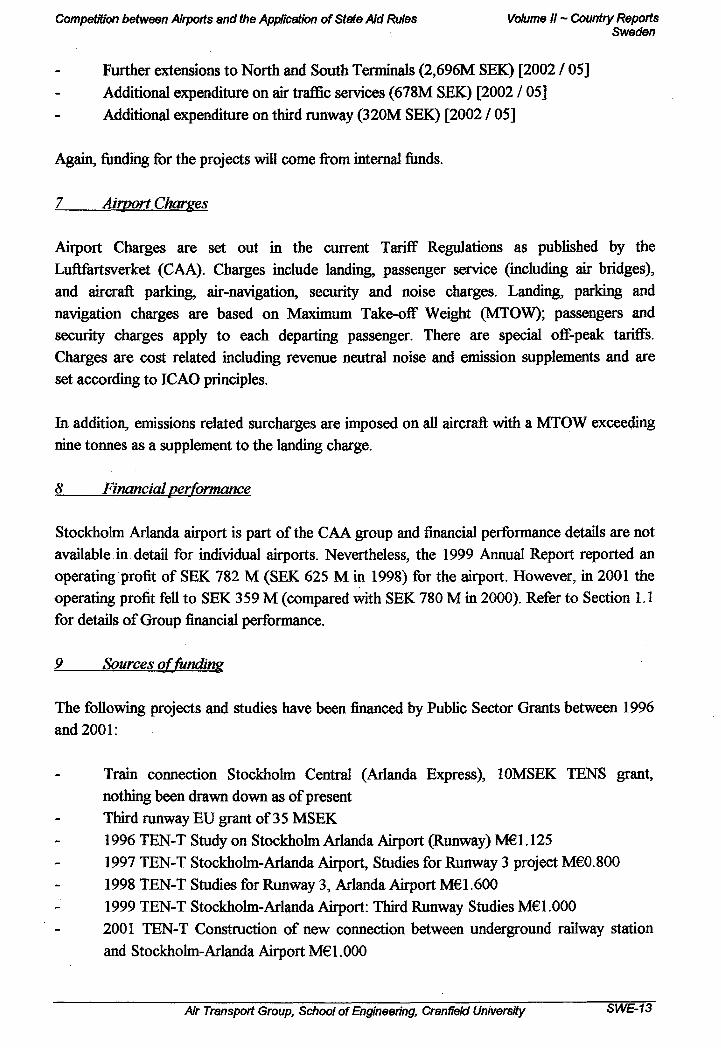
Competition between Airports and the Application of State Aid Rules Volume II ~ Country Reports Sweden
Further extensions to North and South Terminals (2,696M SEK) [2002 / 05] Additional expenditure on air traffic services (678M SEK) [2002 / 05] Additional expenditure on third runway (320M SEK) [2002 / 05]
Again, funding for the projects will come from internal funds.
7 Airport Charges
Airport Charges are set out in the current Tariff Regulations as published by the Luftfartsverket (CAA). Charges include landing, passenger service (including air bridges), and aircraft parking, air-navigation, security and noise charges. Landing, parking and navigation charges are based on Maximum Take-off Weight (MTOW); passengers and security charges apply to each departing passenger. There are special off-peak tariffs. Charges are cost related including revenue neutral noise and emission supplements and are set according to ICAO principles.
In addition, emissions related surcharges are imposed on all aircraft with a MTOW exceeding nine tonnes as a supplement to the landing charge.
8 Financial performance
Stockholm Arlanda airport is part of the CAA group and financial performance details are not available in detail for individual airports. Nevertheless, the 1999 Annual Report reported an operating profit of SEK 782 M (SEK 625 M in 1998) for the airport. However, in 2001 the operating profit fell to SEK 359 M (compared with SEK 780 M in 2000). Refer to Section 1.1 for details of Group financial performance.
9 Sources of funding
The following projects and studies have been financed by Public Sector Grants between 1996 and 2001:
Train connection Stockholm Central (Arlanda Express), 10MSEK TENS grant, nothing been drawn down as of present Third runway EU grant of 35 MSEK 1996 TEN-Т Study on Stockholm Arlanda Airport (Runway) M€l .125 1997 TEN-T Stockholm-Arlanda Airport, Studies for Runway 3 project M€0.800 1998 TEN-Т Studies for Runway 3, Arlanda Airport M€l .600 1999 TEN-T Stockholm-Arlanda Airport: Third Runway Studies M€l .000 2001 TEN-Т Construction of new connection between underground railway station and Stockholm-Arlanda Airport M€1.000
Air Transport Group, School of Engineering, Cranfield University SWE-13

Competition between Airports and the Application of State Aid Rules Volume II ~ Country Reports Sweden
There is little information on the financing on future prdļlļlcts and studies. However, an additional rail connection to the airport has been mooted aļ§ļiough there is no mdication on project cost or funding sources.
JO Public funding issues
Stockholm Arlanda is part of an airport network operai international airport of the country, its nearest competitors practice, because of geography, the airport has little cpi carriers are intent of taking some of the intra-EU markėj Investment in transport infrastructure is, in any case, drivehj there is little evidence that public funding has any influeņ« case.
by the ÇAA. As the major |e Copenhagen and Helsinki. In jetition although the low-cost
¡away from the CAA airports. environmental reasons. Thus,
on airport competition in this
SWE-14 Air Transport Group, School of Engineering, Crá|te/d University

Competition between Airports and the Application of Sfare Aid Rules Volume II ~ Country Reports Sweden
Stockholm Bromma
1 Ownership and organisational structure
Stockholm - Bromma (dty-centre) airport was used for domestic and international traffic from 1936 to 1962 when the most of the international traffic was moved to Stockholm-Arlanda. SAS domestic aviation moved to Arlanda in 1969. From 1983 to 1992 Bromma was mainly used for business and for træning flights. After deregulation, air traffic at Bromma has increased dramatically. The airport is under constant threat of closure for environmental reasons. Bromma is part of the Swedish Civil Aviation Administration and 100% state owned. Full time employment at the airport in 2001 was 115. The Arlanda Division of the CAA also includes Arlanda airport.
The provision of airport services is split between the CAA (ATC), State (police). Airport (security, car parking) and other independent companies (security and passenger / ramp handling).
2 Type of airport
Bromma primarily serves the Swedish domestic and General Aviation markets. The following Tables show the '2000' traffic data in detail.
Domestic nights
Terminal Passengers (arrivals)
Terminal Passengers (departures)
Transit Passengers
Aircraft movements (arrivals + departures) (inc. GA)
Scheduled
492079
484860
0
23452
Charter
3143
3082
28
1084
Total
502957
487942
28
64526
International flights (Intra EU)
Terminal Passengers (arrivals)
Terminal Passengers (departures)
Aircraft movements (arrivals + departures) (inc. GA)
Scheduled
3928
3841
758
Charter
3518
4166
991
Tofa/
7446
8007
4628
Intematíonal flights (non-EU)
Terminal Passengers (arrivals)
Terminal Passengers (departures)
Aircraft movements (arrivals + departures) (inc. GA)
Scheduled
74
-
1
Charter
215
306
177
Total
289
306
1261
Air Transport Group, School of Engineering, Cranfield University SWE-15

Competition between Airports and the Application of State Aid Rules Volume II ~ Country Reports Sweden
Route structure and key airlines
Bromma primarily serves the Swedish domestic market flights. Malmö Aviation dominates the scheduled domestic responsible for most of the scheduled intra-EU flights.
a limited number of intra-EU derations while BA / Sunair are
4 Catchment area
For domestic and scheduled mtra-EU flights the catchmeņf city and suburbs. The catchment overlaps that of Stockhol area is defined as the result of passenger surveys.
rea for Bromma is Stockholm rlanda airport. The catchment
Competitive airports
The primary domestic flights competitor to Bromma is 42km to the north. Arlanda offers the possibility of trans| domestic flights and charter flights. The secondary competi| 120 km to the south. The competing market segment is eli the international low-fare market is also developing at Ska\ same reasons, is Vasteras, located 100km to the west.
»ckholm-Arlanda located about to international flights, other
to Bromma is Skavsta located ler flights that offer lower fares, a. The third competitor, for the
6 Current andfiiture investment plans
There has been no significant capital investment at the expected to be in the future.
7 Airport charges
Airport Charges are set out in the current Tariif Rļ Luftfartsverket (CAA). Charges include landing, passengí and aircraft parking, air-navigation, security and noise | navigation charges are based on Maximum Take-off security charges apply to each departing passenger. Tl Charges are cost related including revenue neutral noise set according to ICAO principles.
)rt in recent years nor is there
lations as published by the I service (including air bridges), fharges. Landing, parking and
lit (MTOW); passengers and re are special off-peak tariffs.
emission supplements and are
In addition, emissions related surcharges are imposed on all||||rcraft with a MTOW exceeding nine tonnes as a supplement to the landing charge.
SWE-16 Air Transport Group, School of Engineering, Crsmeld University

Competition between Airports and the Application of State Aid Rules Volume II ~ Country Reports Sweden
8 Financial performance
Bromma airport is part of the CAA group (Stockholm Division) and detailed financial performance details are not available for individual airports. Nevertheless, the 1999 Annual Report reported an operating profit of SEK 6 M (compared with a loss of SEK 2 M in 1998) for the airport. However, in 2001 there was a loss of SEK 7 M (compared with an operating profit of SEK 8 M in 2000).
9 Sources of funding
No public sector grants have been received in the past or expected in the future. No expenditure on surface infrastructure has been incurred that might be construed as having a benefit on the airport.
10 Public funding issues
Not really applicable due to environmental constraints.
Air Transport Group, School of Engineering, Cranfietd University SWE-17
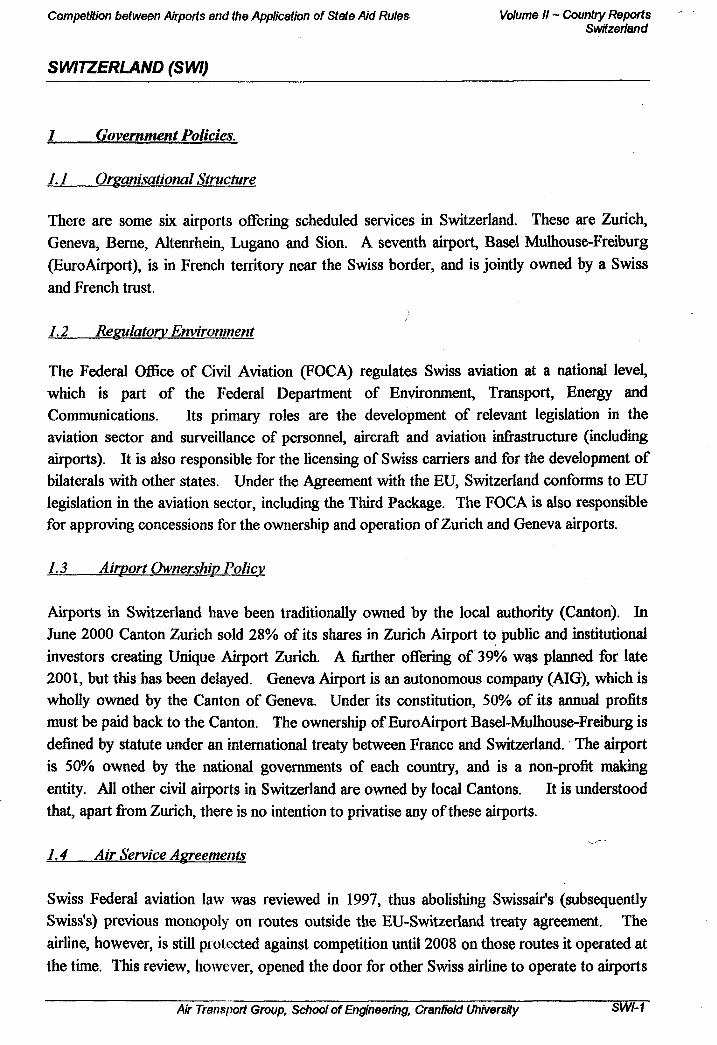
I I I I I I I I I I I I I I I I I I I I I
Competöion between Airports and the Application of State Aid Rules Volume II ~ Country Reports Switzerland
SWITZERLAND (SWI)
1 Government Policies.
1.1 Organisational Structure
There are some six airports offering scheduled services in Switzerland. These are Zurich, Geneva, Berne, Altenrhein, Lugano and Sion. A seventh airport, Basel Mulhouse-Freiburg (EuroAirport), is in French territory near the Swiss border, and is jointly owned by a Swiss and French trust.
1.2 Regulatory Environment
The Federal Office of Civil Aviation (FOCA) regulates Swiss aviation at a national level, which is part of the Federal Department of Environment, Transport, Energy and Communications. Its primary roles are the development of relevant legislation in the aviation sector and surveillance of personnel, aircraft and aviation infrastructure (including airports). It is also responsible for the licensing of Swiss carriers and for the development of bilaterals with other states. Under the Agreement with the EU, Switzerland conforms to EU legislation in the aviation sector, including the Third Package. The FOCA is also responsible for approving concessions for the ownership and operation of Zurich and Geneva airports.
/. 3 Airport Ownership Policy
Airports in Switzerland have been traditionally owned by the local authority (Canton). In June 2000 Canton Zurich sold 28% of its shares in Zurich Airport to public and institutional mvestors creatmg Unique Airport Zurich. A further offering of 39% wąs planned for late 2001, but this has been delayed. Geneva Airport is an autonomous company (AIG), which is wholly owned by the Canton of Geneva. Under its constitution, 50% of its annual profits must be paid back to the Canton. The ownership of EuroAirport Basel-Mulhouse-Freiburg is defined by statute under an international treaty between France and Switzerland. The airport is 50% owned by the national governments of each country, and is a non-profit making entity. All other civil airports in Switzerland are owned by local Cantons. It is understood that, apart from Zurich, there is no intention to privatise any of these airports.
1.4 Air Service Agreements
Swiss Federal aviation law was reviewed in 1997, thus abolishing Swissair's (subsequently Swiss's) previous monopoly on routes outside the EU-Switzerland treaty agreement. The airline, however, is still piolected against competition until 2008 on those routes it operated at the time. This review, however, opened the door for other Swiss airline to operate to airports
Air Transport Group, School of Engineen'ng, Cranfield Uhiversity SWI-1

Competition between Airports and the Application of Stete Aid Rules Volume II - Country Reports Switzerland
where the national carrier did not operate. To date, howevd I due to the changes in the airline market, no other independent Swiss carrier has emerged to iļļjļļpertake this role.
7.5 Public Service Obligation (PSO) Routes
Switzerland has no Public Service Obligation (PSO) routes.
SWI-2 Air Transport Group, School of Engineering, CrmmeldUniversity
I I I I I I I I I I I I I I I I I I I I I

Competition between Airports and the Application of State Aid Rules Volume II - Country Reports Switzerland
Airport Trafne Statistics
Passeneers (Thousands) on commercial flishts
Airport
Berne
EuroAirport (BMF)
Geneva
Lugano
Zurich
Dom./ Transit
na
844
1 159
na
1490
1999
Int.
na
2 728
5 804
na
19 385
Total
224
3 572
6 963
360
20 875
Dom./ Transit
na
844
1 160
na
1435
2000
Int.
na
2911
6 604
na
21 192
Total
224
3 755
7 764
295
22 627
Transfer
Passengers
Negligible
Negligible
Negligible
Negligible
Significant
Sources: Л/г Transport Intetögence / A I / Annual Reports
The latest figures for 2001 (year to 31 December) indicate that passenger traffic has declined by some 7% at Zurich (to 21.0 mppa), by 4% at Geneva (7.5 mppa) and by 6% at EuroAirport (3.5 mppa). This can be attributed to the dual implications of September 11 and the collapse of Swissair.
Commerciai Aircraft Movements (Thousands)
Airport
Berne
EuroAirport (BMF)
Geneva
Lugano
Zurich
f999
Sched & Charter
na
92.0
108.7
na
270.0
Other Commercial
na
5.6
1.6
na
0.1
Totai Commercial
16.8
97.6
110.3
13.2
270.1
2000
Sc/ted & Charter
na
94.0
116.9
na
290.3
Otóer Commercial
na
6.1
2.0
na
0.6
Tora/ Commercial
18.1
100.1
118.9
13.2
290.9
Sources: Air Transport ШеШдепсе /ACI/Annual Reports
Air Transport Group, School of Engineering, Cranfíeld University SWI-3

Competition between Airports and the Application of Stete Aid Rules
Freisht and Moil (Thousands oĘįonnes)
Volume II - Country Reports Switzerland
Airport
Berne
EuroAirport (BMF)
Geneva
Lugano
Zurich
Freight
0.1
69.7
42.0
na
356.6
f999
na
3.3
9.3
na
21.8
Total Cargo
0.1
73.0
51.3
na
378.4
F, ght
1
I ^ ] .3
3
ñ "
2000
na
2.6
8.8
na
22.8
Total Cargo
0.1
80.1
45.1
na
417.9
Sources: Air Transport Intelligence /ACI /Annusi Reports
SWI-4 Air Transport Group, School of Engineering, Qmnfield University
I I I I I I I I I I I I I i I I I I I I I

Competition between Airports and the Application of State Aid Rules Volume II - Country Reports Switzerland
3 Airline Market
3.1 Swiss
The new national airline, Swiss, was launched on 1 April 2002 following a merger between the Swissair and Crossair. (Swissair, the previous national carrier, had been declared bankrupt at the beginning of October 2001). Swiss is some 65% owned by the Federal government and 35% by the private seţctor. The total share capital is CHF 2.7 billion.
The airline currently flies to some 86 European and some 40 non-European destinations and is based predominately at Zurich, with secondary hubs at Basle and Geneva. It estimates that in its first year of operation it will carry approximately 9.8 million passengers. Although Swiss' head office is currently based in Zurich, this is expected to move to Basel in the near future.
Swiss has indicated that, as a national carrier, it currently only operates to main city airports and therefore is prepared to accept relatively higher airport charges, where applicable. It has no plans to establish a low-cost subsidiary airline, at present, although it retains a 'watching brief on this.
3.2 Other Carriers
Other carriers operating under a Swiss licence include the charter airlines, Belair and Edelweiss, EasyJet Switzerland (which operates low-cost scheduled services from Geneva and is 40% owned by EasyJet UK) and Intersky, the latter being a small regional airline offering services from Bern Airport
Air Transport Group, School of Engineering, Cranfíeld University SWI-5

Competition between Airports and the Application of State Aid Rules Volume II ~ Country Reports Switzerland
Airports
EuroAirport Basle-Mulhouse-Freibure (BSD
Ownership and Organisational Structure
Formed under a State agreement in 1949, EuroAirport B§|el Mulhouse-Freiburg is a public
law company under international law domiciled in Fr¡ national airport in the world. Situated on French territo sector connected to Basel via a customs road. The airpoi the French and Swiss government, although the French gj airport land.
The airport is managed by an Executive Board of eij Administrative Council consisting of eight French 1 representatives and two German (non-voting) members. Consultative Committee consisting of six Germaiiļ representative.
2 Type of Airport
It is the only completely bi-the airport has a Swiss customs ssets are jointly owned in trust by
kmment is the sole owner of the
Directors, and overseen by an lal representatives, eight Swiss There is also a tripartite Airport three French and one Swiss
EuroAirport is a comparatively large regional airport prļļļtiding a wide range of scheduled services within the EU, particularly France, Germany ą||f the UK. The airport also has significant cargo traffic.
3 Route Structure and Key Airlines
III L The airport offers scheduled service and charter flights to | | m e 110 destinations (2000). The top four destinations were Paris, London, Zurich, Frankfuji and Palma (charter). A regular transcontinental flight to New York (Newark) was disconÄued in Spring 2000. At present, the airport has not attracted a 'low-cost' operator. CargJIraffic (124,000 tonnes in 2000) is relatively important (EuroAirport is the second largest ļ||eight airport in France after the Aeroport de Paris)
The principal airline, Swiss, carries about 64% of all scneluled service passengers, followed by Groupe Air France with some 25%. The principal chÄer operators are Swiss, Britannia and Air Europa, and the main dedicated cargo carriers, Swilscargo, Korean and DHL.
SWI-6 Air Transport Group, School of Engineering, antield University
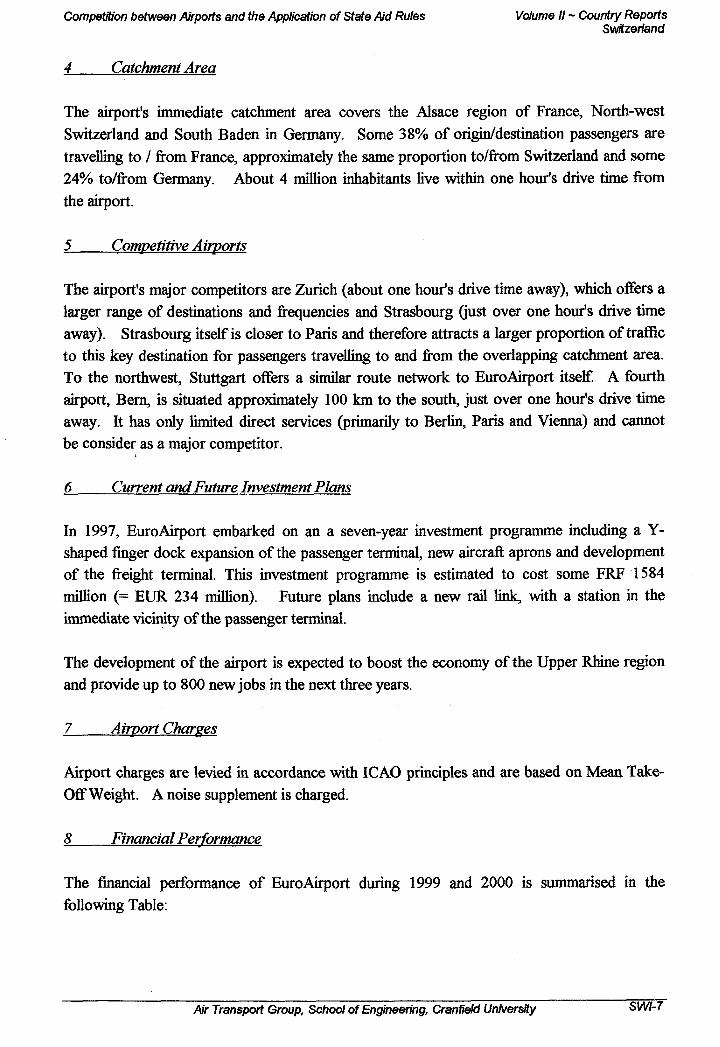
Competition between Airports and the Application of State Aid Rules Volume II ~ Country Reports Switzerland
4 Catchment Area
The airport's immediate catchment area covers the Alsace region of France, North-west Switzerland and South Baden in Germany. Some 38% of origin/destination passengers are travelling to / from France, approximately the same proportion to/from Switzerland and some 24% to/from Germany. About 4 million inhabitants live within one houťs drive time from the airport.
5 Competitive Airports
The airport's major competitors are Zurich (about one hour's drive time away), which offers a larger range of destinations and frequencies and Strasbourg (just over one houťs drive time away). Strasbourg itself is closer to Paris and therefore attracts a larger proportion of traffic to this key destmation for passengers travelling to and from the overlapping catchment area. To the northwest, Stuttgart offers a similar route network to EuroAirport itself. A fourth airport, Bern, is situated approximately 100 km to the south, just over one hour's drive time away. It has only limited direct services (primarily to Berlin, Paris and Vienna) and cannot be consider as a major competitor.
6 Current and Future Investment Plans
In 1997, EuroAirport embarked on an a seven-year investment programme including a Y-shaped finger dock expansion of the passenger terminal, new aircraft aprons and development of the freight terminal. This investment programme is estimated to cost some FRF 1584 million (= EUR 234 million). Future plans include a new rail link, with a station in the immediate vicinity of the passenger terminal.
The development of the airport is expected to boost the economy of the Upper Rhine region and provide up to 800 new jobs in the next three years.
7 Airport Charges
Airport charges are levied in accordance with ICAO principles and are based on Mean Take-Off Weight. A noise supplement is charged.
8 Financial Performance
The financial performance of EuroAirport during 1999 and 2000 is summarised in the following Table:
Air Transport Group, School of Engineering, Cranfield University SWI-7

Compétition between Airports and the Application of State Aid Rules Volume II ~ Country Reports Switzerland
EuroAirport (Basel-Mulhouse) Annual Accounts - ЩпапсШ Year 1999 & 2000
EUR (000)
Balance sheet
Fixed assets
Current assets
Other liquid assets
Total assets
Capital and reserves
Financial debts
Trading debts
Total liabilities
Profit and loss account
Operating income
Operating costs
Operating profit
Net profit
2000
218,110
22,161
40,610
280,880
94,090
158,350
28,440
280,880
66,109
44,990
21,119
215
Note: Exchange rate = 6.56 FRF = i
9 Sources of Funding
Infrastructure investment programme is financed throuį debt, retained earnings and land sales. The current EUR is funded by Swiss government grant (18%), France earnings (22%), commercial debt (43%) and land sales (7 11
JO Public Funding Issues
As indicated in Section BSL.9 above, the airport receives infrastructure from both the Swiss and French govemmi support for its local airport provides regional economic ani
RÍ.00
SWI-8 Air Transport Group, School of Engineering, Cm nfield University
1999
180,607
12,315
9,259
202,181
73,103
110,121
18,957
202,181
61,016
43,114
17,902
174
a mixture of grants, commercial 4 million programme (see above) vernment grant (11%), retamed
rant aid support for towards new ts. The airport emphasises that mployment benefits.
I I
Competition between Airports and the Application of State Aid Rufes Volume il ~ Country Reports Switzerland
ZRH Zurich Airport
I Ownership and Organisational Structure
Zurich Airport is owned and operated by Unique (Flughafen Zurich AG), a semi-limited public company formed in June 2001 following a public referendum in the City of Zurich by the reverse take over of Flughafen-bnmobilien-Gesellschalf (FIG) and Flughafendirektion (FDZ). Some 51% of shares are in private ownership (quoted on the Swiss stock market) and 49% remain with the Canton of Zurich. There are plans to release a further 16% of the Canton Zurich's shareholding to the private sector at some future date. In addition to operating Zurich airport. Unique have recently invested in airports in Chile and India.
A Board of Directors manage Unique; three of the seven board members being representatives of Canton Zurich and other regional and local government organisations.
2 Type of Airport
Zurich is the tenth largest airport in Europe and is a major intercontinental hub. Services are offer to most major European and a variety of non-European destmations with a particular focus on Eastern Europe, the Middle East and southeast and east Asia. Zurich is also an important European cargo hub carrying some 493,000 tonnes in 2001, based on the operations of Swisscargo and UPS.
3 Route Structure and Key Airlines
In 2000, some 49.1% of total passengers travelled on international flights with origin/destination at Zurich. Some 44.4% of passengers transferred at the airport, one of the highest proportions of all European airports. A total of 86.3% of international passengers travelled to European destinations (19.5% to Germany, 8.35% to Italy and 73% to the UK), 5.7% to Asia and 4.2% to North America.
Swiss carries the largest proportion of passengers at Zurich (approx 65%), followed by Lufthansa (3%).
4 Catchment Area
The airport's origin-destination traffic catchment area covers most of Switzerland and a significant area of southern Germany. Its position is boosted by its excellent rail connections (some 51% of passengers access the airport by public transport - the highest proportion of any airport in Europe).
Adr Transport Group, School of Engineering, Cranfíeld University SWI-9
Competition between Airports and the Application of Stete Aid Rules Volume II ~ Country Reports Switzeriand
Competitive Airports
Key competitors for origin-destination traffic include Generi and Munich.
Zurich's strongest competitor for transfer traffic is Fra Paris CDG. The relative strength of these three airp< number of weekly hub connecting flights - Frankfurt 26,913 flights / week and Paris CDG = 26,550 flights/weęll flights/week (source - IATA data 1999).
krt, followed by Amsterdam and ¡s can be illustrated by the total 1,388 flights/week, Amsterdam =
comparison to Zurich = 12,441
Other competitors for transfer traffic include Munich, Lon(l||ļļi and Milan Malpensa.
6 Current and Future Investment Plans
The airport has recently embarked on the Tifth Ехрамюп Phase', a major investment programme involving the creation of a midfield pier lpd airside area, new taxiways, modernisation of the baggage sortation system, a new rail Iprminal and an improved internal road network. This programme, which is the largeşl construction project to date in Switzerland, is expected to be completed in 2005 and is eşffpated to cost approximately HF 2.3 billion (= EUR).
Airport Charges
Airport charges are applied in accordance with ICAO pruil ples and are calculated on Mean Take-Off Weight (MTOW) basis. A special noise/engm|ļļļemissions charge is also applied and there are supplements for nighttime flights.
The noise charges are used to finance a special noise residents. The issue of airport noise has been a controveri the German border, and hitherto, a high proportion of German territory. Following the introduction of a new bi Germany and Switzerland, restrictions have been placed oi with the introduction of noise level Umits by the Bua development of the noise insulation grant programme fi: believes that they are unfairly financially penalised by the line to cover the noise insulation grant scheme has beej negotiations continue with the German government over thi
ilation grant scheme for local one. Zurich Airport is close to
ce off and landings were over feral airspace agreement between sutings over Germany. Coupled
Jsrat (Federal Council) and the local residents, Zurich Airport
regulations. A specific credit I granted by Canton Zurich and ¡ssue.
SWI-10 Air Transport Group, School of Engineering, Ся fieW University

Competition between Airports and the Application of State Aid Rules Volume II ~ Country Reports Switzerland
8 Financial Performance
Unique (Flmhafen Zurich AG) Annual Accounts - Financial Year 2001 & 2001
Balance sheet
Non-current assets
Current assets
Total assets
Shareholders' equity
Long-term debt
Short-term debt
Total liabilities
Profit and loss account
Operating income
Operating costs
Operating profit
Net profit
2001 - EUR (000)
1,706,849
104,110
1,810,959
570,548
859,589
380,822
1,811
368,493
363,699
4,795
(24,658)
2000-EUR (000)
1,376,027
97,945
1,473,973
637,671
484,932
350,685
1,474
357,534
260,959
96,575
61,644
9 Sources ofFtmding
The funding of infrastructure development at Zurich Airport has traditionally been a combination of loan and grant finance from Canton Zurich and its own generated funds. In the case of the current Fifth Expansion Programme, 41.6% is to be funded through internal funds, with the remainder through commercial bank loans, preferential loans from Canton Zurich and special debenture bonds (issued at 4.625% over a five year period).
To ensure its financial stability, Unique is supported by credit lines of some CHF 1.47 billion (= EUR 1.01 million), consisting of CHF 0.60 billion (= EUR 0.41 million) of guaranteed bank credits and CHF 0.87 billion (= EUR 0.60 million) in immediately available credits from Canton Zurich. These credit lines were renegotiated in October 2001 following the collapse of Swissair and the subsequent suspension of Unique's share on the Swiss stock market.
10 Public Funding Issues
As indicated above, public funding from Canton Zurich has been available to develop the airport's infrastructure and, more recently, to subsidise any cash flow difficulties experienced as a result of the collapse of Swissair.
Air Transport Group, School of Engineering, Cranfíeld University SWI-11
Competition between Airports and the Application of Sfare Aid Rules Volume II ~ Country Reports United Kingdom
UNITED KINGDOM (UKG)
1 Government Policy
1.1 Organisational structure
Due in part to geography, the UK has a large number of international and regional airports with significant levels of traffic. The UK has also been one of the leaders in airport privatisation. There are 22 airports with passenger throughput more than 750,000 passengers / annum, Heathrow deals with the largest number of international passengers in the world and almost all of the airports are profitable. There are, of course, many other airports serving remote areas, loss-making and under State ownership.
Irrespective of ownership, all airport activities are regulated by the safety regulation group and (sometimes) the economic regulation group of the CAA. The CAA is answerable in turn to the Department of Transport (or equivalent).
1.2 Regulatory environment
The regulatory environment that has evolved in the United Kingdom (UK) since 1986 has influenced two aspects of airport management: capital finance and airport charges.
Local authorities still own some of the airports that have been included in the study. Until 2001, the ability of these airports to obtain finance for capital investment was restricted by legislation designed to cap local authority borrowing. This prevented municipal undertakings from obtaining funds to finance investment outside the state sector. As a consequence these airports had tended to either rely on internal funds or borrowing from withm the state sector to finance capital expenditure. This restricted has now (2001) been lifted with the result that local authority owned airports are allowed to borrow funds on the open market.
In contrast, those airports owned by private companies have always been permitted to obtain finance from a variety of commercial and non-commercial sources.
Airport charges are also subject to regulatory control. Under the 1986 Airports Act, the aviation industry regulator. The Civil Aviation Authority (CAA), is required to set a limit on airport charges increases over a five year period in order to prevent potential monopolistic abuses. Pricing regulation, also applied to other state and private utilities, is base on a formula known as RPI-X. This formula limits any increase in the level of airport charges to the retail price index minus a sum determined by a combination of factors such as costs, capital investment plans and commercial non-aeronautical revenue. The RPI-X pricing restriction is currently applied to London Heathrow, Gatwick and Stansted, together with Manchester.
•A/r Transport Group, School of Engineering, Cranfield University UKG-1

Competition between Airports and the Application of Sřaře Aid Rules
This form of regulated pricing has some disadvantages. Alti more demand for slots than can be accommodated, the re; the lowest in Europe. The regulated charges at Manchester not encourage airlines to start new services at the expensi There is a move to review regulated charges on the basis this would mean higher charges at the London airports bi value of slots at these airports.
Major airport infrastructure development is subject to I
processes. Manchester runway 2 was approved after a Pubi process to be completed was then exceeded both in time ай Heathrow Terminal 5. Although the planning applicatipi alternative to the existing planning processes is now being so
L 3 Airport ownership policy
UK Government policy towards airports has tended to í should operate as commercial undertakings and govemme ļ encouraging increased airport efficiency through the introdu Airports Act was essentially based on these principles. Fiijļ within the UK associated with an annual turnover in excess limited liability company and, secondly, that the state-o airports included in the study are managed as limited comp airport ownership, three categories exist within the UK:
Private ownership (BAA, Liverpool) Local government ownership (Manchester) Joint local government and private sector ownership
Private ownership is more widespread in the UK compared largest private airport group is BAA pic whose owners! Stansted, Southampton, Aberdeen, Glasgow and Edinburģl group for Liverpool airport and TBI the parent group for Belfast International.
A diminishing number of airports in the UK are owned bi ownership tends to be exercised by local government as Manchester and Leeds-Bradford airports, for example, opeiļļ but ownership is vested in the hands of their respective loc areas of these airports extends across local authority disi consortium of local councils / authorities. However, M
Volume II ~ Country Reports United Kingdom
igh Heathrow is congested with ated airport charges are among re significantly higher, this does of existing Heathrow services. airport operational costs alone; would also reflect the scarcity
th local and national planning Enquiry; the time-scale for this cost by the Public Enquiry into was ultimately successali, an 5ht.
low the principle that airports t policy should concentrate on ion of private capital. The 1986 ly, it required that any airport f £1 million should operate as a īd BAA pic be privatised. All ies. In terms of the structure of
irmingham, Newcastle)
other countries in Europe. The includes Heathrow, Gatwick, Peels Holdings are the parent ton (management), Cardiff and
the state sector. This form of )posed to central government. e as limited liability companies luthorities. Since the catchment s, shares tend to be held by a Lester Airport (although under
UKG-2 Air Transport Group, School of Engineering, Cràìl eld University

I I I I I I I I I I I I I I I I I I I I I
Competňion between Airports and the Application of State Aid Rules Volume II ~ Country Reports United Kingdom
local government ownership) also owns Bournemouth, Humberside and East Midlands airports.
Luton Borough Council wholly owns the assets of Luton airport; the management of the airport is, however, the responsibility of TBI under a 30-year concession.
Mixed private-public ownership is also common. Aer Rianta (the Irish airports operator) and Macquarie Bank have a part share of Birmingham airport, Copenhagen has a part share of Newcastle airport and in June 2002 it was announced that the local authority owners of Norwich plan to sell 75% of their ownership interests in order to fund future development work.
/. 4 Air Service Agreements
UK airlines have taken full advantage of the EU Third Package and are now spreading eastwards into Europe. However, the UK is one of few European countries to have not signed an Open Skies agreement with the USA. This effectively means that only British Airways, Virgin Atlantic, United and American can operate out of Heathrow while the others have to operate out of Gatwick or regional airports. Other air service agreements allow Emirates and Singapore to operate out of Manchester as well as Heathrow.
1.5 Public Service Obligation (PSO) routes
There are 12 routes in Scotland that have been designated as PSO. This represents 26% of the total number of scheduled departures within Scotland and 10% of the total number of seats on Scottish internal scheduled services. Details of traffic and subsidy levels are shown in the following Table.
Group
1
2
3
4
Rouies
Glasgow - Barra
Glasgow - Campbeltown
Glasgow - Tiree
Stornaway - Benbecula
Benbecula - Barra
Kirkwall - Papa Westray
Kirkwall - North Ronaldsay
Lerwick - Foula
Lerwick-Fair Isle
Lerwick - Out Skerries
Lerwick - Papa Stour
Sumburgh - Fair Isle
Passenger Traffic
(2000)
17,278
12,218
6,863
4,523
Annua Subsidy
(2000)
£1,000,000
£282,616
£170,000
£232,000
Subsidy per
Passenger (2000)
£57.87
£23.13
£23.77
£51.13
I _
Air Transport Group, School of Engineering, Cranfield University UKG-3
Competition between Airports and the Application of State Aid Rules
Group 1 PSOs are issued and subsidised by the Scottish are issued and subsidised by the Western Isles Coundį Ori Islands Council respectively. The levels of subsidy per j Western Isles and Orkney. However, subsidy per passei services mid between Glasgow and Barra, Tiree and Campb other routes.
Volume II - Country Reports United Kingdom
Έ4 butive, while Groups 2, 3 and 4 ey Islands Council and Shetland senger are very similar in the
er on the Shetland inter-island :own is nearly double that of the
UKG-4 Air Transport Group, School of Engineering, Cr< īeld University
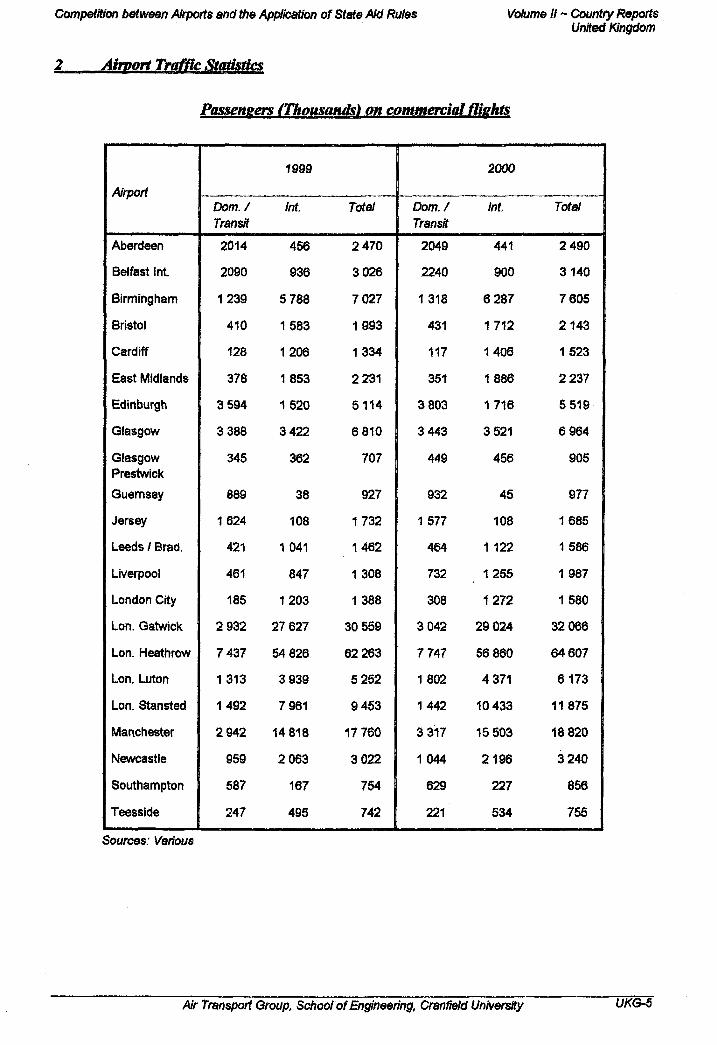
I I I I I I I I I I I I I I I I I I I I I
Competition between Airports and the Application of State Aid Rules
iinort Traffic Statistics
Volume II - Country Reports United Kingdom
Passeneers (Thousands) on commercial flwhts
Airport
Aberdeen
Belfast Int.
Birmingham
Bristol
Cardiff
East Midlands
Edinburgh
Glasgow
Glasgow Prestwick
Guernsey
Jersey
Leeds / Brad.
Liverpool
London City
Lon. Gatwick
Lon. Heathrow
Lon. Luton
Lon. Stansted
Manchester
Newcastle
Southampton
Teesside
Dom./ Transit
2014
2090
1239
410
128
378
3 594
3 388
345
889
1624
421
461
185
2 932
7 437
1313
1492
2 942
959
587
247
1999
Int.
456
936
5 788
1583
1206
1853
1520
3 422
362
38
108
1041
847
1203
27 627
54 826
3 939
7 961
14 818
2 063
167
495
Total
2 470
3 026
7 027
1993
1334
2 231
5114
6 810
707
927
1732
1462
1308
1388
30 559
62 263
5 252
9453
17 760
3 022
754
742
Dom./ Transit
2049
2240
1318
431
117
351
3 803
3 443
449
932
1577
464
732
308
3 042
7 747
1802
1442
3 317
1044
629
221
2000
Int.
441
900
6 287
1712
1406
1886
1716
3 521
456
45
108
1 122
1255
1272
29 024
56 860
4 371
10 433
15 503
2196
227
534
Tora/
2 490
3140
7 605
2143
1523
2 237
5 519
6 964
905
977
1685
1586
1987
1580
32 066
64607
6173
11875
18 820
3 240
856
755
Souroes.' Various
Air Transport Group, School of Engineering, Cranfield University UKG-6
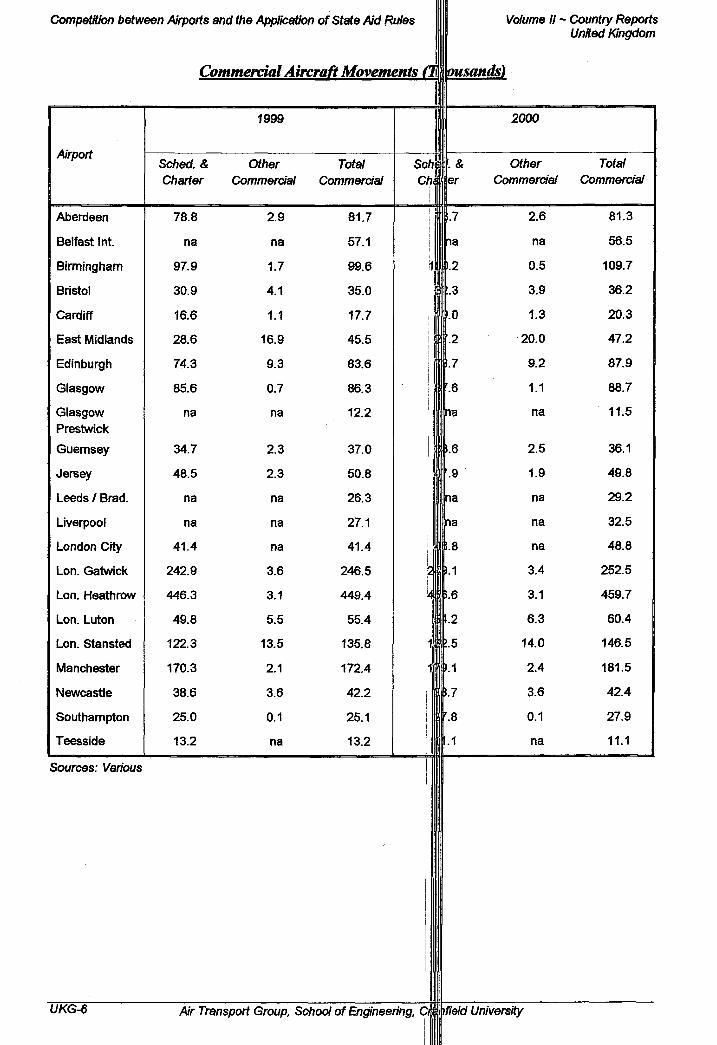
Competition between Airports and the Application of Stete Aid Rules Volume II ~ Country Reports United Kingdom
Commercial Aircraft Movements fmpusandsi
Arport
Aberdeen
Belfast int.
Birmingham
Bristol
Cardiff
East Midlands
Edinburgh
Glasgow
Glasgow Prestwick
Guernsey
Jersey
Leeds / Brad.
Liverpool
London City
Lon. Gatwick
Lon. Heathrow
Lon. Luton
Lon. Stansted
Manchester
Newcastle
Southampton
Teesside
Sources: Various
Sched. & Charter
78.8
na
97.9
30.9
16.6
28.6
74.3
85.6
na
34.7
48.5
na
na
41.4
242.9
446.3
49.8
122.3
170.3
38.6
25.0
13.2
Í999
Other Commercial
2.9
na
1.7
4.1
1.1
16.9
9.3
0.7
na
2.3
2.3
na
na
na
3.6
3.1
5.5
13.5
2.1
3.6
0.1
na
Total Commercial
81.7
57.1
99.6
35.0
17.7
45.5
83.6
86.3
12.2
37.0
50.8
26.3
27.1
414
246.5
449.4
55.4
135.8
172.4
42.2
25.1
13.2
Schl & Ch¡ er
.7
ia
1н * •M
! LO
.2
ι ·γ
'.6
na
I.6
•.9
na
na
ì.8
2 M
'Ą 5.6
1.2
1 »5
1 M
Ì.7
r.8
I '-'
2000
Other Commercial
2.6
na
0.5
3.9
1.3
20.0
9.2
1.1
na
2.5
1.9
na
na
na
3.4
3.1
6.3
14.0
2.4
3.6
0.1
na
Total Commercial
81.3
56.5
109.7
36.2
20.3
47.2
87.9
88.7
11.5
36.1
49.8
29.2
32.5
48.8
252.5
459.7
60.4
146.5
181.5
42.4
27.9
11.1
UKG-6 Air Transport Group, School of Engineering, Çtmfield University
I I I I I I I I I I I I I I I I I I I I I

СотрвШюп between Airports and Vìe Application of State Aid Rules Volume II ~ Country Reports United Kingdom
Freiņht and Mail (Thousands of tonnes)
Airport
Aberdeen
Belfast Int.
Birmingham
Bristol
Cardiff
East Midlands
Edinburgh
Glasgow
Glasgow Prestwick
Guernsey
Jersey
Leeds /Brad.
Liverpool
London City
Lon. Gatwick
Lon. Heathrow
Lon. Luton
Lon. Stansted
Manchester
Newcastle
Southampton
Teesside
1999
Freight
4.6
26.0
28.6
0.1
0.4
128.9
18.0
9.1
40.8
5.1
6.5
0.2
25.4
0.7
294.6
1,265.8
27.4
179.7
107.7
0.8
0.7
2.8
Май
1.3
14.5
1.7
8.3
2.4
13.5
30.2
3.0
na
2.9
2.1
5.9
16.8
na
19.0
89.6
na
14.3
4.6
3.4
na
na
Total Cargo
5.9
40.5
30.3
8.4
2.8
142.4
48.2
12.1
40.8
8.0
8.6
6.1
42.2
0.7
313.6
1,355.4
27.4
194.0
112.3
4.2
0.7
2.8
Freight
4.5
30.9
10.3
0.1
1.1
179.1
18.1
8.8
41.6
5.0
6.3
0.7
29.7
0.7
319.6
1,307.1
36.6
168.7
117.9
0.6
0.3
3.0
2000
1.4
14.6
1.8
8.7
2.6
14.4
34.8
2.9
na
2.9
2.2
6.0
17.1
na
18.6
95.0
na
14.8
4.1
3.7
na
0.1
Total Cargo
5.9
45.5
12.1
8.8
3.7
193.5
52.9
11.7
41.6
7.9
8.5
6.7
46.8
0.7
338.2
1402.1
36.6
183.5
122.0
4.3
0.3
3.1
Sources: Various
Ar Transport Group, School of Engineering, Cranfíeld University UKG-7

Competition between Airports end the Application of State Aid Rules Volume II ~ Country Reports United Kingdom
Airline market
3.1 British Midland
British Mdland (BM) was established as Air Schools m 19 1949 and Derby Airways ten years later. The British MdŁ 1964 and four years later Minster Assets, an investment airline. In 1978 a management buyout took place. Airline! formed in March 1987 to act as a holding company fi Services. In 1988 SAS acquired 40% of ABH and in 19971 although the shares remain in comparatively few hands, bi EM'S equity from Star Alliance partner SAS and the airlini 1st 2000. In February 2001 the airline changed its brand to the airline commenced transatlantic services from International Airport using Airbus A330-200, non-stop Chicago (Шаге International Airport will follow from 8 develop Manchester into the second UK hub for Star Alliani
and became Derby Aviation in Airways name was adopted in
Id banking group, acquired the |rf Britain Holdings (ABH) was British Midland and Aviation ffi became British Midland pic
?99 Lufthansa acquired 20% of Joined the Star Alliance on July
British Midland, bi May 2001 fhester to Washington Dulles
ices between Manchester and hine 2001. BM also intends to
3.2 BmiBabv
A low fare start-up by bmi British Midland, based at East Įdlands airport and now Cardiff planning to compete against other low-cost established air|ļ|es, BmiBaby started operations to European holiday destinations on 23 March 2002, operai ;B737-300,s.
3.3 Britannia
Britannia began operations as Euravia operating Lockh© holidays for Universal Sky Tours, in 1962. In 1964, th< Bristol Britannia's and the current name was adopted subsidiary of the International Thomson Organisation in 1 immediate parent company, the Thomson Travel Group (j and its airline, Orion Airways, which was integrated int Group was floated on the stock exchange in May 199| Company. Besides Britannia, TTG includes Lunn Poly, Tl Philip Group, Crystal International Travel Group, Budget 1997 Britannia formed a wholly owned subsidiary, Brit operate long and short haul flights from airports in Gei German tour operators. The beginning of 1998, saw th holiday operation. Fritidsresor Group, by TTG with Brit Blue Scandinavia, now renamed Britannia AB. In May 20ÖJ bid £1.8 billion for Thomson, Britannia's parent company.
constellations on inclusive tour rline began re-equipping with
¡tannia became a wholly owned SS. In August 1988, Britannia's TG), purchased Horizon Travel iritannia. The Thomson Travel and became a Public Limited Holiday Cottages Group, Port
bvel and Fritidsresor Group, bi ¡a GmbH, based in Germany to ly, Switzerland and Austria for acquisition of the Scandinavian ia acquiring the group's airline, ļ German tour company Preussag IC regulators cleared the deal in
UKG-8 Air Transport Group, School of Engineering, Cŕmfíeld University

Competition between Airports and the Application of State Aid Rules Volume II ~ Country Reports United Kingdom
July 2000 and Thomson became a wholly owned Preussag (TUI Group) subsidiary on the 18 August 2000.
3.4 British Airways
In 1935 a number of smaller UK air transport companies merged to form the original privately owned British Airways Limited. Following a Government review, Imperial Airways and British Airways were nationalised in 1939 to form British Overseas Airways Corporation (BOAC). After the Second World War, BOAC continued to operate long haul services other than routes in South America Airways, which were flown by British South America Airways until its merger back into BOAC m 1949. Continental European and domestic flights were flown by a new airline British European Airways (BEA). In 1967 the government set up another study into the industry. It recommended a holding board to be responsible for the two main airlines, BOAC and BEA, with the establishment of a second force airline brought about by unifying various independents. As a result British Caledonian was bom in 1970, when the original Caledonian Airways took over British United Airways. Two years later, the business of BOAC and BEA were combined under the newly formed British Airways Board, with the separate airlines coming together as British Airways in 1974. Although this merger was to lead initially to substantial financial losses and industrial strife, the new airline inherited its predecessors' pioneering path, launching the world's first supersonic passenger service with Concorde in January 1976.
In July 1979, the Government announced its intention to sell shares in British Airways. In February 1987 British Airways was privatised. British Airways announced a merger with British Caledonian in July. In January 1993, В A formed an alliance with US Airways, which involved the purchase of $300 million of a new series of US Airway s convertible stock, but later sold its stake. A 49% holding was also acquired in France's leading independent carrier, TAT European Airlines, in 1992 and this was later increased to 100% before В A decided to withdraw from French domestic operations. В A also acquired 49% of Friedrichshafen-based regional carrier Delta Air Regionalflug (since re-named Deutsche BA). In 1993 BA bought a 25% share in the Australian national airline Qantas for £290 million. At the end of 1998, British Airways agreed to acquire CityFlyer Express, a British Airways franchise, for £75 million. In February 1999, British Airways announced it would acquire a nine percent stake in Iberia Lineas Aereas de Espana SA as part of the Spanish airline's privatisation programme. On 21 September BA withdrew from merger talks with KLM, which had been ongoing since June 2000. In November 2000, BA announced much-improved second quarter financial results and put its Go subsidiary up for sale . In December 2000 BA restructured its loss-making Gatwick operation, reducing long-haul flights from 43 to 25 and cutting around 1000 jobs.
Following the terror attacks in the USA, В A cut flight operations by 10%, withdrew 16 wide
Air Transport Group, School of Engineering, Cranfield University UKG-9

Competition between Airports and the Application of Sfare Aid Rules Volume II ~ Country Reports United Kingdom
bodies and four narrow bodies from its fleet, and axed 7,Q§| jobs in order to cope with the reduction in passenger demand.
3.5 easy Jet
Pan European, low cost airline established in 1995 opj services for both leisure and business passengers. Serving 1 Europe. Stelios Haji-Ioannou launched easyJet in Noveml operating two routes to Glasgow and Edinburgh from Loni additional operations from Liverpool airport. In March 1 ' in TEA Switzerland. For much of 2000, easyJet was charges with Barclays Bank, the majority owners of Londoi Partly as a result of this, easyJet increased its operational p: airports. Floated on the London Stock Exchange in Octoļ Deutsche В A and recently purchased Go (2002)
¡ating frequent daily scheduled pities with 40 routes, throughout
1995 with two leased aircraft |n Luton. In 1997 easyJet began easyJet purchased a 40% stake
)lved in a dispute over airport Λΐίοη, its main operational base.
¡sence at Liverpool and Schiphol |r 2000. Now has an option on
M Go
Go is a low-cost, low-fare airline based at London Stanstedļļknd flies throughout Europe. Set up by British Airways to compete in the growing low fare plprations out of London Stansted, subsequently brought out by management / investment çqflipany and now (2002) likely to become part of the easyJet empire
i. 7 Monarch
A charter carrier operating on routes to Europe, USA, th| Caribbean, India, Africa, mainly leisure destinations. Also operates a scheduled service (uller the Monarch Crown Service brand) from London Luton to Tenerife, Faro, Malaga, Alilante, Mahon and Gibraltar. Est. 1968 Founded in 1967 to provide capacity to UK tour <ļ§|erators, Monarch has grown to become one of the largest UK charter airlines.
3.8 Virgin Atlantic
Virgin Atlantic was created in 1984. It has become the Ш of passengers and freight, flying over three million paşi business and leisure markets. Virgin is based at both Airports, and operates long-haul services from Heathrov^ Los Angeles, Chicago, San Francisco, Washington, ML Shanghai and Johannesburg; and from Gatwick to Bostļ Antigua, Newark and Athens, as well as Manchester to Shanghai were launched on 22 May from London/Heathroj May, offering flights to 13 Mediterranean destinations.
second largest long-haul carrier igers a year, and serving both kdoris Heathrow and Gatwick
New York (Newark and JFK), , Tokyo, Hong Kong, Athens, Orlando, Barbados, St. Lucia,
Hando. Most recent- Services to and Virgin Sun was launched in the end of 1999 a code share
UKG-10 Air Transport Group, School of Engineering, Crømfefcr University

Competition between Airports and the Application of Sfare Aid Rules Volume II ~ Country Reports United Kingdom
agreement with Air-India was announced. Under this arrangement Virgin will use up to six frequencies allocated to Air-India in the India-UK Air Services Agreement, showing the Air-India code on its flights. The code share started on 5 July 2000, with two flights per week between London and Delhi. Not attached to an alliance but partly owned by Smgapore airlines.
Air Transport Group, School of Engineering, Cranfield University UKG-11

Competition between Airports and the Application of State Aid Rules Volume II ~ Country Reports United Kingdom
4 Airports
Belfast City
I Ownership and organisational structure
Belfast City is owned by a multinational public с о т ш » (Bombardier) registered in Montreal Canada. The airport is responsible for providing Л е , security, passenger and ramp handling and car parking. Policing is provided by the stať J there is no duty free and some airlines undertake passenger handling. Environmental conslramts include operating hours (0630 - 2130 hrs) and aircraft movements (45,000 АТЩ / annum under local planning agreements).
2 Type of airport
Belfast City almost exclusively caters for the scheduled general aviation and limited charter and cargo traffic. The As the airport is owned by Bombardier, other traffic >vill company. Due to runway constraints the largest aircraft tl (190 seats). Due to the presence of Stormont Castle, almf airport.
i Route structure and key airlines
The main route is served is that between Belfast and destinations also being served. At present, British Midla scheduled domestic maricet followed by British European aril
domestic market with some Jis no low-cost airline presence.
linked to the activities of that ¡can use the airport is the A321
all government traffic uses the
idon with other UK domestic
has the largest share of the
łritish Airways.
4 Catchment area III
The catchment area is compact, with 50% of the populatiolpf Northern Ireland and 60% of the industry being within a driving time of 15 minutes from me airport. The catchment areas of City and Belfast International overlap. The airport is a l o located close to the political centre of the province, Stormont Castle. The catchment |§rea is measured by origin and destination surveys supported by population statistics.
5 Competing airports
The principal competing airport is Belfast bitemational, Ì4iked 20 miles to the northwest.
The competing market segment is the low-cost domestic lamers at International and the lillil
ι Į . UKG-12 Air Transport Group, School of Engineering, Ctìmfield University

Competition between Airports and the Application of State Aid Rules Volume II ~ Country Reports U näed Kingdom
main-line domestic carriers at City. It is believed that marginal pricing (airport charges)deals have been used to attract the low-cost carriers to International with the intention of increasing market share at the expense of the main-line carriers.
The second competing airport is Londonderry located 80 nules to the northwest of City. The competing market segment is again the low-cost domestic flights but there is little impact on City as the natural catchment of Londonderry does not overlap with that of City. However, it is considered that the low-cost operator is benefiting by subsidised airport charges in order to draw local traffic into Londonderry.
The third competing airport is Dublin, located 100 miles to the south where the competing market segments are again the low-cost airlines and also charter operations.
6 Current andfiiture investment plans
Recent investments include rebuilding of the arrivals area in 1997 at a cost of £1.1 million towards which the government contributed 20%, and in 2001 the construction of a new terminal, apron, taxiways and car parks at a cost of £21 million. The cost of the latter was 100% funded internally by the owners. Future investment includes an extension to the new terminal (£4.1 million), construction of road underpass (£1.0 million), ILS upgrade to Cat ΠΙ (£1.5 milhon), all of these in 2002 and the following year (2003) will see the main runway resurfaced at a cost of £5.0 million. All future investment will be funded internally.
Specific surface infrastructure projects in the last ten years include a new road junction constructed at a cost of £300,000 with a 100% financial contribution by the airport. Future expenditure meludes the road underpass mentioned in the previous paragraph.
7 Airport charges
Airport charges include take-off, landing, passenger service, aircraft parking, aerodrome ATC, air bridges and security. The main charges are based on passenger numbers and charges are reviewed annually. Discounts are available for new airlines, new routes and volume discounts, the latter being a function of passenger numbers.
8 Financial per formance
Standard rate corporation tax is paid at 30%.
Current accounting practice is to use straight-line depreciation over the following periods:
Terminal and buildings 20 years Runways, taxiways and aprons 40 years
Air Transport Group, School of Engineering, CranMd University UKG-13

Competition between Airports and the Application of State Aid Rules
Plant and machinery Terminal / airport systems Vehicles, equipment
5 year! 10 year! 5 years
Summary of Profit and Loss Accou
Year ending
Total income
Staff costs
Security costs
Policing costs
Depreciation
Other costs
Total costs
Operating profit
Interest paid
Pre-tax profit
Taxation
Net proñt
Dividends paid
Retained profit
9 Sources of funding
The airport received RDF funding for 20 approximate value £250k. No further pul
10 Public funding issues
No public funding issues.
UKG-14 Air Transport Group, Sc
31/3/2001 |
11777597 \
5 278 423
-
630 788
4 698 571 |
10607 782 ï
1 169 815 |
5 897
1 163 918
742 947 |
7 914 000
-
420 971 |
í
% of the extension t )lic sector grants ex]
hod of Engineering, Crs
Volume II ~ Country Reports United Kingdom
I
та/т Γ
J 31/3/2000
J 11489 867
5 162 433 --
591 229 f 4 211540 J 9 965 202 Į 1 524 665
f 7 640 1517025
| 406 117 6 901 000
II || 1110 908
the original terminal in 1997, cted in the future.
1 lefcf University
I I I

Competition between Airports and the Application of State Aid Rules Volume II ~ Country Reports Unfted Kingdom
Bristol
1 Ownership and organisational structure
Bristol is a private sector company whose current ownership is split between Macquarie Bank (50%) and Cintra (50%), note that Macquarie Bank now also own 20% of Birmingham Airport. The Board of Directors includes a Managing Director, Commercial Director, Finance Director and two Board Members from each shareholder group.
The airport is responsible for Air Traffic Control and Car parking. Passenger and ramp handling is undertaken by Servisair and British Airways, security by Initial Aviation Security and duty-free by Nuance.
There is a night noise quota similar to Stansted (presently being reviewed) similar to Stansted for the hours between 2300 and 0600. Noise monitoring is being undertaken as the airport I located in the green belt. The new terminal required a public enquiry.
2 Type of airport
Key market segments are domestic scheduled (including low-cost), international (intra-EU) scheduled (including low-cost), and charter both EU and non-EU.
Domestic flights Terminal Passengers (total) Cargo (tonnes - total) ATMs (total)
Scheduled 411 034
1 na
Charter 2 001 8 712
na
Total 413 035
8 713 17 481
International fBghts (Intra EU) Terminal Passengers (total) ATMs (total)
Scheduled 572 094 12 518
Charter 974 592
5 207
Total 1 546 686
17 725
International flights (non-EU) Terminal Passengers (total) ATMs (total)
Scheduled 2 136
25
Charter 163 657
954
Total 165 793
979
3 Route structure and key airlines
Latest data on the scheduled domestic route network indicated that this is dotninated by GO (60%) followed by British Airways / Bryon (30%) and British European (10%). The
Air Transport Group, School of Engineering, Cranfleld University UKG-15

Competition between Airports and the Application of State Aid Rules Volume II ~ Country Reports United Kingdom
scheduled intra-EU market was also dominated by GO (||%), the remaining share being taken by British Airways and Ryanair. Charter operations equally divided between Britannia, Air 2000 and Monarch.
4 Catchment area
For scheduled domestic traffic 90% of all passengers live
kh EU and non-EU) are almost
fthin 90 minutes driving time of the airport, the catchment overlapping with that of Cardifll A similar definition is used for origin / destination scheduled international traffic but in tMs lase the catchment overlaps with that of Heathrow, Gatwick and Birmingham. The intematidijal charter catchment is 90 % of all passengers live within 120 minutes driving time, the çlfphment overlapping m this case with Gatwick and Cardiff airports.
The catchment areas are determined using CAA data and palienger surveys
A significant volume of advertising expenditure is required Jo attract the population located ! I l
in the natural catchment of the airport, the mam attraction tøsfng Heathrow that is 'just up the road'.
Competing airports
The principal competitor is Heathrow, located 100 mileaļIIļeast of Bristol. The competing market segment is intra-EU scheduled services where Healirow has a significant advantage in terms of product range, choice of airlines and service freqiincies.
ist south east of Bristol. The |d charters where Gatwick has a ι and service frequencies.
[fest of Bristol. Cardiff competes charter traffic located in the
The second competitor is Gatwick, located 120 miles competing market segment is intra-EU scheduled services significant advantage in terms of charter products, destinati
The third competitor is Cardiff, located by road 50 miles with Bristol in all market segments but particularly overlapping parts of the respective airport catchments.
6 Current and future investment plans
The previous owners (First Group / Bristol) had unJitaken a significant investment programme during the past five years (1996-2001). This mclioed:
New terminal building (£33 million) New control tower (£4 million) Diversion of the A3 8 road (£4 million)
UKG-16 Air Transport Group, School of Engineering, Cfmfield University
I I I I I I I I I I I I I I I I I I I I I

Competition between Airports and the Application of Srare Aid Rules Volume II ~ Country Reports United Kingdom
All of the above were funded by in-house funds with no government support.
Future planned investment programmes melude the construction of an extension to the recently constructed mam terminal at an estimated cost of £25 million. Abbey national funded the purchase of the airport for the present shareholders, there is a facility agreement to draw on further fonds for future investment. Therefore, the new terminal will be funded by in-house cash flow and a loan from Abbey National, there will be no government funding.
With the exception of the A3 8 road diversion (see above) there has been no airport-related surface infrastructure constructed in recent years. In the future there will be is a feasibility study into a link road to improve airport access but the costmgs and financial contribution of the airport are not decided yet.
7 Airport charges
Airport charges include landing, passenger service charge, aircraft parking, security and noise / night flight supplements. ATC charges are included in the landing charge. The landing charge is a function of the MTOW. The passenger service charge is calculated according to type of aircraft. The charges are revised annually.
Actual published charges are quite high and rebates are available through, for example, marketing support grants. These are available from the airport for 'start-up' services (new operator, new routes) and volume based discounting is based on commercial deals with individual carriers, the latter tend to go through a selection process comparing one airport with another. Tour operators move aircraft from one airport to another according to capacity not charges. Airport marketing is now becoming more of an exact science.
8 Financial performance
Standard rate corporation tax is paid at 30%.
Current accounting practice is to use straight-line depreciation over the following periods:
Terminal and buildings 50 years
Runways, taxiways and aprons 30 years Plant and machinery 5-15 years Terminal / airport systems 3-15 years Vehicles, equipment 4-11 years
AJr Transport Group, School of Engineering, Crànfíeld University UKG-17

Competition between Airports and the Application of State Aid Rules
Summary of Profit and Loss Accomk (UK£)
Volume II - Country Reports United Kingdom
Year ending
Aeronautical income
Concession income
Other income
Total income
Staff costs
Security costs
Policing costs
Depreciation
Other costs
[ Total costs
Operating proM
Interest received
Interest paid
Extraordinary items
Pre-tax prolit
Taxation
Net prom
Dividends paid(1)
Retained profit
31/3/2001
20 201 000
3 298 000
16 180 000
39 679 000
6 528 000
1 435 000
2 734 000
18 492 000
29 189 000
10 490 000
17 000
1 182 000
9 325 000
1 411 000
7 914 000
12 000 000
-4 086 000
31/ЗЯ\ lo
16 589 DO
3 312 DO
11417 pO
313ÍS ho
5 977 DO
1 132 DO
1597 DO
12 762 tra
2 Í468 ГО
9 850 DO
682 pO
679 pO
9 853 DO
2 952 1)0
6 90f Ю
2 760 DO I 4141 Jrø
31/3/1999
14 641 000
4 755 000
10 000 000
29396 000
6 807 000
946 000
1 535 000
9 493 000
18 781 000
10 615 000 |
401 000
63 000
10 953 OOO |
3 122 000 |
7 831000 |
2 802 000 |
5 029 000 |
d) Paid to First Group / Bristol
Sources of funding
Most recent source of external fimding has been commerci I bank loans (Abbey National). There has not been any receipt of government / EU graļ|ļts or loans under the present ownership nor is there expected to be in the future.
10 Public funding issues
No public fimding issues
ÜKG-18 Air Transport Group, Schod of Engineering, Cra/raffe/d University
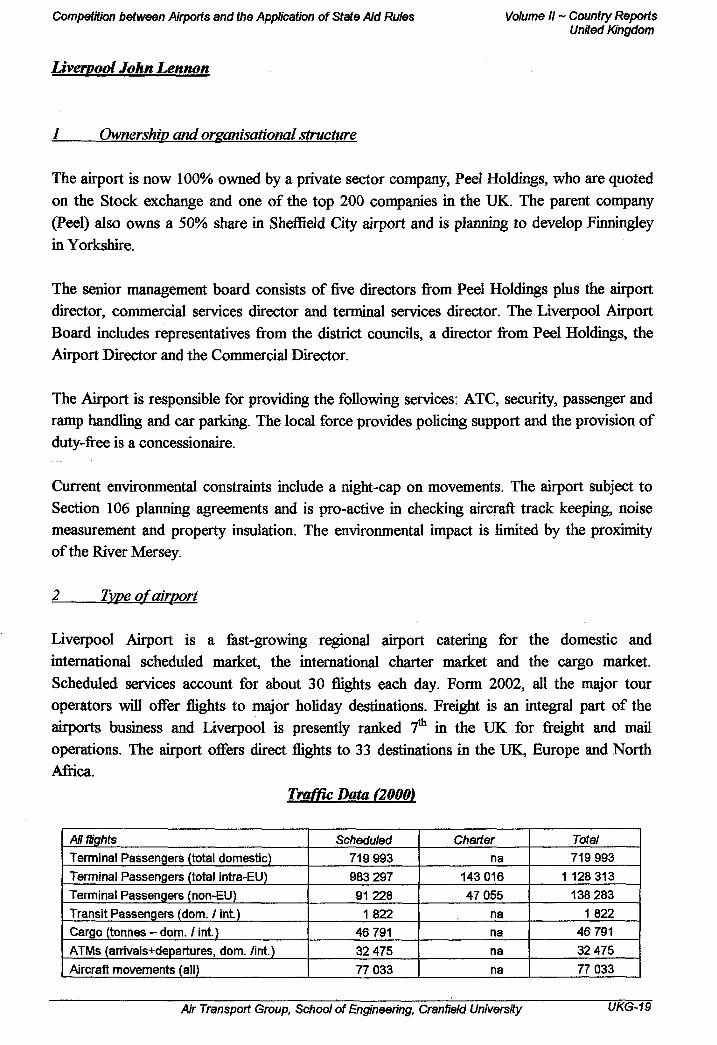
Competition between Airports and the Application of State Aid Rules Volume II ~ Country Reports United Kingdom
Liverpool John Lennon
1 Ownership and organisational structure
The airport is now 100% owned by a private sector company, Peel Holdings, who are quoted on the Stock exchange and one of the top 200 companies in the UK. The parent company (Peel) also owns a 50% share in Sheffield City airport and is planning to develop Finningley in Yorkshire.
The senior management board consists of five directors from Peel Holdings plus the airport director, commercial services director and terminal services director. The Liverpool Airport Board includes representatives from the district councils, a director from Peel Holdings, the Airport Director and the Commercial Director.
The Airport is responsible for providing the following services: ATC, security, passenger and ramp handling and car parking. The local force provides policing support and the provision of duty-free is a concessionaire.
Current environmental constraints include a night-cap on movements. The airport subject to Section 106 planning agreements and is pro-active in checking aircraft track keeping, noise measurement and property insulation. The environmental impact is limited by the proximity of the River Mersey.
2 Type of airport
Liverpool Airport is a fast-growing regional airport catering for the domestic and international scheduled market, the international charter market and the cargo market. Scheduled services account for about 30 flights each day. Form 2002, all the major tour operators will offer flights to major holiday destmations. Freight is an integral part of the airports busmess and Liverpool is presently ranked 7th in the UK for freight and mail operations. The airport offers direct flights to 33 destmations in the UK, Europe and North Africa.
Traffic Data (2000)
AllfSahts Terminal Passengers (total domestic)
Terminal Passengers (total intra-EU) Terminal Passengers (non-EU)
Transit Passengers (dom. / int.) Cargo (tonnes - dom. / int.)
ATMs (arrivals+departures, dom. /int.)
Aircraft movements (all)
Scheduled 719 993
983 297 91228
1822 46 791 32 475
77 033
Charter na
143 016
47 055 na na
na
na
Total 719 993
1 128 313
138 283 1 822
46 791 32 475
77 033
Л/г Transport Group, School of Engineering, Cranfíeld University UKG-19

Competition between Airports and the Application of State Aid Rules Volume II ~ Country Reports United Kingdom
3 Route structure and key airlines
Major airlines operating out of Liverpool include Airtoursļ iritannia, easyJet, Monarch and Ryanair. Major destinations include Belfast, Amsterdam, l ip of Man, Dublin, Malaga and Barcelona. The principal airlines for each market segment arej[|hown in the following Table.
Traffic type
Scheduled domestic
Scheduled intra-EU
Scheduled International (non-EU)
Charter intra-EU
Charter international (intra-EU)
hairline
EZY
EZY
ļ 2n d mříne
JE
FR
EZY 1
MON
MON ļ I
Catchment area
It is estimated that 6 million people live within a one-hour d i te of Liverpool airport and that over 60% of Liverpool's passengers originate from outsiql the Merseyside area. For the scheduled domestic market segment, 80% of the passengers; Jlme from the NW region. There is a notional overlap for this market with Manchester but thalcheduled traffic at Liverpool is
į j | ļ
predominantly low cost which has a diflferent catchment to reif lar scheduled traffic.
The charter catchment overlaps 65% with that of Manchester coming from Merseyside and 90% from the NW Region.
ith 65% of charter passengers
Market segment catchments are evaluated by in-house analystf (including the investigation of potential new routes to Brussels, Paris, Germany and Itallf) and CAA passenger survey (1999).
5 Competing airports
The principal competitor to Liverpool is Manchester (the laifSpt and dominant airport in the NW), the latter being located 30 miles to the east by тотУкуау. Main competition is for charter services and major airlines at Manchester competiņļļ|ļvvith easyJet at Liverpool for traffic on common routes.
Current and future investment plans
Investment programmes in past five years (1996-2001) ai|ļļ summarised in the following Table.
UKG-20 Air Transport Group, School of Engineering, CrarMld University

I I I I I I I I I I I I I I I I I I I I I
Competition between Airports and the Application of State Aid Rules Volume II ~ Country Reports United Kingdom
Application
Terminal
Hangers, Apron, Car Park, Control Tower (50%)
Amount
£32.5 m
£17.5 m
Source(s) of funds
75% Peel Holdings
Peel Holdings
%Govt funding
25% ERDF
Future investment programmes between 2002 and 2011 are summarised in the following Table.
Application
Runway + Apron, car park, Control tower (50%)
Amount
£30 m
Source(s) of funds
80% Peel Holdings
%Govt funding
20% ERDF
Airport access surface infrastructure construction completed in recent years only includes a road extension to the A57 and included a contribution to the costs of £1.5 million by the airport.
In 2005 a transport modal interchange will be constructed at Allerton (5 km from airport) to serve Merseyrail, Intercity rail services and buses. The source of funding will be shared between the Airport and Merseytravel.
7 Airport charges
Airport charges melude landing charges (MTOW), passenger service (including security), aircraft parking (MTOW, time), aircraft hangerage, and apron handling and equipment charges. Charges are set and reviewed each year.
The Airport actively encourages Airlines and Tour Operators to introduce new services and destinations and to develop and grow their existing operations from the airport. To support this growth and development the Airport offers discounts on its published fees and charges. Discounts (including volume discounts) are available to all existing and potential Airlines and Tour Operators wishing to increase their services or commence operations from the Airport.
8 Financial performance
As the airport is loss making there is currently no liability for corporation tax.
Current accounting practice is to use straight-line depreciation over the following periods:
Terminal and buildings 50 years
Air Transport Group, Scftoo/ of Engineering, Cranfield University UKG-21

Competition between Airports ano the Application of State Aid Rules
Runways, taxiways and aprons Plant and machinery Terminal / airport systems Vehicles, equipment
100 yea 15 yearsjl 10 yearsJH 5 years
Volume II ~ Country Reports United Kingdom
It is stated that there is no subsidisation as, for accounting from the parent Peel Group.
>oses, the company is separate
The following Table shows the Profit and Loss Account forjfjļp years ending 31 March 2000 / 2001.
(Ж£ / Year ending 31 March
Turnover
Total income
Direct costs
Expenses
Exceptional item
Total costs
Operating profit
Interest paid
Pre-tax proM
Taxation
Net profit
2001
12 399 128
Í 2 399Í28
6 518 349
5 646 457
4 603 000
16 767 806
-4 368 678
1 562 970
- 5 931 648
-
-5 931 648
2000
10 056 954
10 056 954
5 429 241
5 632 214
11 061 455
-1 004 501
819 257
-1 823 758
4 931
1 818 827
Sources offiinding
There were no public sector grants between 1996 and 2001 eļ§ļpept ERDF money for the new terminal.
10 Public funding issues
No obvious public funding issues except that the new termlļļal was partly funded by ERDF funds and it will be interesting to see how quickly the airpqĮ| can become profitable thereby avoiding the potential issue of cross-subsidisation by the parel company. Peel Holdings.
UKG-22 Air Transport Group, School of Engineering, Crmįeld University

I Competition between Airports end the Application of State Aid Rules Volume II - Country Reports
United Kingdom
London Gotwick
1 Ownership and organisational structure
Gatwick is a EU category 1 airport and part of the BAA Group that also includes Heathrow, Stansted, Southampton, Glasgow, Edinburgh and Aberdeen airports.
BAA is 100% owned by private shareholders, with London stock exchange share quotation. A special (golden) share is held by the Secretary of State on behalf of the UK Government. Prior consent is required from the Special Shareholder in such matters as the disposal of the Group as a whole, or of individual airports in the Group, or alteration of the Articles of Association of the company.
BAA is split into a number of separate airport companies including:
Heathrow Airport Ltd Gatwick Airport Ltd Stansted Airport Ltd Scottish Airports Ltd
The Group board includes non-executive directors from industry, but none from government.
Refer to Heathrow Section 1 for further details on the BAA Group
The provision of airport services at Heathrow includes:
Local ATC: NATS - contracted to BAA but paid directly by airlines
Police: Local police force paid for by BAA Security: BAA's own staff, plus private suppliers contracted to airlines Passenger handling: Airlines and third party companies (not BAA) Ramp and baggage handling: Airlines and third party companies (not BAA) Duty-free: BAA owned subsidiary, World Duty-free Other retail: Private concessionaires Car parking: Pnvate concessionaires
Current environmental issues have an impact with night quotas, departure noise limits, segregated mode operation of runways, climate change, emissions and waste commitments, but environment is not a competitive issue.
Л/г Transport Group, School of Engineering, Cranfíeld University UKG-23

Competition between Airports and the Application of Stete Aid Rules Volume II ~ Country Reports United Kingdom
Type of carport
Note that the key market segments are scheduled domej charter flights (both intra-EU), and scheduled international The cargo market segment is comparatively small and the loj is starting to develop. There are significant numbers of tra data supplied by the airport does not indicate the correspond!
Traffic Data (2000)
|c, scheduled international and charter flights (both non-EU).
-cost market (primarily easyJet) fer passengers although traffic market segments.
Domestic flights
Terminal Passengers (arrivals) | Terminal Passengers (departures) Transfer Passengers (all airport) Transit Passengers (all airport) Cargo (tonnes - inbound) Cargo (tonnes - outbound) ATMs (arrivals+departures)
[ Aircraft movements (arrivals + departures)
Scheduled 1 452 000 1 455 400
-_
800 2 200
41400 „
Charter I 8 300 I 6 500 I j
I 200
! loo ! 900
-
International flights (Intra EU) Terminal Passengers (arrivals) Terminal Passengers (departures) Transfer Passengers Transit Passengers Cargo (tonnes - inbound) Cargo (tonnes - outbound) ATMs (arrivals+departures) Aircraft movements (arrivals + departures)
Scheduled 3 614 100 3 591 300
_ -
4 700 2 900
99 500 _
Tora/ 1 460 300 1 461 900
4 184 400 | 138 000
1000 2 300
42 300 47 200
Icftarfer 1900 100 1923 200
-
1 700 _,
International fíghts (non-EU) Terminal Passengers (arrivals) Terminal Passengers (departures) Transfer Passengers Transit Passengers Cargo (tonnes - inbound) Cargo (tonnes - outbound) ATMs (arrivals+departures) Aircraft movements (arrivals + departures)
Scheduled 5 324 100 5 265 700
_ _
132 000 2 200
57 700 -
ļ 800 28 700
.
Total
6 514 200
6 514 500 See domestic
See domestic 6.4 3.7
128 200
132 000 |
bharter I 1605 600
650 000
1 |
14 700
I 12 800
! 23 400
I I ....
Total I 7 929 700
7 915 700
See domestic See domestic
146 700
15 000
81 100
81 800 |
Note: Total aircraft = ATM's + GA, Test and Training, positioning and othe|Ion-commercial aircraft movements
UKG-24 Air Transport Group, School of Engineering, Cranmd University

I I I I I I I I I I I I I I I I I I I I I
Competition between Airports and the Application of State Aid Rules
Route structure and key airlines
Volume II ~ Country Reports United Kingdom
Information on dominant airlines is based on year 2000 data. Since the end of 2000, British Airways (BA) has reduced its level of activity at Gatwick by moving some international services back to Heathrow and reducing frequencies on domestic. Jersey European (JEA) has been renamed British European, and easyJet has now started low-cost operations into Europe. Even the charter airlines are going through a period of consolidation and re-branding. Therefore, the Table below although correct for 2000 will, for 2002, not only show changes in percentage market share but also show some different airline names.
Traffic type
Scheduled domestic
Scheduled intra-EU
Scheduled international (non-EU)
Charter intra-EU
Charter international (intra-EU)
Cargo (all)
I - airline
BA
BA
BA
MONARCH
MONARCH
BA
%
48.6
31.2
43.0
19.9
18.1
37.2
2"" airline
JEA
CITY FLYER
VIRGIN AIRLINES
AIR 2000
JMC
VIRGIN
AIRLINES
%
20.6
18.6
15.8
19.8
16.7
11.9
З"" aWne
CITY FLYER
GB AIRWAYS
CONTINENTAL AIRLINES
JMC
AIRTOURS
DAS
%
16.5
9.8
15.8
19.1
15.2
9.1
4 Catchment area
No information was forthcoming from BAA about the catchment area of Gatwick. The airport is well served by a motorway network and has a rail station located within the South Terminal. For the scheduled domestic market segment, the natural catchment is an arc extending through west Kent, Sussex and parts of Surrey, competing services are offered by Heathrow, Stansted and City. The catchment for scheduled intra-EU and non-EU traffic will extend northwards into London and even further for those with direct rail access to Gatwick. Heathrow will be the major competitor in terms of catchment overlap. The natural catchment for charter services will be most of southeast England with the natural catchment overlapping that of Stansted and Luton.
5 Competing airports
Manchester, Birmingham and Luton compete with Gatwick for international scheduled origin and destination traffic; Charles de Gaulle, Amsterdam and Frankfurt compete with Gatwick for transfer traffic. In all cases, Gatwick is competing for passengers and airlines.
6 Current and future investment plans
Investment programmes are financed entirely out of cash flow and bank borrowing at commercial rates with insignificant funding from the public sector.
Air Transport Group, School of Engineering, CranMd University UKG-25

Competition between Airports and the Application of Stete Aid Rules Volume II - Country Reports United Kingdom
The following Table shows past and projected capital expenc Gatwick (and summated for Heathrow, Gatwick and Stansij constant 2000 / 2001 prices.
are between 1999 and 2011 for i) expressed in UK£ million at
Year 1999/00 (actual) 2000/01 2001/02 2002/03 2003/04 2004/05 2005/06 2006/07 2007/08 2008/09 2009/10 2010/11
Total % Total
Gatwick 97 92
100 107 83
114 115 117 120 61 31 37
1,074 15.5
V lm | 79 I 39 S 33 ¡23
J3 1 21
48 45 12 55 86
! θ 20
i i l »•«>
BAA has no financial interest or involvement with the Gat the airport expect to contribute in the fixture towards firture ¡
Jk Express rail service nor does jort access developments.
Airport charges
Airport charges are incurred for aircraft landings, passeņllr departures, aircraft parking, noisy aircraft surcharge and peak period surcharge. ΝΑΊΒ provide service for approach control and charge separately for it. There is a rebate for re|pte stand parking, rather than a charge for air bridge use. Security is provided by BAA andIpey are allowed to recoup 95% of this charge through additional aeronautical charges in genrnfl (no specific charge).
Charges are based on MTOW, numbers of passengers, aiuj different passenger charges for domestic, Irish and other it differences in terminal costs.
lours of stand use. There are itional passengers, based on
Charges are set by BAA according to yield basket and X lictor determined by CAA (and periodic review by Competition Commission) under price catll|umquenmal reviews.
No airport charges discounts are offered at Gatwick.
UKG-26 Air Transport Group, School of Engineering, Crameid University

Competition between Airports and the Application of State Aid Rules Volume II ~ Country Reports United Kingdom
8 Financial performance
The financial performance of the BAA Group is summarised in the Annual Report (2001) on a Group basis but information on individual airports is limited. To illustrate this, the following pages include details on:
Consolidated profit and loss account for the year ended 31 March 2001 Segmental information including revenue, operating profit and net assets Ten-year financial summary
Air Transport Group, School of Engineering, Cranfield University UKG-27
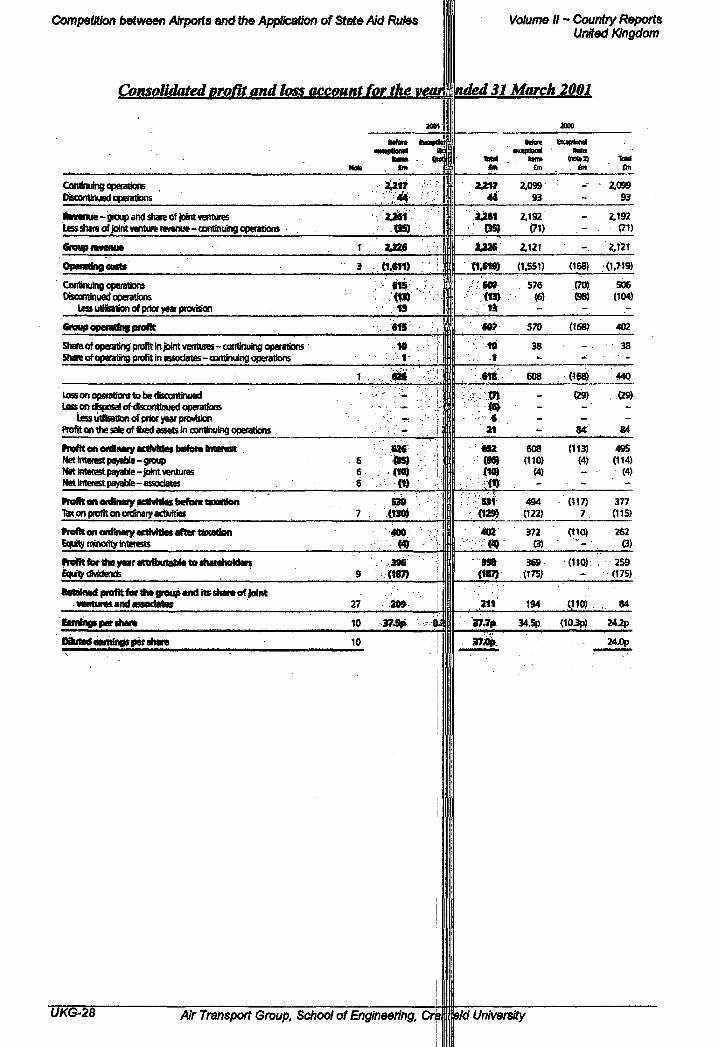
Competition between Airports ana the Application of State Aid Rules Volume II - Country Reports United Kingdom
Consolidated profit and loss account for the ve Ш March 2001
MM Ί
M o r e СжфВигйА
Continuing operations Discontinued operations
Revenue-9ГОФ and share of joint ventures l^shareofjolntveraurerevenue-continuingopwaitions
OpMRreftQCMts
Continuing operafens Discontinued operations
Less utilisation of prior year ptowisior
Share ofoperating profitin joint ventures-continuing operations Share of operating profit in associates-continuing operations
Łasson operations I D be discontinued Loss on disposal of cfiscontinued operations
less utilisation of prior year provision Profit on the sale of fixed assets in continuing operations
Щ.. ft» - M π MHH •• » f i l i i l t t i f '• —*- - • ЬавАЖйм*
η ν · η ОП wiiulMiy «kUVlIHS DVraf« нншшн. .
Netlmerestpayable-group Net ¡metest payable -jointventures Netlnteestpayable-associates
TaxonpfrtftononfttaryadMties
fnmt on ofldiflMyuttivlÜes after tftXAUon Equity minority interests
fteBt fcr the yew «гаймтМе to shawhoklers Equity dMdends
«etBHied iMofiLiof lne svQuptfid its trafe of Joint - mntuftt end ssioclsteB
Nd>
1
3
1 .
6 6 6
7
9
27
. to
a u » •/•••i •.':·"ΐ# ·'.;•·'•
-.-itíM".'.-:'"
Ł226
(i^fl)
13
ш •
•Μ. ,-·;' •••'•••i" - •·''·
. ; .IK ' -4: .
. floj
. SM ". Í13KÖ
:·.,396; • (18Л
• ' . ã» . ""
1 'S ' • · w»?
1. m\ ада.
1 " Í «« ) t'..-r:'iw:
. '. M Il •'• '"'wi
| \ - . ' -¿* ·"
- •••'••.-ι* • · · · · · · • ' * .
21
i «32 - m
•'. m |-.-'-':ΐ»
ļ ·'·':;• •••'«·· 1 '"39t
(røj
• - v » '
Mm tm
2,099 93
2,192 (71)
2,121
<1.5S1)
576
570
38
608
-
608 (110)
(4)
494 (122)
372 (3)
369 (175)
194
. tm
:
-
-.
(168)
(70) ©8)
(168)
- ;-
<Ш8
(29)
84
(113) (4)
(117) 7
(ine
(110)
(110)
' fm
2,099 93
2.192 (71)
2.Í21
(1.719)
506 (104)
402
38
« 0
. (29)
84
495 (114)
(4)
377 (115)
262 0)
259 (175)
84
Uníngt pet share 10
Nuted earnings per share
tīJSļi 37.7p 34.5p (103p) 24.2p
10 37Лр 24.0p
UKG-28 Air Transport Group, School of Engineering, Crameld University
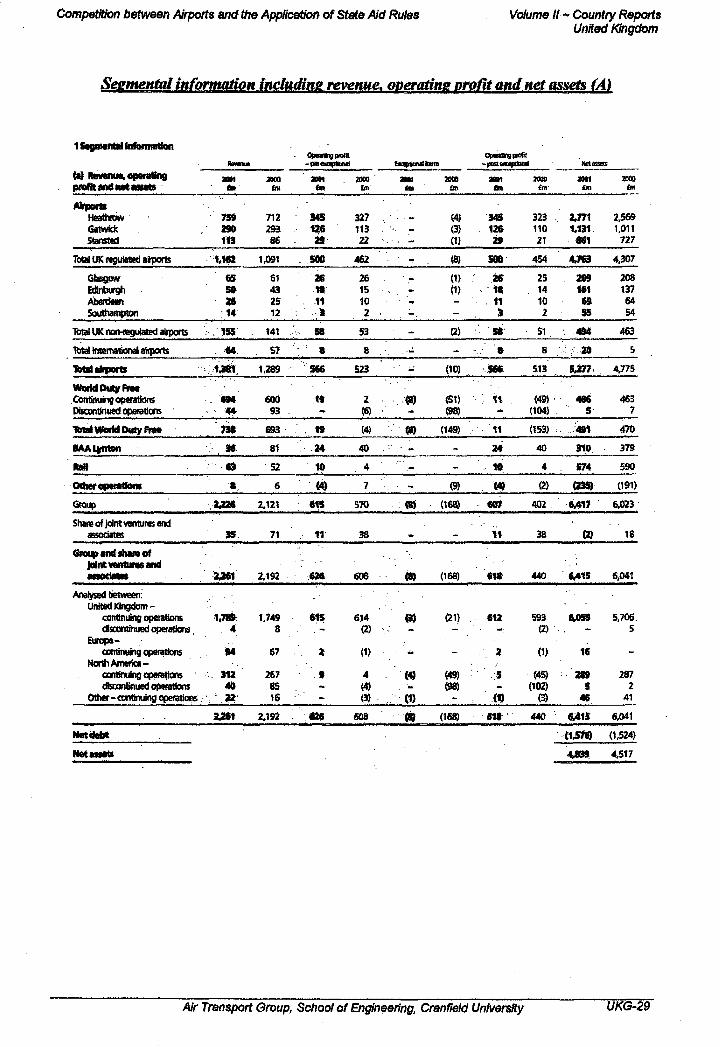
Competition between Airports and the Application of Sfere Aid Rules Volume If - Country Reports United Kingdom
Seemental information includine revenue, overañne profit and net assets (Ai
1 Segmental ¡nfonwtíon
teMnu» -роаекцхйпа!
(а) Revenue, operetiflg praflt«Klnetastets
Abpom Heathrow Gstwick Stansted
Total UK regulated airports
Glasgow Edinburgh Aberdeen Southaitipton
Total UK non-regulated aiiports
Tbtel irœmationd aliports
*Мяк aifpoftt
WoridDutyFrae Continuing operations Discontinued operations
•Wut nuiiu mny nwi
BAA lanton
Re«
Other operattom
Graup
Share of joint ventures and associates
MM to
7 Я , 290
113
%m 65 50 26
••.•'w
..•«4.
'; i'Uft,
73»
·:• 36,
'·• - · es.
• * ,
гдав
3S
жоа tm
712 293 86
1,091
61 43 25 12
141
57
1,289
600 93
683
81
52
б
2,12t
71
ми ta
345 va
29
. soo
2в W .« ì
- sa ·''·' в
966
t *
19
24
10
m eis
11
. a»» fin
327 113 22
462
26 15 10 2
53
8
523
2 Ю
№
«
4
7
570
38
ani tm
'•- -
• -
. -
-
, --
-
W
w - _
. ' -
tø
JÓOS £m
(3) (D
(8)
<1>
ß)
-
(10)
<S1) (98)
(149)
_
-
e» (16Щ
м и em
345 126
29
SOO
26 W
. 11 3
sé ·' ' *
-.яве.
i i
11
24
10
m m
i t
20» ťm-
323 110
21
454
25 14 10
2
si
8
513
(49> <104)
(153)
40
4
(2)
402
38
am in
г,т 1.131
861
4,763
209 161
69 • -55
494
. · : · . · • • - . »
Ь277>
486 S
.; Jm
ло 574
(235)
Ŕ417
(2)
2000 fin
2,569 1,011
727
4,307
208 137
64 54
463
5
4,775
463 7
470
379
590
(191)
6,023
18
Group and share øf Joint ventures and
2J61 2,192 626 608 (168) 618 440 «415
Analysed between: United Kingdom-
continuing operations discontinued opeations.
Europe-continuing operations
North America-continuing operations discontinued operations
Other- continuing operations
1,789 : 4
1,749 8
67
312 267 40 85 22 16
eis
2
»
6J4
а) d)
4 (4) (3)
m
(1)
(21)
(49) (98)
612
' 2
5
(D
593 (2)
(D
m (102)
(3)
&059
16
289 S
46
6,041
5,706. 5
287 2
41
¡Utti 2,192 62« 608 (8) (168) 618 440 M I S 6,041
»fet debt ( IJff ţ) (1,524)
Net essate 4Л39 4,517
Air Transport Group, School of Engineering, Cranfíeld University UKG-29

Competition between Airports and the Application of State Aid Rules Volume il - Country Reports United Kingdom
Seemental information includine revenue, operatinimrofit anã net assets (B)
1 Segmental Irtfbnnatłon continued «φοη ana other nspoqwl
•Share af joint ventures 35 71
Group wtd share of Jobitvwiiuras W « 1,061 67S 624 2Ö1 176 168
Analysed between: Unted Kingdom-
continuing operattons discont ued operations
Europe-cpntìfiutng operations
North Amata-continuing operatfons
«95 . .«'
70
as» m 20
660 8
43
251 85 14
651
24
600
24
ЯН
Hei
(Ь)й«м«ие
Ahports Heathrow Gatwfck Stansted
Total UK regulated airports ·
Gtogow
' Aberdeen Southampton
1<ма1 UK non-regulated airports
Total Hemational airports
maiabpom
WòrfdOutyfwe O iãfttdng operations
TaMWoridOMyftM
BAAlynton
M l
f ļ I i M ^ jMMmutļMM
Group
J001 im
• ; ί β 6 . • • . - ' . ' • . » •
• ^ { 3 »
•"i-i ''19 A • «
'V- " 3 '.2
•\"ч»
• - ' . • • 2 *
<-m "
;':-. "««i
• • m• .
_
-
. - , : • . " _
1.t19
2000 im
191 110 27
328
11 8 3 2
24
19
371 ;
597 93
690 :
- '
- '
-
1,061
2МП I n
132
548
44
• ••••IE •'••.' β
103
24
••'.ai-
·'_
·.'· : 'ш.
—
• -
es
ям fin
338 127 39
504
42 31 16 7
96
24
624
.-
_
'_
-
-·
624
ям
•W-1« . -ν'"· '54
β
•.-••.Vß' "
.'· - --.τ •4
''. - β'
"'•••••.'-i ! . ""Μ"
-
:-••-'• 25S"
:'";· ..- · ί
• ' . - - - '
/ · ! ' Μ
ν •: ""-
.•··• " -Φ. ν
"ίτ !"- ,1
Ο IMI η (η
7 ' '.·•··•-» 8 ·.:···:·--Τ 6 ••- -•••4
1 : - - ;
( - 1 *
7 ':·:!· '--I * ·.'·• -'-ι. 5 .,/.-. - 'ľ 1 .<-, -..-I
7 : -• 'β.
- Η
8 -60
- W
M
1
- í- «s
- "•• '. 8
9 -'.. vã
um — β «
26 8 4
38
1
1 2
4
14
56
3
3
_
52
6
117
mm a*
7 » 290 « 3
1,162
·:' «5 5ļ» 26
.'. ·. "14
. 1 »
«4
лт
'. «s» 44
•.-'.',.*8β-
• м:
63
•8
Ł226
2000 £m
712 293
86
1;091
61 43 25 12
141
57
1,289
sao 93
693
81
52
6
2,121
35
2¿61
71
2,192
9 . 152
1 '*•*· '
i
- '•>· æ
- ' i
170 - '
-
16 -2
1,789 ,4
»4
312 40 22
1,749 8
67
267 85 16
;1Л1*: 1,06i 675 624 291 176 188 2¿61 2,192
υκβ-3ο Air Transport Group, School of Engineering, Cr ïïeld Universäy

Competition between Airpoňs and the Application of Stete Aid Rules Voláme H - Country Reports United Kingdom
Ten-vear financial summarv
Hafte statistics (UK airports),- : 'w* me •tSBÙ яш Psaeng^önliíons):
.'•"... taţefnştiwial
Ciągo and m^lįgl^tjįnnės).
Я Л ' '.·':· L7t7 5 » т K S
1 ^ 9 .ļ,iS6
82.0 664 tm
Í3PS
- Ш Ж.б '712 .-. na , 895 ..· • "·"• Ш-\№ ,1552
98Л 785' 975
1.642
104.5 .«ŻŚ 84J - 9ί.6.
1,019 -«ЙВ Ι,ΤΚ Î»SÏ
• Profit end toss açcoitfit tót .tm «m en .¿йащг;
;)RH^į.;i;;'; ;;f;K'· ..;' '·., • « S •· '.952.' 1088.. > ЗДЙу -^liŽO .'• 1ДЯ 1,β79 > • nCttííDlBrOCeиПЗш]П.81ю .·.·
еич*Ш*ЙЮ. :' :.';У' '•·.• "' '•«S'.;'':'2fi1 "";·'· 32Í ' ••3»:·-..'.·.•..«*•'• •-'••ч4·»:-- 4П /tjtìiton "" .:.•: ė«·'•'·. (M) ...»» да » щ · . o«) eos* ftofitfeřifitftAktóiyéaF ··:«3•"·'.-··--üi :.ЙС.- 279 Ι ί , - ϋ Β · :2fl6 f T?. :
2,013 . . 2;f92
(115)
PMttendsperstiwetø) Î2S 8.0 ao j o m •nås 124: •Ш5 Λ5^: 16.351 I»™™..
242 142 20» 23.5 272 304 •283 26.3 375 iįfcg
(Иапсеайй
; tfetcunwtMsitles
fin . en
2,iK2 34)39. ν . 3,β04 . * Μ 9 ; '4,545 ' 4,9ί3:· 5,Ю5 .β,«^ į ft#Ş7J
047) 0 ^ - ; 4:ėa№··-•-·•«»»• 037) 0«ί '-СЯВД- оад : : ^ : a t ó ļ e s s c ü ι 1 ^ I W ) i W β · ^ 2,705 A 9 f i $ r ; : Ż 3 ^ 6 • з,еа· • дЛзсв .A« .. , SiłSSA...- 6^21 - - ^ 3 9 4
О е ^ ^ Ш д а у е а г . ; Щ® "y es«" co) ; Ш41);; ; :(ti»ŕ: :tci^;~лчт [pm Shjfďwldei?'funds ţşeo-. , ..2,047 · ; ·.2i543';'.". ' 2 ^ Ş ^ : · ν·$№7·. •Mei· 3,739, . - Λ Α 4 4¿517
Net ass« vàuç ρ«· йиге {£) 1Я7 jZ.çn· Í2á9: • -r .Į
2.77 ,3.06. 3J2 • .3,54.: 358 4i22
OädoseťtnetaHetvalueper . shaft based un an external vaķiļition of Bttjor operaţional '
,«itfjP№pefTyf¿te8trg>**. : . 3.93 4.03 5.06 541. .552 6.21 « 6 3 792 βΛ9'.ϊ#}||ί ,.ΙΙ-·Γ· f í - i t r ' · : ^ '
More specific information is ^iown in the Table below on staff, police, security and depreciation costs for each of the BAA London airports
"1 j ļ (
Staffeeste Police ceste Depreciation { Other į į
Totai cotte 1
HAL Em
117.5 21.3 84.3
283.9
487.0
1998/99 GAL £m
56.6 11.2 31.3
132.9
232Л
STAL Un
19.3
з.е 14.2 27.6
64.6
HAL £m
110.6 21.21
103.7 274.2
909.7
1999/Ю GAL fim
55.6 11.5Ì 35.2
1Ü3.1
205.4
STAL &n
20.7 3.8
15.5 34.4
744
KAL Cm
112.3 2211
115.4 294.6
5444
20Ü0/D1 GAL'
r £m
55.8 10.8 40.5 98.9
206.0
Total costs Indudes Security coste M i l c h are oartiv Staff coste, oartlv Deoredatlon coste and iiartlv Other coäd Estimate of total security costs í 116.3
! ļ ! for info Retail costs j ! 21.0
75.1 j 32.3Í i 121.91 76.8 į i į j
5B.3Í 0: ļ ļ 10.7Ì IS.11
• ^ з й Г
0.21
l l D ï j 82.0
10.5! 3.1
ŠTAL Ém
22.2 З.Г
18. 48.
90.3
36.4!
0.4]
Standard rate corporation tax is paid at 30% (group level only) plus overseas taxes where applicable. Current accounting practice is to use straight-line depreciation over the following periods:
Terminal and buildings up to 60 years
Air Transport Group, School ofĒngneering, Gran/retó Univsrsäy υκβ-31

Competition between Airports and the Application of Stete Aid Rules
Runways, taxiways and aprons surfaces Plant and machinery (lifts) Plant and machinery (baggage systems) Motor vehicles Office equipment Computer equipment
9 Sources of funding
10 -15 y 25 years 15 years 4-8 yea 5-10ye 4 -5 yeąi
Volume II ~ Country Reports United Kingdom
rs (sub-base 100 years)
s
No monies for airport development have been received outsÍ| | of internal cash flow and bank loans at commercial rates.
10 Public funding issues
None
UKG-32 Air Transport Group, School of Engineering, Crameld University

Competition between Airports and the Appľication of Sfate Aid Rules Volume II - Country Reports United Kingdom
London Heathrow
1 Ownership and organisational structure
Heathrow is a EU category 1 airport and part of the BAA Group that also includes Gatwick, Stansted, Southampton, Glasgow, Edinburgh and Aberdeen airports.
BAA is 100% owned by private shareholders, with London stock exchange share quotation. A special (golden) share is held by the Secretary of State on behalf of the UK Government. Prior consent is required from the Special Shareholder in such matters as the disposal of the Group as a whole, or of individual airports in the Group, or alteration of the Articles of Association of the company.
BAA is split into a number of separate airport companies including:
Heathrow Airport Ltd Gatwick Airport Ltd Stansted Airport Ltd Scottish Airports Ltd
The Group board includes non-executive directors from industry, but none from government.
The BAA group is a Member of the World Airports Alliance, which is a grouping of major international airports comprising BAA UK's airports, Aéroports de Paris, Copenhagen Airports, and the airports at Dallas Fort-Worth, Houston, Orlando, Pittsburgh, Indianapolis, Melbourne, Naples, Vienna and Tokyo Narita.
Through more efficient e-business, the member airports would be able to offer airline customers even better value for money for airport facilities. BAA is confident that the alliance will provide value for both customers and airports by leveraging the power of the Internet and developing e-business.
The initial step was to explore the formation of working groups to create an international e-business-based alliance for airports. The first example of this has been AirportSmart.
AirportSmart is a global reference site, designed to bring together all suppliers and buyers of airport goods and services. It aims to increase competition whilst improving industry efficiency and reducing cost. AirportSmart will offer the opportunity to create an electronic information exchange for the airports industry and act is its principal trading platform and information hub. It will unlock value for both airport related buyers and suppliers by aggregating information, analysing and allocating that information to the market.
Air Transport Group, School of Engineering, Cranfìefd University UKG-33

Competition between Airports and the Application of State Aid Rules Volume II ~ Country Reports United Kingdom
AirportSmart is currently operating a pilot within Europ« Aéroports de Paris, BAA and Copenhagen Airports. The when the site will be opened up to airports and industry suppf
petween its founding members: icial launch will be early 2002, rs worldwide.
BAA owns 70% of Naples Airport, 15% of Melbourne and Iiaunceston and 10% of Northern Territory Airports in Australia, and also 18.75% of OmanJ iļAA has a management contract at Indianapolis, Mauritius and Oman and a retail manag lfient contract at Pittsburgh and Boston in USA
The provision of airport services at Heathrow includes:
LocalATC: NATS - contracted to BAA but paid Police: Local police force paid for by BAA Security: BAA's own staff, plus private suppliers coi Passenger handling: Airlines and third party comp; Ramp and baggage handling: Airlines and third p; Duty-free: BAA owned subsidiary. World Duty-free Other retail: Private concessionaires Car parking: Private concessionaires
Current environmental issues have an impact with mgh|ļļ[quotas, departure noise limits, segregated mode operation of runways, climate change, ещjssions and waste commitments, but environment is not a competitive issue.
ly by airlines
lacted to airlines Is (not BAA) ¡companies (not BAA)
2 Type of airport
Of all the airports in the world, Heathrow Airport has t] passengers ~ at least until EU passengers are counted as do! well defined market segments, the scheduled point-to-] scheduled point-to-point international market (both EU traffic figures (but not split into specific markets) are the trj 32% of all passengers.
ļ largest number of international sstic. The airport caters for very bint domestic market and the
non-EU). Included among the sfer maricet accounting for some
The transfer market is primarily domestic to mtemationll, international to domestic or mtemational-to-intemational. The charter market is сотршру absent from Heathrow as is the low-cost market. In part, absence may not be because if airport charges but because of difficulties in getting slots at the airport. The following Talles summarise Year 2000 traffic data.
UKG-34 Air Transport Group, School of Engineering, Creme/d University

Competition between Airports and the Application of State Aid Rules Volume II ~ Country Reports United Kingdom
Domestic flights (ай scheduled)
Terminal Passengers (arrivals)
Terminal Passengers (departures)
Transfer Passengers (all airport)
Transit Passengers (all airport)
Cargo (tonnes - inbound)
Cargo (tonnes - outbound)
ATMs (arrivals+departures)
Aircraft movements (arrivals + departures)
Scheduled
3 687 000
3 720 000 .
.
3 600
4 900
66 900
70 200
Charter -
-
-
-
.
_
-
-
Tora/
3 687 000
3 720 000
21 000 000
300 000
3 600
4 900
66 900
70 200
International flights (Intra EU) (all scheduled)
Terminal Passengers (arrivals)
Terminal Passengers (departures)
Transfer Passengers (all airport)
Transit Passengers (all airport)
Cargo (tonnes - inbound)
Cargo (tonnes - outbound)
ATMs (arrivals+departures)
Aircraft movements (arrivals + departures)
Scheduled
109 000
109 100 _
_
98 200
76 100
218 000
221 000
Charter
-
- -
-
_
_
_
_
-
Total
109 000
109 100
See domestic
See domestic
98 200
76100
218 000
221 000
International flights (non-EU)
Terminal Passengers (arrivals)
Terminal Passengers (departures)
Transfer Passengers (all airport)
Transit Passengers (all airport)
Cargo (tonnes - inbound)
Cargo (tonnes-outbound)
ATMs (arrivals+departures)
Aircraft movements (arrivals + departures)
Scheduled
28 356 000
28 285 300 .
-
561200
501 300
175 000
175 800
Charter ~
-
-
-
-
-
-
-
Total
28 356 000
28 285 300
See domestic
See domestic
561 200
501 300
175 000
175 800
Note: Total aircraft = ATM's + GA, Test and Training, positioning and other non-commercial aircraft movements.
3 Route structure and fay airlines
UK airlines, and to a lesser extent by their alliance partners, dominate the route structure for flights from Heathrow, for all market segments. Ninety airlines operate out of Heathrow to about 160 destinations. The airport handles more international passengers than any other airport in the world and offers flights to many international destinations including 33 flights to Paris and 23 flights to New York each day. The most popular country for flights from Heathrow is the United States of America. The busiest routes are New York, Paris, Amsterdam and Dublin. The following table shows the dominant airlines for each of the market segments.
Air Transport Group, School of Engineering, Cranfleld University UKG-35

Competition between Airports and the Application of State Aid Rules Volume II - Country Reports United Kingdom
Traffic type
Scheduled domestic
Scheduled intra-EU
Scheduled international (non-EU)
Charter intra-EU
Charter international (intra-EU)
Cargo (all)
1st airline
BA
BA
BA
Neg.
Neg.
BA
%
63.3
37.9
38.0
0.0
0.0
36.5
Z^airiinţ
British M land
British IM land
Virgin A nes
Neg. I Neg.
Virgin AJ nes
%
37.6
14.2
7.7
0.0
0.0
7.4
УейгИпе
Manx Airlines
Aer Lingus
United Airlines
Neg.
Neg.
United Airlines
%
1.6
5.6
6.5
0.0
0.0
5.7
4 Catchment area
No information has been made available by BAA regard mtemational cargo and scheduled long-haul international latter from domestic flights or vice versa) then the Heathro the United Kingdom with only Manchester offering scheduled short-haul and domestic markets (particularly di is in competition with Gatwick, Birmingham, Stansted ari sizeable catchment for the low-cost maricet or charter marki as the main-line carriers are now in the process of reducinj more competitive.
5 Competitor airports
catchment areas. In terms of lutes (including transfers to the I catchment extends over most of
serious competition. For the / destination) then Heathrow
¡London City. Heathrow has no | although the former may change their fares and trying to become
With a significant proportion of its traffic being transfi Heathrow are those airports that are being developed asl Charles de Gaulle, Amsterdam and Frankfurt. The other fi
I '
Heathrow is competing for passengers rather than airi destination traffic where the main competitors to Heathrow
6 Current and future investment plans
Investment programmes are financed entirely out of ci commercial rates with insignificant funding from the public
The following Table shows past and projected capital expei Heathrow (and summated for Heathrow, Gatwick and St constant 2000 / 2001 prices. Investment programmes are and bank borrowing at commercial rates although BAA ha for Heathrow Express
then the main competitors to atemational hubs, that is, Paris
of competition (in both cases s) is for scheduled origm and : Manchester and Birmingham.
flow and bank borrowing at fctor.
fture between 1999 and 2011 for led) expressed in UK£ million at ļianced entirely out of cash flow been supported by an EIB loan
UKG-36 Air Transport Group, School of Engineering, Cnmfield University

Competition between Airports and the Application of State Aití Rutes Volume Η ~ Country Reports United (ungdom
Year
1999/00 (actual)
2000/01
2001/02
2002/03
2003/04
2004/05
2005/06
2006/07
2007/08
2008/09
2009/10
2010/11
Totat
% total
Heathrow
235
283
375
465
602
751
868
493
237
248
212
105
4,874
70.4
Total
386
479
599
663
723
903
1,021
648
445
412
355
286
6,920
100.0
Terminal 5 investments at Heathrow (just over £2 billion) are expected to account for around 57% of total Heathrow capital expenditure between 2000/01 and 2010/11.
Heathrow Express (project cost £500 million part funded by BAA), originally a joint BAA / British Rail investment, is now 100% owned by BAA
BAA has no financial interest in either Gatwick Express or Stansted Express rail links, although they would like to see the Stansted link improved as part of their proposed expansion of the airport from 15 mppa to 25 mppa.
The recent government permission for the go-ahead for T5 does not include a requirement for BAA to contribute to the widenmg of the M25 motorway, which will be paid for by the government But they have included an amount in the total of £2 billion for a link road from the M25 up to the airport perimeter (approx. £60 million). All roads within perimeter paid for by BAA.
7 Airport charges
Charges are incurred for aircraft landings, passenger departures, aircraft parking, noisy aircraft surcharge and peak period surcharge. NATS provide service for approach control and charge separately for it. There is a rebate for remote stand parking, rather than a charge for airbridge use. Security is provided by BAA and they are allowed to recoup 95% of this charge through additional aeronautical charges in general (no specific charge).
At Transport Group, School of Engineering, Cranfíeld University UKG-37

Competition between Airports and the Application of State Aid Rules
Charges are based on MTOW, numbers of passengers, at passenger charges apply for domestic, Irish routes and oth on differences in terminal costs.
Charges are set by BAA according to yield basket and X periodic review by Competition Commission) under price caj
No airport charges discounts are offered at Heathrow.
8 Financial performance
Refer to Gatwick Section 8
9 Sources of funding
Public sector grants between 1996 and 2001 have been limiti
1997 ECU 186 million loan from ЕЮ for Heathrow I TEN-T 2001 Feasibility study for Kings Cross airpç station and for Heathrow airport - new rail links, M€
10 Public funding issues
No current issues
Volumen ~ Country Reports United Kingdom
hours of stand use. Different international passengers, based
actor determined by CAA (and piinquennial reviews.
to:
press / high-speed trains interchange
000
UKG-38 Air Transport Group, School of Engineering, Cra ;e/d University

Competition between Airports and the Application of State AJd Rules Volume II ~ Country Reports United Kingdom
London Luton
J Ownership and organisational structure
The assets of London Luton Airport are 100% owned by Luton Borough Council. Responsibiüty for airport operations lies with the airport group TBI who have a 100% concession contract with Luton Borough (worth £10 million / annum) for 30 years. Privatisation of the assets is unlikely, not at least until the end of the concession contract. Legislative changes in the event of privatisation are not known, but the point has been made that BAA inherited assets on privatisation whereas if TBI bought a privatised Luton they would have to pay money up front for the assets.
Airport services include ATC (NATS), police (local government), security (airport), passenger and ramp handling (various companies), duty-free (Nuance) and car-parking (CPS management contract).
Apart from their activities at Luton, TBI also own Belfast International, Cardiff, Skavsta (Stockholm) and Orlando Sanford. It is believed that Skavsta is currently up for sale. There is no cross-subsidisation for finances between airports.
At present the airport has imposed a Chapter 2 ban during the night hours (now overtaken by EU legislation), noise abatement procedures for take-offs and introduced a noise fine mechanism. There is concern that there may be a future ban on night flights.
2 Type of airport
Luton developed originally as a charter airport and the two main airlines, Britannia and Monarch, have continued their operations without that market segment really growing. There were originally a limited number of scheduled flights but the passenger numbers in this market segment have increased dramatically in recent years due to the development of the low-cost airline industry, first Ryanair and now dominated by easyJet.
Traffic Data (2000)
Domestic flights
Terminal Passengers (arrivals)
Terminal Passengers (departures)
Transfer Passengers
Transit Passengers
Cargo (tonnes - inbound)
Cargo (tonnes - outbound)
ATMs (arrivals+departures)
Scheduled
863 000
855 000
350
na
na
na
16 000
Charter
2 100
1800
440
na
na
na
1000
Total
865 100
856 800
790
na
55 956
661 000
17 000
Air Transport Group, School of Engineering, Cranfíeld University UKG-39

Competition between Airports and the Application of State Aid Rules Volume II ~ Country Reports United Kingdom
International flights (AB EU + поп-EU) Scheduled Charter Total Terminal Passengers (arrivals) 1 537 000 680 000 2 217 000 Terminal Passengers (departures) 1 560 000 675 000 2 235 000
Transfer Passengers 600 600 Transit Passengers na na na Cargo (tonnes - inbound) 90 000 201 000 291 000 Cargo (tonnes -outbound) 290 000 174 000 464 000 ATMs (arrivals+departures) 28 600 9 000 37600
3 Route structure and key airlines
The dominance of easyJet at Luton can be shown by refer the principal airlines for the different traffic segments.
Ice to the Table below showing
Traffic type
Scheduled domestic
Scheduled ¡ntra-EU
Scheduled international (non-EU)
Charter intra-EU
Charter international (intra-EU)
Cargo (all)
1s t airline
EZY
EZY
EZY
BY
BY
DHL
%
95
73
82
46
39
59
2nd airlih
BEA
RYR
ZB
JMC
MON
MNG
ļ %
3
13
18
14
21
28
3rd airline
MANX
ZB
-
MON
AIH
STREAMLINE
%
2
12
-
11
20
7
4 Catchment area
For the scheduled market, 65% of all passengers live catchment overlapping that of Stansted and Heathro international (origin / destination) traffic, 51% of all passen time, the catchment overlapping that of Stansted, Heathrò charter catchment overlaps with Stansted, Birmingham customers living within one hours drive of the airport. The ¿A
The one-hour driving time catchment has been defined by people are resident within one hour of Luton and 22 milli airport.
5 Competing airports
The principal competing airport to Luton is Heathrow whér are scheduled domestic, EU short haul and intemationa
one hours driving time, the airports. For the scheduled
|rs live within one hours driving and Birmingham airports. The
id Gatwick with 68% of all ψ competitor is Stansted.
surveys. Some eight million within two hours drive of the
the competing market segments røint to point. The perceived
UKG-40 Air Transport Group, School of Engineering, Cn pefcŕ University

Competition between Airports and the Application of State Aid Rules Volume II ~ Country Reports United Kingdom
advantages of Heathrow over Luton include better choice of routes, frequences, and airlines. Other advantages quoted included procurement strengths, demand for slots, airport charges and ATC charges (deal between NATS and BAA).
The secondary competing airport is Gatwick where the competing market segments are for charter operations. Charter operators prefer Gatwick for reasons of pricing and the value of slots ~ charter operators would rather give up slots elsewhere rather than Gatwick.
The third competing airport is Stansted, which competes in the low-cost airline market segment. Stansted's advantages include route network and pricing, BAA charges being lower than anyone else.
6 Current and future investment plans
There has been significant investment in the airport in recent years. There are summarised m the following Table.
Investment Programmes in past five years f 1996-2001)
Application
Terminal expansion
Airside infrastructure, apron access roads
Airside departure lounge
Amount
UK£80m
UK£50m
UK£30m
UK£5m
Sourcefs; of funds
Concession company
Bank loans
Bank loans
Bank loans
%Govr funding
0%
0%
0%
Future investment plans depend on passenger growth and the outcome of the governments on-going regional studies into the provision of airports. It is expected that expansion plans will require the support of government by funding. Surface access infrastructure constructed between 1992-2001 includes an access road constructed in 1996 (plus taxiway improvements), funded by Airport (UK£3.5m) and Luton Airport Parkway Station (1999), funded by Railtrack (UK£20m)
Surface infrastructure to be constructed between 2002-201 lindudes the East Luton Corridor, Ml spur dual carriageway to the airport (2005), project cost UK£20m, funded by central government and possibly by the airport. Also in the planning stage is Translink, a light rail system between Luton and Dunstable (2007), project cost UK£50m, funded by central government and again possibly the airport.
Mr Transport Group, School of Engineering, Cranfield University UKG-41

Competition between Airports and the Application of State Aid Rules Volume II - Country Reports United Kingdom
7 Airport charges
Airport charges include landing, passenger service charge Ipr departures (includes security and baggage), aircraft parking, ATC, noise and night flightļ «pplements and summer / winter peak period supplements. The airport now has 100% hold ba||page screening.
Landing charges are based on MTOW and parking charģeļi are a fimction of MTOW and time. Charges are set and reviewed m-house, they are not regulated and based on full cost recovery / dual till charging, that is airside costs cover airsid|||operations, terminal costs cover terminal operations.
Discounts are available for traffic growth, new routes, new airlines, the use of facilities and marketing support. Discounts are available to tour operators III well as airlines.
8 Financial performance
The financial performance for the year 2000 / 01 is showl below. Subsequent to revised airport charges negotiated with easyJet, it is believed that t l | | airport is now making a profit somewhere in the region of £10 million.
UK£/Year
Aeronautical income
Concession income
Other income
Totalincome
Staff costs
Security costs
Policing costs
Depreciation
Other costs
Total costs
Operating profit
Interest received
Interest paid
Extraordinary items
Pre-tax profit
Taxation
Net prom
2000/ 1
26 100 Í IO
25 000 ļ0
5 70р( O
56 900 O
18 70(Ш0
! h a
ľ I a
62 00Ó,U O ļ
-5 90dĄ J 500
-6 100
|b ( p
Incoo k
-11600 p
1 100
-10 500
c 1 p 1
Standard rate corporation tax is paid at 30%.
Current accounting practice is to use straight-line depreciation iver the following periods
UKG-42 Air Transport Group, School of Engineering, Cranmd University I I

Competition between Airports and the Application of State Aid Rules Volume II - Country Reports United Kingdom
Terminal and buildings 10-30 years Runways, taxiways and aprons 15-30 years Plant and machinery 3-20 years Vehicles, equipment 3-20 years
9 Sources offimding
Public Sector Grants (between 1996-2001) have enabled the following studies to be undertaken:
TEN-T 1998 People Mover Study from Rail Station to Airport, M60.600 TEN-T 1999 People Mover Study Phase П, M€0.714
No further funded studies are anticipated in the future.
10 Public funding issues
No particular issues
Air Transport Group, School of Engineering, Cranfíeld University UKG-43

Competition between Airports end the Application of State Aid Rufes Volume 11 ~ Country Reports United Kingdom
London Stansted
1 Ownership and organisational structure
Stansted is a EU category 1 airport and part of the BAA Яоир that also includes Gatwick, Heathrow, Southampton, Glasgow, Edinburgh and AberdeeJlirports.
|tock exchange share quotation. bdtialf of the UK Government ¿al Shareholder in such matters ts in the Group, or alteration of
BAA is 100% owned by private shareholders, with Londoi A special (golden) share is held by the Secretary of State1
(not approved by EU). Prior consent is required from the as the disposal of the Group as a whole, or of individual the Articles of Association of the company.
BAA is split into a number of separate airport companies incl
Heathrow Airport Ltd Gatwick Airport Ltd Stansted Airport Ltd Scottish Airports Ltd
The Group board includes non-executive directors from mdu||ļy, but none from government
Refer to Heathrow Section Iforfitrther details on the BĀA
The provision of airport services at Stansted includes:
Local ATC: NATS - contracted to BAA but paid Police: Local police force paid for by BAA Security: BAA's own staff, plus private suppliers coni Passenger handling. Airlines and third party comp Ramp and baggage handling. Airlines and third ρ Duty-free: BAA owned subsidiary. World Duty-free Other retail: Private concessionaires Car parking: Private concessionaires
lly by airlines
icted to airlines ι (not BAA) >mpanies (not BAA)
Current environmental issues have an impact with night luotas, departure noise limits, segregated mode operation of runways, climate change, emfpons and waste commitments, but environment is not a competitive issue.
UKG-44 Air Transport Group, School of En neering, Cran \m University

Competition between Airports and the Application of State Aid Rules Volume II ~ Country Reports United Kingdom
2 Type of airport
Stansted is part of the London airport system although not yet achieving the status of Heathrow and Gatwick as an international gateway. In fact, despite all its success, the one market segment that Stansted has not been able to attract is that of the long-haul scheduled service market. For many years Stansted grew slowly as a charter airport and with a limited number of short-haul scheduled services. The development of the low-cost airline market has seen a dramatic change in Stansted's fortunes with Ryanair, Go and Buzz each operating out of Stansted. The following Tables show traffic data for 2000. The transfer market is also becoming important, as is cargo.
Domestic flights
Terminal Passengers (arrivals)
Terminal Passengers (departures)
Transfer Passengers (all airport)
Transit Passengers (all airport)
Cargo (tonnes - inbound)
Cargo (tonnes - outbound)
ATMs (arrivals+departures)
Aircraft movements (arrivals + departures)
Scheduled
701 100
705 100 _
_
400
400
19 800 -
Charter
7 200
7 600 _
-
2 600
3 900
4 800 -
Total
708 300
712 700
590 000
40 000
3 000
4 300
24 600
24 700
International flights (Intra EU)
Terminal Passengers (arrivals)
Terminal Passengers (departures)
Transfer Passengers (all airport)
Transit Passengers (all airport)
Cargo (tonnes - inbound)
Cargo (tonnes - outbound)
ATMs (arrivals+departüres)
Aircraft movements (arrivals + departures)
Scheduled
4 207 800
4 205 700 _
_
11900
7 700
98 200 .
Charter
420 100
422 500 -
-
13 200
18 000
9 900 _
Total
4 627 900
4 628 200
See domestic
See domestic
25 100
25 700
108 100
116 100
International flights (non-EU)
Terminal Passengers (arrivals)
Terminal Passengers (departures)
Transfer Passengers (all airport)
Transit Passengers
Cargo (tonnes - inbound)
Cargo (tonnes - outbound)
ATMs (arrivals+departures)
Aircraft movements (arrivals + departures)
Scheduled
338 500
335 400 _
50 600
49 300
10 000 -
Charter
203 400
207 200 -
_
20 100
3 400
2 900
-
Total
541 900
542 600
See domestic
See domestic
70 700
52 700
12 900
16 000
Total aircraft = ATM's + GA, Test and Training, positioning and other non-commercial aircraft movements.
3 Route structure and key airlines
With 15 airlines and 93 destinations Stansted is dominated by the low-cost airlines as shown in the following Table.
Air Transport Group, School of Engineering, Cranfield University UKG-45
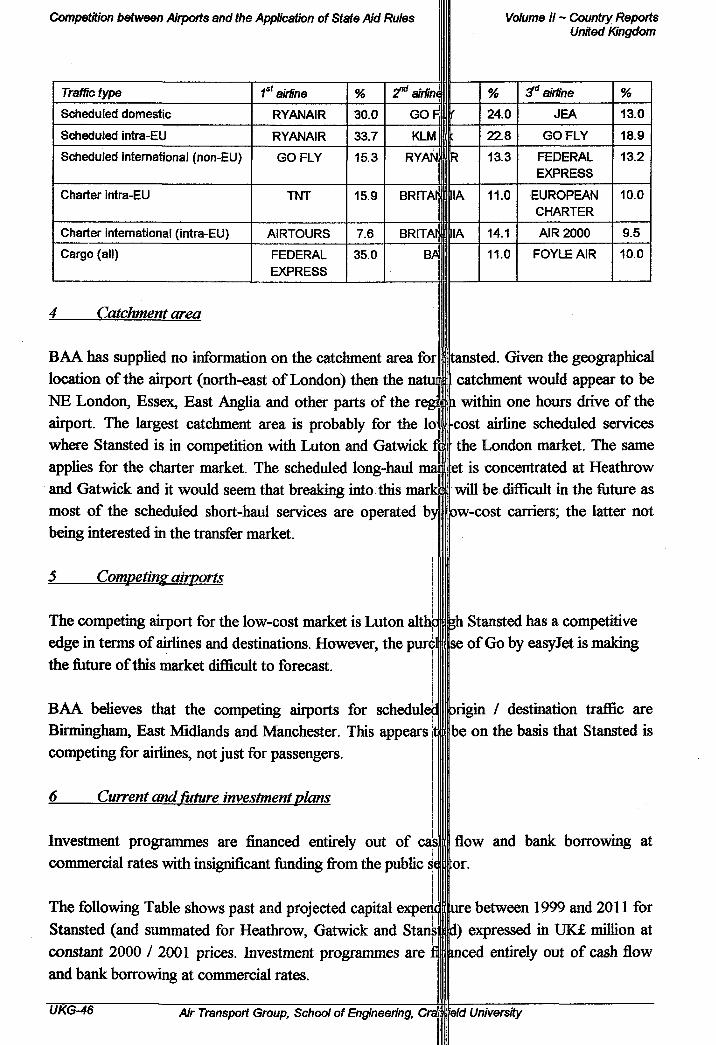
Competition betwæn Airports and the Application of State Aid Rules Volume II ~ Country Reports United Kingdom
Traffic type 1st airline ¡Γ airline Or airline
Scheduled domestic RYANAIR 30.0 GOR 24.0 JEA 13.0
Scheduled intra-EU RYANAIR 33.7 KLM 22.8 GO FLY 18.9
Scheduled international (non-EU) GO FLY 15.3 RYAN R 13.3 FEDERAL
EXPRESS
13.2
Charter intra-EU TNT 15.9 BRITAf IIA 11.0 EUROPEAN CHARTER
10.0
Charter international (intra-EU) AIRTOURS 7.6 BRITAlł IIA 14.1 AIR 2000 9.5
Cargo (all) FEDERAL
EXPRESS
35.0 BAI 11.0 FOYLE AIR 10.0
4 Catchment area
BAA has supplied no information on the catchment area for location of the airport (north-east of London) then the natui NE London, Essex, East Anglia and other parts of the regi airport. The largest catchment area is probably for the lo where Stansted is in competition with Luton and Gatwick f applies for the charter market. The scheduled long-haul ηώ and Gatwick and it would seem that breaking into this mark most of the scheduled short-haul services are operated by being interested in the transfer market.
5 Competing airports
tansted. Given the geographical í catchment would appear to be ι within one hours drive of the cost airline scheduled services the London market. The same
et is concentrated at Heathrow will be difficult in the future as
ow-cost carriers; the latter not
The competing airport for the low-cost market is Luton alth edge in terms of airlines and destinations. However, the purę]} the fixture of this market difficult to forecast.
»h Stansted has a competitive se of Go by easyJet is making
BAA believes that the competing airports for scheduled Birmingham, East Midlands and Manchester. This appears tļ competing for airlines, not just for passengers.
6 Current andfiiture investment plans
Investment programmes are financed entirely out of cais commercial rates with insignificant funding from the public śe
arigin / destination traffic are be on the basis that Stansted is
flow and bank borrowing at :or.
The following Table shows past and projected capital expend! [ure Stansted (and summated for Heathrow, Gatwick and Stans constant 2000 / 2001 prices. Investment programmes are π and bank borrowing at commercial rates.
between 1999 and 2011 for d) expressed in UK£ million at meed entirely out of cash flow
UKG-46 Air Transport Group, Schod of Engineering, Cra 'eld University

Competition between Airports end the Application of State Aid Ruies Volume il - Country Reports United Kingdom
Year
1999/00 (actual)
2000/01
2001/02
2002/03
2003/04
2004/05
2005/06
2006/07
2007/08
2008/09
2009/10
2010/11
Total
% total
Sfansfed
54
104
124
91
38
38
38
38
88
103
112
144
972
14.0
Total
386
479
599
663
723
903
1,021
648
445
412
355
286
6,920
100.0
BAA has no financial interest in the Stansted Express rail link, although they would like to see the Stansted link improved as part of their proposed expansion of the airport from 15 mppa to 25 mppa. A link road is presently being constructed from the Ml 1 to the existing airport access road.
7 Airport charges
Airport charges are incurred for aircraft landings, passenger departures, aircraft parking, noisy aircraft surcharge and peak period surcharge. NATS provide service for approach control and charge separately for it. There is a rebate for remote stand parking, rather than a charge for air bridge use. Security is provided by BAA and they are allowed to recoup 95% of this charge through additional aeronautical charges in general (no specific charge).
Charges are based on MTOW, numbers of passengers, and hours of stand use. There are different passenger charges for domestic, Irish and other international passengers, based on differences in terminal costs.
Charges are set by BAA according to yield basket and X factor determmed by CAA (and periodic review by Competition Commission) under price cap quinquennial reviews.
There are some airport charges discounts at Stansted, but on a strictly non-discriminatory basis. The discounts are introductory, and are related to route development and marketing costs. BAA was not able to give an example of overall percentage.
Air Transport Group, School of Engineering, Cranfídd University UKQ-47

Competition between Airports and the Application of State Aid Rules Volume II ~ Country Reports United Kingdom
8 Financial performance
Refer to Gatwick Section 8
9 Sources of funding
The only known grant was that from TEN-Т in 2001 towardia feasibility study for improved rail links (Mei.OOO). All other mvestment funding is b|ļ|||cash flow and bank loans at commercial rates.
10 Public funding issues
Not an issue, most equivalent competing airports are also nimcing infrastructure mvestment from cash flow and bank loans. Stansted might increase fheir competitive advantage by further improvements to the surface rail access, the latter ļ|ļiost likely being mainly funded externally.
UKG-48 Air Transport Group, School of Engineering, Cremeld University
I I I
I I I
Competition between Airports and the Application of State Aid Rules Volume II ~ Country Reports United Kingdom
Manchester
I Ownership and organisational structure
Manchester airport is 100% owned by local government; the City of Manchester and other local councils. There are no plans to privatise the airport. The stated corporate objectives are to 'develop the hub for the benefit of the regional economy'
Airport services that are provided include:
ATC: provided by third party via airport contract. Police: provided by third party via airport contract Security: provided by airport Passenger and ramp handling: provided by various companies on open market Duty Free: provided by concessionaire Car Parking: Airport and third party
Although still under 'state' ownership, Manchester has developed an interest in other airport companies that had already been privatised. The airport company is now the owner of East Midlands International Airport and Bournemouth International Airport, both profitable companies formerly owned by the bus company National Express. Manchester also has a 83% shareholding in Humberside bitemational Airport. The Group Structure and Board of Directors (some of whom are government appointees) reflect these acquisitions.
Environmental issues at Manchester are linked to current and future EU regulations on noise and emissions. There is a constraint on the use of the second runway at night and the only possible threat might be a ban on night operations.
2 Type of airport
The airport is classified as being a major regional airport while at the same time having a significant number of long-haul international services, which, most countries, would give it the same status as a Gateway International airport. The airports caters for traffic in all market segments with the exception of the low-cost carriers, the latter being not attracted by the current level of airport charges. Although the number of transfer passengers appears to be relatively low, the ultimate aim is to develop the airport as an international hub.
Air Transport Group, School of Engineering, Cranfield University UKG-49

Competition between Airports and the Application of State Aid Rules Volume II ~ Country Reports United Kingdom
Traffic Data (2000)
Domestic flights
Terminal Passengers (arrivals)
Terminal Passengers (departures)
Transfer Passengers
Transit Passengers
Cargo (tonnes - inbound)
Cargo (tonnes - outbound)
ATMs (arrivals+departures)
Aircraft movements (arrivals + departures)
Scheduled
1 429 000
1418 000
88 000
22 500
544
297
49 468
na
СЛаггег
17 000
15 000 :
42 400 : 127
243
1708
na
Total
1 446 000
1432 000
88 000
64 800
Γ 671 540
51 176
62 954
International nights (Intra EU)
Terminal Passengers (arrivals)
Terminal Passengers (departures)
Transfer Passengers
Transit Passengers
Cargo (tonnes - inbound)
Cargo (tonnes-outbound)
ATMs (arrivals+departures)
Aircraft movements (arrivals + departures)
Scheduled
1 943 000
1 932 000
94 500
19 000
9 297
9 045
66 752
na
Charter
2 713 000
2 719 000
na
22 700
716
728
26 651
na
Total
4 656 000
4 651 000
94 500
41000
10 012
9 773
93 413
98 098
International flights (non-EU)
1 Terminal Passengers (arrivals)
Terminal Passengers (departures)
Transfer Passengers
Transit Passengers
Cargo (tonnes - inbound)
Cargo (tonnes - outbound)
ATMs (arrivals+departures)
Aircraft movements (arrivals + çJepartures)
Scheduled
1 169 000
1 155 000
48 000
250 000
48 019
40 098
18 009
na
Charter
1 925 000
1939 000
na
66 000
3 604
I 4 444 17 160
na
Total
3 094 000
3 094 000
48 000
316 000
51623
44 452
35169
36 898
i Route structure and key airlines
British Airways and associates dominate the domestic and influence of the One World alliance). The scheduled inti divided between Delta, BA, Continental, US Airways, E Britannia and other charter airlines have served the Manchesi
atra-EU markets (including the ational market is more evenly ites and Pakistan International. market for many years.
UKG-50 Air Transport Group, School of Engineering, Crmmeld University
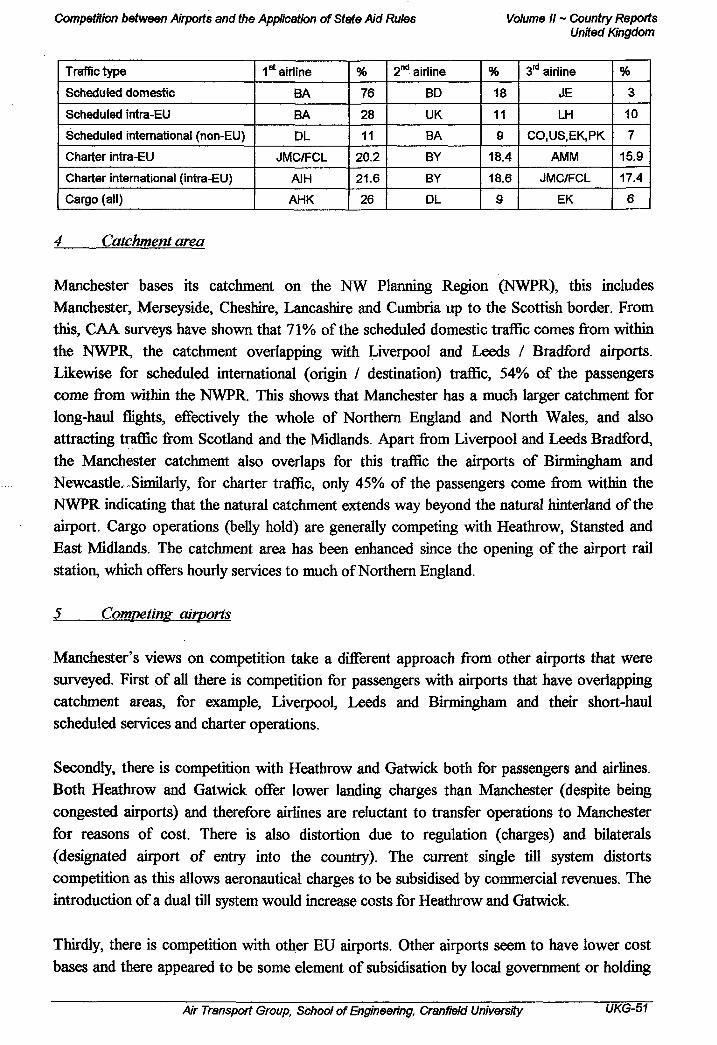
Competition between Airports and the Application of Sfare Л/d Rotes Volume II ~ Country Reports United Kingdom
Traffic type
Scheduled domestic
Scheduled intra-EU
Scheduled international (non-EU)
Charter intra-EU
Charter international (intra-EU)
Cargo (all)
1 s t airline
BA
BA
DL
JMC/FCL
AIH
AHK
%
76
28
11
20.2
21.6
26
2nd airline
BD
UK
BA
BY
BY
DL
%
18
11
θ
18.4
18.6
9
3rd airline
JE
LH
ϋΟ,υβ,ΕΚ,ΡΚ
AMM
JMC/FCL
ΕΚ
%
3
10
7
15.9
17.4
6
4 Catchment area
Manchester bases its catchment on the NW Planning Region (NWPR), this includes Manchester, Merseyside, Cheshire, Lancashire and Cumbria up to the Scottish border. From this, CAA surveys have shown that 71% of the scheduled domestic traffic comes from within the NWPR, the catchment overlapping with Liverpool and Leeds / Bradford airports. Likewise for scheduled international (origin / destination) traffic, 54% of the passengers come from within the NWPR This shows that Manchester has a much larger catchment for long-haul flights, effectively the whole of Northern England and North Wales, and also attracting traffic from Scotland and the Midlands. Apart from Liverpool and Leeds Bradford, the Manchester catchment also overlaps for this traffic the airports of Birmingham and Newcastle. Similarly, for charter traffic, only 45% of the passengers come from within the NWPR indicating that the natural catchment extends way beyond the natural hinterland of the airport. Cargo operations (belly hold) are generally competing with Heathrow, Stansted and East Midlands. The catchment area has been enhanced since the opening of the airport rail station, which offers hourly services to much of Northern England.
5 Competing airports
Manchester's views on competition take a different approach from other airports that were surveyed. First of all there is competition for passengers with airports that have overlapping catchment areas, for example, Liverpool, Leeds and Birmingham and their short-haul scheduled services and charter operations.
Secondly, there is competition with Heathrow and Gatwick both for passengers and airlines. Both Heathrow and Gatwick offer lower landing charges than Manchester (despite being congested airports) and therefore airlines are reluctant to transfer operations to Manchester for reasons of cost. There is also distortion due to regulation (charges) and bilaterals (designated airport of entry into the country). The current single till system distorts competition as this allows aeronautical charges to be subsidised by commercial revenues. The introduction of a dual till system would increase costs for Heathrow and Gatwick.
Thirdly, there is competition with other EU airports. Other airports seem to have lower cost bases and there appeared to be some element of subsidisation by local government or holding
Air Transport Group, School of Engineering, Cranfíeld University UKG-51

Competition between Airports and the Application of State Aid Rules Volume II ~ Country Reports United Kingdom
companies. An analogy was drawn between regulated airpJļlts with no subsidy and airports owned by holdmg companies capable of subsidising airpjļft activities and offering lower charges in order to attract custom.
6 Current and future investment plans
Investment programmes m recent years are tabulated Ьеюл funds is from cash flow. With the relaxation on borros government for borrowing in late 1999 at normal coi Manchester will make greater use in the future of bank loaiiS for financing investment. One area in which Manchester an meet new EU security arrangements; Manchester are already
Note that the prime source of ig (the Airport was freed by
Įcial rates), it is expected that is an additional source of funds
¡fortunate is the requirement to 3mpliant in this respect.
Investment Programmes in past five veàff ( 1996-2001)
Date
1996/01
1996/01
1996/98
1999/01
Application
Runway 2
Capacity enhancement to T3 BA
T1 central / southern front
Baggage systems
Amount
£167m
£74m
£32m
£14m
į irce(s) of funds
\ In-house
In-house
In-house
In-house
%Govt funding
0
0
0
0
Future Investment Programmes (2Q|ļ2-2011)
Daře
02/09
02/05
02/08
Not known
Application
Runway 2 / R2 roads
Baggage systems
Ground transport interchange / metrolink / office block
T2 (next phase)
Amount
£33m
£21 m
£85m
Not known
S ļrce(s) of funds
In- use and private finance
In-t use and private finance
In- use and private ļ finance
%Govt funding
0
0
0
There has been extensive surface access infrastructure co: and 2001 including motorway access, the construction of a r¡ airport has contributed much of the finance although thi contribution (from internal resources and private fin; infrastructure developments (projected expenditure in th expected over the next ten years, the Manchester Metrolink
acted between the period 1992 station, new bus terminal. The
(scale and proportion of such ig) is not known. Further
Jregion of £100 million) are be extended to the airport
ÜKG-52 Air Transport Group, School of Engineering, СгаШш University

Competition between Airports and the Application of State Aid Rules Volume II ~ Country Reports United Kingdom
and the rail station will be extended with possibly a new spur line to the main railway network.
7 Airport charges
Charges are incurred for take-off, passenger service, aircraft parking, ATC, security and night / noise supplements. Charges are reduced for off-peak use. Principal charges are based on MTOW. Charges are set and reviewed on an annual basis in consultation with users. Charges are regulated. All discounts are published. Off-peak discounts are available and discounts for new services are available for between 3 and 5 years. Traffic growth incentives are also available, these come out of the marketing budget.
8 Financial performance
The accounts are published in the Annual Report and these are summarised in the following Table.
Summary of Profit and Loss Account (UK£ million)
Year ending
Aeronautical income
Concession income
Other income
Total income
Staff costs
Security costs (1 )
Policing costs (2)
Depreciation
Other costs
Total costs
Operating profit
Interest received
Interest paid
Extraordinary items
Pre-tax profit
Taxation
Wer profit
Dividends paid
Retained profit
03/1999
128
59
69
256
53
na
na
51
88
192
64
5
27
na
42
15
27
17
10
03/2000
131
46
78
255
63
na
na
53
90
206
49
6
26
na
29
12
17
1
Í 6
03/2001
133
42
90
265
68
na
na
50
96
214
51
11
25
na
37
12
25
8
17
Notes (1) There is some difference on the responsibility for airport security costs between EU countries, for example, in France all airport security are paid by government whereas this is not the same in the UK (2) The airport has a contractual relationship for policing
Air Transport Group, School of Engineering, Cranfield University UKG-53

Competition between Airports and the Application of State Aid Rules
Standard rate corporation tax is paid at 30%.
Current accounting practice is to use straight-line depreciatioi
Terminal and buildings Runways, taxiways and aprons Plant and machinery Terminal / airport systems Vehicles, equipment IT equipment
50 years 75 years 10 years na 7 years 1 year
There is no cross-subsidisation between Manchester, East fy regulator does not permit this and the latter two airports are r
9 Sources of funding
Public Sector Grants have been received between 1996 and 2( studies:
TEN-T 1998 Ground transport interchange Phase IM TEN-T 1999 Multi-modal interchange Phase 2 Ī M€0.800 TEN-T 2000 Ground transport interchange Phase 2B, TEN-T 2001 Feasibility study for TransPennme and Manchester Airport, M61.500 TEN-T 2001 Manchester Airport ground transport ini!
Note that in the UK, TENS funds are only available for p elsewhere, for example, at Milan Malpensa TENS funds wei Schiphol for runway construction. TENS funding can di Finningley v Humberside where the former may be develop whereas at the latter Manchester provided the development ftj
10 Public funding issues
There are no public funding issues although there are concerif by the State and therefore subsidised in some countries and ц
Volume II ~ Country Reports United Kingdom
over the following periods:
Hands and Bournemouth as the g-fenced.
»1 for the following projects /
).500 rt A: Rail Station Extension
1€0.504 orth Wales - improved links to
change Phase 3, M€1.000
)lic transport. This is different used for airport expansion and art competition, for example, i using funds from this source is themselves.
that airport security is paid for in others.
UKG-54 Air Transport Group, School of Engineering, Crai ild University

Competition between Airports and the Application of State Aid Rules Volume II ~ Country Reports Accession Countries
ACCESSION COUNTRIES (ACC)
1 Government Policies
1.1 General
The Accession countries are Bulgaria, Cyprus, the Czech Republic, Estonia, Hungary, Latvia, Lithuania, Malta, Poland, Romania, Slovatóa, Slovenia and Turkey. This review covers the key developments in those countries and airports selected for interview, namely Cyprus (Larnaca airport), the Czech Republic (Prague airport), Estonia (Tallinn airport), Hungary (Budapest Ferihegy airport), Malta (Malta International airport), Poland (Warsaw airport) and Slovenia (Ljubliana airport). These countries, which are currently candidates for the first phase of Accession to the European Union, are currently m the process of the Acquis and are therefore implementing all EU Directives on aviation issues into their own national legislation.
It should be pointed out that there can be different accounting conventions in the Accession countries, so information and conclusions drawn from published financial accounts should be treated with some caution. In certain cases, there is conflicting information from different sources. A detailed investigation, however, is beyond the scope of this study.
1.2 Organisational Structure
Airport ownership and operations in the Accession countries have traditionally been the responsibility of the national Government, often acting through the Ministry of Transport or the state-owned Civil Aviation Authority. In the case of the countries in the former Soviet block, the national airline, airports and air traffic control services were all organised into a single entity, which was also responsible for national civil aviation policy and regulation. In the other Accession countries e.g. Cyprus and Malta, the national carrier and airport / air traffic control operations have been separate, but both have historically been under state ownership.
The requirement to upgrade their airport infrastructure has prompted many Accession countries to introduce an element of private ownership in the airport sector. This can also bring in much needed foreign currency earnings. Airport privatisation has also been also been encouraged by the major international agencies such as the European Bank for Reconstruction and Development (EBRD) and the European Investment Bank (ЕШ).
Ar Transport Group, School of Engineering, Cranfield University ACC-1

Competition between Airports and the Application of State Aid Rules Volume II ~ Country Reports Accession Countries
1.3 Regulatory Environment
In common with all EU Member States, the national governilent is ultimately responsible for overall policy and regulation in the aviation sector in all |ļf the Accession countries. In general, the Mmistry of Transport (or a body reporting to t l | | Ministry e.g. the Civil Aviation Authority) undertakes this role - although other govemmeipl ministries can be involved e.g. for environmental issues.
In conjunction with the relevant EU authorities, the Accessi relevant legislation and making the necessary organisatì implement the Acquis. To comply with EU laws of no: countries will need to re-adjust their aeronautical charging no discrimination between the charging of domestic traffic fri There are also issues of transparency in respect of airport seem to be receiving discounts at their main hub airports airport in Slovenia)
| countries are implementing the and structural changes to
lisrømination, some Accession phanisms to ensure that there is
cross-border intra-EU traffic. rges as some national carriers
ì.g. Adria Airlines at Ljubliana
7.4 Airport Ownership Policy
To date, three Accession countries have partially privatisedj Slovenia, Hungary and Malta. Ljubliana airport in Slovi Exchange quoted airport companies in Europe (the others Unique Zurich, Vienna and TBI pic). Budapest Ferihegy some four years ago, but with mixed success (see belov^ International Airport was sold to an international consortii early to judge the success of this venture.
leir main international airport, la is one of just seven Stock ļ BAA, Frankfurt, Copenhagen, jort in Hungary was privatised
40% of the equity of Malta earüer this year, but it is too
Cyprus is currently in the process of tendering for build ope||te transfer (BOT) concessions for new passenger terminals at Larnaca and Paphos airpon L whilst both Estonia and the Czech Republic have announced their intention to privatise lleir main intemational airports. Of the airports interviewed, only Warsaw seemed to have ņjļļplans for privatisation, despite significant expansion m the past five years.
In the case of smaller regional airports in the Accession cļļuitries, there has been limited privatisation, mainly to national private interests, although t h Ä are some exceptions (e.g. the UK property company, the Wiggins Group, has invested in| flPlzen-Lin airport in the Czech republic). Given the small size of these regional airports, hqlpver, it is difficult to see how most of them will ever be financially viable within the private lilptor.
ACC-2 Air Transport Group, School of Engineering, СгалйШ University

Competition between Airports and the Application of Stete Aid Rules Volume II ~ Country Reports Accession Countries
1.5 Air Service Agreements
Most of the Accession countries have negotiated individual air service agreements with each EU Member State and have not yet implemented the 'open skies' policy required under the Acquis. In practical terms, it is unlikely that there will be substantial changes in the structures of most air services to and from the Accession countries as most routes are too thin to support more than one airline operator (or one plus a code shared airline). There are, however, some exceptions to this e.g. London-Larnaca or Frankfurt-Prague, where new EU airlines may wish enter the market, potential to the benefit of the airport - but possibly to the disbenefit of the national carrier in the Accession country concerned.
In all Accession countries, nearly all inter-continental services are limited only to the main international gateway airport. Traffic levels on these routes are relatively low, so competitive services at regional airports are unlikely to be viable, irrespective of any conditions within the relevant Air Service Agreements.
1.6 Public Service Obligation (PSO) Routes
Aere are no Public Service Obligation routes in any of the Accession countries selected for study - although most of these countries are relatively small and alternative forms of transport e.g. train are available.
Air Transport Group, School of Engineering, Cranfield Universäy ACC-3
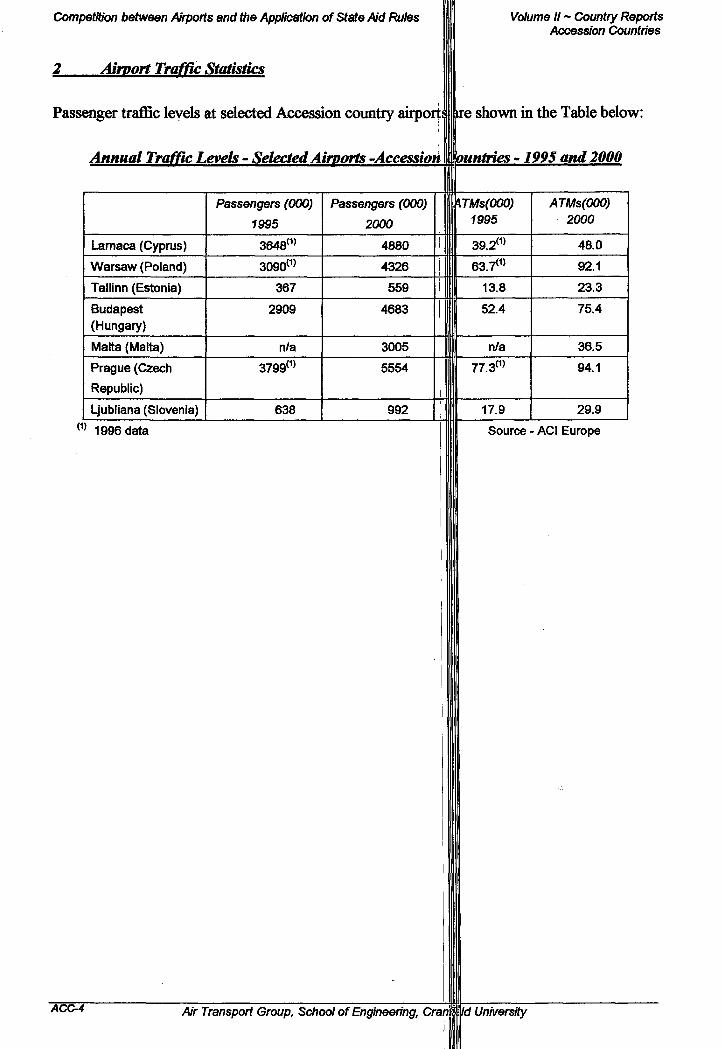
Competition between Airports end the Application of State Aid Rules
Airport Traffic Statistics
Volume II - Country Reports Accession Countries
Passenger traffic levels at selected Accession country airportlļire shown in the Table below:
Annual Traffic Levels - Selected Airvorts -Accession mpuntries -1995 and 2000
j Larnaca (Cyprus)
1 Warsaw (Poland)
Tallinn (Estonia)
Budapest (Hungary)
j Malta (Malta)
Prague (Czech
Republic)
| Ljubljana (Slovenia) (1) 1996 data
Passengers (000)
1995
3648(1)
3090(1)
367
2909
n/a
3799(1)
638
Passengers (000)
2000 |
4880 |
4326
559 |
4683
3005 |
5554
992 |
hTMs(000) 1995
¡J 39.2 (1 )
63.7(1)
ll 1 3 · 8
52.4
II n/a
7 7 · 3 ( 1 )
Il 17-9
| Source
ATMs(000) 2000
48.0
92.1
23.3
75.4
36.5
94.1
29.9
- ACI Europe
ACC-4 Mr Transport Group, School of Engineering, Cranm/d University

Competition between Airports and the Application of State Aid Rules Volume II ~ Country Reports Accession Countries
3 Airports
Budapest Ferihegy
Budapest Ferigehy Airport is Hungary's principal international airport. Sited some 16 kilometres to the southeast of Budapest city centre, it was originally constructed in 1945.
The airport provides a range of scheduled international services to EU and Eastern Europe destinations, through Hungary national carrier, MALEV and its code share partners (who account for some 51% of passengers) and through other airlines (e.g. Lufthansa, British Airways and Air France). There are occasional charter flights to holiday destinations.
During the Soviet era, MALEV and Hungary's airports and its air traffic services were unified under a single body. MALEV was split ofifin 1973, leaving the 100% state-owned LRI (Air Traffic and Airport Administration). LRI was itself split into separate bodies, Hungarocontrol and Budapest International Airport Operations pic in December 2001. Both enterprises are still 100% state owned.
The published financial accounts for LRI appear to suggest the combined airport/ATC service is financially stable (net profit in 2001 = HUF 2.8 million). Separate accounts for Budapest Ferihegy airport or for FUF are not available.
In 1998, the then-operating group, LRI, decided to expand the Budapest Ferihegy airport by constructing a new international terminal (2B) under a build operate transfer (BOT) scheme. A special project company, FUF, was established in conjunction with the Canadian company, Airport Development Corporation (ADC) in association with Aeroport de Montreal. ADC themselves invested some EUR 17 million in this venture, with a further EUR 103 million raised through commercial loans. ADC retained a 34% stake in FUF when the new terminal building opened. However, as a result of the splitting up of LRI in 2001, new legislation was passed by Act of Pariiament, which prohibited the new airport company (Budapest International Airport Operations pic) from outsourcing part of its functions (e.g. Terminal 2B) to third parties. As result, FUF was 'renationaliseď and ADC have subsequently sued for their subsequent losses. These issues are as yet unresolved.
The future structure of airport ownership and operations in Hungary therefore seems uncertain, with state-ownership and funding of airport apparently the preferred option of the Hungarian government.
AJr Transport Group, School of Engineering, Cranfield University ACC-5
Competition between Airports and the Application of State Aid Rules Volume II ~ Country Reports Accession Countries
Larnaca
Cyprus' two civil airport at Larnaca and Paphos are currei Cyprus Civil Aviation Authority, which is part of the Works. Larnaca is the larger of the two airports, both p: inbound tourist traffic. Paphos is predominately chartęi towards the package holiday/villa resorts at the western eii( other Accession countries, the strategic planning and airports is carried out centrally at the Civil Aviation Auj Given this centralised management, neither airport competes
A •sill«
fij I
At both airports, a high proportion of traffic is represented to the UK, although several routes to other European deşj scheduled airline operators include Cyprus Airways, Olympic, with charter services provided by Eurocypria, B; other major charter operators.
In 2000, the Ministry of Communications and Works terminals would be constructed at both Larnaca and Pap] operate transfer (BOT) concession for between 15-20 y< cater for some 7.5 million passengers annually and is expl 5ome EUR 350 million is expected to be raised by an ini operator(s)/mvestor(s) to cover the cost of construction ani Greek government. At the time of writing (June 2002), fi for this following an international tender, although the ten« technical reasons.
fit
|y owned and operated by the istiy of Communications and /hich cater predominantly for
ļrientated, with flights geared )f the island. In common with icial management of the two mty's head office in Nicosia.
tainst the other.
scheduled and charter services itions are also offered. Key
ftish Airways, Lufthansa and da, My Travel, Air 2000 and
lounced that new passenger airports under a single build The terminal at Larnaca will
Įted to be completed by 2005. mtional consortium of airport
operating concession fees to the I consortia had been short-listed
process had been delayed for
Acc-e Air Transport Group, School of Engineering, Cremield University

Competition between Airports and the Application of Sfare Aid Rules Volume II ~ Country Reports Accession Countries
Liubliana
Ljubliana Airport is Slovenia's main international airport and currently handles almost 1.0 million passengers annually.
The airport oflfers a range of services to key EU and Eastern European destinations, primarily through the national carrier, Adria Airways and other European airlines (e.g. Lufthansa, Austrian Airlines, Montenegro Air and Croatia Airlines. Alpe Air and Solinair provide specialist cargo flights. The airport's catchment area covers Slovenia, southern Austria, northeast Italy and certain parts of Croatia, and its main competing airports are Trieste in Italy (some 130 km away), Graz in Austrian and Zagreb in Croatia. As no intercontinental services are provided through Ljubjana, connections are normally made via Vienna or Frankfort.
Originally under foil government ownership, Ljubliana Airport has been corporatised and partly privatised. The Slovakian government retains some 49% of participating preference shares. Of the remaining 51% of ordinary shares, some 36.5% is listed on the Ljubliana Stock Exchange. The current ownership of ordinary shares is broken down as Slovakian government (1.7%), pension fond (7.4%), Slovakian Compensation Fund (6.9%), the Ljubliana local authority (7.6%) and private investors (27.6%). According to the published financial accounts, the airport seems to have been profitable for the past three years. This is perhaps somewhat surprising, given its relatively low volume of traffic.
A single charging system is applied to all airports in Slovenia, based on take-ofdanding charges, passenger service fees, aircraft parking and security charges. It is understood that discounts are available to airlines and that Adria Airways
In terms of infrastructure, there has been some minor investment at the airport in the past five years funded through retained earnings. Future projects include improvements to both the departures and arrivals areas and a new car park. These projects are to be financed by the airport without external support.
Air Transport Group, School of Engineering, CranMd University ACC-7
Competition between Airports and the Application of State Aid Rules Volume II ~ Country Reports Accession Countries >
Malta International
Malta International Airport (MIA) handles some 3 miilil] which are inbound tourists. The airport, which is loca island's capital, Valletta, provides a broad network of sehe a particular focus on routes to the UK, Italy, Germany domestic route to Gozo. Most services are operated by | agreements with British Airways, Olympic, Alitalia and El
The airport operating company, Malta International Airpl Since then the airport has been consistently profitable privatised. Following an international tender, the Malta consisting of Flughafen Wien (53.2%), the Canadian comp: Maltese based firm. Bianchi and Co (10.6%), has purcha» Ltd for approximately EUR 66 million. The Maltese govei 60% of equity.
Under the terms of the 65-year operating concession, consortium will provide technical development, retail, expertise to the airport company. In 2000, the airport achiè tax) of EUR 4.7 million.
passengers annually, most of some 7 kilometres from the
fed services withm Europe, with Libya. There is also a short Malta (which has code-share
Ltd, was established in 1991. id has recently been partially Iditerranean Link, a consortium 1, SNC Lavalin (36.1%) and the ¡ome 40% of the equity of MIA lent has retained the remaining
ie Malta Mediterranean Link rketing and human resources
a net result (after interest and
ACC-B Air Transport Group, School of Engineering, Cranmld University

Competition between Airports and the Application of Siafe Aid Rules Volume II ~ Country Reports Accession Countries
Prnsue
Prague Ruzyně Airport is owned by the government of the Czech Republic and is operated by the Czech Airport Authority s.p, a 100% state-owned body that reports to the Ministry of Transport and Communications.
Situated some 10 kilometres to the west of Prague city centre, the airport is a fast growing eastern European hub offering a variety of routes to major EU and Eastern European destinations. The national carrier, CSA (Czech Airlines) operates the majority of services, code shared with its partners in the SkyTeam alliance. The Czech government owns CSA, but there are plans to privatise a 35% stake in 2003.
To date, the Prague Ruzyně Airport has been developed through government subsidies and through sovereign guarantee loans. There are plans to build two new passenger terminals and a new parallel runway in the next five years. Possible privatisation of the airport or the Czech Airport Authority has been discussed for several years, and EBRD have attempted to promote the development of the Czech airport sector through build operate transfer (BOT) and similar schemes. At present, these projects have not been realised, although EBRD remain interested in equity participation in the privatisation of Prague Ruzyně Airport.
There are 10 other civil airports in the Czech Republic handling international traffic. The Czech Airport Authority owns and operates three of these, Brno, Ostrava and Kalový. The remaining seven airports are mainly owned and operated by local municipalities. Under the latest government plans, it is proposed that Brno airport should be a pilot project for privatisation followed by Ostrava, Karlovy and then Prague - unless the Czech Airports Authority can be privatised as a whole.
Air Transport Group, School of Engineering, Cranfield University ACC-9
Competition between A/rporf s and the Application of State Aid Rules Volume II ~ Country Reports Accession Countries
Tallinn
Tallinn Airport in Estonia handles some 97% of the country1 traffic. The airport is managed by Tallinn Airport Ltd, which is 100% owned by the EstomailRovernment.
The airport is sited just three kilometres from Tallinn cil centre. The national carrier, Estonian Air currently handles some 57% of the airport's p | Jsengers and provides scheduled services to Stockholm, Copenhagen, Frankfurt, Hamburg, Riga and Vilnius. Other airlines serving the airport Airways, LOT and the Estonia charter airline, Anhel Tours.
lev, London Gatwick, Moscow, lude Finnair, SAS, Lithuanian
According to its annual accounts, Tallinn Airport Ltd hi (before tax, interest and exceptional items) since its fp: passenger terminal was rehabilitated to increase its capai additional space for commercial activities. This project million sovereign loan from the European Bank for Reconsi 10.0 million loan for the European Investment Bank and retained earnings. A government strategy report prepari Transport and Communications in February 2002 has suggei not be funded by the government but through the privat sources.
generated an operating profit ation in 1992. Recently the to 1.4 mppa and to provide
funded through a EUR 7.6 Įction and Development, a EUR
EUR 2.1 million generated by by the Estonian Ministry for
sd that future developments will lector and various international
ACC-10 Air Transport Group, School of Engineering, Crmfeld University
Competition between Airports and the Application of State Aid Rules Volume II ~ Country Reports Accession Countries
Warsaw Okęcie
Warsaw Okęcie Airport is Poland's main international gateway offering a range of scheduled and charter services throughout Europe, plus a limited range of intercontinental services (e.g. to the United States and Israel). The airport also offers a range of domestic services provided by the national carrier, LOT.
The airport is sited some 10 kilometres to the southwest of Warsaw city centre. It is owned and operated by the State Enterprise PPL (Polish Airports), which is a 100% national government owned airport authority reporting to the Minister of Transport and Maritime Economy. It is also responsible for eight regional airports in Poland and for both en-route and approach air traffic control. There are two levels of airport charges in Poland - with higher rates set at Warsaw rather than at the regional airports. This suggests that some form of cross-subsidisation may occur, both between airports and between airport and ATC funding.
From a financial standpoint, PPL sustained losses amounting to PLZ 68.5 million (EUR 17.4 million) over the years 1998-2000. These losses were investigated by the Polish Supreme Audit Chamber (NIK), who concluded that PPL operations were economically unjustified and, in some cases, in breach of the law. The NIK also charged the Minister of Transport and Maritime Economy with a failure to supervise PPL properly. Unlike airports in the EU, PPL is obliged to pay property taxes on runways and adjacent airport land and to fund the salaries of airport immigration officials.
Warsaw Airport itself has expanded rapidly in the past five years and is currently tendering for a major expansion programme involving a new passenger terminal estimated to cost in the region of EUR 350 million. This is to be funded by PPL, the national carrier, LOT and loans from the European Investment Bank and Citibank. In the longer-term, new road and rail links to the Warsaw city centre are also planned.
Air Transport Group, School of Engineering, Cranfield University ACC-11