S.F. Holding Co., Ltd.
278
1
Transcript of S.F. Holding Co., Ltd.

1

S.F. Holding Co., Ltd. 2019 Semi-Annual Report
2
S.F. Holding Co., Ltd.
2019 Semi-Annual Report
August 2019

S.F. Holding Co., Ltd. 2019 Semi-Annual Report
3
Notice
The Company prepared its 2019 Semi-Annual Report in accordance with relevant regulations and guidelines set forth by the China Securities Regulatory Commission and the Shenzhen Stock Exchange, including the “Publicly Listed Company Information Disclosure Content and Format Guideline No. 3 Semi-Annual Report Content and Format,” the “Shenzhen Stock Exchange Listing Rules,” the “Shenzhen Stock Exchange Standard Operating Guidelines for Small and Medium Enterprises,” and the “Small and Medium Enterprise Information Disclosure Memorandum No. 2 – Matters Related to Periodic Disclosures.” The Company's 2019 Semi-Annual Report was prepared and published in Chinese and the English version is for reference only. Should there be inconsistency between the Chinese version and the English version, the Chinese version shall prevail. Investors can access the Company's 2019 Semi-Annual Report on Cninfo (www.cninfo.com.cn), which is designated by the China Securities Regulatory Commission for Publishing the Semi-Annual Report.

S.F. Holding Co., Ltd. 2019 Semi-Annual Report
4
Chapter 1 Important Information, Table of Contents, and Definitions
The Company's Board of Directors, Supervisory Committee, directors, supervisors, and senior management hereby guarantee that the contents of the Semi-Annual Report are true, accurate, and complete, and that there are no misrepresentations, misleading statements, or material omissions, and shall assume individual and joint legal liabilities.
Wang Wei, the Company's responsible person, NG Wai Ting, the person in charge of accounting work, and
Wang Lixiu, the person in charge of the accounting department (accounting officer), hereby declare and warrant that the financial report within the Semi-Annual Report is true, accurate, and complete.
All directors have attended the Board meeting approving the Semi-Annual Report. Forward-looking statements such as future development plans in this report do not constitute the Company's
promise to investors. Investors are advised to invest rationally and to take into account possible investment risks. The Company is required to comply with the disclosure requirements presented in the Shenzhen Stock
Exchange for Industrial Information Disclosure No.9 – Listed Companies Engaged in the Express Delivery Services Business.
In this Semi-Annual Report, the Company details the possible risk factors and countermeasures that may
occur in the future. For more information, refer to “Section X. Possible Risks and Countermeasures” in “Chapter 4. Management Discussion and Analysis of Business Operation.” Investors shall refer to this information.
The Company does not plan to issue cash or equity dividends, nor to convert equity reserve into share capital
of the Company.

S.F. Holding Co., Ltd. 2019 Semi-Annual Report
5
Table of Contents
Chapter 1 Important Information, Table of Contents, and Definitions ........................................ 4
Chapter 2 Company Profile and Key Financial Indicators ........................................................... 7
Chapter3 Business Overview .......................................................................................................... 10
Chapter4 Management Discussion and Analysis of Business Operation .................................... 43
Chapter 5 Significant Events .......................................................................................................... 77
Chapter 6 Share Changes & Shareholder Details ....................................................................... 102
Chapter 7 Preferred Shares .......................................................................................................... 107
Chapter 8 Directors, Supervisors and Senior Managers ............................................................ 108
Chapter 9 Corporate Bonds .......................................................................................................... 109
Chapter 10 Financial Statements .................................................................................................. 110
Chapter 11 List of Documents Available for Inspection ............................................................. 277

S.F. Holding Co., Ltd. 2019 Semi-Annual Report
6
Definitions
Term Description
Reporting period January 1, 2019 to June 30, 2019
The same period of previous year January 1, 2018 to June 30, 2018
The Company, The listed Company, SF Holding
S.F. Holding Co., Ltd., formerly known as Maanshan Dingtai Rare Earth and New Materials Co., Ltd. After completing a major asset restructuring (as defined below) inDecember 2016, it was officially renamed to S.F. Holding Co., Ltd. in February 2017.
RMB Renminbi yuan
Mingde Holding Shenzhen Mingde Holding Development Co., Ltd., the controlling shareholder of S.F. Holding Co., Ltd.
Dingtai New Materials Maanshan Dingtai Rare Earth and New Materials Co., Ltd., The predecessor of S.F. Holding Co., Ltd., it was renamed to S.F. Holding Co., Ltd. in February 2017.
Taisen Holding Shenzhen S.F. Taisen Holding (Group) Co., Ltd., a subsidiary of S.F. Holding Co., Ltd.
Shunda Fengrun Ningbo Shunda Fengrun Investment Management Partnership (Limited Partnership)
Jiaqiang Shunfeng Jiaqiang Shunfeng (Shenzhen) Equity Investment Partnership (Limited Partnership)
Zhaoguang Investment Shenzhen Zhaoguang Investment Co., Ltd.
Oriza Shunfeng Suzhou Industrial Park Oriza Shunfeng Equity Investment Company (Limited Partnership)
Guyu Qiuchuang Suzhou Guyu Qiuchuang Equity Investment Partnership (Limited Partnership)
Shunxin Fenghe Ningbo Shunxin Fenghe Investment Management Partnership (Limited Partnership)
Major asset restructuring
In December 2016, all assets and liabilities (exchange-out assets) of the Company'spredecessor, Dingtai New Materials, was replaced with the equivalent 100% equity(exchange-in assets) of Taisen Holding held by all shareholders of Taisen Holding as of December 31, 2015. The difference between the exchange-in assets and the exchange-out assets was purchased by Dingtai New Materials, the Company'spredecessor, from all shareholders of Taisen Holding, in the form of issuing shares.
The restructuring counterparties
Shenzhen Mingde Holdings Development Co., Ltd., Ningbo Shunda Fengrun Investment Management Partnership (Limited Partnership), Jiaqiang Shunfeng(Shenzhen) Equity Investment Partnership (Limited Partnership), Shenzhen Zhaoguang Investment Co., Ltd., Suzhou Industrial Park Oriza Shunfeng Equity Investment Company (Limited Partnership), Suzhou Guyu Qiuchuang Equity Investment Partnership (Limited Partnership), and Ningbo Shunxin Fenghe Investment Management Partnership (Limited Partnership)
Exchange-out assets All assets and liabilities of the Company's predecessor, Dingtai New Materials, as of December 31, 2015.
Exchange-in assets 100% equity of Taisen Holding as of December 31, 2015.

S.F. Holding Co., Ltd. 2019 Semi-Annual Report
7
Chapter 2 Company Profile and Key Financial Indicators
I. Company Profile
Stock Abbreviation SF Holding Stock Code 002352
Listed Stock Exchange Shenzhen Stock Exchange
Chinese Name of the Company 顺丰控股股份有限公司
Chinese Name Abbreviation of the Company 顺丰控股
English Name of the Company S.F. Holding Co., Ltd.
English Name Abbreviation of the Company SF Holding
Legal Representative of the Company Wang Wei
II. Contacts and Contact Methods
Board Secretary Securities Affairs Representative Name Gan Ling Zeng Jing Address Wanji Business Building, Xinzhou 11th Street,
Futian District, Shenzhen, Guangdong ProvinceWanji Business Building, Xinzhou 11th Street, Futian District, Shenzhen, Guangdong Province
Tel No. 0755-36395338 0755-36395338 Fax 0755-36646400 0755-36646400 Email [email protected] [email protected] III. Other Information
1. Corporate Contact Information
Were there any changes to the Company's registered address, office address or postal code, company website, or to the email address during the reporting period? □ Yes √No There were no changes to the Company's registered address, office address or postal code, company website, nor email address during the reporting period. Refer to the Company's 2018 Annual report for details. 2. Information Disclosure and Location of Report
Were there any changes to information disclosure and location during the reporting period? □ Yes √No There were no changes to the name of the newspaper designated for information disclosure, to the address of website designated by the China Securities Regulatory Commission for semi-annual report publication, nor to the storage location of company's Semi-Annual report during the reporting period. Refer to the Company's 2018 Annual report for details.

S.F. Holding Co., Ltd. 2019 Semi-Annual Report
8
IV. Key Accounting Information and Financial Indicators
Does the Company need to adjust its financial information retrospectively or restate its previous year accounting information? √Yes □No Rationale for retrospective adjustments or restatements Business combination involving enterprises under common control
Current reporting period
The same period of previous year Increase/Decrease over
the same period of previous year
Beforerestatements
Afterrestatements
Afterrestatements
Revenue (RMB) 50,074,704,033.85 42,503,599,511.93 42,550,906,755.42 17.68%Net profit attributable to shareholders of the parent company (RMB) 3,101,111,638.63 2,233,730,274.21 2,209,579,126.20 40.35%
Net profit after deducting nonrecurring profit or loss attributable to shareholders of the parent company (RMB)
2,330,310,116.43 2,090,372,413.37 2,090,372,413.37 11.48%
Net cash flow from operating activities (RMB) 4,816,886,549.68 2,280,581,118.96 2,369,608,790.80 103.28%
Basic earnings per share (RMB/share) 0.70 0.51 0.50 40.00%Diluted earnings per share (RMB/share) 0.70 0.51 0.50 40.00%
Weighted average return on net assets 8.23% 6.67% 6.57% an increase of 1.66percentage points
End of the current reporting period
End of previous year Increase/Decrease over previous year end
Beforerestatements
Afterrestatements
Afterrestatements
Total assets (RMB) 81,037,279,531.30 71,614,568,816.64 71,614,568,816.64 13.16%Total equity attributable to shareholders of the parent company (RMB) 38,405,163,518.71 36,561,011,876.15 36,561,011,876.15 5.04%
V. Differences arising from accounting standard of the PRC and the International Accounting
Standards
1. Differences between net profits and net assets disclosed in the financial reports in accordance with Chinese accounting standards and international accounting standards
□Applicable √Not applicable There is no difference between the net profits and net assets disclosed in accordance with Chinese accounting standards and those disclosed in accordance with international accounting standards in the reporting period.
2. Differences between net profit and net assets disclosed in the financial reports in accordance with Chinese accounting standards and overseas accounting standards
□Applicable √Not applicable There is no difference between the net profits and net assets disclosed in accordance with Chinese accounting standards and those disclosed in accordance with overseas accounting standards in the reporting period.

S.F. Holding Co., Ltd. 2019 Semi-Annual Report
9
VI. Non-Recurring Profit or Loss
√Applicable □Not applicable Unit: RMB
Item Amount Note
Gains on disposals of non-current assets (including offsetting amount for the provision of impairment of assets) 315,373,555.74
The amounts of such gains during the first half year of 2018 and 2017 are of 83,365,835.91 and -16,019,009.67 respectively. The amount for the current period mainly represents the investment income from disposal of subsidiaries.
Government grants recognized in profit or loss for the current period (excluding government grants that are closely related to the Company's business operations, in accordance with national uniform standards)
175,408,699.42
It mainly represents government subsidies arising from fiscal appropriation, transportation capacity subsidies and tax refund, etc.
Gains or losses from changes in fair value of financial assets and liabilities held for trading, derivative financial assets and liabilities, and investment (losses)/gains arising from the disposal of financial assets and liabilities held for trading, derivative financial assets and liabilities and other debt investments, excluding hedging activities related to the normal business operations of the Company
347,394,450.91
The amounts of such gains during the first half year of 2018 and 2017 are of -7,644,717.08 and -2,857,548.88 respectively. The amount for the current period is mainly attributable to the gains arising from changes in fair value of other non-current financial assets.
Net amount of other non-operating income and expenses 10,683,463.79 Less: Income tax effect 78,025,730.22 Profit or loss attributable to minority shareholders (after tax) 32,917.44
Non-recurring profit or loss attributable to shareholders of the parent company 770,801,522.20 --
Provide explanations for classifying non-recurring profit and loss items defined in the Explanatory Announcement No. 1 for Public Company Information Disclosures – Non-recurring Profits and Losses, and for classifying non-recurring profit and loss items listed in the Explanatory Announcement No. 1 for Public Company Information Disclosures – Non-recurring Profits and Losses as recurring profit and loss items. □Applicable √Not applicable The Company has not classified non-recurring profit and loss items defined or listed in the Explanatory Announcement No. 1 for Public Company Information Disclosures – Non-recurring Profits and Losses in the reporting period.

S.F. Holding Co., Ltd. 2019 Semi-Annual Report
10
Chapter3 Business Overview
I. Primary business of the Company during the reporting period
Is the Company required to comply with disclosure requirement of a particular industry? Yes Express Delivery Service Industry
SF Holding is a leading integrated express logistics service provider in China. After years of development, it has basically established the capabilities of providing integrated comprehensive logistics solutions to customers. Not only does it provide high quality logistics services from the delivery end, it has also extended its services to segments of production, supply, sales and distribution in the front-end of the value-chains, and catered to consumer demand by using data technologies such as big data analysis and cloud computing to provide customers with comprehensive solutions including warehousing management, sales forecasting, big data analysis and. The logistics products of the Company mainly include various types of express services such as express delivery, economy express delivery, intra-city delivery, warehousing service and international express delivery; express transportation services focused on LTL (less than truckload) service; and cold chain transportation services for customers in the fresh produce, food products and pharmaceutical segments. Moreover, SF Holding also provides value-added services such as insurance and Cash on Delivery (COD) as well as diversified and refined services to customers.

S.F. Holding Co., Ltd. 2019 Semi-Annual Report
11
Based on the diverse needs of different industries, customers and scenarios, SF Holding adheres to the “customer-centric, demand-driven and experience-based” product design philosophy that focuses on each industry’s unique characteristics, and starts from the application scenarios of customers to drill into their requirements for different use cases within the end-to-end whole process and other individual requirements of customers. Thus SF Holding is able to design suitable products, services and solutions for customers while creating value-added differentiation, and such product design in turn drives internal resource allocation and optimizes the product system. SF Holding continues to enhance the competitiveness of its service quality by providing customers with experience of fast product delivery and high service quality; continues to optimize operation model and enhance resource efficiency while reducing costs and increasing efficiency, providing customers with cost-effective services and achieving win-win for the Company and its customers. Meanwhile, SF Holding enables product innovation with technologies to create industry solutions and provide customers with integrated comprehensive logistics services.
SF Holding is also a smart logistics operator with network scale advantages. SF Holding has a gigantic logistics network at home and abroad, including an “aviation network” consisting of all-cargo aircraft, commercial flight and drones; a “ground network” consisting of operating service points, transit and distribution service points, land transportation networks, customer hotline networks, and last mile networks; and an “information network” consisting of various types of big data, blockchain, machine learning and planning optimization, AI recognition for voice/image/computer graphics/smart security checks and smart logistics map. The three networks are integrated into one “aviation +ground + information” network. This directly operated network has domestic and overseas coverage and is a comprehensive logistics network system with the most powerful network control, the highest stability, and the most unique resources in the industry domestically.
SF Holding adopts a direct operation model. The headquarter implements centralized operation and
management of all branch offices. It also centralizes collection, delivery, distribution, processing, transit and transportation, and allocates network resources according to the actual needs of business development. Meanwhile, SF Holding uses a large number of information technologies to ensure that the entire network implements uniform standards, and has established a number of industry-leading business information systems to ensure the quality of overall network operations. SF Holding is currently the first express delivery A-share company that adopts the direct operation model.

S.F. Holding Co., Ltd. 2019 Semi-Annual Report
12
II. Major Changes in Key Assets
1. Major Changes in Key Assets
Key Assets Description on major Changes
Accounts receivables Increased due to increase in revenue.
Other current assets Increased due to increase in wealth management products.
Equity assets No major changes.
Available-for-sale financial assets In accordance with new standards for financial instruments , “available-for-sale financial assets” has been reclassified to “Investments in other equity instruments” and“other non-current financial assets”for the current period.
Investments in other equity instruments Same as the above explanation for available-for-sale financial assets
Fixed assets Increased due to the addition of aircraft, accessories and buildings.
Construction in progress No major changes.
Intangible assets Increased due to the recognition of intangible assets arising from business combinationand completion of self-developed software.
Goodwill Increased due to the business combination.
2. Key Overseas Assets
√Applicable □Not applicable
Details of Assets
Method of Formation
Asset Size (RMB)
Location Operating Model
Controls Net Profits (RMB)
Proportion of Company's Net Assets
Significant Risk of Impairment?
CHUI YUK HOLDING LIMITED and its subsidiaries
Acquisition 3,935,315,496.90 Hong Kong Industrial park — 20,186,497.53 10.25% No

S.F. Holding Co., Ltd. 2019 Semi-Annual Report
13
III. Core Competitiveness Analysis
(I) Extensive technological capabilities contribute to its unique core competitiveness in the industry
(I) Extensive technological capabilities contribute to its unique core competitiveness in the industry
SF Holding continues to emphasize on and proactively invests in the construction of its various smart logistics infrastructures, aiming to develop into a technology-driven industry solution service company with its technology-led, innovation-driven, extensive operation and active exploration business model.
In terms of talents, as of the end of the reporting period, SF Holding employed more than 5,000 technology
staff, including outsourced labour, which is with a good talent structure. Regarding cooperation with universities and enterprises, in 2019, apart from maintaining close cooperation with universities at home and aboard, including Georgia Institute of Technology in the United States, Harbin Institute of Technology and Beijing University of Aeronautics and Astronautics, the Company also successively established cooperation relations with many famous universities at home and abroad such as Shanghai Jiao Tong University, Xi'an Jiaotong University, Shenzhen Finance Institute etc. to further integrate diverse internal business scenarios with professional academic expertise, striving to realize rapid upgrade of technological capabilities in core areas of big data, blockchain, operation optimization, drones and robots. In addition, the Company specially invited top-notch experts and professors from renowned academic institutions such as Stanford University, University of California, Berkeley and Nanjing University as well as industry experts to deliver lectures or exchange ideas for continuous exploration in areas of innovation and research of smart logistics technologies, so as to accelerate implementation and application of industry-leading technologies in area of smart logistics.

S.F. Holding Co., Ltd. 2019 Semi-Annual Report
14
In terms of technology, in the first half of 2019, SF Holding continued to enhance investment in research and development technologies in areas such as big data and products, artificial intelligence (AI) and application, precise map platform, smart equipment, intelligent hardware and integrated logistics solutions, which yielded stable enhancement of its scientific capabilities. By the end of the reporting period, SF Holding had a total of 1,982 patents and 854 copyrights awarded or under application. The number of invention patent applications in the first half of 2019 accounted for 60% of the total. At present, in terms of the number of patents held, SF Holding ranks first in the domestic express delivery industry, and it is actively preparing for international patent applications. The utilization of technologies and patent development strategy will effectively maintain SF's competitive strength in logistics and related fields.
SF Holding’s major projects of smart logistics include:
1. Big data and blockchain technology application
(1) Big data ecosystem construction
As of the end of the reporting period, on the basis of continuous optimization of data collection and integration, desensitization and security mechanisms, machine learning and data visualization, automated operation maintenance and scheduling platforms, SF Holding further supported the business expansion in various business segments of the Company including delivery, warehousing, freight, cold chain as well as pharmaceutical transportation, international express, supply chain, with the amount of business data collected surpassing 35PB level and the amount of average daily computation surpassing 1PB.
On the basis of established products and services of big data, SF Holding significantly reduced its investment
cost in hardware resources through continuous technology optimization and experience upgrade; incorporating computer vision technology, the Company has built the Internet of Vehicles (IoV) solution to realise intelligent monitoring of driving behaviors of drivers; through applying big data and AI technology in more than 20 projects, the Company has greatly improved its operation and management efficiency, realized digitalized management of the entire network, and further guaranteed SF's commitment of timeliness to customers while reducing cost and enhancing efficiency for various business lines including operation, markets, human resources, finance and property.
In 2019, SF’s Big Data Platform was granted the “Best Practice Case of Big Data” award from the Ministry of
Industry and Information Technology (MIIT), while the Data Beacon won the first prize of the first year of Science and Technology Award in the postal industry. Through big data-enabled smart transformation of cooperative enterprises, SF Holding has laid out and implemented scenario-based intelligent big data solutions in many areas such as fresh produce retail, telecommunications and energy, and has also realized digitalization transformation and upgrade for customers in traditional industries.
(2) Blockchain technology application
With the development of blockchain technology, SF Holding has successfully applied blockchain technology in various scenarios based on its own business development requirement and strategic planning, and gradually built up fully-engineered technical barriers for blockchains from academic papers to code, code to software, software to products, and products to platforms. Regarding the traceability of drugs, vaccines, and medical devices, blockchain technology is compatible with mainstream codes such as drug supervision code and GS1. Combined with IoT, big data and packaging technologies, blockchain technology helps more pharmaceutical companies and regulatory bodies achieve whole process traceability as well as quality and safety monitoring through integrating cold chain solutions for drug supply chains and warehousing vehicles. Regarding cross-border commodity, food and agriculture industry, through self-developed anti-counterfeiting technology and blockchain encryption scheme together with the quality control systems inside and outside of SF's ecosystem, blockchain technology provides agricultural customers with integrated solutions for intelligent agriculture consulting, logistics distribution and terminal sales to protect food safety.

S.F. Holding Co., Ltd. 2019 Semi-Annual Report
15
2. Smart logistics map
SF’s smart logistics map platform, based on the high-precision address platform of SF, is extensively applied to the whole process of logistics including customer ordering, smart scheduling, transit sorting, planning transportation, terminal distribution and operation management, providing smart location decision service more tailored to logistics scenarios. Operation iteration has created the first logistics map service product of industrial grade in China which has become the infrastructure for the construction of SF’s digital and smart facilities.
In the area of accurate address service, SF Map leverages on big data of geographical information in daily
average volume of hundred million and the core technological advantages in the self-developed 18-tier Chinese address phrases to create an accurate smart address service platform. In the area of customer ordering, the accurate address service platform utilizes accurate address matching services such as two-way geographical code, address association, address correction and address reachable system to assist users in completing address input and enhance the standardization level of addresses and user experience. The smart scheduling and transit sorting segments, with the smart map routing distribution service as the core to build a closed-loop of operation with forward and reverse business data mining, form a complete set of comprehensive, efficient and accurate regionalized distribution solutions which also support diverse logistics scenarios such as “shipments from store”, front warehouse distribution and smart cloud warehouses. The smart map distribution service has innovated the processing model of online express parcels. Currently, the accuracy is even more than 99% under application scenarios of smart scheduling, transit sorting and over-range address identification for couriers of express delivery. In particular, the identification rate and accuracy of routing automatic distribution under the transit sorting scenario is close to 100% in first- and second-tier cities, aiming to create a domestic top routing network. The daily average request volume of the smart sorting operation carried out through SF’s “Fengme Order (丰密订单)” routing sorting code reaches hundred million times, reducing over 70% manual inspection processing volume caused by abnormal parcels. The SF address reachable system determines the delivery service area in advance, greatly reducing the terminal transfer cost for over-range express parcels. In the area of high-precision map service, SF Map focuses on the planning of walking and cycling routes for the “last mile” and the breakthrough in truck navigation, predicting the required time, mileage and planned routes for logistics according to different freight transportation capacities to enhance the due delivery efficiency. In the area of location decision service, SF Map supports GPS, Beidou Navigation Satellite System, Wi-Fi, and base-station fusion location positioning to provide a range of LBS logistics management decision-making services. As of the end of the reporting period, the Smart Logistics Map has managed a daily average of 700 million data for couriers’ location and 7.5 million kilometers of ground track data; the daily average request volume of cloud services has reached 330 million and the daily average request volume of terminal SDKs has exceeded 700 million times.
Outside SF’s logistics scenario, SF Map opens the logistics precision map service platform to cooperative
partners of the SF Group to promote digital and smart development of supply chain and retail business in the vertical segments of petroleum and tobacco. In the areas of public security, fire safety, emergency instruction and urban management, map data fusion technology and accurate address service are provided to help government authorities better manage and operate map data by linking up data islands to enhance government decision-making capabilities, providing map technology support for construction of new-style smart cities and related areas.

S.F. Holding Co., Ltd. 2019 Semi-Annual Report
16
3. Smart decision-making
(1) Business demand forecasting
Precise and efficient business demand forecasting is one of the core fundamentals in the transition from traditional decision making to smart decision-making of the logistics industry. It is difficult for traditional demand forecasting models to support the business needs of SF Holding because of issues such as low precision, slow speeds and ineffectiveness when attempting to solve service points demand forecasting problems relating to holidays, various effects of seasonality, complicated growth trends, and seasonal product effects.
SF Holding, has built a business demand forecasting system with deep learning, machine learning and time series forecasting technology, that is highly compatible with characteristics of the logistics industry, to create business forecasts on hourly, daily, monthly and other dimensions, and covered business demand forecasting in areas such as receipt and delivery, transition, warehousing management, flow direction, calls of customer services centers and characteristic economy. Meanwhile, combining advanced data model as well as algorithm technology and information platform development technology, SF has also built a business demand forecasting platform which can help data scientists and engineers complete model deployment promptly, deduct labor cost for model development and support large-scale data forecasting effectively and smoothly. Through historical time series data backtesting, the platform automatically selects the most appropriate model and parameter combination, greatly reducing development time length and version iteration cycle while responding to business change in a timely manner. The platform contains various model libraries to meet different timing characteristics and diverse business scenarios. Currently, it has provided forecast data which covers 100% of the service points in the entire network. In particular, flow direction forecasting provides forecasting for receipt and delivery, flow directions in cities, product groups as well as heavy section to support resource planning in peak time.
Currently, this service has been used to support business scenarios such as manpower planning, smart
scheduling and task dispatch at peak periods to help resource allocation for different business periods, so as to reduce costs and improve efficiency.
(2) Site selection programming
In the logistics industry, selecting appropriate location of operation centers is crucial to the efficiency and operation cost management of the entire logistics network. Traditional site selection of the logistics industry is carried out with manual calculation and experience-based reasoning, which has problems such as insufficient support by data and logic, poor performance on scientific decision-making, and being labor intensive and time-consuming.
SF Holding has established a site selection planning system for the logistics industry by using big data,
operation research algorithms and machine learning technology in light of constraints in actual business scenarios, fully considering various factors such as site function positioning, transfer capability coordination, customer experience and site costs. Meanwhile, SF Holding has also constructed a high-standard and visualized information system that can support site planning and operation management, to assist the Company in planning and making decision of investment and management through online streamlining process and model intelligent recommendation science. The system also develops a complete data display monitoring system through which details of site selection plans with site layout can be seen at a glance in the form of visual display, and real-time monitoring can be carried out after the plan is implemented, thus reducing consuming of manual labor as in traditional site selection approach and improving the operational efficiency of the enterprise.

S.F. Holding Co., Ltd. 2019 Semi-Annual Report
17
(3) Intelligent network and route planning
SF Holding has already built a versatile system consisting of a comprehensive network and route planning algorithm that can be applied in various business scenarios. This system, integrating models of network design, route planning, resource optimization and random simulation, helps improve the timeliness and reduce cost in transportation. The network design and resource optimization models output corresponding network structure and configure capacity and operational resources based on specific logistics product requirements together with various key indicators of network such as timeliness, cargo capacity and node processing capability.
Transit model design: The network and route planning system optimizes the partition load in the transit depot
based on integration of inbound and outbound flows, location allocation optimization, and warehouse inventory optimization so that collection and distribution is more efficient.
Transportation route planning: An example is SF’s intra-city high-speed network project
(顺丰同城高速网项目) which requires to manage large number of orders during peak hours with tight timeliness. Therefore, according to the characteristics of the intra-city high-speed network, the project draws on the hub-and-spoke network structure to propose a multi-level network structure that selects the distribution points from the network points and selects the transit points from the distribution points to ensure delivery items convergence, reduce vehicle input and improve operating efficiency of vehicles. The project, which has been implemented in Shenzhen, has planned a new set of routes for feeder transportation for the inter-city business in Shenzhen. Through reasonable planning of driving routes and meeting certain limitations, the project has enhanced the timing efficiency of express delivery in the overall connection network while reducing vehicle transportation cost for express delivery for the purpose of minimum cost, time consumption and distance. With the same standard of time efficiency, intra-city delivery speed is accelerated greatly with the implementation of this project.
(4) Smart staff scheduling
Smart staff scheduling aims at optimizing staff management by creating a platform that can make all staff and shift related information accessible online by using cutting-edge technologies such as operation planning and machine learning, and then automatically generate the scheduling results according to the historical off-line scheduling results and more importantly, automatically generate the optimized staff scheduling results, in order to enhance employee utilization and reduce staff management costs. As a result, the staff arrangement is more optimal and flexible and resource planning is more scientific.
(5) Digitalised management
With SF's huge daily average business volume, the logistics transit segment is crucial and efficient transfer of express parcels must be ensured in order to better provide customers with fast, safe and efficient logistics services. SF Holding has built a digitalized transit operation platform for different business scenarios at gateway hubs. Through operation algorithm and machine learning technology, pre-preparation, in-process early warning and post-analysis are carried out for comprehensive monitoring of various operation processes, while digitalised operation solutions, core data-based analysis and panoramic perspective of core resources are provided to realize express lifecycle management, enable intelligent decision-making and accelerate online and intelligent information and resource management, hence driving transformation of traditional management models. As of the end of the reporting period, digitalised management has been implemented at 100+ sites in SF.

S.F. Holding Co., Ltd. 2019 Semi-Annual Report
18
4. Computer vision
Through comprehensive utilization of computer vision, deep learning and other technologies, video and pictures relating to parcels, personnel, vehicles and sites in logistics scenarios are analyzed. The smart vision system is able to detect the working status of personnel, track the trajectory of parcels and vehicles as well as predicting abnormal behaviors so as to realize smart management and deployment of personnel, vehicles, and sites, etc. It can also effectively prevent damage to parcels and increase the efficiency of site operation. The overall solution includes subsystems for vehicle operation analysis, site 6S management, personal appearance and behavior detection, whole process of cargo traceability, parcel volume measurement, X-ray illegal contraband detection and high-precision map information recognition for segmentation of different business scenarios and automatic analysis of various types of image and video information to clear information black holes for smart logistics.
(1) Image recognition
Text recognition solution: The OCR platform has integrated several Chinese character recognition applications including handwritten paper delivery order, identity card, business license, and general photographic recognition. These applications can recognize specific handwritten or printed text lines by photos in different complex backgrounds, which help dramatically improve the efficiency of manual inputting work. At present, the platform has been applied for long-term use in various internal projects within the Company while enabling external customers to provide industry solutions.
Smart traffic solutions: Due to the demand for high-precision map information in the logistics industry, SF has developed a set of traffic information identification technologies. The products have realised collection of traffic information for road and district areas automatically during the parcel delivery process. Several sub-projects are included, such as traffic sign detection and recognition, detection of traffic lanes and district buildings as well as shop POI information among others. Traffic sign detection and traffic lane detection can not only be integrated into the driving assistance system, but also can be utilized in route planning and help vehicles make decisions in finding accessible route. District building name detection and shop POI information detection, on the other hand, can be utilized for collecting several types of information including district name, building number, shop name and so on. At the same time, the product is able to calculate GPS information within a deviation of 30 meters and automatically accomplish the map labeling to further help and refine high-precision map. The system has been put into trial operation in several cities, saving 99% of the manpower verification costs.
Safe driving platform: ADAS and DMS equipment are installed on operating vehicles to collect environmental
data inside and outside of the vehicles in the first instance for identifying and tracking static and dynamic objects, so that drivers can notice possible dangers, making proactive alarms to arouse attention and improving safety as soon as possible. Alarm information will be uploaded to the safe driving platform, and driving behaviors of drivers are analyzed and evaluated, while corresponding training and learning plans will be formulated to continuously increase safety consciousness and driving skills of drivers, thereby reducing traffic accidents. For drivers at the receiving end, by installing cameras on express delivery cars, illegal driving behaviors of couriers can be identified and alarmed which can improve employees’ safety precautions and reduce loss of lives.
X-ray contrabands identification: X-ray images are identified through deep learning to automatically detect
categories of items passing through security check machines, and then identify contrabands. This measure can improve the performance of security checks by 3 times, with recall rate and accuracy rate that are 9 times and 1.5 times respectively relative to manual security checks, thereby reducing significant systemic risk caused by contrabands.

S.F. Holding Co., Ltd. 2019 Semi-Annual Report
19
Smart retail solutions: Involving all links of people, goods and sites, the solutions meet the demands of the retail industry and brand manufacturers for tracking and inspecting real-time sales and customer flow status in sales channels and sites. By installing cameras at key locations in stores, statistical analysis can be performed on attributes of people such as flow, gender, age, hairstyle and clothing style of customers, while shelf product identification can automatically count and replenish goods on shelves. Regarding sites, store location and store display, etc. are guided through machine visions. Meanwhile, the solutions can also provide couriers with crowdsourcing services and undertake the routing inspection tasks of brand manufacturers under retail environment in various regions, greatly improving inspection efficiency.
(2) Video recognition
The “AI Argus (慧眼神瞳)” with independent product trademarks, patents and software copyrights (hereinafter “Argus”) is the first domestic IVA (Intelligent Video Analysis) industry product independently researched and developed for the logistics industry in China. It can monitor various types of violence and non-compliant operations in operating sites in real-time and as a result of effectively reduce the probability of damaged and lost items. It provides base data for the entire network including parcels traceability, loading rate detection, vehicle scheduling, transportation capacity monitoring, and staff efficiency analysis. Continuous feedbacks like real-time loading rate data of all vehicles in respect of express delivery and express transportation trunk/branch routes promote optimization of transportation capacity and cost, provide full-process image and video segment query capabilities based on package number, realise standardized business process management, site 6S management in the field of the entire network and eliminates management blackholes.
The LPSS (Loading Procedure Structuring System) subsystem, in particular, automatically features vehicle
license plate recognition, vehicle arrival/departure time starting and ending event detection for loading and unloading, instant volume loading rate and staff efficiency analysis through analyzing the monitoring screen of cameras at the loading and unloading ports. LPSS enables digital recovery of the business scenarios at ports and provides supporting fundamental data on vehicle deployment, transportation capacity monitoring, and staff efficiency analysis of the whole network to decrease cost and enhance efficiency.
The VAPD (Violated Action Pattern Detection) subsystem is the algorithm entity for the employees in the
logistics industry such as sorting center and distribution center that can assure package is transported in a standard manner. After deploying AI Argus, the venue data show that the number of damaged items in express transportation dropped significantly by46%, and stabilized in a low-level range with no abnormal fluctuations.
The PLTS (Package Lifecycle Tracking System) subsystem is the world's first information system for
full-scale video segmenting and image tracking of express parcels. Through matching video data of 310,000 cameras with the operation of barcode scanner, the position of express parcels in each operation segment can be found, while anomalies can be checked and identified through inquiry of waybill numbers or vehicle numbers. The time efficiency of verifying and positioning issues can be improved by 2 times, while damage rate can be reduced by means of management. Through collection of high-definition pictures of express parcels by industrial cameras, intelligent detection of outer packaging damage, replacement of outer packaging and non-compliant stickers can be carried out for real-time detection and timely intervention processing to reduce occurrence of damages. With a capacity which is 5 times that of manual detection, intelligent damage detection can detect damage that is difficult to be detected by naked eye and has significant detection results for penetrating damage, damage through wetness, wrinkles/indentations.
The EIAS (Employee Image Assurance System) is mainly used in terminal points by using intelligent image
analysis technology to help business management department enhance the quality and image of employees, and to monitor whether the decoration standards and operating environment of service points and sites and other outdoor facilities in the city meet the standards. Through supervision of vehicle image, safety of transportation vehicles is guaranteed and personal safety of transportation personnel is ensured. The control of package image contributes to reduction of additional operating costs due to illegal packaging.

S.F. Holding Co., Ltd. 2019 Semi-Annual Report
20
By analyzing the monitoring screen of the camera, the 6SPD (6S Pattern Detection)system automatically
identifies whether the image of the site meets the standard and whether the tool is positioned as well as providing fire prevention and anti-theft early warning monitoring and real-time alarm of aggression. With service target that can extend to different industries, the product can improve and enhance corporate image, ensure safe production of enterprises and reduce production costs, achieving network-wide standardized business management and eliminating management blackholes.
(3) 3D perception
Weight and volume have always been the most fundamental elements in the logistics field, for which SF Holding has launched the “Insta 3D”, a solution for volume measurement scenarios. In the collection and delivery process, Insta 3D has solved the problem of manual volume measurement by couriers. Not only can the solution be used to measure regular shape boxes, it can also be used to measure irregular shape boxes the whole process of which can be completed within 2s. Comparing with manual measurement by rulers which takes about 30s, Insta 3D has reduced measurement operation such as manual data input quickly and accurately, thus greatly improving work efficiency.
5. Automatic sorting devices
Based on the fully independent research and development capabilities that have been developed in SF
Holding, smart automatic sorting devices for express transit come as the first step of modern express. Positive effects have appeared in SF Holding through the deployment of smart automatic sorting devices: the 24-hour continuous high-speed processing of parcels has been achieved, the transit processing efficiency has been enhanced effectively, the sorting error rate has been reduced and the service quality has been improved significantly.
Currently, a variety of smart automatic sorting systems that are low-cost, highly reliable, highly customized
and modularized, which have been massively deployed in transit fields, have been developed for various requirements in different business scenarios by SF Holding. Issues such as the hardware, the mechanical structure, the control algorithm, and the software are all designed independently during the development of smart automatic sorting systems. Particularly, a product series of linear/circular cross-belt sorting system with high applicability, whose processing capacity covers from 10,000 pieces/hour to 18,000 pieces/hour and the allowed number of sorting direction is between 40 and 360, has been developed for sorting small packages. As for the hybrid scenario with single delivery items and others with or without destination information, a product series including the balance-wheel sorting system and the module-belt sorting system, which can be constructed by customized modules for different business models, is developed. Meanwhile, the information flow and data flow of equipment can be integrated effectively due to the independent development of smart automatic sorting devices, benefiting from which a centralized control and data processing deployment platform for multiple types of equipment can be achieved in the near future.
Meanwhile, SF Holding keeps ongoing model innovation, with its high-structure automatic sorting project for use in heavy cargo sites, which is the first in China, put into operation. By realizing an unmanned sorting process for the entire workflow of heavy cargoes, both manual strength and labour cost of operators have been reduced, filled the gap in the area of automated technology application in the domestic heavy cargo sorting process and maintaining the Company’s benchmark position in the industry.

S.F. Holding Co., Ltd. 2019 Semi-Annual Report
21
6. Smart hardware
(1) Smart Bluetooth headset
SF Holding has developed the industry's first voice assistant hardware product for the logistics industry - Xiaofeng Smart Bluetooth Headset (hereinafter referred to as "Xiaofeng") which is applied to the collection and delivery processes. It serves the purpose of protecting customers' privacy and improving the safety and work efficiency of the couriers.
"Xiaofeng" takes voice recognition technology as the core, combines TTS voice broadcast and voice &
semantic analytic ability, and activates the couriers’ daily terminal manual operation through voice instruction, which brings convenience and provides a more intelligent experience for couriers. In addition to voice interaction, “Xiaofeng” also implements the voice wake-up function; that is, the couriers can wake up “Xiaofeng” to assist the couriers to work in a simple voice command without any manual operation. Moreover, considering couriers’ actual working environment, "Xiaofeng" has been specifically designed to give wearing comfort and uninterrupted battery life, and is fitted with a dual microphone for noise reduction so that excellent voice recognition can be achieved even in extreme environments.
“Xiaofeng”, equipped with the AI assistant, can free up the hands of couriers, give real-time assistance to
couriers’ work and the original 8-10 steps manual operation was reduced to a simple voice command, further boosting the couriers’ work efficiency. At the same time, it supports continuous generation change and online upgrading according to business requirements without replacing hardware. It has high flexibility and can adapt to the business needs of different scenarios, improves data collection for operation at the collection and delivery end and promotes the digital transformation of SF Holding.
(2) Smart hand-held terminals
The seventh-generation smart handheld terminals (HHT7) are customized based on the Android 8.1 operating system. By collecting information in advance, information can travel faster than cargo while also guiding and monitoring the flow of parcels. The high extending capability and compatibility of the terminals allow them to support 1st-tier and 2nd-tier employees in accessing peripherals, which are highly compatible with business needs while allowing on-demand configuration. In addition, the terminals’ features include industrial-grade security standards, updated designs, and convenient human-machine interactions.
Currently, SF Holding has already completed the promotion and implementation of over 150,000 HHT7
throughout the entire network. Compared with the sixth-generation smart handheld terminals, there are several upgrades and improvements including in mobile internet comprehensiveness, high-speed mobile scanning, and operating system optimization. Meanwhile, the accessories adopt compatibility design that saves R&D and certification costs while reducing management.
(3) Smart locks
The smart locks independently developed by SF Holding can decrease the level of investment in traditional
disposable car seals and mechanical padlocks, allowing keyless management, energy saving and environment protection while reducing operating costs. Meanwhile, as carriers of data, smart locks enable seamless connection of express mail routing information, thus the goals of digitizing task transfer, standardizing processes and improving operation efficiency can be achieved.

S.F. Holding Co., Ltd. 2019 Semi-Annual Report
22
7. Logistics drones
SF Holding has a comprehensive plan for massive deployment of logistics drones for commercial purposes. It aims at building a standard management system for the R&D, flight-testing, and operations of logistics drones under various complex scenarios to complement the existing transportation capacity of the company and extend service coverage. Logistics drones are expected to carry out transportation tasks across mountains and rivers, achieve point-to-point transportation and even asynchronous handover, and resolve transportation challenges in various special scenarios. The independent drone R&D team has mastered the core technology of logistics drones. The number of patents under application or already granted exceeded 300, approximately 50% of which are invention patents, covering drone design, cloud platform, operation management, and other logistics drone development and application-related fields. These outstanding achievements include multi-copper and VTOL fixed-wing drones, core avionics systems, ground control systems, and communication systems. On the production side, through cooperation with domestic and foreign advanced drone manufacturers, SF has produced a variety of civil drones with different loading capacities and flight distances for different geographical locations and operating scenarios.
The Company hopes to connect its aviation logistics networks to the trunks and feeders of its hubs through
logistics drones, providing aviation network coverage for cities categorized as third-tier and below, thus greatly improving logistics efficiency. In the near future, express parcels are expected to arrive at any places throughout the country within 36 hours by a three-segment air transport network inter-woven by “Mainline cargo freighters+ Trunk to feeder large UAV+ End delivery small drones”, covering complex terrain and remote areas.
(1) Drone express logistics customized solution
For the end delivery and transportation scenarios, SF Holding has customized the drone express solutions to meet the needs of various regions, established a logistics drone testing, production and operation system and mastered the key technologies and production processes of logistics drones. A number of drone models have been developed including H4, Ark, Manta Ray, C37, covering multi-rotor and vertical take-off and landing fixed-wing drones, which are capable of delivering parcels of up to 10kg within 100km. These drones can perform vertical take-off and landing and thus runways are not required. Besides they are easy to operate and cost little.
In terms of communication and control, SF Holding has developed a logistics drone communication base
station and an operation management and ground control system, which support the building of a large communication network and centralized management and dispatching. The operation captain can monitor the status information of all logistics drones in the service area in real-time in the dispatching center, and dispatch and control the drones according to business needs. The SF Holding end delivery drone has formed a replicable model which can be further expanded. The farm fresh delivery and regional specialty products distribution projects in Ganzhou City of Jiangxi Province and Ganzi Autonomous region of Sichuan Province have been put under regular operation.
(2) Operation management and ground control system
Logistics drone operation management and ground control system is an intelligent dispatching system developed for airspace applications. The system not only has basic functions such as route management, drone status monitoring and job dispatching, but also can automatically assign drones model and batteries according to the requirements of specific tasks and based on the performance of various drones and route environment information while ensuring completion of missions and flight safety. Therefore human errors and resource wastage are basically avoided. In addition, the ground control system collects operational data and performs calculations, and thus can backtrack the operational process and perform statistical analysis on the traffic volume. These operational data will form a part of SF logistics big data for the building of big data ecosystem.
SF Holding has established a standard data format and information interface for the operation and ground
control system. It can be used as part of the civil aviation information and control platform in the future, laying a solid foundation for the future integration of airspace operations.
S.F. Holding Co., Ltd. 2019 Semi-Annual Report
23
(3) Obtaining policy support from the government
In August 2017, SF was assigned the first “UAV Logistics Distribution Pilot Project” by the Civil Aviation Administration of China in Nankang District, Canzhou City, Jiangxi Province, on March 27, 2018. It was the first nationwide drone airspace operation (pilot project) license granted by the Civil Aviation Administration of China Eastern Region Administration, marking the official commercial application of China's logistics drones. After nearly two years of drone logistics distribution pilot application, SF Holding has gained some technological expertise and operational experience. Complying with the principle of unified development advocated by the Civil Aviation Administration of China, SF Holding has gradually formed a replicable operation model which can be applied elsewhere. In 2019, SF Holding continued its efforts in government-enterprise cooperation, drone logistics distribution pilot application, flight airspace, and strived for policy support from the government, civil aviation sector, and air force.
In order to accumulate more operational experience of various complex operational scenarios, promote the
development of drone operation and airworthiness standards corresponding to different operating risks, and provide high-quality logistics and poverty alleviation services for the most urgently needed people in distressed areas, SF Holding extend operations to remote areas of ethnic minorities in the western part of Sichuan Province and northern Yunnan Province to carry out pilot work on plateaus, and try to solve the issues related to logistics drones in remote areas of plateaus. At present, it has obtained approvals and supports from the Sichuan Provincial Government, the Civil Aviation Administration of China Southwestern Region Administration, and the Ganzi Autonomous Region Government of Sichuan Province. The relevant infrastructure, operation sites and supporting facilities have been completed. SF Holding has been approved to operate in the airspace in the southwestern region of Sichuan Ganzi Tibetan Autonomous Region, Aba Tibetan and Qiang Autonomous Region, Yunnan Diqing Tibetan Autonomous Region and other parts, covering more than 30 cities and counties, benefiting more than 2.5 million poor people.
(4) Participation in the formulation of industry standards
In March 2019, SF Holding participated in the drafting and preparation of the “Regulations for the Operational License of drone Logistics Distribution Operators” of the Civil Aviation Administration of China Eastern Region Administration. In April 2019, SF Holding, in cooperation with the National Post Office, has applied for the establishment of "Regulations for the Joint Information Collection and Exchange of Postal Express Delivery Drones" and "Code for the Operation of drone Logistics Delivery". Currently, both standards have been initially selected by the Ministry of Transport for the task of 2020 standards establishment. At the same time, SF Holding cooperated with the Civil Aviation Administration of China Eastern Region Administration to apply for the establishment of civil aviation safety capacity building project known as “Research on the drone Logistics Safety Operation Standard and Service Management System”, which has been approved by the Civil Aviation Administration of China and entered the implementation stage.
8. Digital warehousing
In the aspect of smart warehousing network, a complete SF cloud-based digital and automatic system has been constructed to support E-commerce warehouses, automatic benchmark warehouse, cold chain warehouses, medical warehouses, food warehouses, international shipping warehouses, SF operation and logistics warehouse, front warehouse, micro warehouses, and other business-specific warehouses, for enhancing the handling capabilities for daily operation support and peak season comprehensively. Based on demand from leading customers of various product categories, omnichannel supply chain management, multi-dimensional data analysis, application of big data and AI technology in intelligent warehouse network route, development and application of system solutions for segmental industries, support for improving customer experience in warehousing is available. SF Holding has also invested in an industry-leading web-based comprehensive warehousing service platform – Warehouse In Cloud, to provide warehouse searching, warehouse leasing, integration of warehousing and distribution and other services, upon which it has built the country’s leading “warehouse as a service” digital warehouse network platform focused on warehouse big data applications, digital warehouse management, collaborated warehouse allocation, cloud warehouse technology, and IoT sensing clouds. Empowering cooperative partners through internet, IoT and information technology, an open digital warehouse ecosystem network is built for integrating online and offline warehouse resources, fully participating in the hardware management of warehouse network and transformation of delivery system, to facilitate SF warehousing in building an industry-leading business ecosystem platform to provide more diversified warehousing solutions for customers.

S.F. Holding Co., Ltd. 2019 Semi-Annual Report
24
9. Smart packaging
(1) Construction of green packaging products ecosystem and smart platform
SF Holding has always been committed to promoting the lightweight, reused, reduced, recyclable, degradable, intelligent application and implementation of packaging to build a sustainable packaging ecosystem. As of the end of the reporting period, it has developed more than 100 sets of packaging solutions for the traditional, cold chain, pharmaceutical, freight, special goods, intra-city catering and other industries, and constantly explore and innovate, in areas of solar photovoltaic panels and white appliance, and innovation has been continuously explored. As to solar photovoltaic panels and white appliance, the research and development of various characteristic packaging products with independent intellectual property rights continues to create value for customers in various industries.
SF Holding has continuously pioneered and innovated in cold chain packaging. It has realized the
implementation of the standardized packaging products such as cherry, lychee, Chinese bayberry and peach, and explored the application of new fresh-keeping, green materials and solutions, so as to improve the quality and green level of fresh packaging. It is exploring the mode of pre-treatment center in the place of origin, aiming to help standardize, industrialize and automate fresh fruits in the place of origin, to ensure the “first mile” of fresh products delivery, improve the quality of fresh products and user experience, and create greater value for customers.
In terms of construction and implementation of green recycling system, SF Holding proposes “platform +
container + smart hardware” recycling strategy, and the self-developed “recyclable container management platform'' realizes the unified management of various recyclable containers, embeds the recycling packaging into all links of logistics, in which the reusable packaging box “Feng Box” has put into application in 96 cities including Beijing, Shanghai, Guangzhou and Shenzhen, and has been recognized by dozens of domestic and foreign leading brands.
(2) Construction of packaging technology research and testing laboratory
SF Holding has also continuously advanced and made breakthroughs in the research and standardization of the underlying technology for packaging. Among them, the packaging R&D strategy has been gradually upgraded to four major packaging R&D systems with logistics standards, material technology, product iteration and intangible property rights as the core, which will help the Company to realize green, digital and automatic packaging.
As of the end of the reporting period, SF Holding completed the construction of packaging parametric design
platform to realize the intelligent iteration of packaging R&D; gradually promoted the basic technology research such as road spectrum technology and packaging carbon emission technology, promoted the quantitative measurement and monitoring of logistics packaging, so as to build a measurable evaluation system of green packaging. SF Holding has applied for more than 260 packaging related patents, revised tens of national standards, industry standards, enterprise standards, and carried out visual management for the above intangible property rights to provide technical support and guidance for packaging R&D.
In order to continuously promote the research and verification of materials, methods and models for
sustainable packaging, SF Holding officially launched the physical packaging laboratory in Shenzhen in June 2019, covering packaging transportation safety test, material performance test, physical and chemical analysis test and sample preparation and other modules, which provides scientific basis for the research and development of packaging solutions and the quality control of packaging materials.

S.F. Holding Co., Ltd. 2019 Semi-Annual Report
25
10. Information security
(1) Adhere to network security and ensure compliance
In the first half of 2019, SF Holding adhered to the basic principle of information security compliance and actively carried out network security and privacy protection. It participated in the formulation of 3 safety industry standards, newly applied for 9 invention patents in relation to information security, and fulfilled security compliance.
In the first half of 2019, SF Holding started the ISO29151 personally identifiable information protection
certification on the basis of the practice of ISO27001 certification standard and the second- and third-level evaluation requirements of network security protection. As a representative of the logistics industry, SF Technology participated in the network security standardization technical review organized by the National Information Security Standardization Technical Committee and Shenzhen Institute of Standard and Technology, covering cloud computing security, IoT security, data security and others. The standards involved include “Cloud Computing Security Technology Specification (《云计算安全技术规范》)”, “IoT Platform Security Technology Specification (《物联网平台安全技术规范》)” and “Information Security Technology Hybrid Cloud Security Technology Requirements (《信息安全技术混合云安全技术要求》)”.
SF Holding completed four security governance tasks initiated by the Ministry of Public Security, the State
Post Bureau, Guangdong Communications Administration and other departments in the first half of 2019, including personal information protection, postal industry network security, big data governance, blockchain security. Through overall inspection and identification of the gaps, we gradually improve the level of our enterprise information security.
(2) Openness and cooperation to ensure all-round enterprise information
On June 27, 2019, the third SF Information Security Summit was held in Shenzhen. Hundreds of information security practitioners from the State Post Bureau, The Third Research Institute of Ministry of Public Security, China Electronic Standardization Institute, The Internet Police Command of Guangdong Provincial Public Security Department (广东省公安厅网警总队), Shenzhen Network Information Office (深圳市网络信息办公室), Tencent, Everbright Securities, Ping An Group and others from the government, business and academic sectors gathered to exchange industry technology and development trends, break down barriers and jointly build a new information security ecosystem.
During the Summit, SF released the "Cuiyu Data Security Solution (粹御数据安全解决方案) ", a set of
life-cycle data security solution products that SF has developed and used in the process of information security construction through management and technology gained. Through the release and sharing of the design concept and implementation ideas of the products, SF provides its own practical experience for the government, business and academic sectors. It also provides a unique perspective for comprehensive data security protection, and arouses a wide range of attention in the information security industry.
In the meanwhile, SF's big data security team shared a data security solution based on natural language content
learning, which uses unsupervised topic discovery, sequence tagging, keyword extraction and in-depth learning to achieve automatic recognition of privacy information, standardization of consignment information and detection of sensitive information in office documents, as well as automatic threat level assessment of test results. The program not only effectively improves the ability of data security detection, but also improves the upper limit of enterprise data security governance.

S.F. Holding Co., Ltd. 2019 Semi-Annual Report
26
(II) Top ranking in satisfaction and quality for consecutive years, and good branding image has been established
1. Top ranking in customer satisfaction for 10 consecutive years According to the 2018 Express Delivery Service Satisfaction Survey issued by the State Post
Bureau(《2018年快递服务满意度调查结果通报》), S.F. Express ranked No. 1 in “Overall Satisfaction of Express Delivery Enterprises.” SF Holding has topped the ranking for ten consecutive years since the State Post Bureau began announcing the rankings for the first time in 2009. According to the Announcement on the Express Delivery Service Satisfaction Survey in the First Quarter of 2019 and the Punctuality and Timeliness Test Results (《关于 2019 年第二季度快递服务满意度调查和時限準時率测试结果的通告》) and the Announcement on the Express Delivery Service Satisfaction Survey in the Second Quarter of 2019 and the Punctuality and Timeliness Test Results (《关于 2019 年第二季度快递服务满意度调查和时限准时率测试结果的通告》) issued by the State Post Bureau, the user satisfaction scores of express delivery services in the first quarter and the second quarter of 2019 were 77.6 and 78 respectively, while SF’s scores were above 80 and thus, it has continued to stay ahead of its peers.
2. A continued decrease in complaint rate According to the data in the Notice on Customers Complaint in Post Industry
(《邮政业消费者申诉情況通告》) published by the State Post Bureau monthly, in January to June 2019, SF Holding’s complaint rate was 0.18 case (number of valid complaints per million parcels delivered), a decrease of 72% over the same period of last year, which was far below the national average of 0.57 cases.
Note: The monthly average valid complaint rate is a simple average calculation based on data in the
Notice on Customers Complaint in Post Industry (《邮政业消费者申诉情況通告》) published by the State Post Bureau monthly.
3. Ranked No. 1 in timeliness throughout the entire process of express delivery service In February 2019, the State Post Bureau released the 2018 Express Delivery Service Punctuality and
Timeliness Test Results (《2018年快递服务时限准时率测试结果》) , which evaluated the nine major express delivery companies. SF Holding ranked No. 1 in all the six indicators, including timeliness throughout the entire process, timeliness of handling at the place of origin, timeliness of transportation and handling at the place of destination, delivery timeliness and 72-hour punctuality. SF Holding ranked No. 1 for six consecutive years since the State Post Bureau first announced entire process rankings for express delivery in 2013.

S.F. Holding Co., Ltd. 2019 Semi-Annual Report
27
4. Entering the BrandZ Top 100 Chinese Brands ranking consecutively On May 29, 2018, WPP, a global communications group, and Kantar announced the list of ranking for “2018
BrandZ Top 100 Most Valuable Global Brands”. SF entered in the ranking list for the first time. The ranking list shows that 15 Chinese brands entered the Top 100 list in 2018. On May 6, 2019, WPP and Kantar announced the list of ranking for “BrandZ 2019 Top 100 Most Valuable Chinese Brands”. S.F. Express ranked 16th, and ranked among the top in the list of ranking for two consecutive years, maintaining the top position among express enterprises.
After over 20 years of operation, the SF brand has enjoyed extensive recognition and popularity in the express delivery industry. “S.F.” has become synonymous with “fast”, “punctual” and “safe” in the express delivery industry and is a preferred brand for corporate clients and high-end individual customers. Good market reputation has brought a large number of high-quality corporate clients to SF Holding, long-term cooperation with a large number of domestic and foreign renowned enterprises, including Apple, Xiaomi, Huawei, Uniqlo, Bestseller, Ping An, Wish and Tophatter, in industries like 3C, apparel, finance, insurance and cross-border online trade have been secured.

S.F. Holding Co., Ltd. 2019 Semi-Annual Report
28
(III) The first express delivery A-share company with direct operation model
SF Holding adopts an operating model with strong management and control over the whole network, and it is
the first A-share express delivery company that adopts the direct operation model. The headquarters of SF Holding controls all express delivery networks and core resources, including collection and delivery points, transit depot, trunk and branch routes, aviation hub, aircraft, vehicles and employees. The direct operation model has absolute control over the whole logistics operation and helps ensure unified in top-down corporate strategies, to ensure effective achievement of corporate strategies and operation goals.
The direct operation model has the following advantages: (1) Ensure operating stability and control. The
express delivery industry is characterized by scale and networking, involving tens of thousands of operating service points and hundreds of thousands of employees; and how to ensure the stability and control of the company’s operations is the key to ensure future sustainable development. All levels of SF Holding’s business entities from headquarters to service points, and the core business segments from collection to transit, and from transit to delivery, have primarily adopted the direct operation model. Only a portion of non-core operations is complemented by outsourcing. This model not only guarantees the stability of the Company’s business operations, but also ensures the control in handling abnormal risk events, time sensitivity, quality and cost of operations, and ensures the Company’s sustainable and healthy development in the future. (2) Facilitate standardized customer service and operation management, thereby improving quality and efficiency. SF Holding adopts standardized management across the entire network, together with a uniform top-down approach in operation monitoring and appraisal mechanism within the company, it can effectively maintain service quality and timeliness to ensure the customer experience and improve service perception. (3) Enhancement of standardization and compliance in internal management. Benefiting from the advantage of being uniform, standardized, and well-controlled, the direct operation model ensures that the Company’s external operations, internal management, fiscal and taxation management, corporate governance, and other controls are standardized and compliant to avoid various types of compliance risk, and accountable to the State, regulatory authorities, and all shareholders. (4) Facilitate the new business to use the resources of the whole network to achieve collaboration in terms of customers, systems, personnel and resources, etc., as well as fast incubation and expansion. (5) Improvement in customer loyalty and brand reputation. The direct operation model enables the Company to stay close to its customers and to fully and precisely understand their needs at first instance. When a problem occurs, the direct operation model enables the Company to handle and respond to customers

S.F. Holding Co., Ltd. 2019 Semi-Annual Report
29
immediately and ensure that service quality and customer satisfaction are maintained. As a result, SF Holding held the top ranking in the industry’s customer satisfaction and brand reputation for ten consecutive years. (6) Better control of the entire data process and core information. Under the direct operation model, information systems and data of full processes are managed and controlled in a centralized and unified manner, which is beneficial to the valuable big data analysis and application conducted by the Company on customer service. Especially in the process of exploring the creation of smart logistics, the direct operation model helps black technology integrate internal and external resources of the Company for fast application, upgrade and iteration into relevant businesses.
(IV) Unique and scarce intelligent logistics network, the “Aviation + Ground + Information”
three-in-one network
After years of dedicated operations with a forward-looking strategic framework, SF Holding has built up a
comprehensive logistics service network that integrates three networks “aviation network + ground network + information network” into one with both domestic and overseas coverage. Under the direct operation model, with strongest network control and highest stability, together with SF Holding’s heavy investment in information network, SF Holding now owns abundant network resources that are most unique and scarce among industry peers in China.
1. Aviation network
In 2009, SF Airlines became the first privately-owned air freight company in China, and currently it has developed into an air freight company with the largest air cargo fleet in China. As at the end of the reporting period, among the domestic express delivery companies, only three companies, namely SF Holding, EMS, and YTO Express, have established logistic airlines with independent air transportation capabilities. SF Holding is a leader in domestic industries in terms of quantity of cargo aircraft, number of routes and transportation capacity.

S.F. Holding Co., Ltd. 2019 Semi-Annual Report
30
Cargo aircraft: (1) Fleet building: As at the end of the reporting period, SF Holding had a total of 55 self-owned all-cargo aircraft (including Boeing 767: 8 aircraft, Boeing 757: 29 aircraft, Boeing 747: 1 aircraft and Boeing 737: 17 aircraft), with 23.34 years of average service time, and 14 chartered all-cargo aircraft, operating a total of 65 flight routes. As at the end of the reporting period, SF Airlines operated flights to 43 major cities in China and 15 international cities including Chennai, Bishkek and New York. In January 2016, when the first B767 wide-body cargo aircraft officially commenced operation, SF Holding became the first express delivery company that owned a B767 wide-body cargo aircraft. In November 2017, SF Holding bought two Boeing 747 cargo aircraft at an online auction platform in China, one of the aircraft had commenced operation in October 2018, and the other aircraft is expected to commence operation in August 2019. Wide-body cargo aircraft has bigger space for transportation, higher fuel efficiency, and better performance in transportation capacity and capability. In addition to supplementing and optimizing the aircraft types in the current fleet, the introduction of new aircraft models also allows better allocation of capacity resources in areas with sufficient cargo volume, improves time utilization rate, saves energy and reduces emission. In the next three years, the size of SF Holding’s self-owned fleet is expected to reach 80 aircraft, forming an aviation network comprising mainly four types of all-cargo aircraft, including 737, 747, 757, and 767. (2) Reserve of pilot resources: SF Airlines has been recruiting talents since its establishment, attracting pilots through strict internal management and service flow process to join SF Airlines, and actively cultivates its own pilots through cooperation with domestic and foreign aviation schools. As at the end of the reporting period, SF Airlines had a total of 479 pilots, including 195 captains, 248 co-pilots, and 36 student pilots. (3) Traffic rights and airport slots: Based on the allocation principle of “seniority” in civil aviation flight schedules, SF Airlines has certain first-mover advantages when compared with other companies. As at the end of the reporting period, SF Airlines had a total of 143 pairs of slots, covering 43 large and medium-size cities nationwide and international cities including Chennai, Bishkek and Almaty. (4) Self-operated ground support: Since 2015, SF Airlines operated ground support services directly in some cities gradually. By shortening the time duration of ground services and improving the efficiency of ground servicing, more handling time is available for the collection and distribution segments of express delivery and generates more momentum to realize safety, stability and fast timeliness of express parcels. Shenzhen Airport’s southeast parking apron was officially launched for operation in December 2017, further improving the operating efficiency of ground services and the timeliness of cargo handling. (5) Aviation safety assurance: Since its inception, SF Airlines has made aviation safety its priority, the SMS management system has been established to implement rules and regulations strictly. From the first flight to the end of the reporting period, SF Airlines has operated approximately 306,800 hours safely and has been accredited by the CAAC and other regulatory agencies as a safe entity for 9 consecutive years. In 2010, it was named “2010 Accredited Unit of Safety Responsibility” by CAAC Central and Southern Regional Administration; in 2011, it was named “2011 Excellent Unit of Safety Responsibility” and “2011 Advanced Unit of Traffic and Transport Production Safety in Shenzhen” by CAAC Central and Southern Regional Administration; in 2012-2013, it was named “Advanced Unit for Safety Responsibility” by CAAC Central and Southern Regional Administration for two consecutive years; and in 2014-2018, it was named “Accredited Unit of Safety Responsibility” for five consecutive years by CAAC Central and Southern Regional Administration.
Commercial flight resources: In addition to all-cargo aircraft, SF has also secured stable passenger aircraft
bellyhold resources from about 100 commercial airlines at home and abroad through direct operations (cooperating directly with airlines), agents (freight forwarders), or tripartite cooperation (SF, airlines, and agents) to operate 2,023 flight routes at home and abroad.
Air freight capacity: As at the end of the reporting period, SF Holding’s all-cargo aircraft and commercial
flights operated a total of 2,088 aviation routes, the total number of flights in the first half of 2019 was 755,000, with a daily average of 4,170 flights, covering 43 major cities in China and 15 international cities including Chennai, Bishkek and Almaty. Total air cargo volume handled by the Company in the first half of 2019 was approximately 617,000 tonnes, and daily average cargo volume handled was 3,407tonnes.

S.F. Holding Co., Ltd. 2019 Semi-Annual Report
31
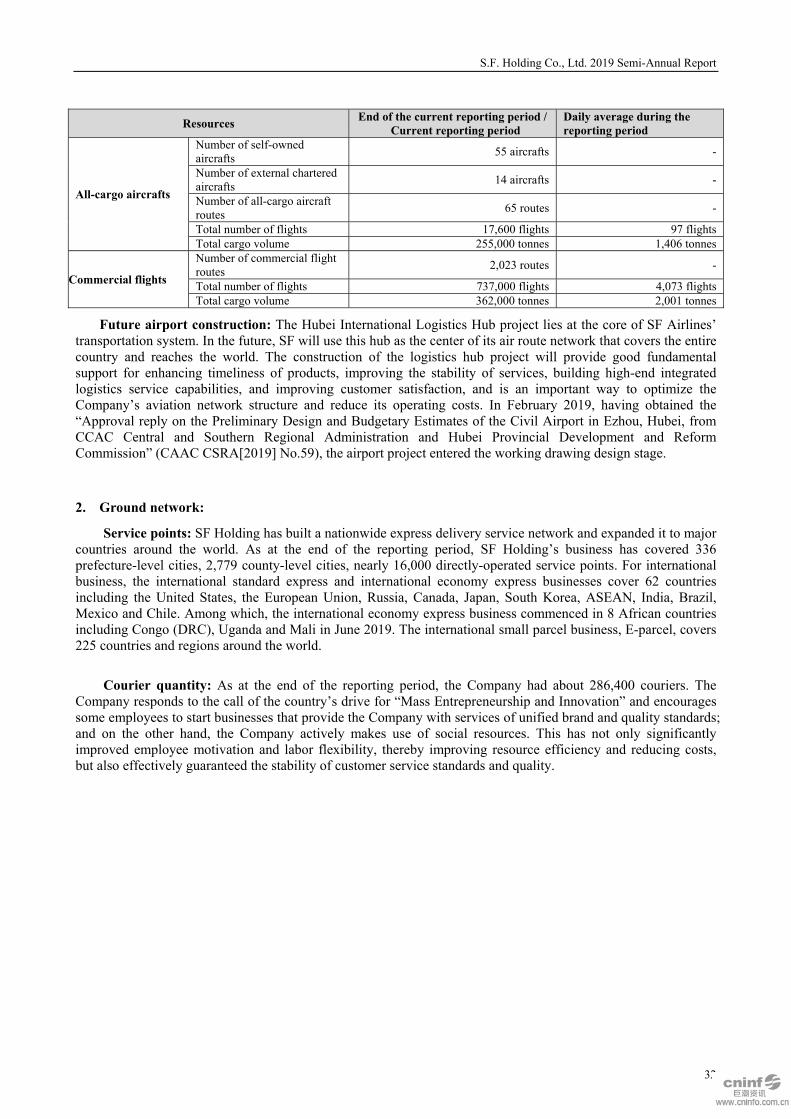
S.F. Holding Co., Ltd. 2019 Semi-Annual Report
32
Resources End of the current reporting period /
Current reporting period Daily average during the reporting period
All-cargo aircrafts
Number of self-owned aircrafts 55 aircrafts -
Number of external chartered aircrafts 14 aircrafts -
Number of all-cargo aircraft routes 65 routes -
Total number of flights 17,600 flights 97 flightsTotal cargo volume 255,000 tonnes 1,406 tonnes
Commercial flights
Number of commercial flight routes 2,023 routes -
Total number of flights 737,000 flights 4,073 flightsTotal cargo volume 362,000 tonnes 2,001 tonnes
Future airport construction: The Hubei International Logistics Hub project lies at the core of SF Airlines’ transportation system. In the future, SF will use this hub as the center of its air route network that covers the entire country and reaches the world. The construction of the logistics hub project will provide good fundamental support for enhancing timeliness of products, improving the stability of services, building high-end integrated logistics service capabilities, and improving customer satisfaction, and is an important way to optimize the Company’s aviation network structure and reduce its operating costs. In February 2019, having obtained the “Approval reply on the Preliminary Design and Budgetary Estimates of the Civil Airport in Ezhou, Hubei, from CCAC Central and Southern Regional Administration and Hubei Provincial Development and Reform Commission” (CAAC CSRA[2019] No.59), the airport project entered the working drawing design stage.
2. Ground network:
Service points: SF Holding has built a nationwide express delivery service network and expanded it to major countries around the world. As at the end of the reporting period, SF Holding’s business has covered 336 prefecture-level cities, 2,779 county-level cities, nearly 16,000 directly-operated service points. For international business, the international standard express and international economy express businesses cover 62 countries including the United States, the European Union, Russia, Canada, Japan, South Korea, ASEAN, India, Brazil, Mexico and Chile. Among which, the international economy express business commenced in 8 African countries including Congo (DRC), Uganda and Mali in June 2019. The international small parcel business, E-parcel, covers 225 countries and regions around the world.
Courier quantity: As at the end of the reporting period, the Company had about 286,400 couriers. The
Company responds to the call of the country’s drive for “Mass Entrepreneurship and Innovation” and encourages some employees to start businesses that provide the Company with services of unified brand and quality standards; and on the other hand, the Company actively makes use of social resources. This has not only significantly improved employee motivation and labor flexibility, thereby improving resource efficiency and reducing costs, but also effectively guaranteed the stability of customer service standards and quality.

S.F. Holding Co., Ltd. 2019 Semi-Annual Report
33
Transit Hub Distribution: As at the end of the reporting period, SF Holding had 9 hub-level transit depots,
service points at 34 aviation and railway stations (excluding stations sharing sites with transit depots), and 150 sub-district transit depots (including Shunxin Express (顺心快运)), of which 44 transit depots have adopted the automatic sorting system.

S.F. Holding Co., Ltd. 2019 Semi-Annual Report
34
Ground transportation network: As at the end of the reporting period, SF Holding had about 35,000
directly-operated and outsourced vehicles for more than 90,000 long-haul and branch routes. The total number of vehicles for terminal collection and delivery was 72,000 (excluding motorcycles and electric vehicles). 81 high-speed railway lines and 121 standard railway lines have been launched. The ground transportation network of SF Holding covers the entire country. In addition, the Company has also entered into cooperation with the National Railway Administration actively, a joint venture company has been formed to develop logistics business by leveraging on the high-speed and standard railway resources, which helped the Company in making significant strategic breakthroughs in obtaining railway resources, and the joint products developed by both parties have now achieved considerable scale initially. As at the end of the reporting period, the extremely express delivery products by high-speed railway covered 57 cities and 272 traffic flows. The convenient delivery products by high-speed railway covered 34 cities and 69 high-speed railway stations.

S.F. Holding Co., Ltd. 2019 Semi-Annual Report
35
Warehouse network: As at the end of the reporting period, SF Holding had 145 warehouses of different categories with a total
area of nearly 1.8 million square meters, forming a nationwide warehouse service network covering more than 100 major cities across the nation, providing professional, efficient and high-quality warehouse service to nearly a thousand customers. In 2019, the Company has continued to promote the building of core capabilities, and the overall capabilities of SF warehousing were enhanced comprehensively. SF Holding promoted the implementation of automatic benchmark warehouses according to the demand of leading customers in various segmental markets, and enhanced operational abilities through digital warehousing and efficiency enhancement,
reflecting the highest standards in the warehousing industry. The design capability of warehousing solutions has become a key core component of SF’s supply chain solutions+ and provides strong technological support for acquisition of leading customers, and it is one of the core capabilities to support the new vision of the Company to become a “technology service company for industry solutions”. SF warehousing has been equipped with the capabilities of serving business modes such as shoes and apparel, 3C, cosmetics and cross-border business, and has been recognized repeatedly by leading customers in the industries amidst market competition.

S.F. Holding Co., Ltd. 2019 Semi-Annual Report
36
Customer terminal service network: SF Holding has established four independent call centers in China
with about 4,200 seats and providing 900,000 instances of customer service daily. The Company provided 7*24 hours self-services through SF official website, monthly statement manager, APP mobile phone client, WeChat mini-programs and WeChat public account, and provided services that understood users’ needs better and were faster through the 95338 interactive voice response system, the intelligent voice recognition system and the online intelligent customer service system. In 2019, SF Holding has been committed to establishing a customer service system and a service strategy that led the industry, listening to customers’ voices, and timely and efficiently solving customer appeals; continuously building an intelligent and digital service management system, applying artificial intelligence and big data to the intelligent customer service system, proactively discovering and quickly solving customer problems and needs with technology-driven services, and providing customers with professional, efficient and warm services.

S.F. Holding Co., Ltd. 2019 Semi-Annual Report
37
Last mile service: SF Holding has achieved last mile coverage through its cooperation with SF’s
commercial service points, cooperative agencies, property management, and smart express delivery lockers. As at the end of the reporting period, SF Holding cooperated with 30,000 cooperative agencies and nearly 600 property management companies. In addition, Hive Box Technology, a participating of SF Holding, had installed approximately 150,000 smart delivery lockers in community/office buildings, covering 100 cities in China, including Shenzhen, Guangzhou, Beijing, Shanghai, and Wuhan.
3. Information network:
SF Holding has built a high-speed network covering global business by combining logistics scenarios with business needs, and instantly aggregated business information into SF Intelligent Brain, with the business data volume exceeding the level of 35PB and the daily average calculated amount exceeding 1PB. The Company has conducted analyses and made decisions through the intelligent brain, and achieved the integration of the three networks of “aviation network+ground network+information network” into one network via coordination and adjustment, supporting unlimited business possibilities.
SF Holding has independently researched and developed a complete set of smart network platforms, including SF’s core
operating systems, the SF Map platform, big data platform, information security platform, and smart O&M management platform. The set of all those platforms has covered all business segments and scenarios to enable business in a fast, flexible, safe and comprehensive manner, and has promoted logistics full chain information interconnection, which has created a smart and solid foundation for the diversified business development of the Company. Meanwhile, the Company has also been committed to the development and implementation of cutting-edge technologies, adhered to independent innovation, facilitated the upgrading of intelligent logistics, applied cutting-edge technologies such as operation optimization, machine learning, deep learning, data analysis and mining to more practical business scenarios, and supported new technology applications with cloud computing. The Company has adhered to user-oriented product design to enhance business performance and user experience, and enabled technology and products to be conscientiously implemented and better serve customers.
Moreover, SF Holding has also integrated internal resources. The Company used big data calculation and analysis, operation optimization, artificial intelligence and other technologies to establish intelligent management and intelligent decision-making platforms such as logistics operation analysis platform and business forecasting platform by relying on massive internal and external data. The Company uses data and technology to make decisions, operate and optimize processes, which has increased the efficiency and scientificness of operation, created SF’s “intelligent brain” and realized data-driven technology and technology-enabled logistics.
SF Holding has coverage of domestic and international express delivery networks, coupled with the
Company’s constant attention and investment in smart information networks, a comprehensive logistics service network integrating the three networks of “aviation network+ground network+information network” into one network was formed, its unique and scarcity characteristics further consolidate and expand the leading advantages of SF in the industry.
(V) With forward-looking plans for new business, integrated logistics showed gradual growth
in scale
SF Holding has been adhering to the development of a diversified network in recent years, which has accelerated its transformation from a single service provider (express) into an integrated logistics service provider. It has expanded horizontally into new businesses such as warehousing, cold chain, international product, freight and intra-city instant delivery service to satisfy diverse customer needs; it has also extended vertically from back-end delivery to the front-end of supply chain by leveraging on the sophisticated logistics system of SF and a portfolio of quality products to offer customized logistic services for enterprises, and provides end-to-end integrated supply chain solutions and services covering the entire process, including supply chain strategy, solution design, implementation and operational management, to assist customers in optimizing, transforming and upgrading their supply chains. After years of explorations and diligent efforts, the new business development in SF has gradually seen results with a growing business scale. During the first half of 2019, new business revenue accounted for 23.66% of total revenues with much higher growth than original express business, indicating that new businesses have become the key driving force for business growth in the Company.

S.F. Holding Co., Ltd. 2019 Semi-Annual Report
38
Rapid development of new businesses to supplement the coverage of products: New business lines of SF,
such as freight, cold chain and pharmaceutical transportation, intra-city instant delivery, have achieved stage results and established network coverage with industry-leading depth and width, operational capabilities, innovative technology, service quality and customer experience, as well as industry-leading market shares in their respective sectors, established the brand image of quality services, and formation of long-term cooperative partnership with leading customers of the sectors, these businesses have continued to maintain a high growth trend. All of the new business lines will continue to rely on the sophisticated logistics network, operational capabilities and technological capabilities of SF to deepen their penetration, improve their products and operating models in order to supplement the coverage of products in the comprehensive logistics network of the Company.
Entry into supply chain through acquisition: In August 2018 and February 2019, SF Holding completed the
acquisition of cold chain business in mainland China, Hong Kong China and Macau China from the U.S. HAVI Group and the acquisition of supply chain business in mainland China, Hong Kong China and Macau China from Deutsche Post DHL to establish SF New HAVI and SF DHL business segments, respectively. The U.S. HAVI Group has almost 40 years of supply chain management experience in cold chain operations, with leading capabilities in supply chain management and solution design for cold chains, and provides cold chain logistic services and one-stop supply chain solutions and services for global renowned customers. Deutsche Post DHL has 30 years of supply chain management experience in China, and provides industry-leading solution design and supply chain services to renowned customers in the industries of automobile and industrial manufacturing, life sciences and medical, high technology and spare parts logistics, fast-moving consumer products and retail sector. The integration and synergies of the acquired business and SF business have generated initial results, the volume of new business in New HAVI and SF DHL has recorded significant growth. Meanwhile, by relying on the advantages of the logistics network and technological capabilities of SF Holding, the warehousing and cold chain business segments in SF joined hands with New HAVI and SF DHL to fulfill the supply chain demand from leading customers in food and fresh produce, new retail catering and 3C industries by providing more diversified and superior standard supply chain services to customers. In the future, SF will continue consolidating high quality logistics resources, learning and replicating supply chain experience and management capabilities rapidly, and enhancing the supply chain management capabilities by leveraging on the technological capabilities of SF to further upgrade the solution capabilities.
Technological solutions drive upgrading of industry supply chain: As internet gradually evolves towards
the internet-of-things, and with the fast arrival of industry 4.0 and the new retail era of all channels, enterprises with conventional supply chains are forced to go for transformation or upgrading. SF technological solutions are driven by technology and data, using SF DNA as genes, learning form the advanced supply chain industry experience of New HAVI and SF DHL to create a digital, modular and one-stop intelligent supply chain management platform. Through digital technology such as internet-of-things, big data and artificial intelligence, and by combining products and processes in the model, supply chain services are provided to customers at three levels including strategic planning, tactical plans and optimization, operational and implementation management to help customers realize an upgraded supply chain system and create competition barriers. SF has provided comprehensive solutions to certain industries, including but not limited to the following
3C industry: By leveraging its strong logistics network, technological advantages of big data and artificial
intelligence as well as its practical experience and capabilities of logistics visualization, SF has created a business model that provides 3C customers with the whole process, end-to-end solutions for systematic, integrated, and customized comprehensive services covering raw material - production and processing - channel distribution - consumer (C2M2B2C). The model also helps the channel distributors of customers by building a capital logistics platform and an after-sales service platform, by integrating information flow, business flow, logistics, and capital flow, realizing the visualization, management, and control of the whole chain of the supply chain. As a result, we further enhanced the depth and breadth of services so as to provide customers with domestic and international end-to-end supply chain solutions services covering the whole chain of production, supply, marketing and distribution.

S.F. Holding Co., Ltd. 2019 Semi-Annual Report
39
Apparel industry: SF has assisted customers to perform comprehensive digitization and management
upgrading in inventory management by managing customers’ products from all aspects, including product launching, distribution, replenishment and marketing, which have notably enhanced the transformation rate of offline outlets and the product collection experience for online customers, digitized management has been realized for online and offline outlets in the retail apparels industry. Through accurate customer images, online and offline integration, unified management is realized for all sales channels. SF has provided supply chain solution services to many famous international fashion brands.
Fast-moving consumer goods industry: Fast-moving consumer goods industry is characterized by mass
consumers, high frequency of consumption, complicated sales channels and high demand for convenience. Affected by generation change and upgrading in e-commerce mode, fast-moving consumer goods and retail enterprises have become more responsive to market changes. By relying on the full coverage and highly time-sensitive logistics network, big data and artificial intelligence are used to assist customers to improve image precision and marketing. SF has provided supply chain solution services to many international renowned brands of fast-moving consumer goods.
Pharmaceutical industry: By relying on the logistics network, technological capabilities and hardware
facilities, SF provides systematic end-to-end software and hardware integrated supply chain solutions to customers in the pharmaceutical industry, with connections across the five major chains of procurement, production, distribution, consumption and reverse logistics. Through the assistance of technological systems such as smart warehousing management, postal medical delivery, electronic delivery notes for drug categories, pharmaceutical customers may reduce cost and increase efficiency. The research and development of hospital interior floor plans and reverse QR code for sample testing procedures have improved the diagnostic/service experience of patients/users. SF has provided supply chain solution services to several large-scale hospitals and customers in the pharmaceutical industry.
Automobile and spare parts industry: In the first half of 2019, the weak trend of the whole vehicle market
continued from 2018, automobile enterprises are under higher pressure to reshape the supply chain, enhance the quality and efficiency of supply chain to realize cost cutting. By utilizing the advantages in network and transportation resources, synergies in big data and warehousing R&D capability, SF provides comprehensive solutions to customers ranging from procurement logistics, production logistics, and after-sales logistics to distribution logistics. It strives to realize automation and visualization of life-cycle management for orders, smart router planning for milk-run circulating delivery, smart freight arrangement, smart warehouse allocation using big data, digital supervision and management for safeguarding the whole process, so as to reduce production risks and costs, accelerate the intelligent evolution and model reform of the industry, and ultimately enhance the quality and efficiency of supply chain and reinvent the logistics experience for customers. SF has provided comprehensive supply chain solution services to a number of domestic renowned automobile enterprises. (VI) First-mover advantages with scarce logistics venue resources
Riding on sustained rapid growth in the express delivery industry and responding to the requirements of the
State Post Bureau in the “13th Five-Year Plan” for the express delivery industry to accelerate the construction of logistics industrial parks, SF Holding committed to create an “Express+” and “Internet+” dual-core industrial park service ecosystem, which will provide not only internal services for SF Holding, but will also provide comprehensive package services in warehousing, logistics, business, information and capital flows for local industries and external customers, creating a hub and communication window for effective linkage to government, SF services and customer demand.
As at the end of the Reporting Period, SF Holding has successfully lay out the industrial park project across 45 cities, representing an addition of four cities, namely Haikou, Suzhou, Shenyang and Luoyang, as compared to the end of 2018. SF Holding owned logistic land area of approximately 1,119 acres, and a total planned construction area of approximately 4 million square metres, approximately 1.18 million square metres of construction area were completed. The total net book value of logistic site resources was approximately RMB10.26 billion. In future, the Company will utilize existing resources to fulfill internal requirements, further expanding the layout for core strategic resources to enhance the core competitiveness for sustainable development.

S.F. Holding Co., Ltd. 2019 Semi-Annual Report
40
In order to revitalize existing assets of the Company, satisfy the rolling development needs of projects, and
accelerate the layout of industrial parks, the Company has been actively exploring the innovation of securitization of logistics industrial parks. In 2018, the Company was approved to issue RMB5 billion ABS by way of shelf offering and completed the first tranche of issuance successfully, with total proceeds of RMB1.846 billion raised. It was the first perpetual domestic REITs in respect of logistics property issued by way of shelf offering, meanwhile the Company recorded investment gains of approximately RMB808 million on asset appreciation. In 2019, the Company has proposed the issuance of the second tranche of ABS and is expected to raise total proceeds up to RMB1.5 billion, and is expected to realize investment gains of approximately RMB600 million on asset appreciation. As at the date of disclosure of this report, the second tranche of issuance is still in active progress.

S.F. Holding Co., Ltd. 2019 Semi-Annual Report
41
Location Size of land area held
(acres)
Total planned construction area
(including projects under construction/planned)
(10,000 square metres)
Area of completed construction
(10,000 square metres)
Total net book valueas at the end of the
reporting period
(RMB100 million)
East China 275.11 85.49 47.02 16.47
North China 144.31 47.13 20.20 12.93
Central China 391.09 136.71 20.82 17.82
South China 101.81 53.72 29.68 49.07
West China 206.42 76.96 - 6.33
Total 1,118.73 400.01 117.73 102.62Note: The data in the above table has not been audited.
(VII) Warm, principled and productive SF culture
In SF Holding’s 26-year history of development, its genes of outstanding and strong corporate culture have continually played an important role. Customer success, equality and respect, innovation, unity, and accountability are part of SF’s culture. To SF, corporate culture is not just a belief, but more as a commitment and practice. It is reflected in every word and action of all SF employees, is expressed in every operating process, and has become a strong spiritual force that is embedded in SF’s cohesiveness, competitiveness, and vitality.
1. SF’s success is based on assisting customer to succeed
As a service-centric enterprise, SF Holding has always been customer-oriented and is committed to providing customers with above expectation services, assisting customers to create value and achieve success. In recent years, SF Holding has been trying to provide convenient and reliable international express, logistics and supply chain solutions to domestic and international manufacturing enterprises, trading enterprises, cross-border e-commerce enterprises and specialty economic products to help outstanding enterprises and products in China to “go global” and “bring in” quality merchandise from overseas. Moreover, in industries such as 3C, fresh produce, apparel and pharmaceutical industries, SF is able to provide comprehensive logistics solutions based on customer needs and industry characteristics. While facilitating the success of customers, SF Holding also achieves its own success.
2. Innovation drives SF forward
SF Holding advocates the culture of innovation, emphasizing that everyone and every move can be innovative. In recent years, SF Holding has innovated continuously, not only in the field of logistic UAVs, smart devices and smart packaging, but also in investment for building big data, AI automation, AI recognition and smart decision-making, and has achieved extraordinary results in technological innovations such as artificial intelligence, Internet of Things, cloud computing and machine learning. In May 2019, the “SF Big Data Platform”, a commercial decision big data solution researched and developed by SF Technology, won the “Top Ten Big Data Cases” from the Ministry of Industry and Information Technology (MIIT). SF Technology has launched a smart blue tooth earpiece “Xiao Feng” (小丰) by incorporating a number of AI technologies innovatively, and has been rated among the “Top 50 Smart Companies”(TR50) in 2019 by MIT Technology Review. Innovations also exist in front line business of SF. Among winners of the “Best SF Person” Award, many of them are innovators. The power of innovation drives SF Holding moving forward continuously at high speed.

S.F. Holding Co., Ltd. 2019 Semi-Annual Report
42
3. Equality and respect uniting every heart
SF Holding advocates treating every person equally and with respect, regardless of his role and level within the Company. In February 2017 at the listing ceremony of SF Holding, the courier who was beaten by a customer was invited to ring the bell together with the Chairman to share the glorious moment. So far, SF has been advocating the principles of “fairness, justice and openness” in staff employment, respecting the value of their contributions, providing everyone with equal development opportunities and assisting staff to actualize personal value. Meanwhile, online communication and interactive platforms such as “echo, Face Initiative, communication hotline” are established to encourage employees to express their opinions and their ideas freely. The corporate culture of equality and respect has further united hundreds of thousands of employees in SF.
4. United as one, we are strong
SF Holding advocates the spirit of solidarity. Everyone must be cooperative and unite every employee’s strengths in order to achieve the same goals. During the peak season, such as the 11.11 Festival, Mid-Autumn Festival, National Day, and Spring Festival, from Chairman to regional heads, and to third-tier functional staff, all of them will go to network points and transit depots for providing support and sympathy and working together with the frontline staff. By uniting all hearts, the dedicated SF Holding will have strong cohesive and fighting power to act faster and burn brighter.
5. Be responsible proactively and contribute compassion
SF Holding advocates positive accountability. It does not only require employees to fulfill their responsibilities and perform their duties during their work, but also encourage employees to take social responsibility. Under this cultural influence, returning lost-and-found money, helping others, saving people and fighting fires, upholding just and rightful acts, working for the public good, and other positive events occur more and more frequently among SF employees. Acts of kindness included a resident driving a vehicle lost control and fell into a reservoir, at the most dangerous moment, a courier from Dongguan district did not hesitate and jumped into the water amidst cold winds to save the fainted driver from the water; a pregnant woman was in critical condition and needed platelets of blood type O, but the blood bank supply was not enough, 21 young men from Nanjing district donated blood proactively to help the pregnant woman overcome the critical moment; a baby was born in prematurity and needed urgent blood transfusion within one hour, the child’s father was desperate and asked for help in the street, a courier in Beijing district did not hesitate and went to the hospital immediately with the child’s father, 400 cc blood was donated to save the life of the child and assured his healthy growth; ……all these positive cases attracted coverage by media, such as People’s Daily and Express Magazine, some courier were presented “Good Personality Awards” by the government to commend the couriers on taking social responsibility and disseminate positive values. Up to now, a total of seven sessions of “Best SF Person” Awards were held and presented “Social Responsibility Awards” to 17 selected employees, conferring the highest SF honor to outstanding staff in the aspect of social responsibility.

S.F. Holding Co., Ltd. 2019 Semi-Annual Report
43
Chapter 4 Management Discussion and Analysis of Business Operation
I. Overall Performance of the Company during the First Half of 2019
1. Overall financial performance
Due to the uncertainties in the international situation and easing domestic market demand, the growth of the revenue from the Company's traditional products slowed down during the first half of 2019. However, benefiting from the sustained and rapid growth of the Company's new businesses, effective implementation of cost reduction measures and efficiency improvement brought by the application of new technologies, the Company's overall revenue growth remained healthy and its profitability steadily increased during the first half of 2019.
Revenue: During the first half of 2019, the Company realized 2.017 billion of shipments and revenue of
RMB50.075 billion, a year-on-year revenue increase of 17.68%. In order to cope with the changes in market demand brought about by the adjustment of consumption structure, the Company adjusted its product strategy in due course and launched new products for specific markets and customers, thereby realizing increase in volume and revenue. At the same time, the Company continued to develop new businesses such as freight, cold chain and pharmaceutical transportation, international express delivery and intra-city delivery. By establishing New HAVI and SF DHL, SF Holding entering supply chain business, the scale of integrated logistics business is gradually increasing. During the first half of 2019, the Company's revenue from new businesses (including supply chain) accounted for 23.66% of the total revenue, and the rapid growth of the revenue from the new businesses contributed significantly to the overall revenue growth of the Company.
Profit: During the first half of 2019, the Company realized a net profit attributable to shareholders of parent
company of RMB3.101 billion, representing a year-on-year increase of 40.35%, while net profit attributable to shareholders of parent company after deducting non-recurring profits and losses amounted to RMB2.33 billion, representing a year-on-year increase of 11.48%. The new businesses have achieved scale economy to a certain extent. At the same time, benefiting from the application of various new technologies and effective cost reduction measures, the Company's cost efficiency effects have been further demonstrated. Gross profit margin rose to 21.50% in the second quarter of 2019, representing an increase of 3.5 percentage points from the previous quarter. During the first half of 2019, the overall gross profit margin rose to 19.82%, representing an increase of 0.86 percentage points from the same period of last year and an increase of 1.9 percentage points as compared with the whole year of 2018. Among them, the optimization and control of transportation costs have achieved remarkable results, which are mainly reflected in two aspects: on the one hand, on the premise of ensuring timeliness, the routes are integrated and dynamically optimized by means of business forecasting and route planning, so as to improve transportation efficiency significantly. On the other hand, through the combination of deploying various transportation resources, such as self-operating, outsourcing, and on-demand trucking platform, the optimal strategy of transportation resources is realized, while the cost of transportation resources is continuously reduced without compromise of quality. Having benefited from the above measures, the transportation cost to revenue ratio decreased significantly year-on-year.
Financial Status: As at the end of the reporting period, the Company’s total assets were RMB81.037 billion,
an increase of 13.16% as compared with the end of 2018. Benefiting from stable and healthy profit contribution in the first half of 2019, the Company's total equity attributable to shareholders of the parent company at the end of the reporting period was RMB38.405 billion, an increase of 5.04% as compared with the end of 2018. As at the end of the reporting period, the Company's debt-to-asset ratio increased slightly, from 48.45% as at December 31, 2018 to 52.26% as at June 30, 2019, while the level of debt remained relatively healthy and the financial position was stable and optimistic.

S.F. Holding Co., Ltd. 2019 Semi-Annual Report
44
The key financial indicators are shown in the table below. Please refer to the business discussion and analysis in this Chapter for more detailed financial data analysis.
Item Indicators Current
reporting
period
The same period
of previous year
(Restated)
Increase/Decrease
over the same period
of previous year
Business
Revenue from express logistic and supply chain (billions RMB) 49.480 42.160 17.36%Of which: (1) Revenue from express logistic (billions RMB) 47.637 42.160 12.99%
Shipments (Billions) 2.017 1.858 8.54%Average revenue per shipment (RMB) 23.62 22.69 4.10%
(2) Revenue from supply chain (billions RMB) 1.843 N/A N/A
Income Statement
Revenue (billions RMB) 50.075 42.551 17.68%Net profit attributable to shareholders of the parent company (billions RMB) 3.101 2.210 40.35%Net profit attributable to shareholders of the parent company after deducting non-recurring profits and losses (billions RMB)
2.330 2.090 11.48%
Weighted average return on net assets 8.23% 6.57% An increase of 1.66 percentage points
Earnings per share(RMB/Share) 0.70 0.50 40.00%
Item Indicators
End of the current
reporting period
End of previous year
(Restated)
Increase/Decrease over previous year
end
Balance Sheet
Total assets (billion RMB) 81.037 71.615 13.16%Total equity attributable to shareholders of the parent company (billion RMB) 38.405 36.561 5.04%
Debt to Asset Ratio 52.26% 48.45% An increase of 3.81 percentage points

S.F. Holding Co., Ltd. 2019 Semi-Annual Report
45
2. The traditional business grew steadily and contributed to sustainable and healthy revenue
Customer resources: In response to the changes in the market and the diversification of customer demand, SF Holding focused on industry characteristics and business clustering, centered on the direction of multiple-scenario planning, digitalization and refinement, and tapped into customer demand for supply chain. By relying on technological means to drive internal changes and upgrading product portfolio, we constantly improved customer service capabilities and customer experience to achieve a stable and healthy growth of customer volume and revenues.
Cash customers: Cash customer management adhered to customer-centric approach, continuously covered all
the scenarios of customer delivery services through the combination of online and offline platforms, focused on the traffic volume of various online lifestyle applications, completed the coverage of online delivery service, deepened the scenario planning for traditional offline delivery services and expanded the scope of new delivery scenarios for users, and completed the coverage of offline delivery service. In respect of customer operation, the perception and loyalty of customers have been continuously improved by formulating refined strategies to match different interests and services of customers. As at the end of the reporting period, the number of members reached 200 million and average monthly active customers exceeded 28.89 million, representing a year-on-year increase of 35%. In the future, the Company will continue to consolidate the service framework capacity and upgrade, optimize and review the operation tools, improve the efficiency of cash customer management, so as to jointly ensure the healthy achievement of the business objectives and realize long-term and stable business growth.

S.F. Holding Co., Ltd. 2019 Semi-Annual Report
46
Credit account customers: During the first half of 2019, SF Holding continued to focus on the industry supply chains by distinguishing between different industries, between different business use cases throughout end-to-end processes, refinement of all touchpoints, and digitization, to further improve customer service quality and the customer experience, the number of credit account customers thereby increased steadily. We improved the experience of small and medium customers through online platform operation. The number of active account customers grew from 950,000 in June 2018 to 1.17 million in June 2019, representing an increase of 23% year-on-year. Meanwhile, by approaching key industry customers with integrated logistics solutions, the customer structure has been continuously optimized, and the proportion of major customers spending over RMB1million continued to increase.
The stable and growing number of active customers, the full-cycle risk prevention and control system, the
multi-product portfolio, and the diversified solutions collectively ensure the long-term stable and healthy growth of SF Holding’s revenue.
Time-definite Express: In 2018, SF Holding continued to consolidate and enhance the competitiveness of the
express products. Combining key resource capabilities and technological means, we optimized timeliness throughout the entire process of express delivery service and achieved a rational price differentiation of products using the technology pricing/cost model to improve product cost performance. Meanwhile, we focused on the diversified needs of our customers and created regionalized products. Diversified high-quality services ensured the healthy and stable growth of the business. During the reporting period, revenue from time-definite express was RMB26.765 billion. The average delivery time of shipments decreased by 3.5 hours as compared with the same period of last year. In the future, with the further improvement of the cost performance, the core competitiveness will be further consolidated and the steady growth of the time-definite express business will be maintained.
Economy product: SF Holding continued to optimize and upgrade the economy products, improve a faster,
safer and more cost-effective ground transportation network, and optimize the end-to-end operation segments, models and framework of products through scientific and technological empowerment, thereby further improving the utilization rate of resources, reducing costs and increasing efficiency, and enhancing the competitiveness of products. On the premise of ensuring service quality and timeliness, we made full use of the existing resources by means of business demand forecasting and route planning, gave full play to the marginal effect of the existing resources, and integrated and optimized the existing resources. For example, we merged the trunk and branch routes with overlapping flow direction, time period and efficiency, replaced the vehicles with larger-capacity models, and reduced the number ad hoc routes and branch routes, thus further improving the efficiency of scale and significantly increase the loading rate.
The fast-growing traffic of the second-category e-commerce in the past two years is at a much faster rate than
that of its peers. The Company leveraged its unique advantages as a third-party logistics service provider, gained customers' trust, and launched products and services with high cost performance through utilization of big data and system integration. In May 2019, the Company launched new products such as preferential distribution for specific markets and customers to meet the diversified needs of customers, and quickly gained market recognition, which accelerated the increase in the revenue from and market share of economy products. The new products broke through the price limitation of the original products, filled the gap in the price range, improved the economy product portfolio and constantly kept pace with the market competition. In the meantime, through targeted sales approach and technological means, the new products optimized the end-to-end operation model, such as centralized collection of bulk items, delivery / pick-up by customers through transit depot, delivery to Hive Box locker, and so on, based on the characteristics and needs of customers' business, thereby further improving the utilization efficiency of stock resources and transport capacity, achieving cost reduction and efficiency increase, and at the same time realizing more flexible and competitive quotations.

S.F. Holding Co., Ltd. 2019 Semi-Annual Report
47
During the reporting period, the revenue from economy products was RMB11.46billion and the overall timeliness fulfillment rate was 5% higher than that of during the same period of last year.
3. Strong development momentum of new businesses
(1) Freight The freight business of SF Holding is divided into SF Freight and SX Freight. SF Freight is positioned in the
medium to high-end market with high-level requirements for timeliness, quality and service experience, and SX is positioned in the mid-end market.
Through years of intensive development and cultivation, SF Freight has accumulated a large number of leading
customers across different industries including Huawei, Midea and Hisense. These high-quality customers not only have stable operations and strong risk resilience, but also diversified service requirements, which provides solid customer resource support and sustained momentum for the rapid development of SF Freight.
Relying on the advantages of SF Holding's network and resources, SF Freight provides customers with
door-to-door service, which is fast, stable, efficient, reliable, and cost-effective. At the same time, based on the personalized needs of different customers, it offers tailor-made end-to-end integrated supply chain solutions and services to customers, which effectively solves customer needs and pain points, and thereby helps customers seize development opportunities. In addition, having benefited from the talents and technological reserves of SF Technology, SF Freight has set up a specialized technology team to develop a digital operating system and automation equipment suitable for the business scenarios of SF Freight by using SF Holding's exclusive advanced technologies such as electronic freight maps, big data, computer graphics, operational planning, mobile AI computing, and other advanced technologies, which serves the scientific decision-making and fine operation of SF Freight.
As at the end of the reporting period, SF Freight had 44 transit depots and 1,131 service points, with overall site
area of over 1.38 million m2 , over 15,000 delivery vehicles, over 930 trunk routes and more than 7,000 branch routes, covering 362 major cities and regions in 31 provinces nationwide. During the first half of 2019, SF Freight stayed far ahead of its peers in terms of the growth rate in the high-end market, while the overall market share continued to increase and the service quality steadily improved. In the second half of the year, the Company will continue to enhance the network frameworks, strengthen study and development in sub-sectors and heavy cargo sorting automation and technological application capacity building to further improve efficiency and customer experience, and support the rapid growth. "
SX Freight" is an independent brand of Shunxin Express, a subsidiary of SF Holding, focusing on the whole
network mid-range freight market. As of June 30, 2019, SX Freight had 3,918 affiliated outlets and 132 direct operation stations, with a total area of over 320,000 m2 and a 100% coverage of the major cities and regions nationwide. SX Freight’s cumulative cargo volume increased by 114% during the first half of 2019 as compared with the same period of last year and its overall volume growth momentum has maintained a leading position in the industry. In the second half of the year, SX Freight will continue to strengthen the framework development and enhance penetration of network coverage. SX Freight ensured cost performance with quality, and shared resources with SF Freight in respect of operation mode and product positioning. At the same time, SF Freight and SX Freight also shared resources and deepened complementarities in terms of depots, routes and transport capacities, thereby helping each other enhance the competitiveness of their operation networks and service quality and jointly providing customers with comprehensive logistics solutions.
During the first half of 2019, the revenue from Company's freight business as a whole amounted to RMB5.072
billion, representing an increase of 46.99% year-on-year, significantly higher than that of its peers.

S.F. Holding Co., Ltd. 2019 Semi-Annual Report
48
(2) Cold Chain for food products and pharmaceuticals
At present, the domestic cold chain market is fragmented. Market participants are mainly regional or local players. SF Holding is the first logistics company in China to initially establish a national cold chain network. As of the end of the reporting period, SF Holding held 25 refrigerated food product warehouses with operation area of 158,800 m2, 433 refrigerated trucks, and food product transportation routes across core cities of China. SF Holding’s refrigerated food product warehouses have already acquired international high-standard DQMP certification, equipped with advanced automated refrigeration equipment, smart temperature monitoring and control systems, and integrating the ability to manage multiple temperature zones, such as freezing, refrigerated, constant, and room temperatures, with high-standard cold storage capabilities. Relying on advanced cold chain technologies such as customized packaging, high-energy storage refrigerant temperature control technology, storage temperature and humidity monitoring and warning systems connected to vehicle GPS, vehicle-mounted temperature control and real-time monitoring systems, SF Holding provides customers with professional and efficient end-to-end cold chain logistics distribution services throughout the whole process. The cold chain business already has covered many sectors including production, e-commerce, sales and retail. Major customers include Hitomorrow, Family Mart and Honest Dairy.
SF Holding has developed the concept of "Branch-to-Tongue, Farm-to-Table" for the promotion of Chinese
agricultural products. On top of the foundation built by continuously focusing on B2C in the industry value chain, SF Holding will further develop the B2B service market, and enhance its "market competitiveness" under various business scenarios through "model innovation, cost reduction and efficiency enhancement" to meet the differentiated needs of diverse customers. Driven by technology, SF Holding created "new models of industry solutions" for the regional special products and developed a new operation model of "trunk transportation + delivery" for Shandong peach and Guangxi mango and "warehouse + trunk transportation + delivery" for Shandong seafood and aquatic products. SF Holding adhered to the concept of "opening-up and win-win cooperation", shared promotion channels and commercial platform resources, and actively built regional public brands so as to help bring more special agricultural products out from the mountains to across the country. Among them, SF Holding, along with the government and local associations, jointly organized a total of 17 activities under the themes of logistics or production and marketing coordination. At present, the main agricultural projects include, among others, Yantai cherry, Lingnan lychee, Xianju waxberry, Yangshan peach, Yunnan flower, and Ganzi matsutake. In the future, SF Holding will continue to focus on "innovation" and "efficiency enhancement" in order to assist in the healthy and rapid development of regional special economies by means of model adjustment, process optimization, and technology empowerment.
In recent years, the government has continuously pushed forward the healthcare reforms. Under the influence
of policies such as the tiered diagnosis and treatment model, the centralized drug procurement program in “4+7 cities”, and the two-invoice system, pharmaceutical resources have extended to grassroots medical organizations, and pharmaceutical circulation channels have been developing in a horizontal and decentralized way. This has posed a great test to the network breadth and depth of pharmaceutical logistics distribution enterprises, as well as the quality and safety guarantee in the process of pharmaceutical transportation and storage. SF Holding made use of its resource advantages and relied on mature logistics network and technological capabilities to further improve a deeper and broader pharmaceutical service network and provide services with the total solution capabilities of customers in core industries. As of the end of the reporting period, SF Holding's pharmaceutical network covered 137 prefecture-level cities and 1,003 districts and counties, had 4 GSP certified pharmaceutical warehouses with a total area of 30,000 m2 in addition to 36 trunk routes of pharmaceutical transportation, linking the core cities of Northeast, North, East, South and Central China, and had 236 refrigerated trucks verified by GSP, and equipped with a complete logistics information system and a self-developed TCEMS whole-process visual monitoring platform. SF Holding focused on providing professional, safe and controllable logistics supply chain services to customers in the pharmaceutical industry, covering many fields such as production, e-commerce, sales and retail in the pharmaceutical industry. Major customers in the pharmaceutical industry include Bayer, Sanofi, Boehringer Ingelheim, Hengrui Pharmaceuticals, Harbin Pharmaceuticals, CR Sanjiu, Qilu Pharmaceuticals, GPHL, etc.
In the first half of 2019, the Company's revenue from the cold chain and pharmaceutical business amounted to
RMB2.352 billion, representing an increase of 53.93% year-on-year, maintaining its rapid growth.

S.F. Holding Co., Ltd. 2019 Semi-Annual Report
49
(3) Intra-city instant delivery With the popularity of new retailing, the application scenarios of intra-city instant delivery are becoming
increasingly abundant, and consumers are paying more and more attention to the high-quality last mile delivery experience. The instant delivery market reached RMB120 billion in 2019, and is expected to maintain a compound annual growth of over 30% in the following three years. The market will exceed RMB200 billion in 2021, with great market potential.
In the past three years, SF Holding has provided standardized intra-city delivery services with high cost
performance for catering, supermarket, clothing, pharmaceuticals and other industries, as well as customized services with different scenarios, delivery distances and delivery models based on the special needs of different customers. SF intra-city delivery business has always been focusing on the value proposition of "high quality, high efficiency and full scene" in the field of instant delivery, with rich and diversified products, flexible and diverse transport models and efficient operation and management, thereby building a nationwide instant delivery network with high quality and efficient delivery and rapidly increasing market share.
In terms of brand image, SF intra-city instant delivery has built a neutral and reliable market image, which can
fully promote the brand value proposition to the customers, accumulated a large number of customers and good reputation, and has become the preferred third-party distribution partner for independent merchants in the industry. Our partner brands include McDonald's, KFC, Luckin Coffee, Tianhong, Yonghui, Pizza Hut, Uniqlo and other industry-leading customers.
In terms of products and customer services, we not only continued to provide the best quality and customized
brand products for partner brands, but also launched economy products for small and medium-sized businesses to form a diversified and healthy business portfolio. In terms of personal urgent delivery, the business has covered the major urban areas of major cities across China, providing 24/7 direct delivery service.
In terms of operation and resource support, we continued to promote the integration of mixed transport models,
improve rider efficiency and further optimize operating costs. As for the service quality, we have always been leading the industry in terms of aspects including personnel quality, equipment support, system level, and after-sales service. We have also been providing customers with professional, safe, efficient, stable, high-standard and high-quality delivery even in peak periods or abnormal weather conditions. In the future, we will continue to enhance our ability to provide high-quality and efficient instant delivery services, and will also provide one-stop new retail solutions for businesses focusing on the needs of retail operators, helping businesses to create lifestyle experience at zero distance by bringing businesses to zero distance from consumers while bringing consumers to zero distance from what they want at the moment.
During the first half of 2019, revenue from the Company's intra-city delivery business amounted to RMB0.786 billion, representing an increase of 129.13% over the same period last year, much higher than the average growth rate of the industry.
(4) International Express SF Holding is committed to providing convenient and reliable international express delivery and logistics
solutions for domestic and foreign manufacturing companies, trading companies, cross-border e-commerce, and consumers, including international standard express, international economy express, international small parcel, overseas warehousing, transshipping, international e-commerce express, and other different categories of timing standards and import/export services. In addition, we can provide integrated and customized import/export solutions based on customer needs including market access, transportation, customs clearance, and delivery. SF international standard express / international economy express businesses cover 62 countries including the United States, the European Union, Russia, Canada, Japan, South Korea, India, Brazil, Mexico, and Chile, among others. In June 2019, 8 African countries including Tanzania, and Nigeria, among others were newly added to the scope of international economy express business. The international small parcel business covers 225 countries and regions across the world. Under the influence of the complex international environment, the demand for SF's cross-border logistics services by domestic and foreign enterprises is increasingly growing. SF Holding will further speed up the international network layout so as to help outstanding enterprises/products "go global" and "bring in" overseas high-quality enterprises/products to China.

S.F. Holding Co., Ltd. 2019 Semi-Annual Report
50
In response to the "the Belt and Road" initiative, SF Holding has been helping Chinese enterprises with their overseas positioning, providing customized cross-border supply chain solutions based on diversified needs of enterprises, and providing cross-border relocation logistics solutions for diversified industry value chains such as cross-border factory relocation, cross-border transportation of domestic supply chain raw materials, local VMI warehouse of overseas supply chain raw materials, and overseas F2B distribution and delivery. In August 2018, SF’s Sino-Indian all-cargo flight helped a Chinese leading customer 3C brand by providing cross-border raw material transportation and supply chain integration solutions. In May 2019, SF Holding provided a full-chain cross-border factory relocation from China to India for a domestic high-tech electronic parts manufacturer.
SF Holding has been committed to providing end-to-end supply chain solutions for overseas renowned
enterprises and brands to enter the Chinese market. SF Holding has been serving an international chip and semiconductor manufacturer since 2017. In 2019, SF Holding became the brand's core logistics provider and successfully entered the supply chain service provider system of the manufacturer's upstream and downstream supporting industries. With the increasing influence of SF Holding among overseas brands, an increasing number of international enterprises choose to enter the Chinese market with the help of SF Holding. In September 2018, SF Holding became a cross-border e-commerce export logistics provider for Tophatter, a US-based SFB platform, serving 30% of the platform's sellers. The two sides jointly organized a special session of SF International Training Class to provide an exchange platform for cross-border sellers from cities such as Hefei, Changsha and Guangzhou, with a daily average shipment increase of 200%. In April 2019, SF Holding became Kaola.com’s certified logistics service provider, providing Kaola users with cross-border import logistics solutions from the US, South Korea, and Singapore, with the inflow from the US covering over 20% of customers of the platform.
During the first half of 2019, the revenue from the Company's international express business amounted to
RMB1.202 billion, maintaining its steady development. (5) Supply Chain Business In August 2018 and February 2019, SF Holding completed the acquisition of the cold chain business of
HAVI in mainland China, Hong Kong China and Macao China and the supply chain business of DHL in mainland China, Hong Kong China and Macao China respectively, and established SF’s New HAVI and SF DHL businesses. The integration and synergy between New HAVI and SF DHL businesses with SF Holding’s original businesses have achieved initial results. On the one hand, SF rapidly learned from and replicated the supply chain solutions and management capabilities of New HAVI and SF DHL. On the other hand, driven by technology and data, based on SF’s DNA genes, and through digital technologies such as the Internet of Things, big data, artificial intelligence, SF's technological solutions drive the transformation and upgrading of the supply chain to jointly reshape the supply chain for customers and provide comprehensive solutions with multi-scenario products.
The integrated supply chain solutions and service capabilities of New HAVI are both professional in design
and feasible for implementation. In addition, New HAVI has a high-quality supply chain plan implementation capability, and continuously optimized business workflow, and strengthened the development of resources and technology framework so as to ensure stable and efficient service quality and supply chain plan implementation, which has been highly recognized by customers and the industry. In March and May 2019, New HAVI was conferred the titles of "China Outstanding Catering Supply Chain Service Provider" (中国优秀餐饮供应链服务
商) and the "Smart Logistics Service Brand Enterprise" (智慧物流服务品牌企) by the Cold Chain Logistics Committee of the China Federation of Logistics and Purchasing and the China Communications and Transportation Association respectively.
In the first half of 2019, New HAVI adopted a flexible and targeted business expansion strategy to meet the
needs of customers of varying scales and across different industries, and achieved sustained and healthy business growth. At the same time, New HAVI continued to strengthen the construction of core resources and technology framework to support rapid business development. Currently, it has 30 highly efficient cold chain logistics centers (including internal leasing) in operation covering 19 core cities. New HAVI and SF's various business sectors are actively cooperating with each other. SF Holding and New HAVI have integrated and shared resources such as warehousing and transportation capacity to improve resource efficiency. In terms of IT systems, with the support of SF Holding, New HAVI has reconstructed and upgraded its existing system service capacity and now has the capacity to carry out platform business. On the other hand, SF Holding's various business segments have joined forces with New HAVI to jointly expand cooperation with industry benchmark customers and provide customers with high-quality cold chain B2B2C industry solutions. During the reporting period, New HAVI has signed dozens of new clients.

S.F. Holding Co., Ltd. 2019 Semi-Annual Report
51
Relying on the solid logistics infrastructure and customer base of SF Holding’s extensive network and the
global leading supply chain management experience of Deutsche Post DHL Group, SF DHL provides high-quality integrated supply chain solutions to customers. In the first half of 2019, SF DHL seized the opportunities arising from enterprise reform to improve supply chain efficiency and lean management, and tapped into customers' demand for supply chain upgrading. Among them, in the automotive and industrial manufacturing sectors, benefiting from its extensive experience in inbound logistics, after-sales logistics and digital innovation capability, it actively utilized technological capacity of SF Holding and its technology partners to help customers continuously improve the quality, efficiency and reliability of their supply chain. In terms of the fast-moving consumer goods and retail industry, with the help of the capabilities of SF Holding's big data team and the service experience of e-commerce customers, it successfully completed multiple B2B/B2C integrated warehouses and opened up new business fields. In terms of the pharmaceutical industry, acquiring key qualifications and capabilities through mergers and acquisitions has achieved rapid growth. As for the high-tech and 3C industries, SF DHL has integrated resources with SF Holding's customers to jointly develop China's domestic high-tech industries and 3C enterprise customers. During the first half of 2019, SF DHL's revenue continued to grow, leading the enterprise supply chain market.
During the first half of 2019, the revenue from the Company's supply chain business amounted to RMB1.843 billion, of which the revenue from SF DHL was incorporated since March 2019 after the acquisition completed. In the future, New HAVI and SF DHL will further bring synergy to the Company, thereby driving the Company's overall supply chain business to grow rapidly.

S.F. Holding Co., Ltd. 2019 Semi-Annual Report
52
II. Analysis on Main Business
For details, please refer to “I. Overall Business Performance of the Company during the First Half of 2019” under the section “Chapter 4 Management Discussion and Analysis of Business Operation.” Year-over-year changes to major financial data
Unit: RMB
Current Reporting Period
The same period of previous year
Increase/Decrease over the same period of
previous year Rationale
Revenue 50,074,704033.85 42,550,906,755.42 17.68% Cost of revenue 42,152,044,224,73 34,483,562,144.39 16.44% Selling and distribution expenses 884,549,456.76 973,618,226.32 -9.15%
General and administration expenses 4,843,661,455.94 3,844,763,325.32 25.98%
Financial expenses 331,609,607.60 54,420,723.81 509.34%
Increased due to the increase in interest expenses from increased borrowings and decrease in interest income from inter-bank deposits.
Income tax expense 882,642,296.52 790,949,730.08 11.59%
Research and development investment 1,208,951,470.76 773,427,188.15 56.31%
R&D investment (including capitalized and expensed R&D) increased by RMB 436 million, or56.31%, mainly due to the increase in research and development activities.
Net cash flow from operating activities 4,816,886,549.68 2,369,608,790.80 103.28%
Increased due to the net profit increase and impact of cash inflow from sales of goods and services being greater than cash outflows from purchases of goods services and payroll expenses.
Net cash flows from investing activities -13,153,751,568.98 -4,999,614,188.54 163.10%
Decreased due to the cash outflow in acquisition of subsidiaries, increase in net cash outflow of wealth management products and the purchase of long-term assets.
Net cash flows from financing activities 4,968,519,388.28 -1,216,079,983.17 -508.57% Increased due to the increase in
net inflows of borrowings.
Net increase in cash and cash equivalents -3,371,260,653.60 -3,832,719,722.18 -12.04%
Please refer to the above analysis of cash flow changes for operating activities, investment activities and financing activities.

S.F. Holding Co., Ltd. 2019 Semi-Annual Report
53
Did significant changes occur in profit composition or sources of profit? □Applicable √Not applicable Composition of revenue
Unit: RMB
Current Reporting Period The same period of previous year Increase/Decrease
over the same period of previous year Amount
Proportion of Revenue Amount
Proportion of Revenue
Revenue 50,074,704,033.85 100% 42,550,906,755.42 100% 17.68%Categorized by industry Express logistic and supply chain 49,479,804,469.27 98.81% 42,160,162,854.77 99.08% 17.36%
Sales of goods 253,670,085.55 0.51% 54,768,168.17 0.13% 363.17%Others 341,229,479.03 0.68% 335,975,732.48 0.79% 1.56%
Categorized by product Time-define Express 26,765,052,056.21 53.45% 25,731,642,712.22 60.47% 4.02%Economy Express 11,460,073,418.28 22.89% 9,885,355,748.45 23.23% 15.93%Heavy Cargo 5,072,343,493.02 10.13% 3,450,872,512.36 8.11% 46.99%Cold Chain 2,352,046,365.17 4.70% 1,528,029,936.00 3.59% 53.93%Intra-City Delivery 785,671,660.75 1.57% 342,887,870.67 0.81% 129.13%International Express 1,201,793,431.30 2.40% 1,221,374,075.08 2.87% -1.60%Supply Chain 1,842,824,044.54 3.68% N/A N/A N/AOthers 594,899,564.58 1.19% 390,743,900.65 0.92% 52.25%
Categorized by region Express logistic and supply chain –East China
14,440,657,980.91 28.84% 12,443,526,804.15 29.24% 16.05%
Express logistic and supply chain –South China
11,633,487,344.92 23.23% 10,660,429,957.42 25.05% 9.13%
Express logistic and supply chain –North China
11,295,843,131.23 22.56% 9,245,291,089.11 21.73% 22.18%
Express logistic and supply chain –Central China
6,674,286,669.48 13.33% 5,656,142,970.02 13.29% 18.00%
Express logistic and supply chain –West China
3,995,871,735.90 7.98% 3,250,923,966.29 7.64% 22.91%
Express logistic and supply chain –Hong Kong and Macao
1,106,991,784.15 2.21% 644,905,256.71 1.52% 71.65%
Express logistic and supply chain –Overseas
332,665,822.68 0.66% 258,942,811.07 0.61% 28.47%
Commodity and others 594,899,564.58 1.19% 390,743,900.65 0.92% 52.25%
Note: Product revenue and district revenue in the preceding table have not been audited.

S.F. Holding Co., Ltd. 2019 Semi-Annual Report
54
Industries, products, or regions accounting for more than 10% of company revenue or operating profit
√Applicable □Not applicable
The Company is required to comply with the disclosure requirements of the “Guidelines of the Shenzhen Stock Exchange for Industrial Information Disclosure No.9–Listed Companies Engaged in the Express Delivery Services Business”
Unit: RMB
Revenue Cost of revenue Gross Profit
Margin
Revenue Increase/
Decrease over the same period of previous year
Cost of revenue Increased or
Decreased over the same period of previous year
Gross Profit Margin Increased or
Decreased over the same period of previous year
Industries
Express logistic and supply chain 49,479,804,469.27 39,676,010,637.56 19.81% 17.36% 15.96% 0.96%
During the reporting period, the Company has accounted its operation costs according to the nature of resources consumed appropriately. However, a fair and accurate allocation of cost by product or by region has not been possible. It was because the express and logistics industry itself was basically a complex network, by highly connection, overlaps in different types of resources consumed, all direction of waybills, a tremendous number of customers, highly crossover of different types of resources fully shared. Disclosure of express delivery volumes, revenues and average revenue per shipment and analysis of changes and rationale For more details, please refer to the “I. Overall Business Performance of the Company during the First Half of 2019”under the section “Chapter 4 Management Discussion and Analysis of Business Operation”. Explanation for related changes greater than 30% as compared with those in the prior year period
□Applicable √Not applicable

S.F. Holding Co., Ltd. 2019 Semi-Annual Report
55
III. Non-core Business Analysis
√Applicable □Not applicable
Unit: RMB
Amount Proportion of Total Profit Reason Sustainable
Other income 164,346,392.59 4.19% Mainly including government grants related to daily activities. No
Investment income 386,073,900.85 9.83%
Mainly including investment income from wealth management products, arising gains/ (losses) from the disposal of long-term equity investment and share of net gain or loss of investee companies by equity method.
Revenue from wealth management products is sustainable, while other investment income is not sustainable.
Gains and losses arising from changes in fair value 330,207,611.55 8.41% Mainly including changes in fair value of
other non-current financial assets. No
Asset impairment losses 54,112,179.14 1.38% Mainly including impairment losses of long-term equity investment and intangible assets
No
Credit impairment losses 148,865,353.45 3.79% Mainly including bad debt losses of accounts receivables and other accounts receivables.
No
Gains /(Losses) on disposal of assets -12,876,151.73 -0.33% Mainly including the gains or losses from
disposal of fixed assets. No
Non-operating income 70,153,540.77 1.79% Mainly including government grants unrelated to daily activities and compensation income
No
Non-operating expenses 41,761,260.71 1.06% Mainly including donations, compensation expenses, and penalties. No

S.F. Holding Co., Ltd. 2019 Semi-Annual Report
56
IV. Analysis of Assets and Liabilities
1. Major Changes in Asset Composition
Unit: RMB
End of Current Reporting Period End of previous year Increase/ Decrease in Proportion
Major Changes Amount Proportion
of Total Assets
Amount Proportion of Total Assets
Cash at bank and on hand 12,487,217,955.15 15.41% 16,131,119,850.56 22.52% -7.11%
For details, please refer to analysis on cash flow in“II. Analysis on Main Business” under Chapter 4 Management Discussion and Analysis of Business Operation.
Financial assets held for trading 2,525,764,638.79 3.12% - - -
In accordance with new standards for financial instruments, financial assets at fair value through profit or loss was restated as financial assets held for trading; certain structured deposits that did not carry the characteristics of financial assets’ contractual cash flows for principal and interest were restated from other current assets to financial assets held for trading; available-for-sale financial assets were restated as investment in other equity instruments and other non-current financial assets. Except for the above re-classifications, changes in financial assets held for trading for the current period are mainly due to increase in structured deposits.
Financial assets at fair value through profit or loss
- - 14,441,978.09 0.02% - Please refer to the above financial assets held for trading description.
Available-for-sale financial assets - - 3,423,527,060.27 4.78% -
Please refer to the above financial assets held for trading description.
Investments in other equity instruments
4,042,698,444.01 4.99% - - -
Same as the description for the above financial assets held for trading , except for the impact of reclassification, changes for the current period are mainly due to increase in equity investment in Flexport.
Other non-current financial assets 405,065,380.55 0.50% - - -
Please refer to the above financial assets held for trading description.
Accounts 8,438,161,191.55 10.41% 7,352,877,748.87 10.27% 0.14% Increased due to the
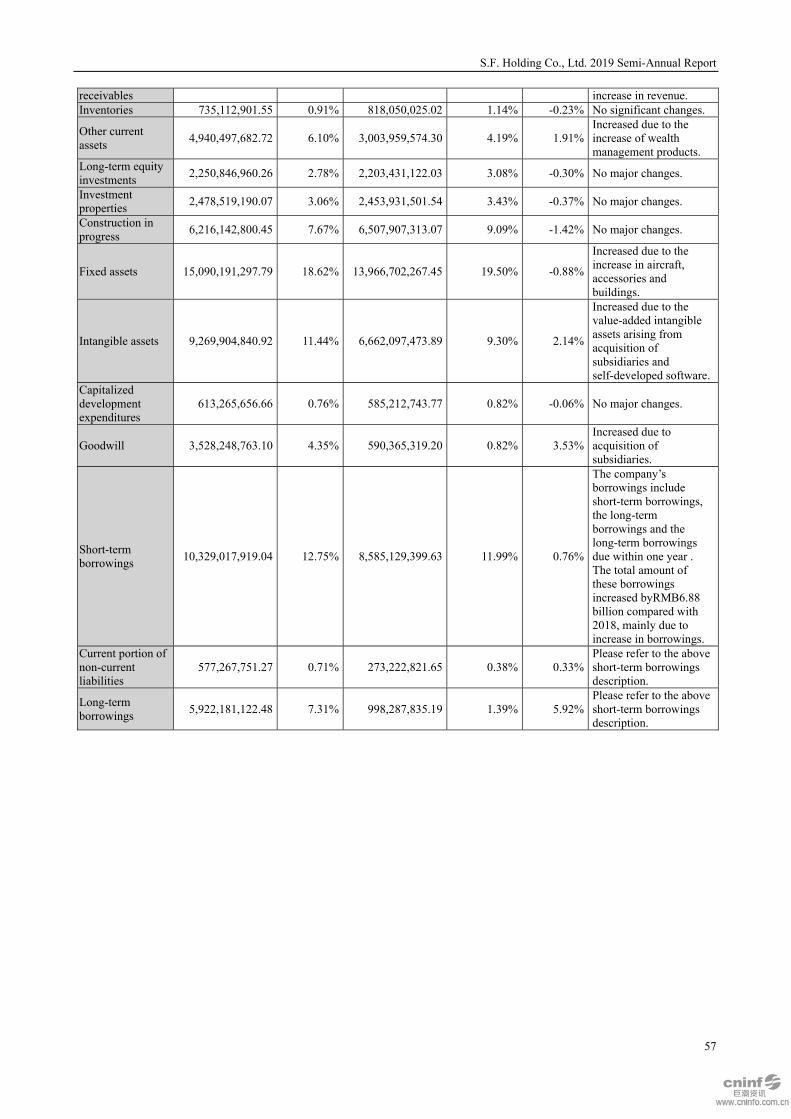
S.F. Holding Co., Ltd. 2019 Semi-Annual Report
57
receivables increase in revenue. Inventories 735,112,901.55 0.91% 818,050,025.02 1.14% -0.23% No significant changes.
Other current assets 4,940,497,682.72 6.10% 3,003,959,574.30 4.19% 1.91%
Increased due to the increase of wealth management products.
Long-term equity investments 2,250,846,960.26 2.78% 2,203,431,122.03 3.08% -0.30% No major changes.
Investment properties 2,478,519,190.07 3.06% 2,453,931,501.54 3.43% -0.37% No major changes.
Construction in progress 6,216,142,800.45 7.67% 6,507,907,313.07 9.09% -1.42% No major changes.
Fixed assets 15,090,191,297.79 18.62% 13,966,702,267.45 19.50% -0.88%
Increased due to the increase in aircraft, accessories and buildings.
Intangible assets 9,269,904,840.92 11.44% 6,662,097,473.89 9.30% 2.14%
Increased due to the value-added intangible assets arising from acquisition of subsidiaries and self-developed software.
Capitalized development expenditures
613,265,656.66 0.76% 585,212,743.77 0.82% -0.06% No major changes.
Goodwill 3,528,248,763.10 4.35% 590,365,319.20 0.82% 3.53% Increased due to acquisition of subsidiaries.
Short-term borrowings 10,329,017,919.04 12.75% 8,585,129,399.63 11.99% 0.76%
The company’s borrowings include short-term borrowings, the long-term borrowings and the long-term borrowings due within one year . The total amount of these borrowings increased byRMB6.88 billion compared with 2018, mainly due to increase in borrowings.
Current portion of non-current liabilities
577,267,751.27 0.71% 273,222,821.65 0.38% 0.33% Please refer to the above short-term borrowings description.
Long-term borrowings 5,922,181,122.48 7.31% 998,287,835.19 1.39% 5.92%
Please refer to the above short-term borrowings description.

S.F. Holding Co., Ltd. 2019 Semi-Annual Report
58
2. Assets and liabilities measured at fair value
√Applicable □Not applicable Unit: RMB
Opening Balance
Changes in Fair Value Gains and
Losses in Current Period
Accumulated Fair Value Changes
Included in Equity
Provision for
Impairment in Current
Period
Increase in the Current Period
Amount of Sales in Current Period
Closing Balance
Financial assets
1. Financial assets held for trading (excluding derivative financial assets) ( Note1)
1,146,225,204.41 330,542,683.78 2,029,309,222.46 79,244,163.94 2,930,446,915.60
2. Derivative financial assets 726,641.31 -335,072.23 383,103.74
3. Investments in other equity instruments 2,812,830,084.90 24,629,582.65 630,682,562.62 54,996,904.29 4,042,698,444.01
Total financial assets 3,959,781,930.62 330,207,611.55 24,629,582.65 2,659,991,785.08 134,241,068.23 6,973,528,463.35
Total 3,959,781,930.62 330,207,611.55 24,629,582.65 2,659,991,785.08 134,241,068.23 6,973,528,463.35
Note1: In the current period, financial assets include structured deposits that do not carry the characteristics of contract cash flow for principal and interest. The structured deposits have short maturities and are highly liquid, and net purchases and sales for the current period is stated in the current period. (The purchased amount is RMB 16,980,000,000.00 and the sales amount is RMB 15,038,730,804.00.)
Did significant changes occur for the Company's major asset measurement attributes during the reporting period?
□Yes √No
3. Limitation of asset rights as of the end of the reporting period
Item Book Value at the End of Period(RMB) Limitation Reason
Cash at bank 32,247.00 SF Holding's Letter of Guarantee
Cash at bank 592,676,085.96 Legal reserves in the Central Bank
Fixed assets 534,736,222.21 Long-term borrowing mortgage
Intangible assets 1,292,367,113.77 Long-term borrowing mortgage
Investment properties 496,985,596.74 Long-term borrowing mortgage
Total 2,916,797,265.68

S.F. Holding Co., Ltd. 2019 Semi-Annual Report
59
V. Analysis of Investments
1. General situation
√Applicable □Not applicable The Company is required to comply with the disclosure requirements of the “Guidelines of the Shenzhen Stock
Investment Amount During the Reporting Period (RMB)
Investment Amount During the same period of previous year (RMB) Change
9,243,454,423.59 5,596,644,897.07 65.16% Exchange for Industrial Information Disclosure No.9 –Listed Companies Engaged in the Express Delivery Services Business.”:
Investment Amount During the Reporting Period (RMB)
Office and Buildings 93,446,749.92
Land 299,994,256.45
Warehouse 262,012,638.96
Sorting center 432,052,604.01
Aircraft 902,953,344.52
Vehicle 142,648,423.61
Information technology equipment 289,260,664.05
Equity investments 5,948,878,786.99
Others 872,206,955.08
Total 9,243,454,423.59

S.F. Holding Co., Ltd. 2019 Semi-Annual Report
60
2. Significant Equity Investment Obtained During the Reporting Period
√ Applicable □Not applicable Unit: RMB10 thousands
Name of investee company
Principal business
Investment method
investment amount
Shareholdingratio
Capital source Partner Investment
period Product
type
Progress as of the balance
sheet date
Expectedreturn
Investmentprofit/lossfor current
period
Whether involved inlitigation
Date ofdisclosure Disclosure index
DHL SUPPLY CHAIN (HONG KONG) LIMITED and DHL Logistics (Beijing) Co., Ltd.
Supply chain business
Acquisition 550,000 100%
Self-ownedand self-raised funds
N/A N/A N/A completed N/A N/A
The subject matter of theacquisition does not involve major disputes, litigation or arbitration
February 19, 2019
Refer to the Announcement No.2018-094, No.2019-013 and No.2019-023 disclosed by the Company on CNINFO (http://www.cninfo.com.cn).
Total -- -- 550,000 -- -- -- -- -- -- -- -- -- -- --
3. Significant Non-Equity Investment Ongoing During the Reporting Period
□Applicable √ Not applicable 4. Financial Assets Measured at Fair Value
√Applicable □Not applicable Unit: RMB
Asset Type Initial Investment Cost
Changes in Fair Value Gains and Losses in Current
Period
Accumulated Fair Value Changes
Included in Equity
Amount of Purchase During
the Reporting Period
Amount of Sales During the Reporting
Period
Accumulated Investment
Income Closing Balance Capital source
Stock 756,424,305.71 - 31,339,063.00 - 76,308,098.62 7,595,857.55 792,918,258.45 Self-owned funds Financial derivatives - -335,072.23 - - - 233,341.47 383,103.74 Self-owned funds Others 5,429,254,608.57 330,542,683.78 -6,709,480.35 2,659,991,785.08 57,932,969.61 71,912,874.60 6,180,227,101.16 Self-owned funds Total 6,185,678,914.28 330,207,611.55 24,629,582.65 2,659,991,785.08 134,241,068.23 79,742,073.62 6,973,528,463.35 --

S.F. Holding Co., Ltd. 2019 Semi-Annual Report
61
5. Investments in Securities
√ Applicable □Not applicable
Unit: RMB
Security Type
Stock Code
Abbreviation of Security
Initial Investment
Accounting Measurement
Model
Book value at the beginning
of the reporting period
Gains and losses from changes in fair value during
the period
Accumulated fair value changes
included in equity
Purchase amount
during the reporting
period
Sales amount during the reporting
period
Gains and losses of the
reporting period
Book value at the end of the
reporting period
Accounting items
Capital source
Domestic and foreign stock
06166 China VAST 414,614,556.49 Fair value measurement 528,918,442.86 - -61,849,385.15 - - - 467,881,009.93
Investments in other equity instruments
Self-owned funds
Domestic and foreign stock
01810 Xiaomi Corporation 209,281,978.58 Fair value
measurement 157,200,330.90 - -35,559,796.11 - - - 121,888,164.58
Investments in other equity instruments
Self-owned funds
Domestic and foreign stock
01492 Zhongdi Dairy 111,150,770.64 Fair value measurement 49,004,561.41 - -925,435.39 - - - 48,165,333.94
Investments in other equity instruments
Self-owned funds
Domestic and foreign stock
000697 Ligeance Mineral - Fair value
measurement 58,929,974.64 - -3,933,070.35 - 54,996,904.29 - -
Investments in other equity instruments
Self-owned funds
Domestic and foreign stock
300771 Zhilai Technology 21,377,000.00 Fair value
measurement 21,377,000.00 - 133,606,750.00 - - - 154,983,750.00
Investments in other equity instruments
Self-owned funds
Other securities held at the end of the period - -- 13,715,336.78 - - - 21,311,194.33 7,595,857.55 - -- --
Total 756,424,305.71 -- 829,145,646.59 - 31,339,063.00 - 76,308,098.62 7,595,857.55 792,918,258.45 -- -- Disclosure Date of Securities Investment Approval Board Announcement October 27, 2017 Disclosure Date of Securities Investment Approval Shareholders Meeting Announcement (if any) December 1, 2017

S.F. Holding Co., Ltd. 2019 Semi-Annual Report
62
6. Investments in Derivatives
√ Applicable □Not applicable
Unit: RMB10 thousands
Counterparty
Related-party
relationship(Y/N)
Related-party transactions
(Y/N)
Type of derivatives
Initial investment
amount
Starting date
Ending date
Investment amount at
the beginning
of the reporting
period
Provision for
impairment(if any)
Investment amount at the end of
the reporting
period
Investment amount at the
end of the reporting
period to net assets of the Company
Gains/ (losses)
recognized during the reporting
period
Bank No No Interest Rate swap contracts 7,039.76 2016/07/25 2021/01/25 7,027.28 - 7,039.76 0.18% 23.33
Total 7,039.76 -- -- 7,027.28 - 7,039.76 0.18% 23.33Source of funds Self-owned fundsLawsuit if applicable N/ADisclosure Date of Derivatives Investment Approval Board Announcement(if any) January 4, 2019
Disclosure Date of Derivatives Investment Approval Shareholders Meeting Announcement (if any) N/A
Risk analysis and control measures for derivatives investment during the reporting period (including but not limited to market risk, liquidity risk, credit risk, operational risk, legal risk, etc.)
In order to contain interest rate risks and reduce additional cost caused by interest rate rises, the company used bank financial instruments to carry out foreign exchange derivatives transactions. The company has fully evaluated and controlled the foreign exchange derivatives investment and positions, as specified below: 1. Legal risks: The company's foreign exchange derivatives investment should comply with laws and regulations, and the rights and obligations between the company and banks should be clearly stipulated. Control measures: The company formulated the “Hedging Management System” and reviewed the contracts strictly , defined the rights and obligations clearly in the contracts, and strengthened the compliance inspection, so as to ensure the compliance with laws, regulations and the company's internal policies, the company 2. Operational risk: The operational risks might be caused by employee operation, systems, etc., which lead to losses in the foreign exchange derivatives. Control measures: The company established management systems to clarify the roles and responsibilities, approval processes and operation processes in the foreign exchange derivatives transactions, and established a relatively complete supervision mechanism to reduce operational risks effectively through risk control of operation processes, decision-making processes and transaction processes. 3. Market risk: The uncertainty of interest rate fluctuations in the foreign exchange market lead to relatively high market risks in the foreign exchange derivatives transactions. In the case where the interest rate trend deviates significantly from the company's foreign exchange hedging transactions, the company's cost of locking in interest rate may exceed the amount when it is not locked, leading to potential losses. Control measures: The company's foreign exchange derivatives tradings adheres to the principle of prudent and steady operation, and speculative transactions of foreign exchange derivatives are forbidden by internal policies. All foreign exchange derivatives transactions should be based on normal business operations, and the transaction amount should not exceed the demand of actual business. The company studied and judged the trend of exchange rate and interest rate, and locked the exchange rate and loan interest rate through contracts to prevent market risks effectively. Besides, the company recorded each transaction, check the records, and track the changes timely, properly arranged the delivery funds to prevent delivery default risk.
Changes in fair value or market price of invested derivatives during the reporting period (the specific methods ,relevant assumptions and parameters used in the analysis of the fair value should be disclosed)
The Company's analysis of the fair value of derivatives is based on the financial market fair value valuation report provided by the bank at month end. The gains from changes in fair value recognized by the Company during the reporting period were RMB -335,100.
Explanation of whether the accounting policies and accounting principles of the Company's derivatives are significantly changed compared with the previous reporting period during the reporting period
NO
Opinions of independent directors on the Company's derivatives investment and risk control
The independent directors believed that the company had established an internal control system for foreign exchange hedging and effective risk control measures in accordance with the requirements stipulated by relevant laws. Under the premise of complying with national laws and regulations and ensuring that the company's daily operation were not affected, the company used its own funds to carry out foreign exchange hedging in a timely manner, which was conducive to preventing interest rate and exchange rate risks, reducing the impact of interest rate fluctuations on the company, in line with the company ,the interests of all shareholders and was no harm to the company and all shareholders, especially the interests of minority shareholders.

S.F. Holding Co., Ltd. 2019 Semi-Annual Report
63
7. Use of Raised Funds
√ Applicable □Not applicable
(1) Overall use of Raised Funds
√ Applicable □Not applicable
Unit: RMB10 thousands
Total Raised Funds (Note 1) 796,851.70
Total Raised Funds invested in the current year 39,792.95
Accumulative Raised Funds invested (Note 2) 796,851.70
Total Raised Funds with usage altered in the reporting period 39,792.95
Accumulative Raised Funds with usage altered (Note 3) 372,982.30
Proportion of accumulative total Raised Funds with usage altered 46.81%
Description for overall utilisation of Raised Funds
As of June 30, 2019, all funds raised have been used for relevant projects with total proceeds amounting to RMB 7,968,517,000.
Proceeds used for Aviation Materials Purchasing and Flight Support Project totalled RMB2,636,220,200, that used for the Cold
Chain Vehicles and Temperature Control Equipment Purchasing Project totalled RMB292,008,800, that used for the Information
Service Platform Construction and the Next Generation Logistics Informatisation Technology R&D Project totalled
RMB3,846,502,100, and that used for the Transit Depot Construction Project totalled RMB1,193,785,900. The balance of
proceeds amounted to RMB2,972,900, all of which has been used to permanently replenish the Company's working capital.

S.F. Holding Co., Ltd. 2019 Semi-Annual Report
64
(2) Statement of committed investment projects of Raised Funds √ Applicable □Not applicable
Unit: RMB10 thousands
Committed investment projects and
allocation of over-raised funds
Whether
project has
been (or
partially)
altered
Total committed
investment
based on net
Raised Funds
Total investment
after alteration
(a)
Investment in
the current year
Accumulative
investment at
the end of the
period (b)
Investment
progress at the
end of the
period (%)
(d)=(b)/(a)
Date of asset ready
for intended use
Benefits
achieved
in the
current
year
Whether
expected
benefits
have been
achieved
Whether
feasibility of
project has
changed
significantly
Committed investment projects
1. Aviation material purchase and
flight support project Yes 268,622.08 263,622.02 - 263,622.02 100% - Note: 4 N/A No
1.1Aviation material purchase Yes 237,622.08 157,298.74 - 157,298.74 100% 2018/12/31 Note: 4 N/A No
1.2Recruitment of pilots Yes 31,000.00 27,554.51 - 27,554.51 100% 2018/12/31 Note: 4 N/A No
1.3Aircraft purchase and modification Yes 78,768.77 - 78,768.77 100% 2019/6/30 Note: 4 N/A No
2. Cold storage vehicles and
temperature control equipment
purchase
Yes 71,795.00 29,200.88 - 29,200.88 100% - Note: 5 N/A No
2.1Purchase of vehicles for cold chain
transport Yes 49,729.00 28,056.60 - 28,056.60 100% 2018/12/31 Note:5 N/A No
2.2Purchase of EPP temperature
control containers Yes 22,066.00 1,144.28 - 1,144.28 100% 2018/12/31 Note: 5 N/A No

S.F. Holding Co., Ltd. 2019 Semi-Annual Report
65
Committed investment projects and
allocation of over-raised funds
Whether
project has
been (or
partially)
altered
Total committed
investment
based on net
Raised Funds
Total investment
after alteration
(a)
Investment in
the current year
Accumulative
investment at
the end of the
period (b)
Investment
progress at the
end of the
period (%)
(d)=(b)/(a)
Date of asset ready
for intended use
Benefits
achieved
in the
current
year
Whether
expected
benefits
have been
achieved
Whether
feasibility of
project has
changed
significantly
3.Information service platform
construction and next-generation
logistics IT research and development
projects
Yes 111,918.00 384,650.21 39,792.95 384,650.21 100% 2019/6/30 Note: 6 N/A No
4.Distribution hub construction
projects Yes 329,882.88 119,378.59 - 119,378.59 100% - Note: 7 N/A No
4.1Zhengzhou SF E-commerce
Industrial Park project Yes 50,584.68 343.82 - 343.82 100% 2018/12/31 Note: 7 N/A No
4.2Changchun SF E-commerce
Industrial Park project Yes 61,945.51 22,264.73 - 22,264.73 100% 2019/5/31 Note: 7 N/A No
4.3Wuxi SF E-commerce Industrial
Park project Yes 41,834.10 22,192.87 - 22,192.87 100% 2019/6/30 Note: 7 N/A No
4.4Shanghai Shunheng Logistics Co.,
Ltd. new factory project Yes 50,634.05 18,816.19 - 18,816.19 100% 2018/8/31 Note: 7 N/A No
4.5SF Express Nantong District
Aviation Hub (phase 2) project` Yes 33,055.34 Project investment cancelled after changes
4.6Hefei smart sorting base Yes 26,427.29 31,958.78 - 31,958.78 100% 2019/6/30 Note: 7 N/A No

S.F. Holding Co., Ltd. 2019 Semi-Annual Report
66
Committed investment projects and
allocation of over-raised funds
Whether
project has
been (or
partially)
altered
Total committed
investment
based on net
Raised Funds
Total investment
after alteration
(a)
Investment in
the current year
Accumulative
investment at
the end of the
period (b)
Investment
progress at the
end of the
period (%)
(d)=(b)/(a)
Date of asset ready
for intended use
Benefits
achieved
in the
current
year
Whether
expected
benefits
have been
achieved
Whether
feasibility of
project has
changed
significantly
4.7SF E-commerce Industrial Yiwu
Integrated Service Center Yes 24,900.96 8,287.38 - 8,287.38 100% 2019/6/30 Note: 7 N/A No
4.8Ningbo Transshipping Center Yes 22,587.92 7,269.33 - 7,269.33 100% 2019/6/30 Note: 7 N/A No
4.9Wenzhou Ganglu E-commerce
Industrial Park project Yes 17,913.03 8,245.49 - 8,245.49 100% 2019/6/30 Note: 7 N/A No
Subtotal of committed investment
projects -- 782,217.96 796,851.70 39,792.95 796,851.70 -- -- - -- --
Investment of excess proceeds N/A
Total -- 782,217.96 796,851.70 39,792.95 796,851.70 -- -- - -- --
Status of and reason for planned progress or estimated income not achieved (of a
specific project) N/A
Significant changes in the feasibility of projects N/A
Amount, usage and use progress of over-raised Funds N/A
Change in implementation location of investment projects of Raised Funds N/A
Adjustment to implementation method of investment projects of Raised Funds N/A
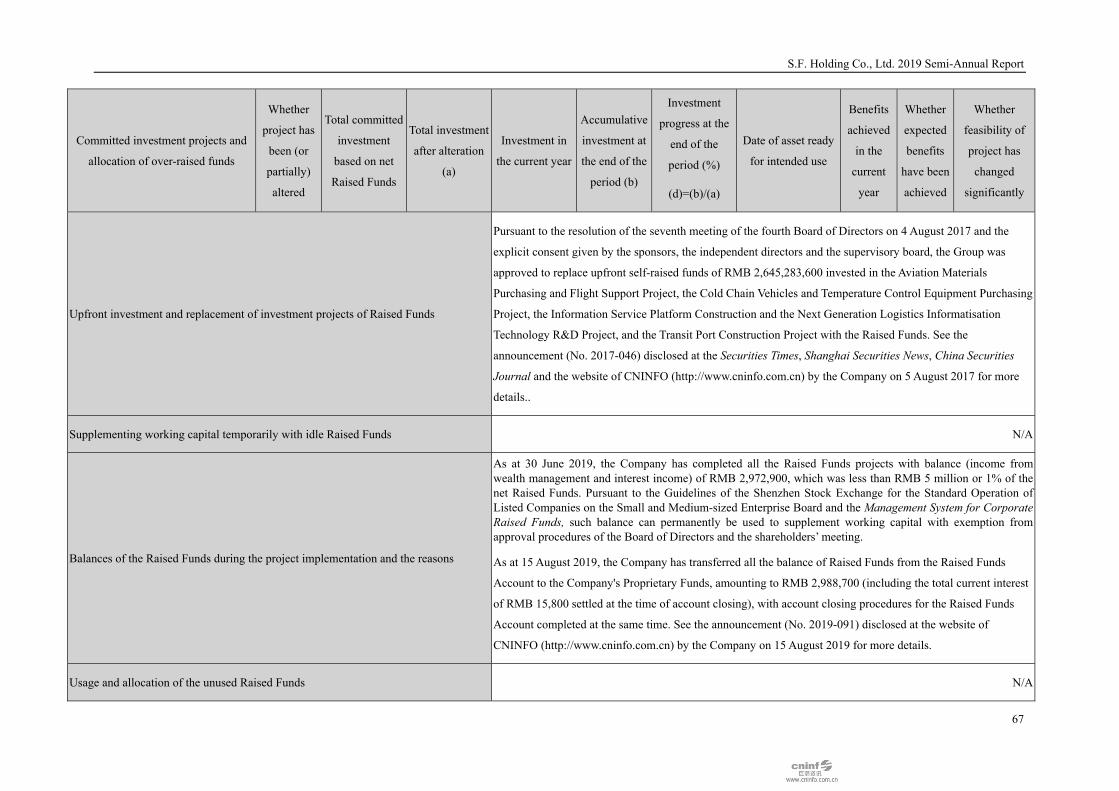
S.F. Holding Co., Ltd. 2019 Semi-Annual Report
67
Committed investment projects and
allocation of over-raised funds
Whether
project has
been (or
partially)
altered
Total committed
investment
based on net
Raised Funds
Total investment
after alteration
(a)
Investment in
the current year
Accumulative
investment at
the end of the
period (b)
Investment
progress at the
end of the
period (%)
(d)=(b)/(a)
Date of asset ready
for intended use
Benefits
achieved
in the
current
year
Whether
expected
benefits
have been
achieved
Whether
feasibility of
project has
changed
significantly
Upfront investment and replacement of investment projects of Raised Funds
Pursuant to the resolution of the seventh meeting of the fourth Board of Directors on 4 August 2017 and the
explicit consent given by the sponsors, the independent directors and the supervisory board, the Group was
approved to replace upfront self-raised funds of RMB 2,645,283,600 invested in the Aviation Materials
Purchasing and Flight Support Project, the Cold Chain Vehicles and Temperature Control Equipment Purchasing
Project, the Information Service Platform Construction and the Next Generation Logistics Informatisation
Technology R&D Project, and the Transit Port Construction Project with the Raised Funds. See the
announcement (No. 2017-046) disclosed at the Securities Times, Shanghai Securities News, China Securities
Journal and the website of CNINFO (http://www.cninfo.com.cn) by the Company on 5 August 2017 for more
details..
Supplementing working capital temporarily with idle Raised Funds N/A
Balances of the Raised Funds during the project implementation and the reasons
As at 30 June 2019, the Company has completed all the Raised Funds projects with balance (income from wealth management and interest income) of RMB 2,972,900, which was less than RMB 5 million or 1% of the net Raised Funds. Pursuant to the Guidelines of the Shenzhen Stock Exchange for the Standard Operation of Listed Companies on the Small and Medium-sized Enterprise Board and the Management System for Corporate Raised Funds, such balance can permanently be used to supplement working capital with exemption from approval procedures of the Board of Directors and the shareholders’ meeting.
As at 15 August 2019, the Company has transferred all the balance of Raised Funds from the Raised Funds
Account to the Company's Proprietary Funds, amounting to RMB 2,988,700 (including the total current interest
of RMB 15,800 settled at the time of account closing), with account closing procedures for the Raised Funds
Account completed at the same time. See the announcement (No. 2019-091) disclosed at the website of
CNINFO (http://www.cninfo.com.cn) by the Company on 15 August 2019 for more details.
Usage and allocation of the unused Raised Funds N/A

S.F. Holding Co., Ltd. 2019 Semi-Annual Report
68
Committed investment projects and
allocation of over-raised funds
Whether
project has
been (or
partially)
altered
Total committed
investment
based on net
Raised Funds
Total investment
after alteration
(a)
Investment in
the current year
Accumulative
investment at
the end of the
period (b)
Investment
progress at the
end of the
period (%)
(d)=(b)/(a)
Date of asset ready
for intended use
Benefits
achieved
in the
current
year
Whether
expected
benefits
have been
achieved
Whether
feasibility of
project has
changed
significantly
Defects and other problems in utilisation and disclosure of the Raised Funds N/A
(3) Statement of Altered Investment Projects of Raised Funds √ Applicable □Not applicable
Unit: RMB10 thousands
Project after alteration Project before alteration
Total Raised
Funds to be
invested to the
project after
alteration (a)
Actual
investment in
the current year
Actual
accumulative
investment (b)
Investment
progress
(%)
(c)=(b)/(a)
Date of asset
ready for
intended use
Benefits
achieved in
the current
year
Whether
expected
benefits have
been achieved
Whether
feasibility of
project has
changed
significantly
Aviation material purchase and
flight support project
- Aircraft purchase and
modification
Aviation material purchase and
flight support project
- Aviation material purchase
- Recruitment of pilots
78,768.77 - 78,768.77 100% 2019/6/30 Note: 4 N/A No
Information service platform
construction and next-generation
logistics IT research and
development projects
Cold storage vehicles and
temperature control equipment
purchase
Aviation material purchase and
384,650.21 39,792.95 384,650.21 100% 2019/6/30 Note:6 N/A No

S.F. Holding Co., Ltd. 2019 Semi-Annual Report
69
flight support project
Distribution hub construction
projects
Distribution hub construction
project – Hefei smart sorting base
project
Distribution hub construction
projects 31,958.78 - 31,958.78 100% 2019/6/30 Note: 7 N/A No
Total -- 495,377.76 39,792.95 495,377.76 -- -- -- -- --
Alteration reason, decision making progress and information disclosure (of a specific
project)
The Company altered some investment projects of the Raised Funds based on actual conditions.
Pursuant to the Proposal for Alteration of Some Investment Projects of the Raised Funds discussed at the
eighth meeting of the fourth Board of Directors and approved by the third interim shareholders’ meeting in
2017, the Company extracted RMB 837,688,300 from the Raised Funds invested in subprojects “Aviation
Materials Purchasing and Maintenance” and “Pilot Recruitment” and invested such funds to the new
subproject “Aircraft Purchasing and Modification”, with the total Raised Funds invested in “Aviation
Materials Purchasing and Flight Support Project” unchanged. Furthermore, with the total investment in
“Cold Chain Vehicles and Temperature Control Equipment Purchasing Project” and “Transit Port
Construction Project” unchanged, the Company adjusted the Raised Funds invested to each subproject.
RMB 2,329,392,600 extracted from the Raised Funds were invested into “Information Service Platform
Construction and the Next Generation Logistics Informatisation Technology R&D Project”. See
Announcement No. 2017-049, 2017-052 and No. 2017-059 for more details about the Company’s project
alteration.
Pursuant to the Proposal for Alteration of Certain Investment Projects of the Raised Funds approved at the
eighteenth meeting of the fourth Board of Directors and the first interim shareholders’ meeting in 2019, the
Company agreed to extract funds from the Raised Funds invested to subprojects “Transit Port Construction
Project” and “Aviation Materials Purchasing and Flight Support Project” with the total investment in both
projects unchanged. The Company extracted RMB 50,000,600 and RMB 201,591,500 from the Raised
Funds invested in subprojects “Aircraft Purchasing and Modification” and “Transit Port Construction
Project” respectively, totalling RMB 251,592,100, plus the accumulative income from wealth management

S.F. Holding Co., Ltd. 2019 Semi-Annual Report
70
and interest income amounting to RMB 146,337,400, a total amount of RMB 397,929,500 invested into the
“Information Service Platform Construction and the Next Generation Logistics Informatisation Technology
R&D Project”. See the announcements (No. 2019-001, 2019-008 and No. 2019-018) disclosed at the website
of CNINFO (http://www.cninfo.com.cn) by the Company on 4 January 2019 and 24 January 2019
respectively for more details about the Company’s project alteration.
As at 30 June 2019, the Raised Funds used by Aviation Materials Purchasing and Flight Support Project
accumulated RMB 2,636,220,200, that used by Cold Chain Vehicles and Temperature Control Equipment
Purchasing Project accumulated RMB 292,008,800, that used by Information Service Platform
Construction and the Next Generation Logistics Informatisation Technology R&D Project accumulated
RMB 3,846,502,100, and that used by Transit Port Construction Project accumulated RMB 1,193,785,900.
Status of and reason for planned progress or expected benefit has not been reached (by
project) N/A
Description of major changes in project feasibility after changes N/A

S.F. Holding Co., Ltd. 2019 Semi-Annual Report
71
(4)Statement of Fundraising projects
Overview of Fundraising projects Disclosure date Disclosure method
For more, please refer to “First Half 2019 Special Report on the Deposit Status and Actual Use of Funds Raised” August 28, 2019 http://www.cninfo.com.cn
Note1: The “Total Raised Funds“ include the net Raised Funds before alteration, amounting to RMB 7,822,179,600, and the
accumulative income from wealth management and interest income from the “Information Service Platform Construction and the Next Generation Logistics Informatisation Technology R&D Project” after alteration, amounting to RMB 146,337,400.
Note 2 “Accumulative Raised Funds invested” includes accumulative Raised Funds invested and upfront investment replaced after the reception of Raised Funds of RMB 2,645,283,600.
Note 3 “Total Raised Funds with usage altered” refers to the altered Raised Funds ready for investment calculated based on the last-tier subproject of Raised Funds with usage altered listed in the Annex 2.
Note 4 The Company’s business developed rapidly. Based on the Company’s future strategic plan, the original aircraft’s capacity cannot meet the requirements of business development any more. This project is aimed at improving the Company’s air transportation effectiveness and market competitiveness. The benefits achieved are not directly quantifiable.
Note 5 The project is aimed at improving the speed and quality of cold chain transportation and providing customers with sophisticated temperature control service. The benefits achieved are not directly quantifiable.
Note 6 The project is aimed at lay outing the next generation logistics informatisation technology in advance, improving the intelligent logistics capacity, supporting the development of future comprehensive logistics business, promoting the digitalisation, networking and marketisation of information, and backing the innovation and incubation of new businesses. The benefits achieved are not directly quantifiable.
Note 7 The project is aimed at further enhancing the processing capacity of the Company’s express backbone network as well as improving the operation effectiveness of the whole network. The benefits achieved are not directly quantifiable.
8. Major projects not involving fundraising
□Applicable √ Not applicable VI. Sale of Significant Assets and Equity
1. Sale of significant assets
□Applicable √ Not applicable The Company did not sell any significant assets during the reporting period. 2. Sale of significant equity
□Applicable √ Not applicable The Company did not sell any significant equity during the reporting period.

S.F. Holding Co., Ltd. 2019 Semi-Annual Report
72
VII. Analysis of Major Holdings and Participating Companies
√ Applicable □Not applicable Major subsidiaries and equity participation companies that affect the Company's net profit by more than 10%
Unit: RMB
Company name
Company Type
Primary Business
Registered Capital Total Assets Net Assets
Operating Income
Operating Profit
Net Profit
Shenzhen S.F. Taisen Holdings
(Group) Co., Ltd.
Subsidiary
Investments in industrial
businesses, Investment
consulting and other information
consulting,supply chain management,asset management,
capital management, investment
management, etc.
2 billion RMB
35,375,140,785.76 19,549,670,833.02 1,740,673,059.34 562,921,601.09 561,780,502.69
Acquisition and disposal of subsidiaries during the reporting period
√ Applicable □Not applicable
Company Name Acquisition or Disposal of
Subsidiaries During the Reporting Period
Impact on Overall Production Operations
and Performance Shanghai Fengpaida Supply Chain Co., Ltd. New establishment No major impact Shenzhen Lver Technology Co., Ltd. New establishment No major impact Shenzhen S.F.Zhongyuan Network Technology Co., Ltd. New establishment No major impact Shenzhen Yike Technology Co., Ltd. New establishment No major impact Hangzhou Xiaoshan Gonglaohan Business hotel Co., Ltd. Acquisition No major impact Qian'an deda beifeng logistics Co. LTD Acquisition No major impact Beijing fenglejia hotel management Co., LTD New establishment No major impact SF Pharmaceutical Supply Chain (Jilin) Co., Ltd. New establishment No major impact Shanghai Haosiju Supply Chain Management Co., Ltd. New establishment No major impact Shanghai Chengbai Technology Co., Ltd. New establishment No major impact Wenzhou Jietai Enterprise Management Co., Ltd. New establishment No major impact Huaian Fengtai Enterprise Management Co., Ltd. New establishment No major impact Quanzhou Fengyutai Enterprise Management Co., Ltd. New establishment No major impact Yiwu Fengyutai Enterprise Management Co., Ltd. New establishment No major impact Jiaxing Hongjie Enterprise Management Co., Ltd. New establishment No major impact S.F. Intra-city Holding Co., Ltd. New establishment No major impact Hengyang hongyue network co. LTD Acquisition No major impact Hengyang Wanwei Information Technology Co., Ltd. Acquisition No major impact DC(PaloAlto)Corporation Acquisition No major impact Exel Logistics (Weihai) CO.,Ltd New establishment No major impact Wuhan Jufeng Supply Chain Management Co., Ltd. New establishment No major impact Yangzhou Fengyutai Enterprise Management Co., Ltd. New establishment No major impact Shenzhen Fengchi Shuntong Information Technology Co., Ltd. New establishment No major impact
DHL Logistics (Beijing) Co., Ltd. Acquisition No major impact DHL Supply Chain (Hong Kong) Limited Acquisition No major impact Dun ho Logistics Zhuhai (Hong Kong) Limited Acquisition No major impact DHL Logistics (Zhuhai) Co., Ltd. Acquisition No major impact Shun Lok Supply Chain (HK) Limited Acquisition No major impact Shunhao Supply Chain Management (Wuhan) Co., Ltd. Acquisition No major impact DHL Logistics (Nanjing) Co., Ltd. Acquisition No major impact DHL Logistics (Shenzhen) Co., Ltd. Acquisition No major impact EXEL LOGISTICS CHINA CO.,LTD. Acquisition No major impact Exel Logistics (Chengdu) CO.,Ltd Acquisition No major impact DHL Logistics (China) CO.,Ltd Acquisition No major impact

S.F. Holding Co., Ltd. 2019 Semi-Annual Report
73
Company Name Acquisition or Disposal of
Subsidiaries During the Reporting Period
Impact on Overall Production Operations
and Performance Donggguan DHL Supply Chain Co.,Ltd Acquisition No major impact GREAT AFFLUENT GROUP LIMITED Acquisition No major impact HARMONIC JOY HOLDINGS LIMITED Acquisition No major impact Wuhan Shunheng Express Co., Ltd. New establishment No major impact Suzhou Fengyutai Enterprise Management Co., Ltd. New establishment No major impact Shenzhen Fenglian Technology Co., Ltd. New establishment No major impact Hefei Jietai Enterprise Management Co., Ltd. New establishment No major impact Shanghai Binxian Supply Chain Management Co., Ltd. New establishment No major impact Yunnan Shunzhu Xinfeng Express Co., Ltd. New establishment No major impact Xinjiang Shunxin Express Co., Ltd. New establishment No major impact Fenghao Supply Chain (Shenzhen) Co., Ltd. New establishment No major impact Shanghai Solution Plus Supply Chain Co., Ltd. New establishment No major impact WEALTHY SMART INTERNATIONAL HOLDINGS LIMITED Acquisition No major impact
JOVIAL BLISS GROUP LIMITED Acquisition No major impact TREND POWER INVESTMENTS LIMITED Acquisition No major impact Langfang S.F. Express Co., Ltd. New establishment No major impact SF Share Precision Information Technology (Shenzhen) Co., Ltd. New establishment No major impact
Xi'an SF Information Service Co., Ltd. New establishment No major impact Shenzhen Yijiayi Technology Co., Ltd. New establishment No major impact Guangdong Zhifan Technology Co., Ltd. New establishment No major impact SF LOGISTICS PRIVATE LIMITED New establishment No major impact Shanghai shunru Fenglai technology co., LTD New establishment No major impact Luoyang Fengnong Technology Co., Ltd. New establishment No major impact Hangzhou Shuangjie Supply Chain Co., Ltd. New establishment No major impact Hangzhou S.F.Intra-city Industrial Co., Ltd. New establishment No major impact Sichuan Fengnong Technology Co., Ltd. New establishment No major impact Suzhou hengding logistics co. LTD Acquisition No major impact SinoServices International Technologies Co., Ltd. Sale No major impact Shenzhen Fengyi Technology Co., Ltd. Sale No major impact SF Pharmaceutical Supply Chain Nanjing Co., Ltd. Sale No major impact Nanjing Sihai Pharmaceutical Co., Ltd. Sale No major impact Xiamen Jinchetou Information Technology Co., Ltd. Sale No major impact Shanghai Ruitexin Information Technology Co., Ltd. Sale No major impact SinoServices International Technologies Company Limited Sale No major impact SinoServices International Technologies (Singapore) Pte LTD Sale No major impact
Shanghai Haikuqiang Supply Chain Information Technology Co., Ltd. Sale No major impact
Shenzhen Jingliantong Information Technology Co., Ltd. Sale No major impact
VIII. Structured Entities Controlled by the Company
□Applicable √ Not applicable

S.F. Holding Co., Ltd. 2019 Semi-Annual Report
74
IX. Performance forecast for the first nine months of 2019
□Applicable √ Not applicable X. Possible risks and countermeasures
1. Market risks
Risks of macroeconomic fluctuations: The logistics industry plays an important fundamental role in the development of national economy while it is also significantly affected by macroeconomic conditions. In recent years, China's macroeconomy has experienced slowing growth as it underwent a period of economic structure transition, and the future development will remain rather complicated. Future fluctuation of the macroeconomy will have a certain impact on the overall development of China's logistics industry and the performance of SF Holding.
Market competition risks: Competition in China's express logistics industry has become increasingly fierce.
On the one hand, industry-leading express logistics enterprises continue to strive to expand their businesses and networks. On the other hand, E-commerce platform enterprises, social capitals and other external forces are creeping into the express logistics industry, further exacerbating market competition. If the Company cannot take active and effective measures to cope with the ever-changing market competition, it may face the risk of slowing business growth and declining market share.
Risks arising from change in new business patterns: In recent years, with the rapid development of
information technology, the impact of the Internet economy on all aspects of life has become increasingly obvious. In the express delivery industry, information platform-type enterprises have emerged. Through fast matching and effective management of information between supply and demand, such enterprises can quickly gather and utilize social capitals to deliver appropriate services for customers, which will have a certain impact on the traditional business model of the express delivery industry.
Risk response: In the face of complex and volatile potential market risks, the Company has established a
comprehensive risk management system for close monitoring and dedicated analyses of the macroeconomy, of industry development trends and market competition patterns. From these analyses, SF Holding plans and adjusts its strategic direction, business planning and work priority in a forward-looking manner so as to minimize the impact of changes in external market environment on the Company's business and future development. 2. Policy risks
Risks arising from changes in industry regulations and industrial policies: Operation of express delivery requires business licensing and is subject to regulation by laws, administrative rules and industry standards such as the Postal Law (《邮政法》), the Administrative Measures for Express Delivery Business Licensing (《快递业务经营许可管理办法》), the Administrative Measures for Express Delivery Market ( 《快递市场管理办法》), the Industry Standard for Express Delivery Services (《快递服务》行业标准) and the Rules for Guiding the Operation of Express Business ( 《快递业务操作指导规范》). In order to support the development of the express delivery industry, competent departments at various levels have successively introduced a number of industrial support and encouragement policies. However, should major changes in or adjustments to relevant laws, regulations or industrial policies occur in the future, they may have an impact on the development trend and market competition landscape of the express delivery industry, which may in turn affect the future business growth and performance of the Company.
Risks from relevant state policies on environmental protection, energy conservation and emission reduction:
Various types and models of motor vehicles are important components of transportation vehicles of express
delivery companies. With the intensifying state policies on environmental protection, energy conservation and emission reduction may lead to increased expenses in relevant aspects such as environmental protection, energy conservation and emission reduction incurred by express delivery companies, which may affect the future performance of the Company.

S.F. Holding Co., Ltd. 2019 Semi-Annual Report
75
Risk response: The Company has established research teams for state and local policies in all business units to conduct in-depth analysis on relevant policies introduced and scientific prediction of future policy directions and trends in the light of overall changes in external environment. Forward-looking plans are implemented and adjusted by fully capitalizing on favorable policies while avoiding policy risks, hence promoting business growth. 3. Business risks
Risks of possible rising costs: The traditional express delivery industry is a labor-intensive industry. There are relatively large demands for labor along various stages of operation such as collection, sorting, transportation and delivery. With decreasing rate of population growth in China, there are certain pressures on rising labor costs while investments in logistics infrastructures and other aspects are also increasing. If the Company cannot secure enough business volume or effectively control costs in the future, it will probably face challenges in its future performance growth.
Risk response: SF Holding has continued to increase investment in areas such as logistics framework
optimization and system component innovation, including in areas such as bringing the entire logistics process online by applying smart technologies to reduce manpower and offline operations, while upgrading service points and route planning and using scientific and technological means to enhance efficiency and reduce labor costs, hence leading transformation of the express delivery industry from a labor-intensive to a technology intensive industry.
Risks from fuel price fluctuation: Transportation cost is one of the major costs of the express delivery
industry, and fuel cost is a component of transportation cost. Fluctuation of fuel price will have a certain impact on the profitability of express delivery companies. If the fuel price rises significantly in the future, the Company will experience pressure of increased costs. Generally speaking, however, fuel costs accounted for only 1.90% of revenue in the first half of 2019, a ratio which is not high. Therefore, the impact of fuel price fluctuation on operating costs is relatively limited. It is estimated that if fuel price fluctuates by +/- 5%, cost of revenue may increase or decrease by RMB0.95 million for the current year, which will either increase or decrease net profit attributable to the parent company by a maximum of RMB71 million.
Risk response: The Company will further optimise layout of service points, enhance scientific route
planning and loading rate of operating routes, and increase resource use efficiency to reduce the risk of fuel price fluctuations. Further, the Company will strengthen promotion for use of new energy vehicles to reduce the risk of fuel price fluctuations to a certain extent. Meanwhile, the Company has matured operation and cost monitoring mechanisms. When costs fluctuate significantly, operation plans and fuel cost control measures will be dynamically adjusted to reduce the negative impact of fuel cost fluctuation on the Company. 4. Exchange rate fluctuation risks
The Company currently offers express delivery services in countries such as the U.S., Japan, Korea, and Singapore and provides B2C and E-commerce delivery services in many countries and regions. In the future, as SF Holding's international business grows, the proportion of business denominated in foreign currencies will gradually increase. Given the uncertainties in the international financial environment and fluctuations of the RMB exchange rate, foreign currency assets and liabilities as well as future foreign currency transactions of the Company will be at risk of exchange rate fluctuation, which may have certain impacts on the reporting and profitability of the Company.

S.F. Holding Co., Ltd. 2019 Semi-Annual Report
76
Risk response: The Company's foreign exchange transactions are mainly based on actual needs of cross-border foreign currency businesses. To avoid and prevent risks of exchange rate and interest rate fluctuations and better manage its foreign currency positions, the Company has established the Management System for Business Hedging (《套期保值业务管理制度》) to enable centralized management of foreign currency positions by deciding expenditure based on revenue to achieve natural hedging where possible. To avoid exchange rate or interest rate risks, the Company timely monitors exchange rate and interest rate fluctuations and selects hedging products with low default risks and controllable risks so as to lock in costs of exchange rate and interest rate. Meanwhile, the Company will also strengthen research and analysis of exchange rate and interest rate so that it can be alerted of changes in the international market in real time and take countermeasures on early warning signals. The Company conducts foreign exchange hedging business only with large and established commercial banks which follow the principles of legality, prudence, safety and effectiveness. All foreign exchange hedging transactions are based on normal production and operation with support of specific business operation. The Company does not trade for speculation, and operates in strict accordance within authorized operations to ensure effective implementation and reduce the impact of exchange rate risks on the Company's operations as well as profit and loss. 5. Information system risk
Information system risk: To cope with our diversified development of, the complex and diverse needs of customers, and the strategic direction of technology-led business expansion to enhance market position, the Company has built and applied various information systems and technologies. Rapid development of the industry and changing market also pose challenge of rapid change in technology and services to the construction of core business systems of the Company. With the wide variety and rapid replacement of professional technologies in the Company along with emerging new technologies, changes in information technology and future business requirements may cause certain information system risks. Meanwhile, despite the series of information security control mechanisms established for the large amount of data accumulated for years by the Company, there still exists certain human or system caused information security risks.
Risk Responses: The Company has formulated comprehensive response measure for information system
risks. On the one hand, the Company continues to carry out operation and optimization of the ISO27001 information security management system, and has obtained certification after the on-site assessment by the authority. The Company implements information security control and protection in all aspects according to established policies and strategies for information security, and continuously updates all procedures and systems for information security. It continuously strengthens risk awareness of staff and trainings for staff operation standards, develop internal information circulation guidelines, implement rules of strong control over sensitive information, avoid unintentional violations, and construct monitoring and early warning and disposal systems for abnormal behaviors, so as to eliminate information system security risks in their infancy. Meanwhile, according to requirements of regulatory authorities, the Company has engaged in and passed the testing and evaluation for security classification protection of information system. Based on high standards of technology protection requirements, it conduct continuous and stable security intervention in the business system construction phase to strengthen the ability of the client's service products and business systems themselves against anti-security attacks, and enhance the capability of the IT infrastructures to discover and defend against cybersecurity attacks during operation of the information system. On the other hand, the Company has established a more comprehensive system for prevention and control of information risks, formulated standard processes such as the Major Event Management Process System for IT System (《IT系统重大事件管理流程制度》) and the Management Guidelines for Emergency Plan Formulation and Implementation of IT System (《IT系统应急预案制定与执行管理指引》) to implement closed-loop risk prevention and control in terms of pre-warning, in-process control and post-recording. Additionally, the Company has actively cooperated with the National Development and Reform Commission, the State General Administration of Posts and all levels of public security departments to combat behaviours such as black production and speculation; has actively participated in the formulation and review of various information security standards of the National Information Security Standards Committee, pilot work for implementation of policies; has regularly held security summits and security salons to facilitate information sharing with industry leaders and industry elites; and has established alliance partnership and cooperation with information security teams of well-known Internet and e-commerce companies for the joint construction of a safe and orderly Cyberspace.

S.F. Holding Co., Ltd. 2019 Semi-Annual Report
77
Chapter 5 Significant Events
I. Annual general meeting of shareholders and extraordinary general meeting of shareholders held during the period
1. Shareholder meetings held during the reporting period
Meeting Meeting
Type Investor
Participation % Date
Convened Disclosure
Date Disclosure Index
First Extraordinary General Meeting of Shareholders of 2019
Extraordinary General Meeting 84.59% January
23, 2019 January 24, 2019
“Resolutions of the First Extraordinary General Meeting of 2019” (2019-018)(http://www.cninfo.com.cn)
2018 Annual General Meeting
Annual General Meeting 74.29% April 9,
2019 April 10, 2019
“2018 Annual General Meeting Resolutions” (2019-057)(http://www.cninfo.com.cn)
Second Extraordinary General Meeting of Shareholders of 2019
Extraordinary General Meeting 75.79% May 9,
2019 May 10, 2019
“Resolutions of the Second Extraordinary General Meeting of 2019” (2019-070)(http://www.cninfo.com.cn)
2. Extraordinary general meetings convened at the request of preferred stockholders whose voting rights
have been restored
□Applicable √ Not applicable II. Profit distribution or increase of share capital from equity reserves during the reporting
period
□Applicable √ Not applicable The Company does not plan to issue cash or equity dividends, nor to convert equity reserves into share capital.
III. Commitments made by the Company's actual controllers, shareholders, related parties, purchasers, and others that were fulfilled during the reporting period or were not fulfilled and exceed the time limit as of the end of the reporting period
□Applicable √ Not applicable There were no such situations during the reporting period. IV. Appointment and dismissal of accounting firms
Is the semi-annual financial report audited? □Yes √ No The Company's semi-annual financial report has not been audited

S.F. Holding Co., Ltd. 2019 Semi-Annual Report
78
V. Explanations provided by the Board of Directors, the Supervisory Committee, and the independent directors regarding the “non-standard audit report” issued by the auditor for the reporting period
□Applicable √ Not applicable VI. Explanations provided by the Board of Directors regarding the “non-standard audit
report” issued by the auditor for the last year
□Applicable √ Not applicable VII. Bankruptcy and Reorganization
□Applicable √ Not applicable There was no such situation for the Company during the reporting period.

S.F. Holding Co., Ltd. 2019 Semi-Annual Report
79
VIII. Significant lawsuit or arbitration
√Applicable □Not applicable
Situation overview of lawsuit (arbitration)
Lawsuitamount
(10 thousands
RMB)
Provisions Progress of lawsuit
(arbitration)
Results and effects of lawsuit
(arbitration)
Executionstatus ofjudgmentof lawsuit
(arbitration)
Disclosuredate Disclosure index
According to Shenzhen Glorint Factoring Co., Ltd. (the plaintiff in this case, hereinafter referred to as“Shenzhen Glorint”), the “Indictment”: On October 11, 2014, Shenzhen Glorint and Hubei Xingyu Garment Co., Ltd. (hereinafter referred to as “Hubei Xingyu”) signed the “SDIC Factoring BusinessContract,” which stipulated that Shenzhen Glorint will providefactoring financing to Hubei Xingyu, and Hubei Xingyu shall also carry out a premium repurchase on time according to the terms of the contract.Fucheng Investment Holding Group Co.,Ltd. (defendant II in this case,hereinafter referred to as “Fucheng Investment”), Zeng Shixiang (defendant III in this case), Zeng Cheng (defendant IV in this case), and JiangBin (defendant V in this case) shall provide guarantees for thiscontract. In May 2014 and January 2015, S.F. Express Co., Ltd. (defendant VI in this case, hereinafter referred to as “S.F. Express “), Shenzhen SF Supply Chain Co., Ltd. (defendant VII in this case, hereinafter referred to as “SF Supply Chain”) signed an apparel purchase contract with Hubei Xingyu respectively. The totalamount of the contract was RMB18,099,519. On January 30, 2015, Hubei Xingyu and Shenzhen Glorint signed the Supplementary Agreement (I) of the SDIC Factoring Business Contract, which stipulated that Hubei Xingyu shall transfer a total of RMB18,099,519 accounts receivableto Shenzhen Glorint, based on the accounts receivable in the above-mentioned apparel purchase contract with S.F. Express and SF Supply Chain. In view of the fact that Hubei Xingyu did not fulfill the premium repurchase of factoringfinancing in accordance with the stipulated SDIC Factoring Business Contract, S.F. Express and SF Supply Chain did not pay RMB18,099,519 for Shenzhen Glorint. On September 1, 2015, Shenzhen Glorint filed a lawsuit with the Futian DistrictPeople’s Court and requested a decree:(1) S.F. Express and SF
1,859.95 No
On June 18, 2019, the Futian District People's Court made a first-instance judgment. As of the disclosure date of this report, the plaintiff Shenzhen Glorint has filed an appeal and this lawsuit has entered the second instance procedure.
The judgment of the court of first instance is as follows: 1. SF Supply Chain should pay the plaintiff RMB 3,289,100 within 10 days after the judgment takes effect. 2. Hubei Xingyu, Fucheng Investment should pay the plaintiff a legal fee of RMB 500,000 within 10 days after the judgment has taken effect. 3. Other claims of the plaintiff were dismissed. The court fee was RMB133,397, which should be borne by the plaintiff Shenzhen Glorint as to RMB95,284, and SF Supply Chain as to RMB33,113. RMB 5,000 of the fee should be jointly born by Hubei Xingyu and Fucheng Investment; preservation fee of 5,000 yuan should be borne by SF Supply Chain. As of the
N/A December 13,2016
Main Assets Replacement and Issuance of Shares to Purchase Assets and Raise Matching Funds and Related-party Transaction Report (Revised Draft) at http://www.cninfo.com.cn

S.F. Holding Co., Ltd. 2019 Semi-Annual Report
80
Situation overview of lawsuit (arbitration)
Lawsuitamount
(10 thousands
RMB)
Provisions Progress of lawsuit
(arbitration)
Results and effects of lawsuit
(arbitration)
Executionstatus ofjudgmentof lawsuit
(arbitration)
Disclosuredate Disclosure index
Supply Chain should pay 18,099,519 RMB to Shenzhen Glorint. (2) Hubei Xingyu, Fucheng Investment, Zeng Shixiang, Zeng Cheng, Jiang Bin, S.F. Express, and SF Supply Chain will be jointly and severally liable for the aforementioned payment. (3) The defendants in this case should bear the legal fees, litigation fees, and all other litigation fees in this case. On July 19, 2016, Shenzhen Glorint applied to the Futian District People’s Court to withdraw the lawsuit against the defendants Zeng Shixiang, Zeng Cheng, and Jiang Bin. On April 20, 2017, Futian District People’s Court ruled that the case was transferred to the jurisdiction of the Yuting District People’s Court, Yichang City, where the Hubei Xingyu Bankruptcy case was filed.Shenzhen Glorint rejected thefirst-instance ruling and appealed to Shenzhen Intermediate People’s Court. On July 10, 2017, Shenzhen Intermediate People’s Court ruled to revoke the decision of the Futian District People’s Court and the case was under the jurisdiction of the Futian District People’s Court. On October 23, 2017, the Futuan District People’s court held its second hearing. The bankruptcy administrator of Hubei Xingyu,Yichang Xinli Bankruptcy and Liquidation Office Co., Ltd. engaged lawyers to participate in the trial.
disclosure date of this report, the plaintiff Shenzhen Glorint has filed an appeal and this lawsuit has entered the second instance procedure. This case is a dispute arising from the payment of contract payment. The subject matter of the lawsuit is the Company's payable for the contract, and the amount is small. The results of these cases will not be materially adverse to the Company's financial status and continuing operations.
As of June 30, 2019, in addition to the above legal case, other legal proceedings of the listed Company and its subsidiaries were as follows: 1. The total amount involved in legal cases resolved during the reporting period was RMB130.55 million. 2. Cases not yet resolved during the reporting period include: Cases involving the Company and its subsidiaries as defendants amounted to RMB114.15 million, accounting for 0.31 % of audited net assets attributable to shareholders of the parent Company at the end of 2018. The above-mentioned litigation matters include a number of independent traffic accident cases and transportation claims with small amounts involved. The Company and its subsidiaries have already purchased commercial insurance for operating vehicles, transportation and other business activities. Based on the historical experience, the insurance purchased can basically cover the losses caused by the case. Cases involving the Company and its subsidiaries as plaintiffs amounted to RMB415.55 million, accounting for 1.14% of audited net assets attributable to shareholders of the parent Company at the end of 2018. The described legal proceedings will not have a material adverse effect on the Company's financial status and ability to continue operations.

S.F. Holding Co., Ltd. 2019 Semi-Annual Report
81
IX. Questioning by the Media
□Applicable √ Not applicable The company did not experience widespread media questioning during the reporting period. X. Punishment and rectification
□Applicable √ Not applicable There was no such situation during the reporting period. XI. Integrity of the Company, its controlling shareholders, and actual controller
□Applicable √ Not applicable XII. Execution of stock incentive plan, ESOP, or other employee incentives
√ Applicable □Not applicable 1. During the reporting period, the unlocking conditions for the first post lock-up period under the 2017 Restricted Stock Incentive Plan of the Company was fulfilled. On January 3, 2019, the Company convened the 18th meeting of the 4th session of the Board at which the “Resolution regarding the fulfillment of unlocking conditions for the first post lock-up period under the 2017 Restricted Stock Incentive Plan” was considered and approved, and the Company was authorised to unlock the sales restriction on a total of 1,113,173 restricted shares held by 703 participants who have fulfilled the unlocking conditions. On January 11, 2019, these shares which could be released of the sales restriction (“unlocked restricted shares”) were listed and available for trading. 2. During the reporting period, the exercise conditions for the first exercise period under the 2017 Share Appreciation Rights Incentive Plan of the Company were fulfilled. On January 3, 2019, the Company convened the 18th meeting of the 4th session of the Board at which the “Resolution regarding the Cancellation of Certain Share Appreciation Rights” and the “Resolution regarding Fulfillment of the Exercise Condition for the First Exercise Period under the 2017 Share Appreciation Rights Incentive Plan” were considered and approved. Accordingly, the Company was authorised to cancel all the 6,400 share appreciation rights held by 3 incentive participants who ceased to be eligible for the incentive due to their resignation, and to handle the exercise of rights held by 17 eligible incentive participants. 3. At the 18th meeting of the 4th session of the Board and the 2019 first extraordinary general meeting convened by the Company on January 3, 2019 and January 23, 2019 respectively, the “Resolution regarding the Repurchase and Cancellation of Certain Restricted Shares” was considered and approved. Accordingly, the Company was authorised to repurchase and cancel a total of 293,308 restricted shares held by 65 incentive participants who ceased to be eligible for the incentive under the 2017 Restricted Stock Incentive Plan due to their resignation, at a repurchase price of RMB29.529 per share; and the Company was authorised to repurchase and cancel a total of 147,278 restricted shares held by 34 incentive participants who ceased to be eligible for the incentive under the 2018 Restricted Stock Incentive Plan due to their resignation, at the repurchase price of RMB24.511 per share. The total number of restricted shares repurchased for cancellation was 440,586 shares. As of March 13, 2019, the Company has completed the repurchase and cancellation of the aforesaid restricted shares, thus the share capital of the Company was reduced from 4,418,767,258 shares to 4,418,326,672 shares.

S.F. Holding Co., Ltd. 2019 Semi-Annual Report
82
4. At the 20th meeting of the 4th session of the Board and the 2018 annual general meeting convened by the Company on March 14, 2019 and April 9, 2019 respectively, the “Resolution regarding the Repurchase and Cancellation of Certain Restricted Shares” was considered and approved. Accordingly, the Company was authorised to repurchase and cancel a total of 1,113,271 restricted shares held by 703 incentive participants who ceased to be eligible for the incentive due to failure of the Company to meet the performance assessment requirement for the second post lock-up period, at the repurchase price of RMB29.613 per share; and the Company was authorised to repurchase and cancel a total of 2,628,136 restricted shares held by 1,105 incentive participants who failed to fulfil the unlocking conditions due to failure of the Company to meet the performance assessment requirement for the first post lock-up period, and by 37 incentive participants who ceased to be eligible for the incentive under the 2018 Restricted Stock Incentive Plan due to their resignation, at a repurchase price of RMB24.581 per share. The total number of restricted shares repurchased for cancellation was 3,741,407 shares. Upon completion of the repurchase and cancellation, the total share capital of the Company will be reduced from 4,418,326,672 shares to 4,414,585,265 shares.
As the Company has implemented the 2018 dividend distribution plan prior to implementing the repurchase and cancellation of restricted shares, according to the authorization of the Board, the management of the Company adjusted the repurchase prices of the aforesaid repurchases based on relevant provisions. The repurchase price under the 2017 Restricted Stock Incentive Plan was adjusted from RMB29.613 per share to RMB29.399 per share, while that under the 2018 Restricted Stock Incentive Plan was adjusted from RMB24.581 per share to RMB24.369 per share. As of June 12, 2019, the Company has completed the repurchase and cancellation of the aforesaid restricted shares.
5. At the 20th meeting of the 4th session of the Board convened by the Company on March 14, 2019, the “Resolution on the Cancellation of Certain Share Appreciation Rights” was considered and approved. Accordingly, the Company was authorised to cancel a total of 26,500 share appreciation rights held by 17 incentive participants who ceased to have exercise qualification due to failure of the Company to meet the performance assessment requirement for the second exercise period under the 2017 Share Appreciation Rights Incentive Plan; and the Company was authorised to cancel a total of 80,825 share appreciation rights held by 29 incentive participants who ceased to be eligible for the incentive due to failure of the Company to meet the performance assessment requirement for the first exercise period, and by 5 incentive participants who ceased to be eligible for the incentive under the 2018 Share Appreciation Rights Incentive Plan due to their resignation.

S.F. Holding Co., Ltd. 2019 Semi-Annual Report
83
Details of the Company’s stock incentive plans during the reporting period have been disclosed on http://www.cninfo.com.cn by the Company. A disclosure index is as follows:
Announcement Disclosure Date Disclosure Website Announcement on Repurchase and Cancellation of Certain Restricted Shares (2019-003)
January 4, 2019 http://www.cninfo.com.cn
Announcement on Fulfillment of the Exercise Condition for the First Exercise Period under the 2017 Share Appreciation Rights Incentive Plan and the Cancellation of Certain Share Appreciation Rights (2019-004)
January 4, 2019 http://www.cninfo.com.cn
Announcement on Fulfillment of the Unlocking conditions for the First Post Lock-up Period under the 2017 Restricted Stock Incentive Plan (2019-005)
January 4, 2019 http://www.cninfo.com.cn
Announcement on the Listing and available for Trading of Unlocked Restricted Shares for the First Post Lock-up Period under the 2017 Restricted Stock Incentive Plan (2019-014)
January 10, 2019 http://www.cninfo.com.cn
Announcement on Capital Reduction due to Repurchase and Cancellation of Certain Restricted Shares (2019-019)
January 25, 2019 http://www.cninfo.com.cn
Announcement on Completion of Repurchase and Cancellation of Certain Restricted Shares (2019-033)
March 13, 2019 http://www.cninfo.com.cn
Announcement on Repurchase and Cancellation of Certain Restricted Shares (2019-043)
March 16, 2019 http://www.cninfo.com.cn
Announcement on Cancellation of Certain Share Appreciation Rights (2019-044)
March 16, 2019 http://www.cninfo.com.cn
Announcement on Capital Reduction due to Repurchase and Cancellation of Certain Restricted Shares (2019-058)
April 10, 2019 http://www.cninfo.com.cn
Announcement on Adjustment to Repurchase Price for the Repurchase and Cancellation of Restricted Shares by the Company due to Dividend Distribution (2019-062)
April 19, 2019 http://www.cninfo.com.cn
Announcement on Completion of Repurchase and Cancellation of Certain Restricted Shares (2019-074)
June 12, 2019 http://www.cninfo.com.cn

S.F. Holding Co., Ltd. 2019 Semi-Annual Report
84
XIII. Significant related-party transactions
1. Related-party transactions relevant to routine operations
√ Applicable □Not applicable
Related Party RelationshipType of
related-party transaction
Details of related-party transaction
Pricing principle
of the related-party transaction
Transaction price
Transactionamount
(10 thousands
RMB)
Proportionof same
category of transactions
Approvedtransaction
quota (10
Thousands RMB)
Was theapproved
quota exceeded?
Related-partytransaction settlement
method
SimilarMarket price
Disclosure date Disclosure index
Mingde Holding and its subsidiaries
Controlling shareholder of the Company
Provide services to related parties
Courier service, communication service, technology development service, etc.
Fair pricing based on market prices in accordance with the principle of independent transactions
Contract price 7,910.04 0.16% 27,000 No
Settlement based on the settlement period and terms in the contract
N/A January 4, 2019
Announcement on the “Proposal on Estimated Daily Related-party Transaction Amount in 2019” disclosed at CNINFO (Announcement No. 2019-011) (http://www.cninfo.com.cn)
M China Management Limited and its subsidiaries and its franchisees
A director ofThe Companyserves as a director of the parent company of M China Management Limited
Provide services to related parties
Cold-chain transportation and warehousing services
Fair pricing based on market prices in accordance with the principle of independent transactions
Contract price 55,235.82 1.10% 130,00
0 No
Settlement based on the settlement period and terms in the contract
N/A January 4, 2019
Announcement on the “Proposal on Estimated Daily Related-party Transaction Amount in 2019” disclosed at CNINFO (Announcement No. 2019-011) (http://www.cninfo.com.cn)
China Pacific Insurance (Group) Co., Ltd. and its subsidiaries
An independent director of the Companyserves as an independent director of China PacificInsurance (Group) Co., Ltd.
Provide services to related parties
Courier service, technology development service.
Fair pricing based on market prices in accordance with the principle of independent transactions
Contract price 1,840.67 0.04% 7,000 No
Settlement based on the settlement period and terms in the contract
N/A January 4, 2019
Announcement on the “Proposal on Estimated Daily Related-party Transaction Amount in 2019” disclosed at CNINFO (Announcement No. 2019-011) (http://www.cninfo.com.cn)

S.F. Holding Co., Ltd. 2019 Semi-Annual Report
85
Related Party RelationshipType of
related-party transaction
Details of related-party transaction
Pricing principle
of the related-party transaction
Transaction price
Transactionamount
(10 thousands
RMB)
Proportionof same
category of transactions
Approvedtransaction
quota (10
Thousands RMB)
Was theapproved
quota exceeded?
Related-partytransaction settlement
method
SimilarMarket price
Disclosure date Disclosure index
Ping An Insurance (Group) Company of China, Ltd. and its subsidiaries
An independent directors of the Companyserves as an independent director of Ping An Insurance (Group) Company of China, Ltd.
Provide services to related parties
Courier service
Fair pricing based on market prices in accordance with the principle of independent transactions
Contract price 4,922.69 1.10% 11,000 No
Settlement based on the settlement period and terms in the contract
N/A January 4, 2019
Announcement on the “Proposal on Estimated Daily Related-party Transaction Amount in 2019” disclosed at CNINFO (Announcement No. 2019-011) (http://www.cninfo.com.cn)
Mingde Holding and its subsidiaries
Controlling shareholder of the Company
Receive services from related parties
Express deliveryagent service fees, etc.
Fair pricing based on market prices in accordance with the principle of independent transactions
Contract price 5,618.52 0.14% 18,000 No
Settlement based on the settlement period and terms in the contract
N/A January 4, 2019
Announcement on the “Proposal on Estimated Daily Related-party Transaction Amount in 2019” disclosed at CNINFO (Announcement No. 2019-011) (http://www.cninfo.com.cn)
China Pacific Insurance (Group) Co., Ltd. and its subsidiaries
An independent director of the Companyserves as an independent director of China PacificInsurance (Group) Co., Ltd.
Receive services from related parties
Insurance premium
Fair pricing based on market prices in accordance with the principle of independent transactions
Contract price 4,506.21 0.11% 13,000 No
Settlement based on the settlement period and terms in the contract
N/A January 4, 2019
Announcement on the “Proposal on Estimated Daily Related-party Transaction Amount in 2019” disclosed at CNINFO (Announcement No. 2019-011) (http://www.cninfo.com.cn)
CR-SF International Express Co., Ltd.
A senior manager of the Company serves as a director of CR-SF International Express Co., Ltd.
Receive services from related parties
Transportation services
Fair pricing based on market prices in accordance with the principle of independent transactions
Contract price 8,077.80 0.20% 35,000 No
Settlement based on the settlement period and terms in the contract
N/A January 4, 2019
Announcement on the “Proposal on Estimated Daily Related-party Transaction Amount in 2019” disclosed at CNINFO (Announcement No. 2019-011) (http://www.cninfo.com.cn)

S.F. Holding Co., Ltd. 2019 Semi-Annual Report
86
Related Party RelationshipType of
related-party transaction
Details of related-party transaction
Pricing principle
of the related-party transaction
Transaction price
Transactionamount
(10 thousands
RMB)
Proportionof same
category of transactions
Approvedtransaction
quota (10
Thousands RMB)
Was theapproved
quota exceeded?
Related-partytransaction settlement
method
SimilarMarket price
Disclosure date Disclosure index
Mingde Holding and its subsidiaries
Controlling shareholder of the Company
Purchase of materials from related parties
Purchase of materials
Fair pricing based on market prices in accordance with the principle of independent transactions
Contract price 4,177.27 0.10% 15,000 No
Settlement based on the settlement period and terms in the contract
N/A January 4, 2019
Announcement on the “Proposal on Estimated Daily Related-party Transaction Amount in 2019” disclosed at CNINFO (Announcement No. 2019-011) (http://www.cninfo.com.cn)
Zhejiang Galaxy Technology Company Limited
A director ofthe Company serves as a director of Zhejiang Galaxy Technology Company Limited
Purchase of assets from related parties
Purchase of assets
Fair pricing based on market prices in accordance with the principle of independent transactions
Contract price - - 40,000 No
Settlement based on the settlement period and terms in the contract
N/A January 4, 2019
Announcement on the “Proposal on Estimated Daily Related-party Transaction Amount in 2019” disclosed at CNINFO (Announcement No. 2019-011) (http://www.cninfo.com.cn)
Total -- -- 92,289.02 -- 296,000
-- -- -- -- --
Details of large amount of sales returns N/A
Actual performance in the reporting period versus predicted total amount of daily related-party transactions, by types (if any)
The Company's eighteenth meeting of the fourth Board of Directors on January 3, 2019 and the First Extraordinary General Meeting of Shareholders of 2019 on January 23, 2019 reviewed and approved the “Proposal on Estimated Daily Related-party Transaction Amount in 2018.” The amount of the aforementioned related-party transactions did not exceed the approved amount.
Reason for significant difference between the transaction price and the market price N/A

S.F. Holding Co., Ltd. 2019 Semi-Annual Report
87
2. Related-party transactions relevant to purchases and sales of assets
□Applicable √ Not applicable No significant related-party transactions relevant to purchases and sales of assets during the reporting period. 3. Related-party transactions with joint investments
□Applicable √ Not applicable No significant related-party transactions with joint investments during the reporting period. 4. Credits and liabilities with related parties
√ Applicable □Not applicable Were there non-operating credits and liabilities with related parties? □Yes √ No No such cases in the reporting period. 5. Other significant related-party transactions
□Applicable √ Not applicable XIV. Significant contracts and their execution
1. Trusteeships, Contracts, and Leases
(1) Trusteeships
□Applicable √ Not applicable No significant trusteeships in the reporting period. (2) Contracts
□Applicable √ Not applicable No significant contracts in the reporting period. (3) Leases
□Applicable √ Not applicable No significant leases in the reporting period.

S.F. Holding Co., Ltd. 2019 Semi-Annual Report
88
2. Significant guarantees
√Applicable □Not applicable Guarantees provided by the Company
Unit: RMB 10 thousands
The listed Company's guarantees to subsidiaries
Guarantee party Disclosure date
of Quota announcement
Amount of guaranteed
Quota approved
Actual date of occurrence
Actual guarantee amount
Type of guarantee
Period of guarantee Executed?
Guarantee for a
related party?
SF HOLDING INVESTMENT LIMITED 2017/12/28 343,855 2018/7/26 343,855 Joint liability
guarantee 2018/7/26-2023/7/26 No No
SF HOLDING LIMITED 2019/1/4 550,000 2019/2/11 358,163.3 Joint liability guarantee
2019/02/11-2019/06/26 Yes No
Total guarantee quota approved for subsidiaries during the reporting period (B1)
1,150,000.00
Total actual amount of guarantees for subsidiaries during the reporting period(B2)
358,163.30
Total guarantee quota approved for the subsidiaries at the end of the reporting period(B3)
1,135,691.71
Total actual guarantee balance for subsidiaries at the end of the reporting period(B4)
343,855
Subsidiary's guarantees to subsidiaries
Guarantee party Disclosure date
of Quota announcement
Amount of guaranteed
Quota approved
Actual date of occurrence
Actual guarantee amount
Type of guarantee
Period of guarantee Executed?
Guarantee for a related
party?
Beijing Shuncheng Logistics Co., Ltd. 2013/6/25 5,000 Joint liability
guarantee 2014/5/21-2019/5/21 Yes No
Shenzhen S.F. Aviation Industry Real Estate Management Co., Ltd., S.F. Express Co., Ltd.
2013/7/31 400 Joint liability guarantee
2013/8/21-2019/5/20 Yes No
Shenzhen S.F. Aviation Industry Real Estate Management Co., Ltd., S.F. Express Co., Ltd.
2013/7/31 404.57 Joint liability guarantee
2013/8/21-2023/7/30 No No
Shenzhen S.F. Aviation Industry Real Estate Management Co., Ltd., S.F. Express Co., Ltd.
2013/7/31 3,500 Joint liability guarantee
2013/9/5-2023/7/30 No No
Shenzhen S.F. Aviation Industry Real Estate Management Co., Ltd., S.F. Express Co., Ltd.
2013/7/31 2,600 Joint liability guarantee
2013/10/12-2023/7/30 No No
Shenzhen S.F. Aviation Industry Real Estate Management Co., Ltd., S.F. Express Co., Ltd.
2013/7/31 1,500 Joint liability guarantee
2013/11/25-2023/7/30 No No
Shenzhen S.F. Aviation Industry Real Estate Management Co., Ltd., S.F. Express Co., Ltd.
2013/7/31 5,000 Joint liability guarantee
2014/11/7-2023/7/30 No No
Shenzhen S.F. Aviation Industry Real Estate Management Co., Ltd., S.F. Express Co., Ltd.
2013/7/31 5,000 Joint liability guarantee
2015/2/2-2023/7/30 No No
Shenzhen S.F. Aviation Industry Real Estate Management Co., Ltd., S.F. Express Co., Ltd.
2013/7/31 1,000 Joint liability guarantee
2015/4/30-2023/7/30 No No
Shenzhen S.F. Aviation Industry Real Estate Management Co., Ltd., S.F. Express Co., Ltd.
2013/7/31 2,500 Joint liability guarantee
2016/5/31-2023/7/30 No No
Jiangxi S.F. Express Co., Ltd. 2015/9/15 300 Joint liability guarantee
2015/9/15-2019/1/16 Yes No
Jiangxi S.F. Express Co., Ltd. 2015/9/15 500 Joint liability guarantee
2015/11/24-2019/1/16 Yes No
Jiangxi S.F. Express Co., Ltd. 2015/9/15 500 Joint liability guarantee
2015/12/29-2019/1/16 Yes No
Jiangxi S.F. Express Co., Ltd. 2015/9/15 500 Joint liability guarantee
2016/1/22-2019/1/16 Yes No
Jiangxi S.F. Express Co., Ltd. 2015/9/15 500 Joint liability guarantee
2016/4/15-2019/1/16 Yes No
Jiangxi S.F. Express Co., Ltd. 2015/9/15 500 Joint liability guarantee
2016/11/24-2019/1/16 Yes No
Quanzhou Fengyutai Enterprise Management Co., Ltd. 2015/9/24 170 Joint liability
guarantee 2015/11/23-2019/4/19 Yes No
Quanzhou Fengyutai Enterprise Management Co., Ltd. 2015/9/24 310 Joint liability
guarantee 2015/12/22-2019/4/19 Yes No
Quanzhou Fengyutai Enterprise Management Co., Ltd. 2015/9/24 190 Joint liability
guarantee 2015/12/22-2025/9/23 No No

S.F. Holding Co., Ltd. 2019 Semi-Annual Report
89
Quanzhou Fengyutai Enterprise Management Co., Ltd. 2015/9/24 2,500 Joint liability
guarantee 2016/1/21-2025/9/23 No No
Quanzhou Fengyutai Enterprise Management Co., Ltd. 2015/9/24 500 Joint liability
guarantee 2016/4/28-2025/9/23 No No
Quanzhou Fengyutai Enterprise Management Co., Ltd. 2015/9/24 1,500 Joint liability
guarantee 2016/5/27-2025/9/23 No No
Quanzhou Fengyutai Enterprise Management Co., Ltd. 2015/9/24 1,500 Joint liability
guarantee 2016/6/28-2025/9/23 No No
Quanzhou Fengyutai Enterprise Management Co., Ltd. 2015/9/24 100 Joint liability
guarantee 2016/8/26-2025/9/23 No No
Quanzhou Fengyutai Enterprise Management Co., Ltd. 2015/9/24 1,870 Joint liability
guarantee 2017/1/18-2025/9/23 No No
Ningbo Fengtai E-commerce Industrial Park Management Co., Ltd.
2016/8/11 2,092.50 Joint liability guarantee
2016/8/11-2028/8/11 No No
Hefei Fengtai E-commerce Industrial Park Management Co., Ltd.
2016/12/30 63,100 2017/7/7 622 Joint liability guarantee
2017/7/7-2027/12/30 No No
Tianjin Fengtai E-commerce Park Co., Ltd. 2018/3/14 28,000 2018/10/19 6,877 Joint liability
guarantee 2018/10/19-2033/10/19 No No
Tianjin Fengtai E-commerce Park Co., Ltd. 2018/3/14 28,000 2018/10/19 2,200 Joint liability
guarantee 2018/11/9-2033/10/19 No No
Tianjin Fengtai E-commerce Park Co., Ltd. 2018/3/14 28,000 2018/10/19 1,100 Joint liability
guarantee 2018/12/19-2033/10/19 No No
Tianjin Fengtai E-commerce Park Co., Ltd. 2018/3/14 28,000 2018/10/19 2,150 Joint liability
guarantee 2019/01/28-2033/10/19 No No
Wuhu Fengtai E-commerce Industrial Park Management Co., Ltd.
2018/3/14 18,000 2019/1/18 750 Joint liability guarantee
2019/1/18-2034/1/18 No No
Wuhu Fengtai E-commerce Industrial Park Management Co., Ltd.
2018/3/14 18,000 2019/1/18 6,688 Joint liability guarantee
2019/4/1-2034/1/18 No No
S.F. EXPRESS (CHINA) LIMITED 2013/8/26 136.88 Joint liability guarantee
2014/12/5-2019/1/26 Yes No
S.F. EXPRESS (CHINA) LIMITED 2013/8/26 141.36 Joint liability guarantee
2014/12/5-2019/2/26 Yes No
S.F. EXPRESS (CHINA) LIMITED 2013/8/26 143.97 Joint liability guarantee
2014/12/5-2019/3/26 Yes No
S.F. EXPRESS (CHINA) LIMITED 2013/8/26 139.78 Joint liability guarantee
2014/12/5-2019/4/26 Yes No
S.F. EXPRESS (CHINA) LIMITED 2013/8/26 139.96 Joint liability guarantee
2014/12/5-2019/5/26 Yes No
S.F. EXPRESS (CHINA) LIMITED 2013/8/26 140.39 Joint liability guarantee
2014/12/5-2019/6/26 Yes No
S.F. EXPRESS (CHINA) LIMITED 2013/8/26 311.56 Joint liability guarantee
2014/12/5-2023/8/26 No No
S.F. EXPRESS (CHINA) LIMITED 2013/8/26 342.96 Joint liability guarantee
2015/2/13-2023/8/26 No No
S.F. EXPRESS (CHINA) LIMITED 2013/8/26 700.88 Joint liability guarantee
2015/5/18-2023/8/26 No No
S.F. EXPRESS (CHINA) LIMITED 2013/8/26 2,102.65 Joint liability guarantee
2015/6/30-2023/8/26 No No
S.F. EXPRESS (CHINA) LIMITED 2013/8/26 1,401.77 Joint liability guarantee
2015/12/2-2023/8/26 No No
S.F. EXPRESS (CHINA) LIMITED 2013/8/26 1,407.03 Joint liability guarantee
2016/2/25-2023/8/26 No No
S.F. EXPRESS (CHINA) LIMITED 2013/8/26 771.23 Joint liability guarantee
2016/3/11-2023/8/26 No No
S.F. EXPRESS (CHINA) LIMITED 2013/8/26 84.64 Joint liability guarantee
2016/4/11-2023/8/26 No No
SF Holding Limited 2016/7/25 879.9 Joint liability guarantee
2016/7/25-2019/1/25 Yes No
SF Holding Limited 2016/7/25 4,047.54 Joint liability guarantee
2016/7/25-2021/9/30 No No
SF Holding Limited 2016/12/30 509,400 2018/3/20 35,196 Joint liability guarantee
2018/3/20-2019/2/28 Yes No
SF Holding Limited 2018/3/14 522,300 2018/7/4 57,193.50 Joint liability guarantee
2018/7/4-2019/7/15 No No
SF Holding Limited 2018/3/14 522,300 2018/7/11 21,997.50 Joint liability guarantee
2018/7/11-2019/3/18 Yes No
SF Holding Limited 2016/11/18 13,198.50 Joint liability guarantee
2016/11/18-2019/3/11 Yes No
SF Holding Limited 2018/3/14 522,300 2019/1/11 17,598 Joint liability guarantee
2019/1/11-2019/5/14 Yes No
SF Holding Limited 2018/3/14 522,300 2019/1/8 30,796.50 Joint liability guarantee
2019/1/8-2020/1/8 No No
SF Holding Limited 2016/12/30 509,400 2017/6/14 17,598 Joint liability guarantee
2017/6/14-2019/3/21 Yes No
SF Holding Limited 2016/12/30 509,400 2018/1/16 13,198.50 Joint liability guarantee
2018/1/16-2020/1/16 No No

S.F. Holding Co., Ltd. 2019 Semi-Annual Report
90
SF Holding Limited 2018/3/14 522,300 2018/7/17 4,399.50 Joint liability guarantee
2018/7/17-2019/3/21 Yes No
SF Holding Limited 2018/3/14 522,300 2019/3/29 17,598 Joint liability guarantee
2019/3/29-2019/4/8 Yes No
SF Holding Limited 2019/3/16 1,013,659 2019/6/26 17,598 Joint liability guarantee
2019/6/26-2019/7/10 No No
SF Holding Limited 2019/3/16 1,013,659 2019/6/21 358,163.30 Joint liability guarantee
2019/06/21-2025/06/26 No No
S.F. Express Limited 2016/12/30 1,600 2017/8/4 686.13 Joint liability guarantee
2017/8/4-2019/6/25 Yes No
S.F. Express Co., Ltd. 2016/12/30 13,500 2017/6/21 100 Joint liability guarantee
2017/6/21-2019/4/30 Yes No
SF Airlines Company Limited 2016/12/30 76,940 2017/5/28 2,000 Joint liability guarantee
2017/5/28-2019/6/15 Yes No
SF Airlines Company Limited 2016/12/30 76,940 2017/8/7 2,500 Joint liability guarantee
2017/8/7-2019/2/7 Yes No
SF Holding Limited 2016/12/30 509,400 2017/6/22 14.24 Joint liability guarantee
2017/6/22-2020/7/16 No No
S.F. EXPRESS (HONG KONG) LIMITED 2016/12/15 5.69 Joint liability
guarantee 2016/12/15-2019/2/14 Yes No
Zhejiang Shun Feng Express Co., Ltd. 2018/3/14 3,900 2018/4/8 200 Joint liability
guarantee 2018/4/8-2019/4/28 Yes No
Yantai S.F Express Co., Ltd. 2018/3/14 500 2018/4/20 65 Joint liability guarantee
2018/4/20-2019/1/31 Yes No
Xi'an Shunlu Logistics Co., Ltd. 2018/3/14 1,000 2018/4/17 213.48 Joint liability guarantee
2018/4/17-2019/3/9 Yes No
SF Express ChongQing CO.LTD 2018/3/14 1,700 2018/4/28 255.89 Joint liability guarantee
2018/4/28-2019/4/27 Yes No
S.F. Express Group (Shanghai) Co., Ltd. 2018/3/14 2,000 2018/4/27 100 Joint liability
guarantee 2018/5/4-2019/5/4 Yes No
S. F. Express (Shenyang) Co., Ltd 2018/3/14 2,300 2018/4/28 10 Joint liability guarantee
2018/4/28-2019/1/31 Yes No
SF-Express(Ningxia)Co.,Ltd 2018/3/14 200 2018/4/28 1 Joint liability guarantee
2018/4/28-2019/4/10 Yes No
S.F. Express (Huizhou) Co., Ltd. 2018/3/14 2,500 2018/4/17 19.57 Joint liability guarantee
2018/4/17-2019/3/24 Yes No
SF Airlines Company Limited 2016/12/30 76,940 2018/4/2 46.84 Joint liability guarantee
2018/3/8-2019/3/7 Yes No
SF Airlines Company Limited 2016/12/30 76,940 2018/4/2 22.38 Joint liability guarantee
2018/3/8-2019/3/7 Yes No
SF Airlines Company Limited 2016/12/30 76,940 2018/4/2 10 Joint liability guarantee
2018/4/2-2019/3/31 Yes No
Shenzhen Shunlu Air Freight Forwarding Co., Ltd. 2016/12/30 7,000 2018/1/9 1,850 Joint liability
guarantee 2018/1/9-2019/2/28 Yes No
Shenzhen Shunlu Air Freight Forwarding Co., Ltd. 2016/12/30 7,000 2018/2/1 2,038 Joint liability
guarantee 2018/2/1-2019/1/31 Yes No
Shenzhen S.F. Supply Chain Co., Ltd. 2016/12/30 116,000 2018/2/11 600 Joint liability
guarantee 2018/2/11-2019/3/1 Yes No
Shenzhen S.F. Supply Chain Co., Ltd. 2016/12/30 116,000 2018/3/21 500 Joint liability
guarantee 2018/3/21-2019/3/20 Yes No
Shenzhen S.F. Supply Chain Co., Ltd. 2016/12/30 116,000 2018/4/2 3,000 Joint liability
guarantee 2018/4/2-2019/4/1 Yes No
NINGBO SHUNFENG EXPRESS CO.,LTD. 2018/3/14 3,300 2018/4/8 500 Joint liability
guarantee 2018/4/12-2019/4/11 Yes No
Hubei S.F. Express Co., Ltd. 2016/12/30 1,450 2018/3/8 323.29 Joint liability guarantee
2018/3/8-2019/2/8 Yes No
ShunFeng Express Co.,Ltd.Guangxi 2016/12/30 300 2018/2/9 100 Joint liability guarantee
2018/2/9-2019/1/31 Yes No
Chengdu Taishun Logistics Co.,Ltd. 2016/12/30 2,000 2018/2/8 800 Joint liability guarantee
2018/2/11-2019/2/10 Yes No
Beijing S.F. Express Co., LTD. 2018/3/14 5,000 2018/4/8 100 Joint liability guarantee
2018/4/8-2019/4/20 Yes No
Anhui S.F Express Co., Ltd. 2016/12/30 500 2018/1/10 100 Joint liability guarantee
2018/1/10-2019/5/31 Yes No
S.F. EXPRESS (HONG KONG) LIMITED 2016/12/30 7,700 2018/2/28 13.97 Joint liability
guarantee 2018/2/28-2019/8/31 No No
Liaoning Shunlu Logistics Co., Ltd. 2018/3/14 1,000 2018/5/9 191.3 Joint liability guarantee
2018/5/9-2019/4/30 Yes No
NINGBO SHUNFENG EXPRESS CO.,LTD. 2018/3/14 3,300 2018/5/8 500 Joint liability
guarantee 2018/5/8-2019/5/7 Yes No
S.F. EXPRESS (CHINA) LIMITED 2018/3/14 1,500 2018/4/18 42.3 Joint liability guarantee
2018/4/18-2019/5/4 Yes No
Hangzhou Shunyifeng Import And Export Trade CO., LTD
2018/3/14 1,000 2018/5/18 20 Joint liability guarantee
2018/5/18-2019/6/4 Yes No
Wuxi S.F. Express Co., Ltd. 2018/3/14 1,000 2018/5/18 10 Joint liability guarantee
2018/5/18-2019/5/24 Yes No
Hunan,S.F.Express(Group)Co.,Ltd. 2018/3/14 2,000 2018/6/5 143.1 Joint liability guarantee
2018/6/5-2019/5/25 Yes No
Shenzhen Shuncheng Supply Chain Service Co., Ltd. 2018/3/14 20,000 2018/6/5 23 Joint liability
guarantee 2018/6/5-2019/5/31 Yes No

S.F. Holding Co., Ltd. 2019 Semi-Annual Report
91
Shenzhen S.F. Supply Chain Co., Ltd. 2018/3/14 26,100 2018/6/5 500 Joint liability
guarantee 2018/6/5-2019/5/14 Yes No
SF Airlines Company Limited 2018/3/14 58,000 2018/6/6 99.58 Joint liability guarantee
2018/6/6-2019/6/1 Yes No
SF Airlines Company Limited 2018/3/14 58,000 2018/6/12 3.32 Joint liability guarantee
2018/6/12-2019/6/20 Yes No
SF Airlines Company Limited 2018/3/14 58,000 2018/6/12 13.28 Joint liability guarantee
2018/6/12-2019/6/28 Yes No
S.F.Express(Dong Guan)Limited 2018/3/14 8,500 2018/6/6 186.61 Joint liability guarantee
2018/6/6-2019/5/1 Yes No
Shenzhen SF Fix Technology Co., Ltd. 2018/3/14 23,000 2018/6/21 400 Joint liability
guarantee 2018/6/21-2019/1/31 Yes No
Jiangxi S.F. Express Co., Ltd. 2018/3/14 1,300 2018/6/28 50 Joint liability guarantee
2018/6/28-2019/5/31 Yes No
Beijing S.F. Express Co., LTD. 2018/3/14 5,000 2018/6/22 30 Joint liability guarantee
2018/6/22-2019/1/20 Yes No
Foshan S.F. Express Co., Ltd. 2018/3/14 1,400 2018/6/28 123.91 Joint liability guarantee
2018/6/28-2019/5/31 Yes No
Shanghai Shuncheng Co., Ltd. 2018/3/14 6,000 2018/6/22 40 Joint liability guarantee
2018/6/22-2019/4/30 Yes No
Chongqing Huiyifeng Logistics Co., Ltd. 2018/3/14 3,000 2018/6/22 500 Joint liability
guarantee 2018/6/22-2019/4/30 Yes No
S.F. EXPRESS (HONG KONG) LIMITED 2016/12/30 7,700 2017/10/24 14.79 Joint liability
guarantee 2017/10/24-2019/8/31 No No
Beijing Shuncheng Logistics Co., Ltd. 2018/3/14 6,000 2018/7/3 1,250 Joint liability
guarantee 2018/7/3-2019/6/29 Yes No
Beijing Shuncheng Logistics Co., Ltd. 2018/3/14 6,000 2018/7/3 500 Joint liability
guarantee 2018/7/3-2019/6/27 Yes No
Anhui S.F Express Co., Ltd. 2018/3/14 900 2018/7/4 73.64 Joint liability guarantee
2018/7/4-2019/5/31 Yes No
Chengdu Shunyifeng Pharmaceutical Co., Ltd. 2018/3/14 500 2018/7/3 150 Joint liability
guarantee 2018/7/3-2019/6/15 Yes No
Hebei S.F. Express Co., Ltd. 2018/3/14 1,600 2018/7/3 90 Joint liability guarantee
2018/7/3-2019/5/11 Yes No
Hubei S.F. Express Co., Ltd. 2018/3/14 1,800 2018/7/6 42.79 Joint liability guarantee
2018/7/6-2019/3/31 Yes No
Jiangsu S.F. Express Co., Ltd. 2018/3/14 500 2018/7/5 82.33 Joint liability guarantee
2018/7/5-2019/5/31 Yes No
Shandong S.F. Express Co., Ltd. 2018/3/14 1,300 2018/7/3 60 Joint liability guarantee
2018/7/3-2019/5/1 Yes No
Shandong S.F. Express Co., Ltd. 2018/3/14 1,300 2018/7/6 14 Joint liability guarantee
2018/7/6-2019/5/1 Yes No
Shandong S.F. Express Co., Ltd. 2018/3/14 1,300 2018/7/24 255 Joint liability guarantee
2018/7/24-2019/5/31 Yes No
Shanghai Shuncheng Co., Ltd. 2018/3/14 6,000 2018/7/24 30 Joint liability guarantee
2018/7/24-2019/12/31 No No
Shanghai Shuncheng Co., Ltd. 2018/3/14 6,000 2018/7/6 380 Joint liability guarantee
2018/7/6-2019/5/31 Yes No
Shanghai Shunheng Logistics Co., Ltd. 2018/3/14 500 2018/7/2 100 Joint liability
guarantee 2018/7/2-2019/9/30 No No
Shenzhen S.F. Supply Chain Co., Ltd. 2018/3/14 26,100 2018/7/2 1,000 Joint liability
guarantee 2018/7/2-2019/7/24 No No
Shenzhen S.F. Supply Chain Co., Ltd. 2018/3/14 26,100 2018/7/2 1,300 Joint liability
guarantee 2018/7/2-2019/2/28 Yes No
Shenzhen S.F. Supply Chain Co., Ltd. 2018/3/14 26,100 2018/7/4 39.55 Joint liability
guarantee 2018/7/4-2019/5/31 Yes No
Shenzhen S.F. Supply Chain Co., Ltd. 2018/3/14 26,100 2018/7/18 110.54 Joint liability
guarantee 2018/7/18-2019/8/8 No No
S.F.Express(Dong Guan)Limited 2018/3/14 8,500 2018/7/18 24.31 Joint liability guarantee
2018/7/18-2019/5/31 Yes No
S.F.Express(Dong Guan)Limited 2018/3/14 8,500 2018/7/24 186.61 Joint liability guarantee
2018/7/24-2019/5/1 Yes No
Shenzhen S.F. Supply Chain Co., Ltd. 2018/3/14 26,100 2018/7/4 104.17 Joint liability
guarantee 2018/7/4-2019/5/31 Yes No
S.F.Express(Dong Guan)Limited 2018/3/14 8,500 2018/7/18 226.45 Joint liability guarantee
2018/7/18-2019/5/31 Yes No
Sichuan S.F. Express Co., Ltd. 2018/3/14 1,800 2018/7/6 10 Joint liability guarantee
2018/7/6-2019/5/11 Yes No
XI`AN S.F EXPRESS CO.,LTD 2018/3/14 1,500 2018/7/20 125.74 Joint liability guarantee
2018/7/20-2019/7/15 No No
Wuxi S.F. Express Co., Ltd. 2018/3/14 1,000 2018/7/5 73.08 Joint liability guarantee
2018/7/5-2019/6/30 Yes No
S.F. Express Co., Ltd. 2018/3/14 30,000 2018/7/4 100 Joint liability guarantee
2018/7/4-2019/4/30 Yes No
Shanghai Shuncheng Co., Ltd. 2018/3/14 6,000 2018/7/6 400 Joint liability guarantee
2018/7/6-2019/6/22 Yes No
Shandong S.F. Express Co., Ltd. 2018/3/14 1,300 2018/7/24 20 Joint liability guarantee
2018/7/24-2019/5/9 Yes No
Zhejiang Shun Feng Express Co., Ltd. 2018/3/14 3,900 2018/7/6 451.33 Joint liability
guarantee 2018/7/6-2019/5/31 Yes No

S.F. Holding Co., Ltd. 2019 Semi-Annual Report
92
Jiangsu S.F. Express Co., Ltd. 2018/3/14 500 2018/7/23 28.15 Joint liability guarantee
2018/7/23-2019/3/19 Yes No
S.F. EXPRESS (SINGAPORE) PRIVATE LIMITED
2018/3/14 5,400 2018/7/19 159.89 Joint liability guarantee
2018/7/19-2019/8/3 No No
Beijing Shuncheng Logistics Co., Ltd. 2018/3/14 6,000 2018/7/31 100 Joint liability
guarantee 2018/7/31-2019/5/31 Yes No
Beijing Shuncheng Logistics Co., Ltd. 2018/3/14 6,000 2018/7/31 200 Joint liability
guarantee 2018/7/31-2019/5/31 Yes No
Beijing Shuncheng Logistics Co., Ltd. 2018/3/14 6,000 2018/7/31 600 Joint liability
guarantee 2018/7/31-2019/5/7 Yes No
Lanzhou S.F. Express Co., Ltd. 2018/3/14 100 2018/8/9 15 Joint liability guarantee
2018/8/9-2019/4/30 Yes No
Hunan,S.F.Express(Group)Co.,Ltd. 2018/3/14 2,000 2018/8/9 100 Joint liability guarantee
2018/8/9-2019/6/30 Yes No
Hunan,S.F.Express(Group)Co.,Ltd. 2018/3/14 2,000 2018/8/9 200 Joint liability guarantee
2018/8/9-2019/6/30 Yes No
Hunan,S.F.Express(Group)Co.,Ltd. 2018/3/14 2,000 2018/8/9 400 Joint liability guarantee
2018/8/9-2019/6/30 Yes No
Shenzhen SF Fix Technology Co., Ltd. 2018/3/14 23,000 2018/8/16 100 Joint liability
guarantee 2018/8/16-2019/5/30 Yes No
Xiamen S.F. Express Co., Ltd. 2018/3/14 1,000 2018/8/16 60 Joint liability guarantee
2018/8/16-2019/6/30 Yes No
QINGDAO S.F.EXPRESS CO.,LTD. 2018/3/14 1,300 2018/8/16 40 Joint liability
guarantee 2018/8/16-2019/7/31 No No
NINGBO SHUNFENG EXPRESS CO.,LTD. 2018/3/14 3,300 2018/8/16 30 Joint liability
guarantee 2018/8/16-2019/4/30 Yes No
Foshan S.F. Express Co., Ltd. 2018/3/14 1,400 2018/8/22 123.91 Joint liability guarantee
2018/8/22-2019/5/31 Yes No
Zhejiang Shunlu Logistics Co.,Ltd. 2018/3/14 4,000 2018/8/22 1,500 Joint liability guarantee
2018/8/22-2019/6/30 Yes No
Shenzhen SF Fix Technology Co., Ltd. 2018/3/14 23,000 2018/8/23 1,600 Joint liability
guarantee 2018/8/23-2019/6/30 Yes No
TIANJIN S.F. EXPRESS CO., LTD. 2018/3/14 1,400 2018/8/23 106.05 Joint liability guarantee
2018/8/23-2019/7/31 No No
S.F. Express Co., Ltd. 2018/3/14 30,000 2018/8/23 10 Joint liability guarantee
2018/8/23-2019/7/31 No No
Shenzhen Shunlu Air Freight Forwarding Co., Ltd. 2018/3/14 3,000 2018/8/23 1,850 Joint liability
guarantee 2018/8/23-2019/12/31 No No
Anhui S.F Express Co., Ltd. 2018/3/14 900 2018/8/28 5 Joint liability guarantee
2018/8/28-2019/9/30 No No
Shenzhen Shuncheng Supply Chain Service Co., Ltd. 2018/3/14 20,000 2018/8/28 6.6 Joint liability
guarantee 2018/8/28-2019/10/31 No No
ShunFeng Express Co.,Ltd.Guangxi 2018/3/14 1,000 2018/8/28 6.01 Joint liability guarantee
2018/8/28-2019/10/31 No No
Yunnan S.F. Express Co., Ltd. 2018/3/14 800 2018/8/28 11.29 Joint liability guarantee
2018/8/28-2019/6/15 Yes No
XI`AN S.F EXPRESS CO.,LTD 2018/3/14 1,500 2018/8/28 52.12 Joint liability guarantee
2018/8/28-2019/7/31 No No
Jinhua S.F. Express Co., Ltd. 2018/3/14 200 2018/8/28 83.68 Joint liability guarantee
2018/8/28-2019/8/9 No No
S.F. Express Co., Ltd. 2018/3/14 30,000 2018/8/28 1,000 Joint liability guarantee
2018/8/28-2019/2/18 Yes No
Hubei S.F. Express Co., Ltd. 2018/3/14 1,800 2018/8/30 55.33 Joint liability guarantee
2018/8/30-2019/6/30 Yes No
S.F. Transportation (Changzhou) Co., Ltd. 2018/3/14 300 2018/8/31 118.3 Joint liability
guarantee 2018/8/31-2019/9/30 No No
SF Airlines Company Limited 2018/3/14 58,000 2018/8/14 25.53 Joint liability guarantee
2018/8/14-2019/8/13 No No
Guang Zhou S.F. Express Co., Ltd. 2018/3/14 8,000 2018/8/8 200 Joint liability guarantee
2018/8/8-2019/8/8 No No
Guang Zhou S.F. Express Co., Ltd. 2018/3/14 8,000 2018/8/8 1,500 Joint liability guarantee
2018/8/8-2019/8/8 No No
Jiangxi S.F. Express Co., Ltd. 2018/3/14 1,300 2018/9/6 89.1 Joint liability guarantee
2018/9/6-2019/5/31 Yes No
Hunan,S.F.Express(Group)Co.,Ltd. 2018/3/14 2,000 2018/9/6 90.7 Joint liability guarantee
2018/9/6-2019/10/31 No No
S.F. Express Co., Ltd. 2018/3/14 30,000 2018/9/12 75.88 Joint liability guarantee
2018/9/12-2019/9/14 No No
S.F.Express(Dong Guan)Limited 2018/3/14 8,500 2018/9/13 149.62 Joint liability guarantee
2018/9/13-2019/7/31 No No
S.F. Express Group (Shanghai) Co., Ltd. 2018/3/14 2,000 2018/9/13 60 Joint liability
guarantee 2018/9/13-2019/7/31 No No
Shenzhen Shunlu Air Freight Forwarding Co., Ltd. 2018/3/14 3,000 2018/9/13 200 Joint liability
guarantee 2018/9/13-2019/1/31 Yes No
Jiangsu S.F. Express Co., Ltd. 2018/3/14 500 2018/9/18 10 Joint liability guarantee
2018/9/18-2019/6/30 Yes No
GANZHOU S.F EXPRESS Co.,Ltd 2018/3/14 100 2018/9/18 25 Joint liability guarantee
2018/9/18-2019/8/31 No No
S. F. Express (Shenyang) Co., Ltd 2018/3/14 2,300 2018/9/20 100 Joint liability guarantee
2018/9/20-2019/9/7 No No

S.F. Holding Co., Ltd. 2019 Semi-Annual Report
93
Jiangxi S.F. Express Co., Ltd. 2018/3/14 1,300 2018/9/20 15 Joint liability guarantee
2018/9/20-2019/9/14 No No
Shenzhen Shuncheng Supply Chain Service Co., Ltd. 2018/3/14 20,000 2018/9/19 25.04 Joint liability
guarantee 2018/9/19-2019/9/30 No No
Wuxi S.F. Express Co., Ltd. 2018/3/14 1,000 2018/9/18 73.08 Joint liability guarantee
2018/9/18-2019/6/27 Yes No
Beijing Shuncheng Logistics Co., Ltd. 2018/3/14 6,000 2018/9/19 527.59 Joint liability
guarantee 2018/9/19-2019/9/30 No No
S.F. EXPRESS (HONG KONG) LIMITED 2018/3/14 1,500 2018/9/13 16.76 Joint liability
guarantee 2018/9/13-2020/7/14 No No
S.F. EXPRESS (HONG KONG) LIMITED 2018/3/14 1,500 2018/9/14 46.42 Joint liability
guarantee 2018/9/14-2020/9/30 No No
SF Airlines Company Limited 2018/3/14 58,000 2018/9/25 2,756.10 Joint liability guarantee
2018/9/25-2019/10/10 No No
Chengdu Taishun Logistics Co.,Ltd. 2018/3/14 2,000 2018/9/17 100 Joint liability guarantee
2018/9/17-2019/4/30 Yes No
Zhejiang Shunlu Logistics Co.,Ltd. 2018/3/14 4,000 2018/8/3 10 Joint liability guarantee
2018/08/03-2019/04/30 Yes No
SF Airlines Company Limited 2018/3/14 58,000 2018/9/18 12.4 Joint liability guarantee
2018/9/18-2019/9/1 No No
Shenzhen Shunlu Logistics Co., Ltd. 2018/3/14 1,000 2018/9/29 338.32 Joint liability guarantee
2018/9/29-2019/1/31 Yes No
SF Airlines Company Limited 2018/3/14 58,000 2018/9/29 2 Joint liability guarantee
2018/9/29-2019/4/30 Yes No
Suzhou Industrial Park S.F. Express Co., Ltd. 2018/3/14 1,000 2018/9/28 205.17 Joint liability
guarantee 2018/9/28-2019/2/23 Yes No
Xunchuan Investment Co., Ltd. 2018/3/14 26,000 2018/9/28 11,216.74 Joint liability guarantee
2018/9/28-2019/2/28 Yes No
Xunchuan Investment Co., Ltd. 2018/3/14 26,000 2018/12/17 1,375.42 Joint liability guarantee
2018/12/17-2019/4/30 Yes No
S.F. Express Co., Ltd. 2018/3/14 30,000 2018/10/15 2,208 Joint liability guarantee
2018/10/15-2019/10/31 No No
Zhejiang Shunlu Logistics Co.,Ltd. 2018/3/14 4,000 2018/10/17 80 Joint liability guarantee
2018/10/17-2019/9/30 No No
Anhui S.F Express Co., Ltd. 2018/3/14 900 2018/10/17 5 Joint liability guarantee
2018/10/17-2019/9/24 No No
SF Express ChongQing CO.LTD 2018/3/14 1,700 2018/10/22 246.15 Joint liability guarantee
2018/10/22-2019/9/30 No No
Shandong S.F. Express Co., Ltd. 2018/3/14 1,300 2018/10/22 48.04 Joint liability guarantee
2018/10/22-2019/9/30 No No
Beijing S.F. Express Co., LTD. 2018/3/14 5,000 2018/10/22 464.88 Joint liability guarantee
2018/10/22-2019/9/22 No No
S.F. Express Co., Ltd. 2018/3/14 30,000 2018/10/9 300 Joint liability guarantee
2018/10/9-2019/10/7 No No
S.F. Express Co., Ltd. 2018/3/14 30,000 2018/10/15 30 Joint liability guarantee
2018/10/15-2019/10/15 No No
SF Airlines Company Limited 2018/3/14 58,000 2018/10/1 20.9 Joint liability guarantee
2018/10/1-2019/9/30 No No
S.F. EXPRESS (HONG KONG) LIMITED 2018/3/14 1,500 2018/10/10 29.6 Joint liability
guarantee 2018/10/10-2021/7/30 No No
Beijing Shuncheng Logistics Co., Ltd. 2018/3/14 6,000 2018/11/4 563.53 Joint liability
guarantee 2018/11/4 - 2019/10/26 No No
Yancheng S.F. Express Co., Ltd. 2018/3/14 100 2018/11/4 5 Joint liability guarantee
2018/11/4 - 2019/4/30 Yes No
SF Data Service (Wuhan) Co., Ltd. 2018/3/14 500 2018/11/2 77.76 Joint liability guarantee
2018/11/2 - 2019/11/2 No No
Beijing S.F. Express Co., LTD. 2018/3/14 5,000 2018/11/12 19.5 Joint liability guarantee
2018/11/12 -2019/10/31 No No
Quanzhou Shunlu Logistics Co., Ltd. 2018/3/14 1,500 2018/11/15 75.88 Joint liability
guarantee 2018/11/15 -2019/11/30 No No
Quanzhou Shunlu Logistics Co., Ltd. 2018/3/14 1,500 2018/11/15 26.36 Joint liability
guarantee 2018/11/15 -2019/10/31 No No
Zhejiang Shun Feng Express Co., Ltd. 2018/3/14 3,900 2018/11/19 250 Joint liability
guarantee 2018/12/8 - 2019/12/7 No No
S.F.EXPRESS (TIANJIN) CO., LTD. 2018/3/14 1,000 2018/11/19 72.06 Joint liability
guarantee 2018/11/19 -2019/11/28 No No
Shandong S.F. Express Co., Ltd. 2018/3/14 1,300 2018/11/19 5 Joint liability guarantee
2018/11/19 -2019/11/30 No No
XI`AN S.F EXPRESS CO.,LTD 2018/3/14 1,500 2018/11/21 9.42 Joint liability guarantee
2018/11/21 -2019/11/30 No No
Yunnan S.F. Express Co., Ltd. 2018/3/14 800 2018/11/23 10 Joint liability guarantee
2018/11/23 - 2019/11/5 No No
S.F. Express Group (Shanghai) Co., Ltd. 2018/3/14 2,000 2018/11/23 200 Joint liability
guarantee 2018/11/23 -2019/10/31 No No
QINGDAO S.F.EXPRESS CO.,LTD. 2018/3/14 1,300 2018/11/23 260 Joint liability
guarantee 2018/11/23 -2019/11/30 No No
Sichuan S.F. Express Co., Ltd. 2018/3/14 1,800 2018/11/23 56.69 Joint liability guarantee
2018/11/23 - 2019/8/31 No No
Shenzhen Shuncheng Supply Chain Service Co., Ltd. 2018/3/14 20,000 2018/11/22 7.88 Joint liability
guarantee 2018/11/22-2019/9/30 No No

S.F. Holding Co., Ltd. 2019 Semi-Annual Report
94
Anhui S.F Express Co., Ltd. 2018/3/14 900 2018/11/22 23.64 Joint liability guarantee
2018/11/22-2019/11/30 No No
SF Express ChongQing CO.LTD 2018/3/14 1,700 2018/11/2 20.81 Joint liability guarantee
2018/11/2-2020/2/28 No No
Suzhou Industrial Park S.F. Express Co., Ltd. 2018/3/14 1,000 2018/11/15 19.25 Joint liability
guarantee 2018/11/15-2019/10/15 No No
Suzhou Industrial Park S.F. Express Co., Ltd. 2018/3/14 1,000 2018/11/15 22.62 Joint liability
guarantee 2018/11/15-2019/8/31 No No
S.F. EXPRESS (HONG KONG) LIMITED 2018/3/14 1,500 2018/11/26 12.71 Joint liability
guarantee 2018/11/26-2020/8/12 No No
S.F. EXPRESS (HONG KONG) LIMITED 2018/3/14 1,500 2018/11/2 10.34 Joint liability
guarantee 2018/11/2-2020/10/4 No No
GZ SF Pharmaceutical Supply Chain Co., Ltd. 2018/3/14 1,000 2018/12/6 20 Joint liability
guarantee 2018/12/6-2019/9/30 No No
Suzhou Industrial Park S.F. Express Co., Ltd. 2018/3/14 1,000 2018/12/6 15 Joint liability
guarantee 2018/12/6-2019/4/30 Yes No
Heilongjiang S.F. Express Co., Ltd. 2018/3/14 1,600 2018/12/6 100 Joint liability guarantee
2018/12/6-2019/11/28 No No
Liaoning Shunlu Logistics Co., Ltd. 2018/3/14 1,000 2018/12/6 420 Joint liability guarantee
2018/12/6-2019/10/31 No No
Beijing Shuncheng Logistics Co., Ltd. 2018/3/14 6,000 2018/12/17 527.59 Joint liability
guarantee 2018/12/17-2019/9/30 No No
Zhejiang Shun Feng Express Co., Ltd. 2018/3/14 3,900 2018/12/17 1,000 Joint liability
guarantee 2018/12/17-2019/6/30 Yes No
Jiangsu Huihai Logistics Co.,Ltd. 2018/3/14 200 2018/12/17 20 Joint liability guarantee
2018/12/17-2019/10/14 No No
S. F. Express (Shenyang) Co., Ltd 2018/3/14 2,300 2018/12/5 107.75 Joint liability guarantee
2018/12/5-2019/11/30 No No
S.F.Express(Dong Guan)Limited 2018/3/14 8,500 2018/12/19 993.23 Joint liability guarantee
2018/12/19-2019/11/20 No No
Anhui S.F Express Co., Ltd. 2018/3/14 900 2018/12/25 59.72 Joint liability guarantee
2018/12/25-2019/12/31 No No
S.F. Express Co., Ltd. 2018/3/14 30,000 2018/12/25 233.15 Joint liability guarantee
2018/12/25-2019/11/30 No No
Shuncheng Financial Lease (Shenzheng) Co., Ltd. 2018/2/9 7,000 Joint liability
guarantee 2018/2/9-2019/1/11 Yes No
Shuncheng Financial Lease (Shenzheng) Co., Ltd. 2018/2/9 7,000 Joint liability
guarantee 2018/2/9-2019/2/11 Yes No
Shanghai Fengtaiyuanxing Property Management Co., Ltd. 2018/3/14 10,000 2018/9/1 4,578.29 Joint liability
guarantee 2018/09/01-2021/08/31 No No
Chengdu Shunyifeng Pharmaceutical Co., Ltd. 2018/3/14 500 2018/12/25 5 Joint liability
guarantee 2018/12/25-2019/3/31 Yes No
SF Airlines Company Limited 2018/3/14 58,000 2018/12/25 2,500 Joint liability guarantee
2019/2/7-2021/2/7 No No
Anhui S.F Express Co., Ltd. 2018/3/14 900 2019/1/25 5 Joint liability guarantee
2019/1/25-2020/1/21 No No
S.F. EXPRESS (CHINA) LIMITED 2018/3/14 1,500 2019/1/2 8.56 Joint liability guarantee
2019/1/2-2019/11/30 No No
S.F. EXPRESS (CHINA) LIMITED 2018/3/14 1,500 2019/1/18 8.56 Joint liability guarantee
2019/1/18-2020/1/4 No No
S.F. EXPRESS (CHINA) LIMITED 2018/3/14 1,500 2019/1/21 12.85 Joint liability guarantee
2019/1/21-2019/12/31 No No
S.F. EXPRESS (CHINA) LIMITED 2018/3/14 1,500 2019/1/17 85.64 Joint liability guarantee
2019/1/17-2019/12/31 No No
Anhui S.F Express Co., Ltd. 2018/3/14 900 2019/1/31 80 Joint liability guarantee
2019/1/31-2019/5/31 Yes No
Anhui S.F Express Co., Ltd. 2018/3/14 900 2019/1/22 24.6 Joint liability guarantee
2019/1/22-2019/12/31 No No
Beijing Shuncheng Logistics Co., Ltd. 2018/3/14 6,000 2019/1/29 100 Joint liability
guarantee 2019/1/29-2019/12/31 No No
Beijing S.F. Express Co., LTD. 2018/3/14 5,000 2019/1/7 30 Joint liability guarantee
2019/1/7-2019/12/21 No No
Chengdu Shunyifeng Pharmaceutical Co., Ltd. 2018/3/14 500 2019/1/17 43.63 Joint liability
guarantee 2019/1/17-2019/12/31 No No
Chengdu Taishun Logistics Co.,Ltd. 2018/3/14 2,000 2019/1/29 800 Joint liability guarantee
2019/1/29-2019/4/30 Yes No
Foshan S.F. Express Co., Ltd. 2018/3/14 1,400 2019/1/14 76.99 Joint liability guarantee
2019/1/14-2019/12/31 No No
ShunFeng Express Co.,Ltd.Guangxi 2018/3/14 1,000 2019/1/21 100 Joint liability guarantee
2019/1/21-2020/1/31 No No
Guizhou S.F. Express Co., Ltd. 2018/3/14 900 2019/1/7 12.21 Joint liability guarantee
2019/1/7-2019/10/31 No No
HaiNan S.F.Express LTD. 2018/3/14 1,100 2019/1/21 35 Joint liability guarantee
2019/1/21-2019/10/29 No No
HaiNan S.F.Express LTD. 2018/3/14 1,100 2019/1/21 100 Joint liability guarantee
2019/1/21-2019/11/30 No No
HENAN S.F.EXPRESS CO.,LTD 2018/3/14 1,100 2019/1/29 126.93 Joint liability guarantee
2019/1/29-2019/5/31 Yes No
Hubei S.F. Express Co., Ltd. 2018/3/14 1,800 2019/1/25 42.79 Joint liability guarantee
2019/1/25-2020/1/15 No No

S.F. Holding Co., Ltd. 2019 Semi-Annual Report
95
NINGBO SHUNFENG EXPRESS CO.,LTD. 2018/3/14 3,300 2019/1/7 500 Joint liability
guarantee 2019/1/7-2020/12/31 No No
Quanzhou Shunlu Logistics Co., Ltd. 2018/3/14 1,500 2019/1/29 300 Joint liability
guarantee 2019/1/29-2019/12/31 No No
Quanzhou Shunlu Logistics Co., Ltd. 2018/3/14 1,500 2019/1/29 300 Joint liability
guarantee 2019/1/29-2019/12/31 No No
Xiamen S.F. Express Co., Ltd. 2018/3/14 1,000 2019/1/29 20 Joint liability guarantee
2019/1/29-2019/12/31 No No
Shanghai Shuncheng Co., Ltd. 2018/3/14 6,000 2019/1/25 30 Joint liability guarantee
2019/1/25-2019/12/31 No No
Shenzhen S.F. Supply Chain Co., Ltd. 2018/3/14 26,100 2019/1/15 120.13 Joint liability
guarantee 2019/1/15-2019/12/31 No No
Shenzhen S.F. Supply Chain Co., Ltd. 2018/3/14 26,100 2019/1/28 36.77 Joint liability
guarantee 2019/1/28-2020/1/20 No No
Shenzhen Shunlu Air Freight Forwarding Co., Ltd. 2018/3/14 3,000 2019/1/29 2,230 Joint liability
guarantee 2019/1/29-2019/12/31 No No
Shenzhen Shunlu Air Freight Forwarding Co., Ltd. 2018/3/14 3,000 2019/1/31 50 Joint liability
guarantee 2019/1/31-2020/1/1 No No
Shenzhen Shunlu Logistics Co., Ltd. 2018/3/14 1,000 2019/1/10 123.91 Joint liability guarantee
2019/1/10-2020/1/31 No No
SF Airlines Company Limited 2018/3/14 58,000 2019/1/10 18.19 Joint liability guarantee
2019/1/10-2020/5/31 No No
S. F. Express (Shenyang) Co., Ltd 2018/3/14 2,300 2019/1/21 10 Joint liability guarantee
2019/1/21-2020/4/30 No No
S. F. Express (Shenyang) Co., Ltd 2018/3/14 2,300 2019/1/21 10 Joint liability guarantee
2019/1/21-2020/4/30 No No
S.F.EXPRESS (TIANJIN) CO., LTD. 2018/3/14 1,000 2019/1/23 61.35 Joint liability
guarantee 2019/1/23-2020/1/20 No No
SF Express ChongQing CO.LTD 2018/3/14 1,700 2019/1/4 110 Joint liability guarantee
2019/1/4-2019/12/31 No No
S.F. EXPRESS (HONG KONG) LIMITED 2018/3/14 1,500 2019/1/2 3.1 Joint liability
guarantee 2019/1/2-2020/11/22 No No
S.F. EXPRESS (HONG KONG) LIMITED 2018/3/14 1,500 2019/1/3 11.97 Joint liability
guarantee 2019/1/3-2020/9/30 No No
Sichuan S.F. Express Co., Ltd. 2018/3/14 1,800 2019/1/29 5 Joint liability guarantee
2019/1/29-2020/1/31 No No
Sichuan S.F. Express Co., Ltd. 2018/3/14 1,800 2019/1/29 5.19 Joint liability guarantee
2019/1/29-2019/11/14 No No
TIANJIN S.F. EXPRESS CO., LTD. 2018/3/14 1,400 2019/1/10 80.9 Joint liability guarantee
2019/1/10-2020/1/31 No No
QINGDAO S.F.EXPRESS CO.,LTD. 2018/3/14 1,300 2019/1/10 56.77 Joint liability
guarantee 2019/1/10-2019/12/14 No No
S.F. Express Co., Ltd. 2018/3/14 30,000 2019/1/7 140.46 Joint liability guarantee
2019/1/7-2019/11/30 No No
Zhejiang Shun Feng Express Co., Ltd. 2018/3/14 3,900 2019/1/10 7 Joint liability
guarantee 2019/1/10-2019/3/5 Yes No
S.F. EXPRESS (CHINA) LIMITED 2018/3/14 1,500 2019/1/31 51.38 Joint liability guarantee
2019/1/31-2020/1/14 No No
Chongqing Huiyifeng Logistics Co., Ltd. 2018/3/14 3,000 2019/1/31 1,500 Joint liability
guarantee 2019/1/31-2020/1/24 No No
Suzhou Industrial Park S.F. Express Co., Ltd. 2018/3/14 1,000 2019/2/20 15 Joint liability
guarantee 2019/2/20-2019/4/30 Yes No
Wenzhou Shunheng Express Co., Ltd. 2018/3/14 500 2019/2/20 2 Joint liability
guarantee 2019/2/20-2020/1/6 No No
FAST DELIVER INVESTMENT LIMITED) 2018/3/14 26,000 2019/3/5 6,586.89 Joint liability
guarantee 2019/3/5-2019/6/30 Yes No
FAST DELIVER INVESTMENT LIMITED) 2018/3/14 26,000 2019/3/5 6,586.89 Joint liability
guarantee 2019/3/5-2019/7/31 No No
Jiangxi Shunlu Logistics Co.,Ltd. 2018/3/14 100 2019/3/4 50 Joint liability guarantee
2019/3/4-2020/2/29 No No
Shenzhen SF Fix Technology Co., Ltd. 2018/3/14 23,000 2019/3/5 20 Joint liability
guarantee 2019/3/5-2019/10/31 No No
Shenzhen S.F. Supply Chain Co., Ltd. 2018/3/14 26,100 2019/3/5 1,300 Joint liability
guarantee 2019/3/5-2020/3/28 No No
S.F. Express Co., Ltd. 2018/3/14 30,000 2019/3/5 300 Joint liability guarantee
2019/3/5-2020/3/1 No No
Zhanjiang S.F. Express Co., Ltd. 2018/3/14 700 2019/3/5 25 Joint liability guarantee
2019/3/5-2020/1/23 No No
Shenzhen SF Comprehensive Logistics Service Co., Ltd. 2018/3/14 500 2019/3/12 150 Joint liability
guarantee 2019/3/12-2019/12/31 No No
Xi'an Shunlu Logistics Co., Ltd. 2018/3/14 1,000 2019/3/13 222.02 Joint liability guarantee
2019/3/13-2020/3/9 No No
Xinjiang S.F. Express Co., Ltd. 2018/3/14 600 2019/3/13 2 Joint liability guarantee
2019/3/13-2020/3/7 No No
SF Airlines Company Limited 2018/3/14 58,000 2019/3/18 10 Joint liability guarantee
2019/3/18-2020/3/31 No No
Shenzhen Shunlu Logistics Co., Ltd. 2018/3/14 1,000 2019/3/19 80 Joint liability guarantee
2019/3/19-2020/6/30 No No
Shenzhen SF Fix Technology Co., Ltd. 2018/3/14 23,000 2019/3/26 400 Joint liability
guarantee 2019/3/26-2020/1/31 No No

S.F. Holding Co., Ltd. 2019 Semi-Annual Report
96
Yantai S.F Express Co., Ltd. 2018/3/14 500 2019/3/26 65 Joint liability guarantee
2019/3/26-2020/1/31 No No
SF Airlines Company Limited 2018/3/14 58,000 2019/3/26 21.84 Joint liability guarantee
2019/3/26-2020/3/7 No No
Jiangsu S.F. Express Co., Ltd. 2018/3/14 500 2019/3/27 28.15 Joint liability guarantee
2019/3/27-2020/3/19 No No
S.F. Express Co., Ltd. 2018/3/14 30,000 2019/3/27 20 Joint liability guarantee
2019/3/27-2019/12/31 No No
Tibet S.F. Express Co., Ltd. 2018/3/14 100 2019/3/27 5 Joint liability guarantee
2019/3/27-2020/2/29 No No
S.F. Express (Huizhou) Co., Ltd. 2018/3/14 2,500 2019/3/28 19.57 Joint liability guarantee
2019/3/28-2020/3/24 No No
Shenzhen S.F. Supply Chain Co., Ltd. 2018/3/14 26,100 2019/3/28 600 Joint liability
guarantee 2019/3/28-2020/2/29 No No
S.F. Express Co., Ltd. 2018/3/14 30,000 2019/3/28 200 Joint liability guarantee
2019/3/28-2020/3/1 No No
S.F. Express Co., Ltd. 2018/3/14 30,000 2019/3/29 3,000 Joint liability guarantee
2019/3/29-2020/3/14 No No
Jiangxi S.F. Express Co., Ltd. 2018/3/14 1,300 2019/3/29 223.43 Joint liability guarantee
2019/3/29-2020/3/15 No No
Zhongshan S.F. Express Co., Ltd. 2018/3/14 1,000 2019/3/27 141.98 Joint liability guarantee
2019/3/27-2020/3/26 No No
Hunan,S.F.Express(Group)Co.,Ltd. 2018/3/14 2,000 2019/3/26 90.7 Joint liability guarantee
2019/3/26-2019/11/30 No No
Zhejiang Shun Feng Express Co., Ltd. 2019/3/16 2,000 2019/4/29 50 Joint liability
guarantee 2019/4/29-2020/4/28 No No
Beijing S.F. Express Co., LTD. 2018/3/14 5,000 2019/4/3 100 Joint liability guarantee
2019/4/3-2020/4/20 No No
Chengdu Shunyifeng Pharmaceutical Co., Ltd. 2019/3/16 100 2019/4/19 20 Joint liability
guarantee 2019/4/19-2019/12/31 No No
NINGBO SHUNFENG EXPRESS CO.,LTD. 2019/3/16 2,500 2019/4/10 550 Joint liability
guarantee 2019/4/10-2020/5/7 No No
Shenzhen Shunlu Logistics Co., Ltd. 2019/3/16 2,100 2019/4/19 380.61 Joint liability guarantee
2019/4/19-2020/1/31 No No
SF Airlines Company Limited 2019/3/16 26,000 2019/4/19 2,000 Joint liability guarantee
2019/4/19-2020/5/26 No No
S.F.Express(Dong Guan)Limited 2019/3/16 1,800 2019/4/10 15.03 Joint liability guarantee
2019/4/10-2020/4/2 No No
S.F. Express Group (Shanghai) Co., Ltd. 2019/3/16 800 2019/4/24 100 Joint liability
guarantee 2019/4/24-2020/5/4 No No
SF Express ChongQing CO.LTD 2019/3/16 800 2019/4/10 264.85 Joint liability guarantee
2019/4/10-2020/4/30 No No
SF Transportation (Nanjing) Co., Ltd. 2019/3/16 300 2019/4/19 100 Joint liability
guarantee 2019/4/19-2020/4/8 No No
S.F. EXPRESS (HONG KONG) LIMITED 2019/3/16 8,200 2019/4/26 12.97 Joint liability
guarantee 2019/4/26-2021/5/15 No No
Sichuan S.F. Express Co., Ltd. 2019/3/16 500 2019/4/10 20 Joint liability guarantee
2019/4/10-2020/5/14 No No
Xinjiang S.F. Express Co., Ltd. 2018/3/14 600 2019/4/3 6 Joint liability guarantee
2019/4/3-2020/2/29 No No
Zhejiang Shunlu Logistics Co.,Ltd. 2018/3/14 4,000 2019/4/3 30 Joint liability guarantee
2019/4/3-2019/9/15 No No
S.F. EXPRESS (HONG KONG) LIMITED 2019/3/16 8,200 2019/5/23 85.64 Joint liability
guarantee 2019/5/23-2022/5/31 No No
S.F. EXPRESS (HONG KONG) LIMITED 2019/3/16 8,200 2019/5/23 144.39 Joint liability
guarantee 2019/5/23-2022/5/31 No No
S.F. EXPRESS (CHINA) LIMITED 2019/3/16 1,000 2019/5/29 42.82 Joint liability guarantee
2019/5/29-2020/7/6 No No
Anhui S.F Express Co., Ltd. 2019/3/16 500 2019/5/31 180 Joint liability guarantee
2019/5/31-2020/5/31 No No
Chengdu Taishun Logistics Co.,Ltd. 2019/3/16 1,500 2019/5/22 900 Joint liability guarantee
2019/5/22-2020/4/30 No No
Hebei S.F. Express Co., Ltd. 2019/3/16 300 2019/4/30 90 Joint liability guarantee
2019/4/30-2020/5/11 No No
Henan Huihai Logistics Co., Ltd. 2018/3/14 300 2019/4/8 151.72 Joint liability guarantee
2019/4/8-2020/1/31 No No
Hubei S.F. Transportation Co., Ltd. 2018/3/14 500 2019/4/8 323.29 Joint liability guarantee
2019/4/8-2020/3/20 No No
Liaoning Shunlu Logistics Co., Ltd. 2019/3/16 700 2019/5/6 191.3 Joint liability guarantee
2019/5/6-2020/4/23 No No
Inner Mongolia S.F Express CO.Ltd. 2019/3/16 100 2019/5/28 10 Joint liability
guarantee 2019/5/28-2020/3/31 No No
Shenzhen S.F. Supply Chain Co., Ltd. 2019/3/16 10,900 2019/4/30 3,000 Joint liability
guarantee 2019/4/30-2020/3/31 No No
SF-Express(Ningxia)Co.,Ltd 2018/3/14 200 2019/4/8 100 Joint liability guarantee
2019/4/8-2020/1/31 No No
S.F. Express Co., Ltd. 2019/3/16 25,000 2019/5/6 100 Joint liability guarantee
2019/5/6-2020/4/30 No No
Wuxi S.F. Express Co., Ltd. 2019/3/16 500 2019/5/23 20 Joint liability guarantee
2019/5/23-2020/5/24 No No

S.F. Holding Co., Ltd. 2019 Semi-Annual Report
97
S.F. Express Co., Ltd. 2019/3/16 25,000 2019/6/11 200 Joint liability guarantee
2019/6/11-2020/4/16 No No
Shenzhen Shuncheng Supply Chain Service Co., Ltd. 2019/3/16 1,000 2019/6/19 23 Joint liability
guarantee 2019/6/19-2020/5/31 No No
S.F. Express Co., Ltd. 2019/3/16 25,000 2019/6/19 4 Joint liability guarantee
2019/6/19-2020/4/16 No No
Shanghai Shuncheng Co., Ltd. 2019/3/16 2,000 2019/6/21 400 Joint liability guarantee
2019/6/21-2020/6/22 No No
FS ELECTRONIC TECHNOLOGY CO., LIMITED
2019/3/16 4,000 2019/6/20 25.76 Joint liability guarantee
2019/6/20-2020/3/31 No No
Shenzhen SF Fix Technology Co., Ltd. 2019/3/16 20,800 2019/6/5 1,600 Joint liability
guarantee 2019/6/5-2020/6/30 No No
Shenzhen S.F. Supply Chain Co., Ltd. 2019/3/16 10,900 2019/6/5 104.17 Joint liability
guarantee 2019/6/5-2020/10/15 No No
Shandong S.F. Express Co., Ltd. 2019/3/16 1,000 2019/6/10 60 Joint liability guarantee
2019/6/10-2020/5/31 No No
XI`AN S.F EXPRESS CO.,LTD 2019/3/16 300 2019/6/21 53.84 Joint liability guarantee
2019/6/21-2020/6/17 No No
Tibet S.F. Express Co., Ltd. 2019/3/16 200 2019/5/29 2 Joint liability guarantee
2019/5/29-2020/4/30 No No
Shanghai Shunxiaofeng Transportation Co., Ltd. 2019/3/16 200 2019/6/4 50 Joint liability
guarantee 2019/6/4-2019/10/31 No No
S.F. EXPRESS (CHINA) LIMITED 2019/3/16 1,000 2019/6/11 42.93 Joint liability guarantee
2019/6/11-2020/5/31 No No
E COMMERCE FULFILLMENT COMPANY LIMITED
2019/3/16 7,060 2019/6/19 20.98 Joint liability guarantee
2019/6/19-2019/12/12 No No
Shandong S.F. Express Co., Ltd. 2019/3/16 1,000 2019/6/10 14 Joint liability guarantee
2019/6/10-2020/1/31 No No
Zhejiang Shunlu Logistics Co.,Ltd. 2019/3/16 1,800 2019/5/30 650 Joint liability guarantee
2019/5/30-2019/12/31 No No
Shandong S.F. Express Co., Ltd. 2019/3/16 1,000 2019/6/21 255 Joint liability guarantee
2019/6/21-2020/6/30 No No
Xi'an Shunlu Logistics Co., Ltd. 2019/3/16 400 2019/6/24 80 Joint liability guarantee
2019/6/24-2020/5/31 No No
S.F. Express Co., Ltd. 2019/3/16 25,000 2019/6/26 300 Joint liability guarantee
2019/6/26-2020/5/31 No No
Shanxi S.F. Express Co., Ltd. 2019/3/16 200 2019/6/25 35 Joint liability guarantee
2019/6/25-2019/12/31 No No
Shanxi S.F. Express Co., Ltd. 2019/3/16 200 2019/6/25 6 Joint liability guarantee
2019/6/25-2019/12/31 No No
Wuxi S.F. Express Co., Ltd. 2019/3/16 500 2019/6/27 73.08 Joint liability guarantee
2019/6/27-2020/6/27 No No
DHL Logistics (Beijing) Co., Ltd. 2019/3/16 3,100 2019/5/10 237.86 Joint liability guarantee
2019/5/10-2020/7/15 No No
DHL Logistics (Beijing) Co., Ltd. 2019/3/16 3,100 2019/5/13 58.86 Joint liability guarantee
2019/5/13-2020/7/15 No No
DHL Logistics (Beijing) Co., Ltd. 2019/3/16 3,100 2019/4/30 30 Joint liability guarantee
2019/4/30-2019/7/31 No No
DHL Logistics (Beijing) Co., Ltd. 2019/3/16 3,100 2019/6/13 24.85 Joint liability guarantee
2019/6/13-2020/7/31 No No
EXEL LOGISTICS CHINA CO.,LTD. 2019/3/16 1,100 2019/6/13 63.61 Joint liability
guarantee 2019/6/13-2020/1/31 No No
DHL Logistics (Beijing) Co., Ltd. 2019/3/16 3,100 2019/4/17 50 Joint liability guarantee
2019/4/17-2020/3/21 No No
Shunyuan Financial Lease (Tianjin) Co., Ltd. 2019/3/16 70,000 2019/4/22 20,000 Joint liability
guarantee 2019/5/10-2024/01/24 No No
Total guarantee quota approved for subsidiaries during the reporting period(C1)
2,500,000.00
Total actual amount of guarantees for subsidiaries during the reporting period(C2)
514,935.67
Total guarantee quota approved for the subsidiaries at the end of the reporting period(C3)
2,709,447.09
Total actual guarantee balance for subsidiaries at the end of the reporting period (C4)
617,950.90
Total guarantee amount provided by the Company
Total guarantee quota approved during the reporting period(B1+C1) 3,650,000.00
Total actual amount of guarantee during the reporting period(B2+C2)
873,098.97
Total guarantee quota approved at the end of the reporting period(B3+C3)
3,845,138.80Total actual guarantee balance at the end of the reporting period(B4+C4)
961,805.90
Total guarantee amount (B4+C4) to net assets of the Company 25.04%Of which: Amount of guarantee for shareholders, actual controller, and their related parties (D) -
Amount of debt guarantee provided for guaranteed party whose asset-liability ratio is not less than 70% directly or indirectly (E) 35,673.67
Amount of total guarantee over 50% of net assets (F) -Total amount of the above three guarantees (D+E+F) 35,673.67Explanation of warranty liability or possible joint liquidation (if any) N/A

S.F. Holding Co., Ltd. 2019 Semi-Annual Report
98
Explanation of provision of guarantees for external parties in violation of the prescribed procedure (if any)
N/A
Before Taisen Holding was incorporated into the listed Company in December 2016, Taisen Holding and its subsidiaries
performed external guarantee procedures in accordance with their own Articles of Corporation and other relevant regulations. After Taisen Holding was incorporated into the listed Company in December 2016, as a subsidiary of the listed Company, Taisen Holding and its subsidiaries strictly performed the review and disclosure procedures of external guarantees in accordance with relevant laws and regulations such as the Stock Listing Rules of Shenzhen Stock Exchange and other related laws and regulations.
(2) Illegal provision of guarantees for external parties
□Applicable √ Not applicable No such cases in the reporting period. 3. Other significant contracts
□Applicable √Not applicable No such cases in the reporting period. XV. Social Responsibilities
1. Environmental protection
Did the listed Company and its subsidiaries belong to the major pollutant discharge units announced by the Ministry of Ecology and Environment? No The Company and its subsidiaries are not part of the major pollutant discharge units announced by the Ministry of Ecology and Environment. 2. Targeted Poverty Alleviation Program
□Applicable √ Not applicable During the reporting period, the Company did not carry out any Targeted Poverty Alleviation Program.

S.F. Holding Co., Ltd. 2019 Semi-Annual Report
99
XVI. Other Major Issues
√ Applicable □Not applicable 1. Issuance of debt financing products in domestic and international markets by wholly-owned subsidiaries
In order to satisfy the development requirements of domestic and international business, reduce financing costs and optimize the debt structure according to the development strategies of the Company, at the 18th meeting of the 4th session of the Board and the 2019 first extraordinary general meeting convened by the Company on January 3, 2019 and January 23, 2019 respectively, the “Resolution regarding the Issuance of Debt Financing Products in Domestic and International Markets by Wholly-owned Subsidiaries” was considered and approved, and the Company was authorised to issue debt financing products in domestic and international markets through Taisen Holding and SF Holding Investment Limited, the wholly-owned subsidiaries, for an equivalent amount of no more than RMB16 billion (inclusive), including RMB10 billion which are the expected size of issuance in domestic market and RMB6 billion which are the expected size of issuance in international market. On March 20, 2019, Taisen Holding received from CSRC the “Approval for Public Issuance of Corporate Bonds to Eligible Investors by Shenzhen S.F. Taisen Holding (Group) Co., Ltd.” (Zheng Jian Xu Ke (证监许可) [2019] No.388) pursuant to which Taisen Holding was approved to issue corporate bonds for a total nominal amount of no more than RMB2 billion to eligible investors through public issuance. On March 26, 2019, Taisen Holding received from the National Association of Financial Market Institutional Investors the “Notice of Registration Acceptance” (Zhong Shi Xie Zhu (中市协注) [2019] No. SCP71) pursuant to which the National Association of Financial Market Institutional Investors has accepted the registration of the super short-term commercial paper of Taisen Holding with a registered amount of RMB3 billion. On April 10, 2019, Taisen Holding completed the offering of the first tranche of super short-term commercial paper for 2019 with an issued amount of RMB500 million. On July 12, 2019, Taisen Holding completed the offering of the second tranche of super short-term commercial paper for 2019 with an issued amount of RMB500 million. On August 23, 2019, Taisen Holding completed the offering of the third tranche of super short-term commercial paper for 2019 with an issued amount of RMB500 million. For details, please refer to the announcements (2019-006, 2019-051, 2019-053, 2019-060 、2019-083 and 2019-094) of the Company disclosed on http://www.cninfo.com.cn. 2. Issuance of convertible bonds by the Company
In order to enhance the Company’s competitiveness, increase its profitability, further strengthen its core competitiveness and increase its capabilities of sustainable development according to the development strategies of the Company, at the 21st meeting of the 4th session of the Board and the 2019 second extraordinary general meeting convened by the Company on April 23, 2019 and May 9, 2019 respectively, resolutions regarding the public issuance of convertible corporate bonds were considered and approved. The total amount of proceeds to be raised from such public issuance of convertible corporate bonds shall not exceed RMB6.5 billion. The Company convened the 23rd meeting of the 4th session of the Board on August 6, 2019 to consider and approve the “Resolution regarding Adjustment to the Proposal of Public Issuance of Convertible Corporate Bonds by the Company” such that the total amount of proceeds from the public issuance of convertible corporate bonds will decrease from an amount not exceeding RMB6.5 billion (inclusive) to an amount not exceeding RMB5.8 billion (inclusive), and the use of proceeds will be adjusted accordingly. On August 23, 2019, the application for public issuance of convertible corporate bonds by the Company was considered and approved by the China Securities Issuance Examination Committee (“CSIEC”) of CSRC. As of the disclosure date of this report, the Company has not yet received the written approval document from CSRC.For details, please refer to the announcements (2019-072, 2019-081、2019-089 and 2019-093) of the Company disclosed on http://www.cninfo.com.cn. 3. Commencement of asset securitization Business
In order to revitalize existing assets and enhance the capital utilization efficiency, the Company has established a special asset-backed plan by using the logistics industrial park held by the subsidiary Shenzhen Fengtai E-Commerce Industrial Park Asset Management Co., Ltd. as the principal and raised funds by means of the issuance of asset-backed securities under the plan. On November 21, 2018, the Company obtained the “No Objection Letter regarding Huatai Asset Management’s ‘Huatai Jiayue - Shunfeng Industrial Park Phase I Asset-Backed Special Plan’ being in line with the Conditions for Listing on the Shenzhen Stock Exchange” (Shen Zheng Han (深证函) [2018] No. 666) issued by the Shenzhen Stock Exchange, and the total size of issuance by

S.F. Holding Co., Ltd. 2019 Semi-Annual Report
100
way of shelf-offering approved in the No Objection Letter was RMB5 billion for a valid period of two years. In 2018, the Company issued the first tranche of asset-backed securities with a total size of RMB1.846 billion. On June 13, 2019, the Company convened the 22nd meeting of the 4th session of the Board and the 19th meeting of the 4th session of the Board of Supervisors respectively at which the “Resolution regarding the Commencement of Asset Securitization and Related Party Transactions” was considered and approved. The Company proposed to continue the development of the asset securitization business and raise funds by means of issuance of asset-backed securities under the special plan. The tranche issued in the reporting period was the second tranche within the amount authorized for shelf-offering under the special plan, and the total amount of asset-backed securities proposed to be issued in this tranche shall not exceed RMB1.5 billion. For details, please refer to the announcement (2019-078) of the Company disclosed on http://www.cninfo.com.cn. As of the disclosure date of this report, transaction documents relating to this tranche under the special plan have not been signed. 4. Signing of the Strategic Cooperation Agreement between a wholly-owned subsidiary and China
Pacific Insurance (Group) Co., Ltd.
As both the Company and China Pacific Insurance (Group) Co., Ltd. (“China Pacific Insurance”) are leaders in their respective industries, to promote the continuous rapid development of both parties in their respective industries and fully utilize their resources and industry advantages, Taisen Holding and China Pacific Insurance entered into the Strategic Cooperation Agreement on June 17, 2019 after due consultations. On the basis of deepening cooperation in conventional areas, both parties are willing to focus on complementation to each other’s strengths and resources and sharing core capabilities to carry out multi-level and multi-area strategic cooperation to realize mutual benefits and joint developments. The strategic cooperation will have positive effects on the future development of principal business of the Company which will be conducive to the long-term development of the Company. For details, please refer to the announcement (2019-079) disclosed on http://www.cninfo.com.cn. A disclosure index for the above-mentioned significant events and other significant events is as below:
Announcement Disclosure Date Disclosure Website Announcement on Issuance of Debt Financing Products in Domestic and International Markets by Wholly-owned Subsidiaries (2019-006)
January 4, 2019 http://www.cninfo.com.cn
Announcement on the Progress of Acquisition of 100% Equity Interest in DHL Supply Chain (Hong Kong) Limited and DHL Logistics (Beijing) Co., Ltd. (2019-013)
January 5, 2019 http://www.cninfo.com.cn
Announcement on the Progress of the Hubei International Logistics Hub Project (2019-016) January 17, 2019 http://www.cninfo.com.cn
Announcement on the Progress of Acquisition of 100% Equity Interest in DHL Supply Chain (Hong Kong) Limited and DHL Logistics (Beijing) Co., Ltd. (2019-023)
February 19, 2019 http://www.cninfo.com.cn
Announcement on the Progress of the Hubei International Logistics Hub Project (2019-031) March 2, 2019 http://www.cninfo.com.cn
Announcement on Obtaining Approval from CSRC for Public Issuance of Corporate Bonds to Eligible Investors by Shenzhen S.F. Taisen Holding (Group) Co., Ltd., a Wholly-owned Subsidiary of the Company (2019-051)
March 22, 2019 http://www.cninfo.com.cn
Announcement on Receiving Notice of Registration Acceptance from the National Association of Financial Market Institutional Investors by Shenzhen S.F. Taisen Holding (Group) Co., Ltd., a Wholly-owned Subsidiary of the Company (2019-053)
March 27, 2019 http://www.cninfo.com.cn
Announcement on Completion of Offering of Danqing Phase II Investment Fund Participated and Invested by Wholly-owned Subsidiaries (2019-051)
April 11, 2019 http://www.cninfo.com.cn

S.F. Holding Co., Ltd. 2019 Semi-Annual Report
101
Announcement on the Result of Issuance of the 2019 First Tranche of Super Short-Term Commercial Paper of Shenzhen S.F. Taisen Holding (Group) Co., Ltd., a wholly-owned subsidiary of the Company (2019-060)
April 12, 2019 http://www.cninfo.com.cn
Announcement on Measures of Compensation for Dilution of Return for Current Period due to Public Issuance of Convertible Corporate Bonds and Undertakings of the Relevant Entities (2019-068)
April 24, 2019 http://www.cninfo.com.cn
Proposal of Public Issuance of Convertible Corporate Bonds April 24, 2019 http://www.cninfo.com.cn
Announcement on Acknowledgement of Receipt of Application for Public Issuance of Convertible Corporate Bonds from CSRC (2019-072)
May 22, 2019 http://www.cninfo.com.cn
Announcement on the Commencement of Asset Securitization and Related Party Transactions (2019-078) June 14, 2019 http://www.cninfo.com.cn
Announcement on the Signing of Strategic Cooperation Agreement between a Wholly-owned Subsidiary and China Pacific Insurance (Group) Co., Ltd. (2019-079)
June 18, 2019 http://www.cninfo.com.cn
Announcement on Receiving the “Feedback Notice from CSRC on First Review of Administrative Permission” (2019-081) June 22, 2019 http://www.cninfo.com.cn
Reply to Feedback Opinions Regarding the "Feedback Notice from CSRC on First Review of Administrative Permission (No.191156)” by the Company and Huatai United Securities Co., Ltd.”
July 9, 2019 http://www.cninfo.com.cn
Announcement on Result of Issuance of 2019 Second Tranche of Super Short-Term Commercial Paper by Shenzhen S.F. Taisen Holding (Group) Co., Ltd., a Wholly-owned Subsidiary of the Company (2019-083)
July 13, 2019 http://www.cninfo.com.cn
Announcement on Adjustment to the Proposal of Public Issuance of Convertible Corporate Bonds (2019-089) August 7, 2019 http://www.cninfo.com.cn
Announcement on Measures of Compensation for Dilution of Return for the Current Period due to Public Issuance of Convertible Corporate Bonds and Undertakings of the Relevant Entities (Amendment) (2019-090)
August 7, 2019 http://www.cninfo.com.cn
Feasibility Analysis Report on the Use of Proceeds from Public Issuance of Convertible Corporate Bonds (Amendment) August 7, 2019 http://www.cninfo.com.cn
Proposal of Public Issuance of Convertible Corporate Bonds (Amendment) August 7, 2019 http://www.cninfo.com.cn
Announcement on Consideration and Approval of the Application for Public Issuance of Convertible Corporate Bonds by CSIEC of CSRC(2019-093)
August 26, 2019 http://www.cninfo.com.cn
Announcement on Result of Issuance of 2019 Third Tranche of Super Short-Term Commercial Paper by Shenzhen S.F. Taisen Holding (Group) Co., Ltd., a Wholly-owned Subsidiary of the Company(2019-094)
August 27, 2019 http://www.cninfo.com.cn
XVII. Significant events of subsidiaries
□Applicable √ Not applicable

S.F. Holding Co., Ltd. 2019 Semi-Annual Report
102
Chapter 6 Share Changes & Shareholder Details
I. Changes in shares
1. Changes in shares
Unit: number of shares
Before Change Increase or Decrease (+ or -) After Change
Number of shares Proportion
New sharesissued
Bonus shares
Conversion ofequity reserve
into share capital
Others Subtotal Number of
shares Proportion
I. Restricted sales of shares 3,295,795,745 74.59% - - - -512,162,573 -512,162,573 2,783,633,172 63.06%2.Shares held by state-owned legal person 106,655,020 2.41% - - - -106,655,020 -106,655,020 - 0.00%
3.Other shares held by domestic capital 3,188,979,606 72.17% - - - -405,390,697 -405,390,697 2,783,588,909 63.05%
Of which: Other shares held by domestic legal person
3,094,575,619 70.03% - - - -392,648,480 -392,648,480 2,701,927,139 61.20%
Other shares held by domestic natural person 94,403,987 2.14% - - - -12,742,217 -12,742,217 81,661,770 1.85%
4.Shares held by overseas capital 161,119 0.00% - - - -116,856 -116,856 44,263 0.00%
Of which: Other shares held by
overseas legal person - 0.00% - - - - - - 0.00%
Other shares held by overseas natural person 161,119 0.00% - - - -116,856 -116,856 44,263 0.00%
II. Unrestricted sales of shares 1,122,971,513 25.41% - - - 507,980,580 507,980,580 1,630,952,093 36.94%
1.RMB-denominated ordinary shares 1,122,971,513 25.41% - - - 507,980,580 507,980,580 1,630,952,093 36.94%
III. Total number of shares 4,418,767,258 100.00% - - - -4,181,993 -4,181,993 4,414,585,265 100.00%
Reasons of share changes √ Applicable □Not applicable
At the 18th meeting of the 4th session of the Board and the 2019 first extraordinary general meeting convened by the Company on January 3, 2019 and January 23, 2019 respectively, the “Resolution regarding the Repurchase and Cancellation of Certain Restricted Shares” was considered and approved. Accordingly, the Company was authorised to repurchase and cancel a total of 293,308 restricted shares held by 65 incentive participants who ceased to be eligible for the incentive under the 2017 Restricted Stock Incentive Plan due to their resignation; and the Company was authorised to repurchase and cancel a total of 147,278 restricted shares held by 34 incentive participants who ceased to be eligible for the incentive under the 2018 Restricted Stock Incentive Plan due to their resignation. The total number of restricted shares repurchased for cancellation was 440,586 shares. As of March 13, 2019, the Company has completed the repurchase and cancellation of the aforesaid restricted shares, thus the total share capital of the Company was reduced from 4,418,767,258 shares to 4,418,326,672 shares.
At the 20th meeting of the 4th session of the Board and the 2018 annual general meeting convened by the
Company on March 14, 2019 and April 9, 2019 respectively, the “Resolution regarding the Repurchase and Cancellation of Certain Restricted Shares” was considered and approved. Accordingly, the Company was authorised to repurchase and cancel a total of 1,113,271 restricted shares held by 703 incentive participants who ceased to be eligible for being released of the sales restriction due to failure of the Company to meet the performance assessment requirement for the second post lock-up period; and the Company was authorised to repurchase and cancel a total of 2,628,136 restricted shares held by 1,105 incentive participants who ceased to be eligible for the incentive due to failure of the Company to meet the performance assessment requirement for the first post lock-up period, and by 37 incentive participants who ceased to be eligible for the incentive under the 2018 Restricted Stock Incentive Plan due to their resignation. The total number of restricted shares repurchased for cancellation was 3,741,407 shares. As of June 12, 2019, the Company has completed the repurchase and cancellation of the aforesaid restricted shares, thus the total share capital of the Company was reduced from 4,418,326,672 shares to 4,414,585,265 shares..

S.F. Holding Co., Ltd. 2019 Semi-Annual Report
103
In summary, the total number of shares of the Company changed from 4,418,767,258 shares to 4,414,585,265
shares. Approval of share changes □ Applicable √ Not applicable Transfer of share ownership □ Applicable √ Not applicable Implementation progress of share repurchase √ Applicable □ Not applicable
On January 31, 2019, the Company convened the 19th meeting of the 4th session of the Board at which the
“Resolution regarding the Proposal for Share Repurchase by the Company through Aggregate Auction” was considered and approved. Accordingly, the Company proposed to use internal funds to repurchase part of the shares of the Company through aggregate auction for employee stock ownership plans (ESOP) or share incentives. The total amount of funds for repurchase shall be no less than RMB200 million and no more than RMB400 million, while the repurchase price shall be no more than RMB45 per share and the repurchase period shall be six months from the date of consideration and approval of the repurchase proposal by the Board.
As of April 8, 2019, the Company has repurchased a total of 11,010,729 shares through aggregate auction
with the highest transaction price of RMB37.34 per share and the lowest transaction price of RMB34.48 per share while the total transaction price was RMB395 million (exclusive). The share repurchase has been completed and the shares repurchased are deposited in the special account for repurchased securities of the Company and will subsequently be used for employee stock ownership plans (ESOP) or share incentives. The Company will make appropriate arrangement and timely disclosure in due course. Implementation of share reduction through aggregate auction □ Applicable √ Not applicable Effects of share changes on the basic EPS, diluted EPS, net assets per share attributable to ordinary shareholders of the Company, and other financial indicators for the last year and the last reporting period √ Applicable □ Not applicable During the reporting period, the share capital of the Company decreased by 4,181,993 shares, and the basic EPS, diluted EPS and net assets per share attributable to ordinary shareholders of the Company increased. Other contents that the Company considers necessary, or are required by the securities regulatory authorities, to disclose □ Applicable √ Not applicable

S.F. Holding Co., Ltd. 2019 Semi-Annual Report
104
2. Changes in restricted shares
√ Applicable □Not applicable Unit: number of shares
Name of shareholder
Restricted shares at the
beginning of the period
Number ofrestricted
shares removed in the period
Number ofrestricted
shares increased inthe period
Restricted shares at the end of the
period
Restricted sales reasons
Date of restricted
sales removal
Shenzhen Mingde Holding Development Co., Ltd. 2,701,927,139 - - 2,701,927,139
Commitment for issuing restricted shares for purchasing assets during major asset restructuring
January 23, 2020
Ningbo Shunda Fengrun Investment Management Partnership (Limited Partnership)
156,901,383 156,901,383 - -
Commitment for issuing restricted shares for purchasing assets during major asset restructuring
March 25, 2019
Shenzhen Zhaoguang Investment Co., Ltd. 106,655,020 106,655,020 - -
Commitment for issuing restricted shares for purchasing assets during major asset restructuring
March 25, 2019
Suzhou Industrial Park Oriza Shunfeng Equity Investment Company (Limited Partnership)
106,655,020 106,655,020 - -
Commitment for issuing restricted shares for purchasing assets during major asset restructuring
March 25, 2019
Jiaqiang Shunfeng (Shenzhen) Equity Investment Partnership (Limited Partnership)
106,655,020 106,655,020 - -
Commitment for issuing restricted shares for purchasing assets during major asset restructuring
March 25, 2019
Liu Jilu 75,123,253 7,563,907 - 67,559,346 restricted shares for senior managers
7,563,907 lock-up shares of senior management were unlocked at the beginning of 2019.
Suzhou Guyu Qiuchuang Equity Investment Partnership (Limited Partnership)
21,331,005 21,331,005 - -
Commitment for issuing restricted shares for purchasing assets during major asset restructuring
March 25, 2019
Liu Lingyun 4,456,942 - - 4,456,942 restricted shares for IPO -- Gong Weiping 2,040,640 - - 2,040,640 restricted shares for IPO -- Huang Xuechun 1,735,024 - - 1,735,024 restricted shares for IPO -- Others 12,315,299 6,401,218 - 5,914,081 -- -- Total 3,295,795,745 512,162,573 - 2,783,633,172 -- --
3. Issuance and Listing of Securities
□Applicable √ Not applicable

S.F. Holding Co., Ltd. 2019 Semi-Annual Report
105
II. Total number of shareholders and their holdings
Unit: number of shares
Total number of shareholders at the end of reporting period 60,187
Total number of preferred shareholders with voting rights restored (if any)
-
Shareholders holding more than 5% of shares or shares of the top 10 shareholders
Name of shareholder
Type of shareholder
Shareholding percentage
Number ofshares held atthe end of the
reporting period
Increase ordecrease of
shares during
reporting period
Number ofrestricted
shares held
Number of non-restricte
d shares held
Pledged or frozen shares
Status of shares Amount
Shenzhen Mingde Holding Development Co., Ltd.
Domestic non-state- owned legal person
61.20% 2,701,927,139 - 2,701,927,139 - Pledged 990,000,000
Ningbo Shunda Fengrun Investment Management Partnership (Limited Partnership)
Domestic non-state- owned legal person
7.60% 335,536,715 -37,102,718 - 335,536,715 Pledged 326,049,874
Shenzhen Zhaoguang Investment Co., Ltd.
State-owned legal person 6.04% 266,637,546 - - 266,637,546 - -
Suzhou Industrial Park Oriza Shunfeng Equity Investment Company (Limited Partnership)
Domestic non-state- owned legal person
5.63% 248,358,260 -1,215,700 - 248,358,260 - -
Jiaqiang Shunfeng (Shenzhen) Equity Investment Partnership (Limited Partnership)
Domestic non-state- owned legal person
4.31% 190,051,123 -52,758,666 - 190,051,123 - -
Liu Jilu Domestic natural person
2.04% 90,079,128 - 67,559,346 22,519,782 - -
Suzhou Guyu Qiuchuang Equity Investment Partnership (Limited Partnership)
Domestic non-state- owned legal person
1.21% 53,327,509 - - 53,327,509 - -
Zhongyuan Asset Management Co., Ltd.
State-owned legal person 1.17% 51,472,193 -16,129,000 - 51,472,193 Pledged 45,967,462
Hong Kong Securities Clearing Company Ltd.
Overseas legal person 0.66% 29,339,082 13,735,283 - 29,339,082 - -
Chang'an International Trust Co., Ltd. –Chang'an Trust –Mingsheng Targeted Additional Shares Issuance No. 1 -Capital Trust
Other 0.52% 22,790,565 - - 22,790,565 - -
Additional Shares Strategic investor or general legal person becomes the top 10 shareholder due to the placement of new shares
N/A

S.F. Holding Co., Ltd. 2019 Semi-Annual Report
106
Explain any associated relationship and/or persons acting in concert between the above-mentioned shareholders
The Company is not aware of whether there is an associated relationship between the above mentioned shareholders and whether they are acting in concert.
Top 10 shareholders holding unrestricted shares
Name of shareholder Number of unrestricted shares held at the end of the reporting period
Type of shares Type of shares Quantity
Ningbo Shunda Fengrun Investment Management Partnership (Limited Partnership) 335,536,715 RMB-denominated
ordinary shares 335,536,715
Shenzhen Zhaoguang Investment Co., Ltd. 266,637,546 RMB-denominated ordinary shares 266,637,546
Suzhou Industrial Park Oriza Shunfeng Equity Investment Company (Limited Partnership) 248,358,260 RMB-denominated
ordinary shares 248,358,260
Jiaqiang Shunfeng (Shenzhen) Equity Investment Partnership (Limited Partnership) 190,051,123 RMB-denominated
ordinary shares 190,051,123
Suzhou Guyu Qiuchuang Equity Investment Partnership (Limited Partnership) 53,327,509 RMB-denominated
ordinary shares 53,327,509
Zhongyuan Asset Management Co., Ltd. 51,472,193 RMB-denominated ordinary shares 51,472,193
Hong Kong Securities Clearing Company Ltd. 29,339,082 RMB-denominated ordinary shares 29,339,082
Chang'an International Trust Co., Ltd. - Chang'an Trust - Mingsheng Targeted Additional Shares Issuance No. 1 - Capital Trust
22,790,565RMB-denominated ordinary shares 22,790,565
Liu Jilu 22,519,782 RMB-denominated ordinary shares 22,519,782
National Social Security Fund Combination 503 22,400,031 RMB-denominated ordinary shares 22,400,031
Explain any associated relationship and/or persons acting in concert between the top ten shareholders
The Company is not aware of whether there is an associated relationship between the above-mentioned shareholders and whether they are acting in concert.
Explain the top 10 common shareholders’ participation in margin financing (if any) N/A
Did any of the top 10 common shareholder or the top 10 non-restricted common shareholders of the Company conduct any promissory repurchase during the reporting period? □Yes √ No No such cases in the reporting period. III. Change of controlling shareholder or actual controller
Change of controlling shareholder in the reporting period □Applicable √ Not applicable Controlling shareholder did not change during the reporting period. Change of actual controller during the reporting period □Applicable √ Not applicable The actual controller did not change during the reporting period.

S.F. Holding Co., Ltd. 2019 Semi-Annual Report
107
Chapter 7 Preferred Shares
□Applicable √ Not applicable No such cases in the reporting period.

S.F. Holding Co., Ltd. 2019 Semi-Annual Report
108
Chapter 8 Directors, Supervisors and Senior Managers
I. Changes in shares held by directors, supervisors and senior executives
□Applicable √ Not applicable Shares held by directors, supervisors and senior executives did not change during the reporting period. For details, please refer to the 2018 Annual Report. II. Changes of Directors, Supervisors, and Senior Executives
√Applicable □Not applicable
Name Title Tenure status Date Reason
Zhang Rui Director Resigned March 6, 2019 Resigned as a director due to personal job deployment.
Lo Sai Lai Director, Senior
Executives Resigned March 14, 2019
Resigned as a senior management member due to personal reasons but remained as a director.
Leong Chong Senior Executives Resigned March 14, 2019 Resigned as a senior management
member due to personal reasons.
Deng Weidong Director Elected April 9, 2019 Elected as a director of the Company to fill a vacancy at the 2018 Annual General Meeting.

S.F. Holding Co., Ltd. 2019 Semi-Annual Report
109
Chapter 9 Corporate Bonds
Were there bonds publicly issued and listed on an exchange, and not at maturity, or at maturity but are not fully paid on the approval report date of the semi-annual report? No

110
Chapter 10 Financial Statements
[English Translation for Reference Only]
Review Report
PwC ZT Yue Zi (2019) No. 0028
To the shareholders of S.F. Holding Co., Ltd., We have reviewed the accompanying interim financial statements of S.F. Holding Co., Ltd. (hereinafter “S.F. Holding”), which comprise the consolidated and company balance sheets as at 30 June 2019, the consolidated and company income statements, the consolidated and company cash flow statements and the consolidated and company statements of changes in equity for the 6-month period then ended, and the notes to the interim financial statements. Management of S.F. Holding is responsible for the preparation of these interim financial statements in accordance with the requirements of Accounting Standards for Business Enterprises. Our responsibility is to issue a review report on these interim financial statements based on our review. We conducted our review in accordance with China Standards on Review Engagement No. 2101, “Review of Financial Statements”. These standards require that we plan and perform the review to obtain limited assurance as to whether the interim financial statements are free of material misstatement. A review is limited primarily to inquiries of company personnel and analytical procedures applied to financial data and thus provides less assurance than an audit. We have not performed an audit and, accordingly, we do not express an audit opinion. Based on our review, nothing has come to our attention that causes us to believe that the interim financial statements are not prepared in accordance with Accounting Standards for Business Enterprises or do not present fairly, in all material respects, the consolidated and company’s financial position of S.F. Holding as at 30 June 2019, and their financial performance and cash flows for the period then ended.
PricewaterhouseCoopers Zhong Tian LLP Shanghai, the People’s Republic of China 26 August 2019
Signing CPA Signing CPA
———————— Chen Anqiang ———————— Liu Jingping

111
S.F. HOLDING CO., LTD. CONSOLIDATED BALANCE SHEET AS AT 30 JUNE 2019 (All amounts in RMB Yuan unless otherwise stated) [English translation for reference only]
ASSETS Note 30 June 2019 31 December 2018
Consolidated Consolidated
(Restated) Current assets
Cash at bank and on hand 4(1) 12,487,217,955.15 16,131,119,850.56 Financial assets at fair value
through profit or loss 4(2) - 14,441,978.09 Financial assets held for trading 4(3) 2,525,764,638.79 - Notes receivable 32,582,844.39 20,958,746.36 Accounts receivable 4(4) 8,438,161,191.55 7,352,877,748.87 Advances to suppliers 4(6) 2,445,768,390.66 2,516,851,201.35 Factoring receivables 4(7) 86,935,238.30 447,173,258.65 Loans and advances 4(8) 87,235,941.03 95,070,625.30 Other receivables 4(5) 1,715,646,624.92 1,397,913,483.52 Inventories 4(9) 735,112,901.55 818,050,025.02 Current portion of non-current
assets 4(12) 120,929,410.49 123,197,466.26 Other current assets 4(10) 4,940,497,682.72 3,003,959,574.30
Total current assets 33,615,852,819.55 31,921,613,958.28 Non-current assets
Available-for-sale financial assets 4(11) - 3,423,527,060.27 Long-term receivables 4(12) 474,769,169.71 571,493,790.74 Long-term equity investments 4(13) 2,250,846,960.26 2,203,431,122.03 Investments in other equity
instruments 4(14) 4,042,698,444.01 - Other non-current financial assets 4(15) 405,065,380.55 - Investment properties 4(16) 2,478,519,190.07 2,453,931,501.54 Fixed assets 4(17) 15,090,191,297.79 13,966,702,267.45 Construction in progress 4(18) 6,216,142,800.45 6,507,907,313.07 Intangible assets 4(19) 9,269,904,840.92 6,662,097,473.89 Capitalised development
expenditures 4(20) 613,265,656.66 585,212,743.77 Goodwill 4(21) 3,528,248,763.10 590,365,319.20 Long-term prepaid expenses 4(22) 1,782,624,607.32 1,645,861,187.53 Deferred tax assets 4(38) 721,940,063.72 584,462,905.44 Other non-current assets 4(23) 547,209,537.19 497,962,173.43
Total non-current assets 47,421,426,711.75 39,692,954,858.36 TOTAL ASSETS 81,037,279,531.30 71,614,568,816.64

112
S.F. HOLDING CO., LTD. CONSOLIDATED BALANCE SHEET (CONT’D) AS AT 30 JUNE 2019 (All amounts in RMB Yuan unless otherwise stated) [English translation for reference only]
LIABILITIES AND EQUITY Note 30 June 2019 31 December 2018
Consolidated Consolidated
(Restated) Current liabilities
Short-term borrowings 4(25) 10,329,017,919.04 8,585,129,399.63 Deposits from customers - 10,269,542.51 Accounts payable 4(26) 8,499,813,706.49 7,887,342,829.83 Advances from customers 4(27) 664,518,993.55 467,611,291.44 Employee benefits payable 4(28) 2,527,371,082.02 2,967,467,562.41 Taxes payable 4(29) 780,059,087.93 639,295,980.99 Other payables 4(30) 3,964,347,310.74 4,539,637,152.31 Current portion of non-current
liabilities 4(31) 577,267,751.27 273,222,821.65 Other current liabilities 4(32) 1,020,688,321.41 999,378,905.37
Total current liabilities 28,363,084,172.45 26,369,355,486.14 Non-current liabilities
Long-term borrowings 4(33) 5,922,181,122.48 998,287,835.19 Debentures payable 4(34) 6,408,078,107.07 6,405,035,926.40 Long-term payables 4(35) 106,001,190.04 83,655,025.08 Long-term employee benefits
payable 4(36) 158,643,952.32 142,715,259.71 Deferred income 4(37) 183,382,546.98 152,944,183.19 Deferred tax liabilities 4(38) 1,172,170,806.43 537,090,946.18 Provisions 32,649,557.50 11,540,645.33
Total non-current liabilities 13,983,107,282.82 8,331,269,821.08 Total liabilities 42,346,191,455.27 34,700,625,307.22 Equity
Share capital 4(39) 4,414,585,265.00 4,418,767,258.00 Capital reserve 4(40) 15,985,575,538.97 16,069,619,165.67 Less: Treasury stock 4(41) (454,260,935.24) (200,928,467.28) Other comprehensive income 4(62) 590,851,724.36 527,184,297.85 General risk reserve 185,084,995.61 185,084,995.61 Surplus reserve 4(43) 601,132,890.32 601,132,890.32 Retained earnings 4(44) 17,082,194,039.69 14,960,151,735.98
Total equity attributable to shareholders of the Company 38,405,163,518.71 36,561,011,876.15
Minority interests 4(61) 285,924,557.32 352,931,633.27 Total equity 38,691,088,076.03 36,913,943,509.42 TOTAL LIABILITIES AND EQUITY 81,037,279,531.30 71,614,568,816.64 The accompanying notes form an integral part of these financial statements. Legal representative: Principal in charge of accounting: Head of accounting department:

113
S.F. HOLDING CO., LTD. COMPANY BALANCE SHEET AS AT 30 JUNE 2019 (All amounts in RMB Yuan unless otherwise stated) [English translation for reference only]
ASSETS Note 30 June 2019 31 December 2018 Company Company
Current assets Cash at bank and on hand 16(1) 357,988,702.35 1,136,288,489.11 Advances to suppliers 426,069.14 993,616.34 Other receivables 16(2) 1,119,119,042.98 9,542,466,126.10 Other current assets 161,001.34 255,389.87
Total current assets 1,477,694,815.81 10,680,003,621.42
Non-current assets Long-term receivables 16(3) 7,776,179,035.82 - Long-term equity investments 16(4) 43,348,872,192.32 43,337,179,817.15 Intangible assets 1,453,335.00 1,608,738.18 Capitalised development
expenditures 246,842.25 94,339.62 Long-term prepaid expenses 89,737.68 110,446.38
Total non-current assets 51,126,841,143.07 43,338,993,341.33
TOTAL ASSETS 52,604,535,958.88 54,018,996,962.75

114
S.F. HOLDING CO., LTD. COMPANY BALANCE SHEET (CONT’D) AS AT 30 JUNE 2019 (All amounts in RMB Yuan unless otherwise stated) [English translation for reference only]
LIABILITIES AND EQUITY Note 30 June 2019 31 December 2018 Company Company (Restated)
Current liabilities
Employee benefits payable 697,713.47 603,945.97 Taxes payable 2,998,673.05 8,856,532.95 Other payables 61,796,194.55 204,690,875.26
Total current liabilities 65,492,581.07 214,151,354.18
Total liabilities 65,492,581.07 214,151,354.18
Equity Share capital 4,414,585,265.00 4,418,767,258.00 Capital reserve 46,667,948,714.32 46,760,852,084.19 Less: Treasury stock (454,260,935.24) (200,928,467.28) Surplus reserve 448,087,890.01 448,087,890.01 Retained earnings 1,462,682,443.72 2,378,066,843.65
Total equity 52,539,043,377.81 53,804,845,608.57
TOTAL LIABILITIES AND EQUITY 52,604,535,958.88 54,018,996,962.75 The accompanying notes form an integral part of these financial statements. Legal representative: Principal in charge of accounting: Head of accounting department:

115
S.F. HOLDING CO., LTD. CONSOLIDATED AND COMPANY INCOME STATEMENTS FOR THE SIX MONTHS ENDED 30 JUNE 2019 (All amounts in RMB Yuan unless otherwise stated) [English translation for reference only]
For the six months ended 30 June Item Note 2019 2018 2019 2018
Consolidated Consolidated
(Restated) Company Company 1. Revenue 4(45) 50,074,704,033.85 42,550,906,755.42 - -
Less: Cost of revenue 4(45) (40,152,044,224.73) (34,483,562,144.39) - - Taxes and surcharges 4(46) (121,004,877.04) (110,495,850.13) (30,951.27) - Selling and distribution
expenses 4(47) (884,549,456.76) (973,618,226.32) - - General and administrative
expenses 4(48) (4,843,661,455.94) (3,844,763,325.32) (4,484,483.37) (1,796,327.32) Research and
development expenses 4(49) (509,094,373.89) (403,524,405.16) - - Financial (costs)/income 4(50) (331,609,607.60) (54,420,723.81) 10,098,014.14 12,552,613.87 Including: Interest expenses (432,953,909.77) (290,875,624.94) (1,373,547.25) -
Interest income 140,657,962.96 258,040,873.83 11,482,407.08 12,914,381.13 Add: Other income 4(52) 164,346,392.59 74,730,377.55 - -
Investment income 4(53), 16(5) 386,073,900.85 248,525,092.65 1,929,291.51 99,865,691.77 Including: Investment
losses/ income from associates and joint ventures (50,985,409.53) 8,841,240.97 - -
Gains/(losses) arising from changes in fair value 4(54) 330,207,611.55 (4,812,095.66) - -
Credit impairment losses 4(55) (148,865,353.45) - - - Asset impairment losses 4(56) (54,112,179.14) (26,394,809.33) - - Losses on disposal of
assets 4(57) (12,876,151.73) (6,982,780.03) - -
2. Operating profit 3,897,514,258.56 2,965,587,865.47 7,511,871.01 110,621,978.32 Add: Non-operating income 4(58)(a) 70,153,540.77 59,319,828.95 4,716,981.13 - Less: Non-operating expenses 4(58)(b) (41,761,260.71) (50,577,721.43) - -
3. Total profit 3,925,906,538.62 2,974,329,972.99 12,228,852.14 110,621,978.32
Less: Income tax expenses 4(59) (882,642,296.52) (790,949,730.08) (2,878,075.90) (27,745,494.59)
4. Net profit 3,043,264,242.10 2,183,380,242.91 9,350,776.24 82,876,483.73
Including: Net loss of the acquiree in a business combination involving entities under common control before the combination date - (37,645,258.17) Not applicable Not applicable
Classified by continuity of
operations: Net profit from continuing
operations 3,043,264,242.10 2,183,380,242.91 9,350,776.24 82,876,483.73 Net profit from discontinued
operations - - - - Classified by ownership of the
equity: Attributable to shareholders of
the Company 3,101,111,638.63 2,209,579,126.20 Not applicable Not applicable Minority interests (57,847,396.53) (26,198,883.29) Not applicable Not applicable

116
S.F. HOLDING CO., LTD. CONSOLIDATED AND COMPANY INCOME STATEMENTS (CONT’D) FOR THE SIX MONTHS ENDED 30 JUNE 2019 (All amounts in RMB Yuan unless otherwise stated) [English translation for reference only]
For the six months ended 30 June Item Note 2019 2018 2019 2018
Consolidated Consolidated
(Restated) Company Company 5. Other comprehensive income, net of
tax (8,045,780.57) (78,884,021.39) - - Attributable to shareholders of the
Company, net of tax (8,131,829.98) (77,279,810.72) - - Other comprehensive income items
which will not be reclassified subsequently to profit or loss (21,354,283.70) - - - Losses on changes in fair value of
other equity instruments (21,354,283.70) - - - Other comprehensive income items
which will be reclassified subsequently to profit or loss 4(62) 13,222,453.72 (77,279,810.72) - - Share of the other comprehensive
income of the investee accounted for using equity method which will be reclassified subsequently to profit and loss 4(62) (1,956,923.83) 147,032.76 - -
Losses arising from changes in fair value of available-for-sale financial assets 4(62) - (106,747,986.27) - -
Exchange differences on translation of foreign currency financial statements 4(62) 15,179,377.55 29,321,142.79 - -
Attributable to minority interests, net of tax 4(62) 86,049.41 (1,604,210.67) - -
6. Total comprehensive income 3,035,218,461.53 2,104,496,221.52 9,350,776.24 82,876,483.73
Attributable to shareholders of the
Company 3,092,979,808.65 2,132,299,315.48 Not applicable Not applicable Attributable to minority interests (57,761,347.12) (27,803,093.96) Not applicable Not applicable
7. Earnings per share
Basic earnings per share (RMB Yuan) 4(60) 0.70 0.50 Not applicable Not applicable Diluted earnings per share (RMB Yuan) 4(60) 0.70 0.50 Not applicable Not applicable
The accompanying notes form an integral part of these financial statements. Legal representative: Principal in charge of accounting: Head of accounting department:

117
S.F. HOLDING CO., LTD. CONSOLIDATED AND COMPANY CASH FLOW STATEMENTS FOR THE SIX MONTHS ENDED 30 JUNE 2019 (All amounts in RMB Yuan unless otherwise stated) [English translation for reference only]
For the six months ended 30 June Item Note 2019 2018 2019 2018
Consolidated Consolidated
(Restated) Company Company 1. Cash flows from operating activities Cash received from sales of goods or rendering of
services 53,506,206,887.19 45,461,983,062.52 - - Net decrease in loans to customers 316,421,622.83 31,429,602.95 - - Net decrease in balances with central bank 281,029,856.02 141,588,022.43 - - Refund of taxes and levies 23,210,402.25 9,679,303.24 - - Cash received relating to other operating activities 4(63)(a) 25,624,198,431.13 26,284,180,448.08 18,173,510.83 14,266,553.36 Sub-total of operating cash inflows 79,751,067,199.42 71,928,860,439.22 18,173,510.83 14,266,553.36 Cash paid for purchases of goods and services (32,221,148,364.10) (26,969,529,010.05) - -
Net increase in balances with central bank (10,220,118.69) - - - Cash paid to and on behalf of employees (11,037,158,454.34) (10,281,379,847.75) (760,000.00) (1,480,000.00) Payments of taxes and levies (1,562,682,866.61) (1,760,048,885.14) (8,754,992.46) (26,068,955.22) Cash paid relating to other operating activities 4(63)(b) (30,102,970,846.00) (30,548,293,905.48) (4,927,726.60) (1,663,972.03) Sub-total of operating cash outflows (74,934,180,649.74) (69,559,251,648.42) (14,442,719.06) (29,212,927.25) Net cash flows from/(used in) operating activities 4(64)(a) 4,816,886,549.68 2,369,608,790.80 3,730,791.77 (14,946,373.89) 2. Cash flows used in investing activities Cash received from disposal of investments 144,554,498.39 1,662,632,803.71 - - Cash received from returns on investments 93,138,373.02 156,286,676.14 1,002,167,424.66 1,029,898,124.94 Net cash received from acquisition of subsidiaries - 4,663,360.76 - - Cash received from disposal of fixed assets and
other long-term assets 15,953,688.71 10,371,749.53 - - Net cash received from disposal of subsidiaries and
other business units 201,048,485.80 - - - Cash received relating to other investing activities 4(63)(c) 19,610,047,058.44 19,045,176,118.39 1,005,498,875.49 6,600,000,000.00 Sub-total of investing cash inflows 20,064,742,104.36 20,879,130,708.53 2,007,666,300.15 7,629,898,124.94 Cash paid to acquire fixed assets and other long-
term assets (3,294,575,636.60) (4,454,376,990.19) (2,053,459.01) - Cash paid to acquire investments (781,352,136.83) (1,121,409,294.88) - - Net cash paid to acquire subsidiaries 4(64)(c) (5,167,526,650.16) (20,858,612.00) - - Cash paid relating to other investing activities 4(63)(d) (23,975,039,249.75) (20,282,100,000.00) (1,357,929,526.75) (7,000,452,272.25) Sub-total of investing cash outflows (33,218,493,673.34) (25,878,744,897.07) (1,359,982,985.76) (7,000,452,272.25) Net cash flows (used in)/from investing activities (13,153,751,568.98) (4,999,614,188.54) 647,683,314.39 629,445,852.69

118
S.F. HOLDING CO., LTD. CONSOLIDATED AND COMPANY CASH FLOW STATEMENTS (CONT’D) FOR THE SIX MONTHS ENDED 30 JUNE 2019 (All amounts in RMB Yuan unless otherwise stated) [English translation for reference only]
For the six months ended 30 June Item Note 2019 2018 2019 2018
Consolidated Consolidated
(Restated) Company Company 3. Cash flows from financing activities Cash received from capital contributions 30,299,062.00 131,524,203.19 - 127,294,205.35
Including: Cash received from capital contributions by minority interests of subsidiaries 30,299,062.00 4,229,997.84 - -
Cash received from borrowings 14,472,889,511.02 5,645,533,875.71 - - Cash received relating to other financing
activities 4(63)(e) - 1,090,821,983.52 - - Sub-total of financing cash inflows 14,503,188,573.02 6,867,880,062.42 - 127,294,205.35 Cash repayments of borrowings (7,734,415,458.62) (4,594,115,714.47) - - Cash payments for interest expenses and
distribution of dividends or profits (1,288,529,595.04) (1,272,643,709.50) (926,755,859.89) (970,985,880.70) Cash payments relating to other financing
activities 4(63)(f) (511,724,131.08) (2,217,200,621.62) (502,850,246.57) (376,192.07) Sub-total of financing cash outflows (9,534,669,184.74) (8,083,960,045.59) (1,429,606,106.46) (971,362,072.77) Net cash flows from/(used in) financing
activities 4,968,519,388.28 (1,216,079,983.17) (1,429,606,106.46) (844,067,867.42) 4. Effect of foreign exchange rate changes
on cash and cash equivalents (2,915,022.58) 13,365,658.73 (126.46) (206.91) 5. Net decrease in cash and cash equivalents 4(64)(a) (3,371,260,653.60) (3,832,719,722.18) (778,192,126.76) (229,568,595.53) Add: Cash and cash equivalents at the
beginning of the period 15,299,270,711.01 16,149,528,832.49 1,136,148,582.11 1,046,986,313.39 6. Cash and cash equivalents at the end of
the period 4(64)(a) 11,928,010,057.41 12,316,809,110.31 357,956,455.35 817,417,717.86
The accompanying notes form an integral part of these financial statements. Legal representative: Principal in charge of accounting: Head of accounting department:

119
S.F. HOLDING CO., LTD. CONSOLIDATED STATEMENT OF CHANGES IN EQUITY FOR THE SIX MONTHS ENDED 30 JUNE 2019 (All amounts in RMB Yuan unless otherwise stated) [English translation for reference only] Equity attributable to shareholders of the parent company
Note Share capital Capital reserve Less: Treasury
stock
Other comprehensive
income General risk
reserve Special reserve Surplus reserve Retained earnings Minority interests Total equity
Balance at 31 December 2017 4,411,015,524.00 16,086,543,402.55 - 219,830,232.83 95,759,396.32 - 586,501,527.41 11,478,728,731.98 51,805,434.40 32,930,184,249.49
Movements for the six months
ended 30 June 2018 Total comprehensive income
Net profit - - - - - - - 2,209,579,126.20 (26,198,883.29) 2,183,380,242.91 Other comprehensive income - - - (77,279,810.72) - - - - (1,604,210.67) (78,884,021.39) Total comprehensive income for
the year - - - (77,279,810.72) - - - 2,209,579,126.20 (27,803,093.96) 2,104,496,221.52 Capital contribution and withdrawal
by shareholders Share-based payment in capital
contribution by shareholders 4(40) 7,788,643.00 194,466,894.22 (202,255,537.22) - - - - - - - Share-based payment included in
equity 9(1) - 23,930,346.08 - - - - - - - 23,930,346.08 Capital contribution by
shareholders - - - - - - - - 54,094,150.38 54,094,150.38 Others 4(40) - (9,300,026.82) - - - - - - 9,721,353.92 421,327.10
Business combinations involving entities under common control - (43,617,193.55) - - - - - - - (43,617,193.55)
Profit distribution Distribution to shareholders 4(44) - - - - - - - (970,985,880.70) - (970,985,880.70)
Other movements in capital reserve 4(40) - (269,027.26) - - - - - - - (269,027.26) Safety reserve
Appropriation 4(42) - - - - - 2,727,907.70 - - - 2,727,907.70 Utilisation 4(42) - - - - - (2,727,907.70) - - - (2,727,907.70)
Balance at 30 June 2018 4,418,804,167.00 16,251,754,395.22 (202,255,537.22) 142,550,422.11 95,759,396.32 - 586,501,527.41 12,717,321,977.48 87,817,844.74 34,098,254,193.06

120
S.F. HOLDING CO., LTD. CONSOLIDATED STATEMENT OF CHANGES IN EQUITY (CONT’D) FOR THE SIX MONTHS ENDED 30 JUNE 2019 (All amounts in RMB Yuan unless otherwise stated) [English translation for reference only] Equity attributable to shareholders of the parent company
Note Share capital Capital reserve Less: Treasury
stock
Other comprehensive
income General risk
reserve Special reserve Surplus reserve Retained earnings
Minority interests Total equity
Balance at 31 December 2018 4,418,767,258.00 16,069,619,165.67 (200,928,467.28) 527,184,297.85 185,084,995.61 - 601,132,890.32 14,960,151,735.98 352,931,633.27 36,913,943,509.42 Changes in accounting policies - - - 17,465,097.74 - - - - - 17,465,097.74 Balance at 1 January 2019 4,418,767,258.00 16,069,619,165.67 (200,928,467.28) 544,649,395.59 185,084,995.61 - 601,132,890.32 14,960,151,735.98 352,931,633.27 36,931,408,607.16
Movements for the six months
ended 30 June 2019 Total comprehensive income
Net profit - - - - - - - 3,101,111,638.63 (57,847,396.53) 3,043,264,242.10 Other comprehensive income - - - (8,131,829.98) - - - - 86,049.41 (8,045,780.57) Total comprehensive income for
the year - - - (8,131,829.98) - - - 3,101,111,638.63 (57,761,347.12) 3,035,218,461.53 Capital contribution and withdrawal
by shareholders Capital contribution by
shareholders - 16,277,032.73 - - - - - - 14,022,029.27 30,299,062.00 Share repurchases 4(41) - - (394,996,314.03) - - - - - - (394,996,314.03) Changes in Share-based
payment restricted shares 4(41) (4,181,993.00) (104,584,725.90) 141,160,053.20 - - - - - - 32,393,334.30 Share-based payment included in
equity 9(1) - 14,581,133.08 - - - - - - 1,016,579.73 15,597,712.81 Others 4(40) - (11,159,460.36) - - - - - - (24,284,337.83) (35,443,798.19)
Transfer within equity Transfer from other
comprehensive income to retained earnings - - - 54,334,158.75 - - - (54,334,158.75) - -
Profit distribution
Distribution to shareholders 4(41) 4(44) - - 503,792.87 - - - - (924,735,176.17) - (924,231,383.30)
Other movements in capital reserve 4(40) - 842,393.75 - - - - - - - 842,393.75 Safety reserve
Appropriation 4(42) - - - - - 3,776,493.37 - - - 3,776,493.37 Utilisation 4(42) - - - - - (3,776,493.37) - - - (3,776,493.37)
Balance at 30 June 2019 4,414,585,265.00 15,985,575,538.97 (454,260,935.24) 590,851,724.36 185,084,995.61 - 601,132,890.32 17,082,194,039.69 285,924,557.32 38,691,088,076.03
The accompanying notes form an integral part of these financial statements. Legal representative: Principal in charge of accounting: Head of accounting department:

121
S.F. HOLDING CO., LTD. COMPANY STATEMENT OF CHANGES IN EQUITY FOR THE SIX MONTHS ENDED 30 JUNE 2019 (All amounts in RMB Yuan unless otherwise stated) [English translation for reference only]
Note Share capital Capital reserve Less: Treasury
stock Surplus reserve Retained earnings Total equity
Balance at 1 January 2018 4,411,015,524.00 46,530,971,136.14 - 433,456,527.10 3,217,052,890.78 54,592,496,078.02 Movements for the six months
ended 30 June 2018
Total comprehensive income Net profit - - - - 82,876,483.73 82,876,483.73
Capital contribution and withdrawal by shareholders Share-based payment in capital
contribution by shareholders 7,788,643.00 194,466,894.22 (202,255,537.22) - - - Share-based payment included
in equity - 22,900,543.05 - - - 22,900,543.05 Others - (77,651.25) - - - (77,651.25)
Profit distribution Distribution to shareholders - - - - (970,985,880.70) (970,985,880.70)
Balance at 30 June 2018 4,418,804,167.00 46,748,260,922.16 (202,255,537.22) 433,456,527.10 2,328,943,493.81 53,727,209,572.85
Balance at 1 January 2019 4,418,767,258.00 46,760,852,084.19 (200,928,467.28) 448,087,890.01 2,378,066,843.65 53,804,845,608.57 Movements for the six months
ended 30 June 2019
Total comprehensive income Net profit - - - - 9,350,776.24 9,350,776.24
Capital contribution and withdrawal by shareholders Share repurchases 4(41) - - (394,996,314.03) - - (394,996,314.03) Changes in Share-based
payment restricted shares 4(41) (4,181,993.00) (104,584,725.90) 141,160,053.20 - - 32,393,334.30 Share-based payment included
in equity - 11,681,356.03 - - - 11,681,356.03 Profit distribution
Distribution to shareholders 4(41) 4(44) - - 503,792.87 - (924,735,176.17) (924,231,383.30)
Balance at 30 June 2019 4,414,585,265.00 46,667,948,714.32 (454,260,935.24) 448,087,890.01 1,462,682,443.72 52,539,043,377.81
The accompanying notes form an integral part of these financial statements. Legal representative: Principal in charge of accounting: Head of accounting department:

S.F. HOLDING CO., LTD. NOTES TO THE FINANCIAL STATEMENTS FOR THE SIX MONTHS ENDED 30 JUNE 2019 (All amounts in RMB Yuan unless otherwise stated) [English translation for reference only]
122
1 General information and historical development S.F. Holding Co., Ltd. (formerly “Ma’anshan Dingtai Rare Earth and New Materials Co., Ltd.”, hereinafter “S.F. Holding” or “the Company”), formerly known as Ma’anshan Dingtai Science & Technology Co., Ltd., was established by 11 natural persons including Liu Jilu and the Labour Union of Ma'anshan Dingtai Metallic Products Co., Ltd. by cash contribution on 13 May 2003. Initiated by the original shareholders of the Company, the Company was formally changed as Maanshan Dingtai Rare Earth and New Materials Co., Ltd. with a registered capital of RMB 50 million as approved by the shareholders’ meeting on 18 October 2007 and the inaugural meeting on 22 October 2007. On 11 January 2010, the Company successfully issued 19,500,000 ordinary shares at par value of RMB 1.00 per share at Shenzhen Stock Exchange under the Regulatory Permission [2010] No. 41 as approved by China Securities Regulatory Commission. The outstanding shares were listed for trading at Shenzhen Stock Exchange on 5 February 2010. After the shares were issued, the total share capital of the Company was changed to 77,830,780 shares. Pursuant to the Proposal on the Profit Distribution Plan for 2014 approved by 2014 annual shareholders’ meeting held by the Company on 19 May 2015, the Company converted capital reserve into new shares on the basis of 5 shares for every 10 existing shares, with 77,830,780 shares in total at the end of 2014 as base. After the conversion, the total share capital of the Company was increased by 38,915,390 shares to 116,746,170 shares. Pursuant to the Proposal on the Profit Distribution Plan for 2015 approved by the 2015 annual shareholders’ meeting held by the Company on 17 May 2016, the Company, with 116,746,170 shares in total at the end of 2015 as base, converted capital reserve into new shares on the basis of 10 shares for every 10 existing shares. After the conversion, the total share capital of the Company was increased by 116,746,170 shares to 233,492,340 shares. Pursuant to the resolution of the 13th session of the third Board of Directors of the Company dated 22 May 2016 and relevant resolutions approved on the first interim shareholders’ meeting in 2016 held by the Company on 30 June 2016, including the Resolution concerning the Company Qualifying for Criteria for Major Assets Restructuring of Listed Companies, the Resolution on Related-party Transaction Composed of Major Assets Swap and Issuing Shares to Purchase Assets and Raise Matching Fund and the Resolution on ‘Major Assets Swap and Issuing Shares to Purchase Assets and Raise Matching Fund and Related-party Transaction Report (Draft) of Maanshan Dingtai Rare Earth and New Materials Co., Ltd.’ and Summaries, the Company conducted a series of major assets restructuring as follows:

S.F. HOLDING CO., LTD. NOTES TO THE FINANCIAL STATEMENTS FOR THE SIX MONTHS ENDED 30 JUNE 2019 (All amounts in RMB Yuan unless otherwise stated) [English translation for reference only]
123
1 General information and historical development (Cont’d)
(1) Major assets swap In December 2016, the Company swapped all the assets and liabilities (“exchange-out assets”) it held as at 31 December 2015 (“assessment base date”) for the equivalent portion (“exchange-in assets”) of 68.40%, 9.93%, 6.75%, 6.75%, 6.75%, 1.35% and 0.07% of the equities in Shenzhen S.F. Taisen Holdings (Group) Co., Ltd. (formerly “S.F. Holding (Group) Co., Ltd.”, hereinafter “Taisen Holdings”) respectively held by Shenzhen Mingde Holdings Development Co., Ltd. (hereinafter “Mingde Holdings”), Ningbo Shunda Fengrun Investment Management Partnership (Limited Partnership) (hereinafter “Shunda Fengrun”), Jiaqiang Shunfeng (Shenzhen) Equity Investment Partnership (Limited Partnership) (hereinafter “Jiaqiang Shunfeng”), Shenzhen Zhaoguang Investment Co., Ltd. (hereinafter “Zhaoguang Investment”), Suzhou Industrial Park Oriza Shunfeng Equity Investment Company (Limited Partnership) (hereinafter “Oriza Shunfeng”), Suzhou Guyu Qiuchuang Equity Investment Partnership (Limited Partnership) (hereinafter “Guyu Qiuchuang”) and Ningbo Shunxin Fenghe Investment Management Partnership (Limited Partnership) (hereinafter “Shunxin Fenghe”). For this transaction, the exchange-out assets were priced at RMB 796 million and the exchange-in assets were priced at RMB 43.30 billion. Pursuant to the second interim shareholders’ meeting in 2016 dated 28 December 2016 (hereinafter “restructuring date”), the Company approved and reelected a new Board of Directors, which indicated the completion of major assets swap transaction and the successful listing of Taisen Holding on Shenzhen Stock Exchange through back door listing.
(2) Issuing shares to purchase assets In December 2016, the Company issued 3,950,185,873 ordinary shares (A shares) at par value of RMB 1.00 per share at an issuing price of RMB 10.76 per share to Mingde Holdings, Shunda Fengrun, Jiaqiang Shunfeng, Zhaoguang Investment, Oriza Shunfeng, Guyu Qiu Chuang and Shun Xin Feng He to cover the difference of the above swap (RMB 42,504,000,000). The difference between the value of shares and the share capital amounting to RMB 38,553,814,120.48 was recognised as capital reserve. The total share capital was changed to 4,183,678,213 shares. After the new shares were issued, Mingde Holdings, Shunda Fengrun, Jiaqiang Shunfeng, Zhaoguang Investment, Oriza Shunfeng and other shareholders held 64.58%, 9.38%, 6.37%, 6.37%, 6.37% and 6.92% respectively of the equities in the Company. China Securities Regulatory Commission approved the above assets restructuring plan of the Company on 12 December 2016. The share change above was verified by PricewaterhouseCoopers Zhong Tian LLP with a capital verification report of PwC ZT Yan Zi (2016) No. 1757 issued on 28 December 2016. The Company registered the additional 3.95 billion shares at China Securities Depository and the Clearing Corporation Limited Shenzhen Branch on 18 January 2017.

S.F. HOLDING CO., LTD. NOTES TO THE FINANCIAL STATEMENTS FOR THE SIX MONTHS ENDED 30 JUNE 2019 (All amounts in RMB Yuan unless otherwise stated) [English translation for reference only]
124
1 General information and historical development (Cont’d)
(3) Raising matching fund In July 2017, the Company issued 227,337,311 ordinary shares (A shares) at par value of RMB 1.00 per share to specific investors through non-public offering at RMB 35.19 per share. The total fund raised amounted to RMB 7,999,999,974.09. Net of underwriter and sponsor’s fees and other transaction costs, the net fund raised amounted to RMB 7,822,179,636.78, including an increment of share capital of RMB 227,337,311.00 and an increment of capital reserve by RMB 7,604,681,212.80. The aforesaid fund was received on 31 July 2017 and verified by PricewaterhouseCoopers Zhong Tian LLP with a capital verification report of PwC ZT Yan Zi (2017) No. 745 issued. The Company registered the additional shares at China Securities Depository and the Clearing Corporation Limited Shenzhen Branch on 15 August 2017. The total share capital was changed to 4,411,015,524 shares. Mingde Holdings, Shunda Feng Run, Jiaqiang Shunfeng, Zhaoguang Investment, Oriza Shunfeng and other shareholders held 61.25%, 8.89%, 6.04%, 6.04%, 6.04% and 11.74% of the equities in the Company respectively. Afterwards, the Company conducted several restricted shares incentive plans and share repurchase measures (Note 9(2)(a)). Therefore, the total share capital of the Company as at 30 June 2019 was changed to 4,414,585,265.00 shares and such change was verified by Chinese Certified Public Accountant.

S.F. HOLDING CO., LTD. NOTES TO THE FINANCIAL STATEMENTS FOR THE SIX MONTHS ENDED 30 JUNE 2019 (All amounts in RMB Yuan unless otherwise stated) [English translation for reference only]
125
1 General information and historical development (Cont’d) The approved business scope of the Company and its subsidiaries (hereinafter “the Group”) changes to: assets management, capital management, investment management (trusts, financial assets management and security assets management are not allowed); auto rent (excluding auto rent with driver); enterprise headquarters management; customs brokerage, inspection brokerage; investment in industries; domestic trade; marketing planning; investment consultancy and other information consultancy (excluding human resources intermediary service, securities and restricted projects); engagement in the development of network technology, information technology and electronic product technology and related technology services, consultancy and transfer of network technology, and provision of network information, E-Commerce service platform, business management, business investment, investment management consultancy, investment management, enterprise management consulting, etc.; call centre business and information service (both are second type value-added telecommunication services) and road transportation of common cargo; international freight forwarding for air transportation and road transportation of imported and exported goods or transit goods, including solicitation, booking, shipping, warehousing and packaging; type-1 and type-2 (international and domestic) sales agency of air transport; common cargo transportation, stowage and logistics services; science and technology information consulting, project investment consulting and logistics information consulting; data processing; research and development and sales of communication equipment, and related technology services (projects subject to approval could only be implemented after approval by relevant authorities), research and development of unmanned aerial vehicle(“UAV”) and spare parts; supply chain management and related supporting services, and engagement in both export and import business; development, construction and operation of industrial park; property management; self-owned property leasing; network marketing promotion; E-Commerce training; information technology outsourcing and information services outsourcing; data mining, data analysis and data services; development and application of general software, industry application software and embedded software; operation of on-line trading, on-line consulting, on-line auction and on-line advertising; network business service and database service; services in respect of development and application of electronic government affairs system; communications industry value-added business services; international freight forwarding, domestic and international express (excluding business exclusively operated by postal enterprises), transportation of cargo shipping containers and large objects, economic and technical consulting, technical information consulting, and engagement in commercial activities by way of franchising; transport services of domestic (including Hong Kong, Macau and Taiwan) and international aviation cargo and related services, and import and export of goods and technology; cargo express agent services; international freight forwarding (excluding shipping agency business), loading, unloading and handling; international and domestic freight forwarding; technology development of software and hardware for financial payment systems; internet payment, bank card acquiring, supply chain management; non-securities equity investment activities and relevant consulting services; finance leasing; leasing; purchase of leased property from home and abroad; residual value processing and maintenance of leased property; leasing consulting; commercial factoring related to main operating activities; delivery of goods; freight equipment leasing; container yard operation and container leasing service; railway cargo transportation; ship freight; product marketing design and planning for enterprises and individuals and related business agency services; non-vessel operating common carrier business; international maritime freight forwarding; financial information consulting, financial outsourcing services commissioned by financial institutions, building construction engineering, and warehousing and transport of medicine, medical equipment and food. First-tier and second-tier subsidiaries included in the consolidation scope of the financial statements are detailed in Note 6(1). The changes in the scope of consolidation for the current period are set out in Note 5. As at 30 June 2019, Mingde Holdings was the parent company and ultimate controlling company of the Company. These financial statements were authorised for issue by the Board of Directors of the Company on 26 August 2019.

S.F. HOLDING CO., LTD. NOTES TO THE FINANCIAL STATEMENTS FOR THE SIX MONTHS ENDED 30 JUNE 2019 (All amounts in RMB Yuan unless otherwise stated) [English translation for reference only]
126
2 Summary of significant accounting policies and accounting estimates The Group determines the specific accounting policies and estimates based on its features of production and operation, primarily comprising the methods of provision for expected credit losses on loans and receivables (Note 2(9)), valuation of inventories (Note 2(10)), measurement model of investment properties (Note 2(12)), depreciation of fixed assets and amortisation of intangible assets (Note 2(13), (16)), criterion for capitalisation of capitalised development expenditures (Note 2(17)), recognition and measurement of revenue (Note 2(25)), etc. Details of the Group's critical judgements used in determining significant accounting policies are set forth in Note 2(30).
(1) Basis of preparation The financial statements are prepared in accordance with the Accounting Standards for Business Enterprises - Basic Standard, and the specific accounting standards and other relevant regulations issued by the Ministry of Finance on 15 February 2006 and in subsequent periods (hereafter collectively referred to as “the Accounting Standards for Business Enterprises” or “CASs”) and the disclosure requirements in the Preparation Convention of Information Disclosure by Companies Offering Securities to the Public No.15 - General Rules on Financial Reporting issued by the China Securities Regulatory Commission. The financial statements are prepared on a going concern basis.
(2) Statement of compliance with the Accounting Standards for Business Enterprises The financial statements of the Company for the six months ended 30 June 2019 are in compliance with the Accounting Standards for Business Enterprises, and truly and completely present the consolidated and company financial position as at 30 June 2019 and their financial performance, cash flows and other information for the period then ended.
(3) Accounting year The Company’s accounting year starts on 1 January and ends on 31 December.

S.F. HOLDING CO., LTD. NOTES TO THE FINANCIAL STATEMENTS FOR THE SIX MONTHS ENDED 30 JUNE 2019 (All amounts in RMB Yuan unless otherwise stated) [English translation for reference only]
127
2 Summary of significant accounting policies and accounting estimates (Cont’d)
(4) Recording currency The Company’s recording currency is Renminbi (RMB). The Company’s subsidiaries decide their recording currencies in line with the economic environments in which they operate, while the subsidiaries in Hong Kong and abroad mainly adopt currencies including HKD, EUR and etc. as their recording currencies. The financial statements are presented in RMB.
(5) Business combinations
(a) Business combinations involving enterprises under common control The consideration paid and net assets obtained by the acquirer in a business combination are measured at the carrying amount. If the acquiree is acquired from a third party by the ultimate controlling party in a prior year, the consideration paid and net assets obtained by the acquirer are measured based on the carrying amounts of the acquiree’s assets and liabilities (including the goodwill arising from the acquisition of the acquiree by the ultimate controlling party) presented in the consolidated financial statements of the ultimate controlling party. The difference between the carrying amount of the net assets obtained from the combination and the carrying amount of the consideration paid for the combination is treated as an adjustment to capital reserve (share premium). If the capital reserve (share premium) is not sufficient to absorb the difference, the remaining balance is adjusted against retained earnings. Costs directly attributable to the business combination are included in profit or loss in the period in which they are incurred. Transaction costs associated with the issue of equity or debt securities for the business combination are included in the initially recognised amounts of the equity or debt securities.
(b) Business combinations involving enterprises not under common control The combination cost and identifiable net assets obtained by the acquirer in a business combination are measured at fair value at the acquisition date. Where the combination cost exceeds the acquirer's interest in the fair value of the acquiree's identifiable net assets, the difference is recognised as goodwill; where the combination cost is lower than the acquirer's interest in the fair value of the acquiree's identifiable net assets, the difference is recognised in profit or loss for the current period. Costs directly attributable to the combination are included in profit or loss in the period in which they are incurred. Transaction costs associated with the issue of equity or debt securities for the business combination are included in the initially recognised amounts of the equity or debt securities.

S.F. HOLDING CO., LTD. NOTES TO THE FINANCIAL STATEMENTS FOR THE SIX MONTHS ENDED 30 JUNE 2019 (All amounts in RMB Yuan unless otherwise stated) [English translation for reference only]
128
2 Summary of significant accounting policies and accounting estimates (Cont’d)
(6) Preparation of consolidated financial statements The consolidated financial statements comprise the financial statements of the Company and all of its subsidiaries. Subsidiaries are consolidated from the date on which the Group obtains control and are de-consolidated from the date on which such control ceases. For a subsidiary that is acquired in a business combination involving enterprises under common control, it is included in the consolidated financial statements from the date when it, together with the Company, comes under common control of the ultimate controlling party. The portion of the net profits realised before the combination date is presented separately in the consolidated income statement. In preparing the consolidated financial statements, where the accounting policies and the accounting periods of the Company and subsidiaries are inconsistent, the financial statements of the subsidiaries are adjusted in accordance with the accounting policies and the accounting period of the Company. For subsidiaries acquired from business combinations involving enterprises not under common control, the individual financial statements of the subsidiaries are adjusted based on the fair value of the identifiable net assets at the acquisition date. All significant intra-group balances, transactions and unrealised profits are eliminated in the consolidated financial statements. The portion of subsidiaries’ equity and the portion of subsidiaries’ net profit or loss and comprehensive income for the period not attributable to the Company are recognised as minority interests, minority interest income and total comprehensive income attributable to minority shareholders and presented separately in the consolidated financial statements under equity, net profit and total comprehensive income respectively. Unrealised profits and losses resulting from the sale of assets by the Company to its subsidiaries are fully eliminated against net profit attributable to owners of the parent. Unrealised profits and losses resulting from the sale of assets by a subsidiary to the Company are eliminated and allocated between net profit attributable to owners of the parent and minority interest income in accordance with the allocation proportion of the parent in the subsidiary. Unrealised profits and losses resulting from the sale of assets by one subsidiary to another are eliminated and allocated between net profit attributable to owners of the parent and minority interest income in accordance with the allocation proportion of the parent in the selling subsidiary. If the accounting treatment of a transaction is inconsistent in the financial statements at the Group level and at the Company or its subsidiary level, adjustment will be made from the perspective of the Group.
(7) Cash and cash equivalents Cash and cash equivalents comprise cash on hand, deposits that can be readily drawn on demand, and short-term and highly liquid investments that are readily convertible to known amounts of cash and which are subject to an insignificant risk of changes in value.

S.F. HOLDING CO., LTD. NOTES TO THE FINANCIAL STATEMENTS FOR THE SIX MONTHS ENDED 30 JUNE 2019 (All amounts in RMB Yuan unless otherwise stated) [English translation for reference only]
129
2 Summary of significant accounting policies and accounting estimates (Cont’d)
(8) Foreign currency translation
(a) Foreign currency transactions Foreign currency transactions are translated into recording currency using the spot exchange rates and approximate exchange rates prevailing at the dates of the transactions. At the balance sheet date, monetary items denominated in foreign currencies are translated into recording currency using the spot exchange rates on the balance sheet date. Exchange differences arising from these translations are recognised in profit or loss for the current period, except for those attributable to foreign currency borrowings that have been taken out specifically for acquisition or construction of qualifying assets, which are capitalised as part of the cost of those assets. Non-monetary items denominated in foreign currencies that are measured at historical costs are translated at the balance sheet date using the spot exchange rates at the date of the transactions. The effect of exchange rate changes on cash is presented separately in the cash flow statement.
(b) Translation of foreign currency financial statements The asset and liability items in the balance sheets for overseas operations are translated at the spot exchange rates on the balance sheet date. Among the equity items, the items other than “retained earnings” are translated at the spot exchange rates of the transaction dates. The income and expense items in the income statement of foreign operations are translated at the spot exchange rates of the transaction dates. The differences arising from the above translation are recognised in other comprehensive income. The cash flows of foreign operations are translated at the spot exchange rates on the dates of the cash flows. The effect of exchange rate changes on cash is presented separately in the cash flow statement.
(9) Financial instruments A financial instrument is any contract that gives rise to a financial asset of one entity and a financial liability or equity instrument of another entity. A financial asset or a financial liability is recognised when the Group becomes a party to the contractual provisions of the instrument.
(a) Financial assets
(i) Classification and measurement Based on the business model for managing the financial assets and the contractual cash flow characteristics of the financial assets, financial assets are classified as: (1) financial assets at amortised cost; (2) financial assets at fair value through other comprehensive income; (3) financial assets at fair value through profit or loss.

S.F. HOLDING CO., LTD. NOTES TO THE FINANCIAL STATEMENTS FOR THE SIX MONTHS ENDED 30 JUNE 2019 (All amounts in RMB Yuan unless otherwise stated) [English translation for reference only]
130
2 Summary of significant accounting policies and accounting estimates (Cont’d)
(9) Financial instruments (Cont’d) (a) Financial assets (Cont’d) (i) Classification and measurement (Cont’d)
The financial assets are measured at fair value at initial recognition. Related transaction costs that are attributable to the acquisition of the financial assets are included in the initially recognised amounts, except for the financial assets at fair value through profit or loss, the related transaction costs of which are recognised directly in profit or loss for the current period. Accounts receivable or notes receivable arising from sales of products or rendering of services (excluding or without regard to significant financing components) are initially recognised at the consideration that is entitled to be charged by the Group as expected. Debt instruments The debt instruments held by the Group refer to the instruments that meet the definition of financial liabilities from the perspective of the issuer, and are measured in the following ways: Measured at amortised cost: The objective of the Group’s business model is to hold the financial assets to collect the contractual cash flows, and the contractual cash flow characteristics are consistent with a basic lending arrangement, which gives rise on specified dates to the contractual cash flows that are solely payments of principal and interest on the principal amount outstanding. The interest income of such financial assets is recognised using the effective interest method. Such financial assets mainly comprise cash at bank and on hand, notes receivable, accounts receivable, Factoring receivables, loans and advances, other receivables and long-term receivables. Long-term receivables that are due within one year (inclusive) as from the balance sheet date are included in the current portion of non-current assets. Measured at fair value through profit or loss: Debt instruments held by the Group that are not divided into those at amortised cost, or those measured at fair value through other comprehensive income, are measured at fair value through profit or loss and included in financial assets held for trading. At initial recognition, the Group designates a portion of financial assets as at fair value through profit or loss to eliminate or significantly reduce an accounting mismatch. Financial assets that are due within one year (inclusive) as from the balance sheet date and are expected to be held over one year are included in other non-current financial assets.

S.F. HOLDING CO., LTD. NOTES TO THE FINANCIAL STATEMENTS FOR THE SIX MONTHS ENDED 30 JUNE 2019 (All amounts in RMB Yuan unless otherwise stated) [English translation for reference only]
131
2 Summary of significant accounting policies and accounting estimates (Cont’d)
(9) Financial instruments (Cont’d)
(a) Financial assets (Cont’d)
(i) Classification and measurement (Cont’d) Equity instruments Investments in equity instruments, over which the Group has no control, joint control or significant influence, are measured at fair value through profit or loss under financial assets held for trading; investments in equity instruments expected to be held over one year as from the balance sheet date are included in other non-current financial assets. In addition, a portion of certain investments in equity instruments not held for trading are designated as financial assets at fair value through other comprehensive income under other investments in equity instruments. The relevant dividend income of such financial assets is recognised in profit or loss for the current period.
(ii) Impairment The Group confirms the loss provision based on expected credit losses for financial assets measured at amortised cost. Giving consideration to reasonable and supportable information on past events, current conditions and forecasts of future economic conditions, as well as the default risk weight, the Group recognises the expected credit loss ("ECL") as the probability-weighted amount of the present value of the difference between the cash flows receivable from the contract and the cash flows expected to collect. As at each balance sheet date, the expected credit losses of financial instruments at different stages are measured respectively. 12-month ECL provision is recognised for financial instruments in Stage 1 that have not had a significant increase in credit risk since initial recognition; lifetime ECL provision is recognised for financial instruments in Stage 2 that have had a significant increase in credit risk yet without credit impairment since initial recognition; and lifetime ECL provision is recognised for financial instruments in Stage 3 that have had credit impairment since initial recognition.

S.F. HOLDING CO., LTD. NOTES TO THE FINANCIAL STATEMENTS FOR THE SIX MONTHS ENDED 30 JUNE 2019 (All amounts in RMB Yuan unless otherwise stated) [English translation for reference only]
132
2 Summary of significant accounting policies and accounting estimates (Cont’d)
(9) Financial instruments (Cont’d)
(a) Financial assets (Cont’d)
(ii) Impairment (Cont’d) For the financial instruments with lower credit risk on the balance sheet date, the Group assumes there is no significant increase in credit risk since initial recognition and recognises the 12-month ECL provision. For the financial instruments in Stage 1, Stage 2 and with lower credit risk, the Group calculates the interest income by applying the effective interest rate to the gross carrying amount (before deduction of the impairment provision). For the financial instrument in Stage 3, the interest income is calculated by applying the effective interest rate to the amortised cost (after deduction of the impairment provision from the gross carrying amount). For notes and accounts receivables, the Group recognises the lifetime expected credit loss provision regardless of whether there exists a significant financing component. In case the expected credit losses of an individually assessed financial asset cannot be evaluated with reasonable cost, the Group divides the receivables into certain groupings based on credit risk characteristics, and calculates the expected credit losses for the groupings. Basis for determine groupings is as follows: Bank acceptance notes Group of bank notes with low credit risk Accounts receivables and other receivables Group of receivables from related parties Accounts receivables and other receivables Group of receivables from non-related parties Long-term receivables Group of finance lease Long-term receivables Group of Interest-free loans to employees Based on the exposure at default and the lifetime expected credit loss rate, the Group calculates the expected credit losses of notes and accounts receivables that are classified into groupings with consideration to historical credit losses experience, current conditions and forecasts of future economic conditions. Based on the exposure at default and the 12-month/lifetime expected credit loss rate, the Group calculates the expected credit losses of other receivables, Factoring receivables, loans and advances, and long-term receivables that are classified into groupings with consideration to historical credit losses experience, the current conditions and forecasts of future economic conditions. The Group recognises the loss provision made or reversed into profit or loss for the current period.

S.F. HOLDING CO., LTD. NOTES TO THE FINANCIAL STATEMENTS FOR THE SIX MONTHS ENDED 30 JUNE 2019 (All amounts in RMB Yuan unless otherwise stated) [English translation for reference only]
133
2 Summary of significant accounting policies and accounting estimates (Cont’d)
(9) Financial instruments (Cont’d)
(a) Financial assets (Cont’d)
(iii) Derecognition A financial asset is derecognised when any of the below criteria is met: (1) the contractual rights to receive the cash flows from the financial asset expire; (2) the financial asset has been transferred and the Group transfers substantially all the risks and rewards of ownership of the financial asset to the transferee; or (3) the financial asset has been transferred and the Group has not retained control of the financial asset, although the Group neither transfers nor retains substantially all the risks and rewards of ownership of the financial asset. When a financial asset is derecognised, the difference between the carrying amount and the sum of the consideration received and the cumulative changes in fair value that are previously recognised directly in other comprehensive income is recognised in profit or loss for the current period, except for those as investments in other equity instruments, the difference aforementioned is recognised in retained earnings instead.
(b) Financial liabilities Financial liabilities are classified as financial liabilities at amortised cost and financial liabilities at fair value through profit or loss at initial recognition. Financial liabilities of the Group mainly comprise financial liabilities at amortised cost, including notes and accounts payables, other payables, borrowings, debentures payable, etc. Such financial liabilities are initially recognised at fair value, net of transaction costs incurred, and subsequently measured using the effective interest method. Financial liabilities that are due within one year (inclusive) are classified as current liabilities; those with maturities over one year but are due within one year (inclusive) as from the balance sheet date are classified as current portion of non-current liabilities. Others are classified as non-current liabilities. A financial liability is derecognised or partly derecognised when the underlying present obligation is discharged or partly discharged. The difference between the carrying amount of the derecognised part of the financial liability and the consideration paid is recognised in profit or loss for the current period.

S.F. HOLDING CO., LTD. NOTES TO THE FINANCIAL STATEMENTS FOR THE SIX MONTHS ENDED 30 JUNE 2019 (All amounts in RMB Yuan unless otherwise stated) [English translation for reference only]
134
2 Summary of significant accounting policies and accounting estimates (Cont’d)
(9) Financial instruments (Cont’d)
(c) Determination of fair value of financial instruments The fair value of a financial instrument that is traded in an active market is determined at the quoted price in the active market. The fair value of a financial instrument that is not traded in an active market is determined by using a valuation technique. In valuation, the Group adopts valuation techniques applicable in the current situation and supported by adequate available data and other information, selects inputs with the same characteristics as those of assets or liabilities considered in relevant transactions of assets or liabilities by market participants, and gives priority to the use of relevant observable inputs. When relevant observable inputs are not available or feasible, unobservable inputs are adopted.
(10) Inventories
(a) Classification Inventories comprise low-value consumables, raw materials in stock, finished goods, aviation consumables and properties under development, and are stated at the lower of cost and net realisable value.
(b) Valuation method for inventory issued Raw materials in stock and finished goods are accounted for using the weighted average method upon issuance. Aviation consumables are accounted for using the specific-unit-cost method upon issuance. Properties under development comprise land costs relating to real estate development, construction costs, other direct and indirect development expenses, etc., and are transferred to completed properties held for sale at actual cost upon completion.
(c) Amortisation methods of low-value consumables Low-value consumables are amortised into expenses in full when issued for use.

S.F. HOLDING CO., LTD. NOTES TO THE FINANCIAL STATEMENTS FOR THE SIX MONTHS ENDED 30 JUNE 2019 (All amounts in RMB Yuan unless otherwise stated) [English translation for reference only]
135
2 Summary of significant accounting policies and accounting estimates (Cont’d)
(10) Inventories (Cont'd)
(d) Basis for determining the net realisable value of inventories and provision for decline in the value of inventories Provision for decline in the value of inventories is determined at the excess amount of the carrying amounts of the inventories over their net realisable value. Net realisable value is determined based on the estimated selling price in the ordinary course of business, less the estimated costs and estimated costs necessary to make the sale and related taxes.
(e) The Group adopts the perpetual inventory system.
(11) Long-term equity investments Long-term equity investments comprise the Company’s long-term equity investments in its subsidiaries, and the Group’s long-term equity investments in its joint ventures and associates. A subsidiary is an investee over which the Company is able to exercise control. A joint venture is a joint arrangement which is structured through a separate vehicle over which the Group has joint control together with other parties and only has rights to the net assets of the arrangement based on legal forms, contractual terms and other facts and circumstances. An associate is the investee over which the Group has significant influence by participating in the financial and operating policy decisions. Investments in subsidiaries are presented in the Company’s financial statements using the cost method, and are adjusted to the equity method when preparing the consolidated financial statements, and investments in joint ventures and associates are accounted for using the equity method.
(a) Determination of investment cost For long-term equity investments arising from business combination: for long-term equity investments arising from business combination involving enterprises under common control, the initial investment cost shall be the share of the carrying amount of equity of the acquiree in the consolidated financial statements of the ultimate controlling party as at the combination date; for long-term equity investments arising from business combination, the investment cost shall be the combination cost. For long-term equity investments acquired not through a business combination: for long-term equity investments acquired by payment in cash, the initial investment cost shall be the purchase price actually paid; for long-term equity investments acquired by issuing equity securities, the initial investment cost shall be the fair value of the equity securities issued.

S.F. HOLDING CO., LTD. NOTES TO THE FINANCIAL STATEMENTS FOR THE SIX MONTHS ENDED 30 JUNE 2019 (All amounts in RMB Yuan unless otherwise stated) [English translation for reference only]
136
2 Summary of significant accounting policies and accounting estimates (Cont’d)
(11) Long-term equity investments (Cont’d)
(b) Subsequent measurement and recognition methods of gains and losses Long-term equity investments accounted for using the cost method are measured at the initial investment cost. Cash dividend or profit distribution declared by an investee is recognised as investment income in profit or loss for the current period. For long-term equity investments that are accounted for using the equity method, where the initial investment cost exceeds the Group’s share of the fair value of the investee’s identifiable net assets at the time of acquisition, the investment is initially measured at cost. Where the initial investment cost is less than the Group’s share of the fair value of the investee’s identifiable net assets at the time of acquisition, the difference is included in profit or loss for the current period and the cost of the long-term equity investment is adjusted upwards accordingly. Under the equity method, the Group recognises the investment income according to its share of net profit or loss of the investee. The Group discontinues recognising its share of the net losses of an investee after the carrying amounts of the long-term equity investment together with any long-term interests that in substance form part of the investor’s net investment in the investee are reduced to zero. However, if the Group has obligations for additional losses and the criteria with respect to recognition of provisions are satisfied, the Group continues recognising the estimated losses that it needs to bear. The changes of the Group’s share of the investee’s equity other than those arising from the net profit or loss, other comprehensive income and profit appropriation, are recognised in the Group’s capital reserve and the carrying amounts of the long-term equity investment are adjusted accordingly. The carrying amount of the investment is reduced by the Group’s share of the profit distribution or cash dividends declared by an investee. The unrealised profits or losses arising from the transactions between the Group and its investees are eliminated in proportion to the Group’s equity interest in the investees, based on which the investment gain or losses are recognised. For the loss on the intra-group transaction amongst the Group and its investees attributable to asset impairment losses, any unrealised loss is not eliminated.
(c) Basis for determining existence of control, joint control, significant influence over investees Control means having power over an investee, enjoying variable returns through involvement in relevant activities of the investee, and being able to impact the amount of such variable returns by using the power over the investee. Joint control is the agreed sharing of control over an arrangement, and the decision of activities relating to such arrangement requires the unanimous consent of the Group and other parties sharing control. Significant influence is the power to participate in making the decisions on financial and operating policies of the investee, but is not control or joint control over making those policies.

S.F. HOLDING CO., LTD. NOTES TO THE FINANCIAL STATEMENTS FOR THE SIX MONTHS ENDED 30 JUNE 2019 (All amounts in RMB Yuan unless otherwise stated) [English translation for reference only]
137
2 Summary of significant accounting policies and accounting estimates (Cont’d)
(11) Long-term equity investments (Cont’d)
(d) Impairment of long-term equity investments The carrying amounts of long-term equity investments in subsidiaries, joint ventures and associates are reduced to the recoverable amounts when the recoverable amounts are below their carrying amounts (Note 2(19)).
(12) Investment properties Investment properties, including land use rights that have already been leased out, buildings that are held for the purpose of leasing and buildings that are being constructed or developed for future use for leasing, are measured initially at cost. Subsequent expenditures incurred in relation to an investment property are included in the cost of the investment property when it is probable that the associated economic benefits will flow to the Group and their costs can be reliably measured; otherwise, the expenditures are recognised in profit or loss for the period in which they are incurred. The Group adopts the cost model for subsequent measurement of investment properties. Buildings and land use rights are depreciated or amortised to their estimated net residual values over their estimated useful lives. The estimated useful lives, the estimated net residual values that are expressed as a percentage of cost and the annual depreciation rates of investment properties are as follows:
Estimated useful
lives Estimated net
residual values
Annual depreciation/
amortisation rates Buildings 10 - 50 years 5% 9.50% - 1.90% Land use rights 20 - 50 years 0% 2.52% - 2.00% The investment property’s estimated useful life, net residual value and depreciation (amortisation) method applied are reviewed and adjusted as appropriate at each year-end. An investment property is derecognised on disposal or when the investment property is permanently withdrawn from use and no future economic benefits are expected from its disposal. The net amount of proceeds from sale, transfer, retirement or damage of an investment property net of its carrying amount and related taxes and expenses is recognised in profit or loss for the current period.

S.F. HOLDING CO., LTD. NOTES TO THE FINANCIAL STATEMENTS FOR THE SIX MONTHS ENDED 30 JUNE 2019 (All amounts in RMB Yuan unless otherwise stated) [English translation for reference only]
138
2 Summary of significant accounting policies and accounting estimates (Cont’d)
(13) Fixed assets
(a) Recognition and initial measurement of fixed assets Fixed assets comprise buildings, motor vehicles, computers and electronic equipment, aircraft and aircraft engines, rotables and high-value aircraft maintenance tools, machinery and equipment, office equipment and other equipment. Fixed assets are recognised when it is probable that the associated economic benefits will flow to the Group and the related cost can be reliably measured. Fixed assets purchased or constructed are initially measured at cost at the time of acquisition. Subsequent expenditures incurred for a fixed asset are included in the cost of the fixed asset when it is probable that the associated economic benefits will flow to the Group and the related cost can be reliably measured. The carrying amount of the replaced part is derecognised. All the other subsequent expenditures are recognised in profit or loss for the period in which they are incurred.
(b) Depreciation method for fixed assets Except for replacement parts for overhaul of engine, fixed assets are depreciated using the straight-line method to allocate the recorded amount of the assets to their estimated residual values over their estimated useful lives. For the fixed assets that have been provided for impairment loss, the related depreciation charge is prospectively determined based upon the adjusted carrying amounts over their remaining useful lives. The estimated useful lives and the estimated net residual values expressed as a percentage of cost and the annual depreciation rates of fixed assets are as follows:
Estimated useful
lives Estimated net
residual values Annual
depreciation rates Buildings 10 - 50 years 5% 9.50% - 1.90% Motor vehicles (excluding
electromobiles) 2 - 5 years 0% - 5% 50.00% - 19.00% Motor vehicles (electromobiles) 2 years 5% 47.50% Machinery and equipment
(excluding automatic sorting equipment imported from abroad) 2 - 10 years 0% - 5% 50.00% - 9.50%
Machinery and equipment (automatic sorting equipment imported from abroad) 15 years 5% 6.33%
Computers and electronic equipment 2 - 5 years 0% - 5% 50.00% - 19.00%
Aircraft and engine bodies 10 years 5% 9.50% Replacement parts for overhaul of
aircraft fuselage 1.5 - 12 years 0% 66.67% - 8.33% Rotables 10 years 5% 9.50% High-value aircraft maintenance
tools 5 years 5% 19.00% Office equipment and other
equipment 2 - 10 years 0% - 5% 50.00% - 9.50%

S.F. HOLDING CO., LTD. NOTES TO THE FINANCIAL STATEMENTS FOR THE SIX MONTHS ENDED 30 JUNE 2019 (All amounts in RMB Yuan unless otherwise stated) [English translation for reference only]
139
2 Summary of significant accounting policies and accounting estimates (Cont’d)
(13) Fixed assets (Cont’d)
(b) Depreciation method for fixed assets (Cont'd) Replacement parts for overhaul of engines are depreciated using the units-of-production method and taking the expected usable recurring number as the unit of production. The estimated useful life/expected usable recurring number and the estimated net residual value of a fixed asset and the depreciation method applied to the asset are reviewed, and adjusted as appropriate at each year-end.
(c) The carrying amounts of fixed assets are reduced to the recoverable amounts when the recoverable amounts are below their carrying amounts (Note 2(19)).
(d) Basis for identification of fixed assets held under finance leases and related measurement A finance lease is a lease that transfers substantially all the risks and rewards incidental to ownership of an asset. The leased asset is recognised at the lower of the fair value of the leased asset and the present value of the minimum lease payments. The difference between the recorded amount of the leased asset and the minimum lease payments is accounted for as unrecognised finance charge (Note 2(28)(b)). Fixed assets held under a finance lease is depreciated on a basis consistent with the depreciation policy adopted for fixed assets that are self-owned. When a leased asset can be reasonably determined that its ownership will be transferred at the end of the lease term, it is depreciated over its estimated useful life; otherwise, the leased asset is depreciated over the shorter period of the lease term and its estimated useful life.
(e) Disposal of fixed assets A fixed asset is derecognised on disposal or when no future economic benefit is expected from its use or disposal. The amount of proceeds from disposals on sale, transfer, retirement or damage of a fixed asset net of its carrying amount and related taxes and expenses is recognised in profit or loss for the current period.
(14) Construction in progress Construction in progress is measured at actual cost. Actual cost comprises construction costs, installation costs, borrowing costs that are eligible for capitalisation and other costs necessary to bring the fixed assets ready for their intended use. Construction in progress is transferred to fixed assets when the assets are ready for their intended use, and depreciation begins from the following month. The carrying amount of construction in progress is reduced to the recoverable amount when the recoverable amount is below its carrying amount (Note 2(19)).

S.F. HOLDING CO., LTD. NOTES TO THE FINANCIAL STATEMENTS FOR THE SIX MONTHS ENDED 30 JUNE 2019 (All amounts in RMB Yuan unless otherwise stated) [English translation for reference only]
140
2 Summary of significant accounting policies and accounting estimates (Cont’d)
(15) Borrowing costs The Group’s borrowing costs that are directly attributable to the acquisition and construction of a fixed asset that needs a substantially long period of time for its intended use commence to be capitalised and recorded as part of the cost of the asset when expenditures for the asset and borrowing costs have been incurred, and the activities relating to the acquisition and construction that are necessary to prepare the asset for its intended use have commenced. The capitalisation of borrowing costs ceases when the asset under acquisition or construction becomes ready for its intended use and the borrowing costs incurred thereafter are recognised in profit or loss for the current period. Capitalisation of borrowing costs is suspended during periods in which the acquisition or construction of a fixed asset is interrupted abnormally and the interruption lasts for more than 3 months, until the acquisition or construction is resumed. For the specific borrowings obtained for the acquisition or construction of an asset qualifying for capitalisation, the amount of borrowing costs eligible for capitalisation is determined by deducting any interest income earned from depositing the unused specific borrowings in the banks or any investment income arising on the temporary investment of those borrowings during the capitalisation period. For general borrowings utilised for the acquisition and construction of an asset qualifying for capitalisation, the capitalised amount of the general borrowings is determined by the weighted average of the excess of accumulated capital expenditure over capital expenditure of the special borrowings multiplied by the weighted average effective interest rate of the utilised general borrowings. The effective interest rate is the interest rate at which the future cash flows of the borrowings over the estimated life or a shorter applicable period are discounted into the initial recognised amount of the borrowings.
(16) Intangible assets Intangible assets include software, land use rights, trademark rights, customer relationships, patents, etc.
(a) Software Software is measured at actual cost and amortised on the straight-line basis over 2 to 10 years.
(b) Land use rights Land use rights are amortised on the straight-line basis over 33 to 50 years.
(c) Trademark rights Purchased trademark rights are measured at cost at the time of acquisition. Trademark rights recognised under business combinations are recorded at fair value. Trademark rights are amortised on the straight-line basis over 5 to 20 years.
(d) Customer relationships Customer relationships refer to intangible assets recognised under business combinations. Customer relationships are recorded at fair value and amortised on the straight-line basis over the expected beneficial period.

S.F. HOLDING CO., LTD. NOTES TO THE FINANCIAL STATEMENTS FOR THE SIX MONTHS ENDED 30 JUNE 2019 (All amounts in RMB Yuan unless otherwise stated) [English translation for reference only]
141
2 Summary of significant accounting policies and accounting estimates (Cont’d)
(16) Intangible assets (Cont’d)
(e) Patents Patents are amortised on the straight-line basis over 5 to 10 years.
(f) Periodical review of useful life and amortisation method
For an intangible asset with a finite useful life, review of its useful life and amortisation method is performed at each year-end, with adjustment made as appropriate.
(g) Impairment of intangible assets The carrying amounts of intangible assets are reduced to the recoverable amounts when the recoverable amounts are below their carrying amounts (Note 2(19)).
(17) Research and development The expenditure on an internal research and development project is classified into expenditure on the research phase and expenditure on the development phase based on its nature and whether there is material uncertainty that the research and development activities can form an intangible asset at end of the project. Expenditure on the research phase is recognised in profit or loss in the period in which it is incurred. Expenditure on the development phase is capitalised only if all of the following conditions are satisfied: it is technically feasible to complete the intangible asset so that it will be available for use or
sales; management intends to complete the intangible asset, and use or sell it; it can be demonstrated how the intangible asset will generate economic benefits; there are adequate technical, financial and other resources to complete the development
and the ability to use or sell the intangible asset; and the expenditure attributable to the intangible asset during its development phase can be
reliably measured. Other development expenditures that do not meet the conditions above are recognised in profit or loss in the period in which they are incurred. Capitalised development expenditures previously recognised as expenses are not recognised as an asset in a subsequent period. Capitalised expenditure on the development phase is presented as capitalised development expenditures in the balance sheet and transferred to intangible assets at the date when the asset is ready for its intended use.

S.F. HOLDING CO., LTD. NOTES TO THE FINANCIAL STATEMENTS FOR THE SIX MONTHS ENDED 30 JUNE 2019 (All amounts in RMB Yuan unless otherwise stated) [English translation for reference only]
142
2 Summary of significant accounting policies and accounting estimates (Cont’d)
(18) Long-term prepaid expenses Long-term prepaid expenses include settling-in allowance and introduction fee for pilots, the expenditure for improvements to fixed assets held under operating leases, and other expenditures that have been incurred but should be recognised as expenses over more than one year in the current and subsequent periods. Long-term prepaid expenses are amortised on a straight-line basis over the expected beneficial period (2 to 15 years) and are presented at actual expenditure net of accumulated amortisation.
(19) Impairment of long-term assets Fixed assets, construction in progress, intangible assets with finite useful lives, investment properties measured using the cost model and long-term equity investments in subsidiaries, joint ventures and associates are tested for impairment if there is any indication that the assets may be impaired at the balance sheet date; intangible assets not ready for their intended use are tested at least annually for impairment, irrespective of whether there is any indication that it may be impaired. If the result of the impairment test indicates that the recoverable amount of an asset is less than its carrying amount, a provision for impairment and an impairment loss are recognised for the amount by which the asset’s carrying amount exceeds its recoverable amount. The recoverable amount is the higher of an asset’s fair value less costs to sell and the present value of the future cash flows expected to be derived from the asset. Provision for asset impairment is determined and recognised on individual asset basis. If it is not possible to estimate the recoverable amount of an individual asset, the recoverable amount of a group of assets to which the asset belongs is determined. A group of assets is the smallest group of assets that is able to generate independent cash inflows. Goodwill that is separately presented in the financial statements is tested at least annually for impairment, irrespective of whether there is any indication that it may be impaired. In conducting the test, the carrying amount of goodwill is allocated to the related asset groups or groups of asset groups which are expected to benefit from the synergies of the business combination. If the result of the test indicates that the recoverable amount of an asset group or a group of asset groups, including the allocated goodwill, is lower than its carrying amount, the corresponding impairment loss is recognised. The impairment loss is first deducted from the carrying amount of goodwill that is allocated to the asset group or group of asset groups, and then deducted from the carrying amounts of other assets within the asset group or group of asset groups in proportion to the carrying amounts of assets other than goodwill. Once the above asset impairment loss is recognised, it will not be reversed for the value recovered in the subsequent periods.
S.F. HOLDING CO., LTD. NOTES TO THE FINANCIAL STATEMENTS FOR THE SIX MONTHS ENDED 30 JUNE 2019 (All amounts in RMB Yuan unless otherwise stated) [English translation for reference only]
143
2 Summary of significant accounting policies and accounting estimates (Cont’d)
(20) Employee benefits Employee benefits refer to all forms of consideration or compensation given by the Group in exchange for service rendered by employees or for termination of employment relationship, which include short-term employee benefits, post-employment benefits, termination benefits and other long-term employee benefits.
(a) Short-term employee benefits Short-term employee benefits include employee wages or salaries, bonus, allowances and subsidies, staff welfare, premiums or contributions on medical insurance, work injury insurance and maternity insurance, housing funds, union running costs and employee education costs. The employee benefit liabilities are recognised in the accounting period in which the service is rendered by the employees, with a corresponding charge to the profit or loss for the current period or the cost of relevant assets. Employee benefits which are non-monetary benefits are measured at fair value.
(b) Post-employment benefits The Group classifies post-employment benefits plans into defined contribution plans and defined benefit plans. Defined contribution plans are post-employment benefit plans under which the Group pays fixed contributions into a separate fund and will have no obligation to pay further contributions; and defined benefit plans are post-employment benefit plans other than defined contribution plans. During the reporting period, the Group's post-employment benefits mainly included basic pension insurance and unemployment insurance, both of which belong to defined contribution plans. Basic pension insurance The Group’s employees participate in the basic pension plan set up and administered by local authorities of Ministry of Human Resource and Social Security. Monthly payments of premiums on the pensions are calculated according to local regulations for pension plan. When employees retire, the local labour and social security authority is obliged to pay the basic pensions to them. The amounts based on the above calculations are recognised as liabilities in the accounting period in which the service has been rendered by the employees, with a corresponding charge to the profit or loss for the current period or the cost of relevant assets.
(c) Termination benefits The Group provides compensation for terminating the employment relationship with employees before the end of the employment contracts or as an offer to encourage employees to accept voluntary redundancy before the end of the employment contracts. The Group recognises a liability arising from compensation for termination of the employment relationship with employees, with a corresponding charge to profit or loss for the current period at the earlier of the following dates: 1) when the Group cannot unilaterally withdraw an employment termination plan or a curtailment proposal; 2) when the Group recognises costs or expenses related to a restructuring that involves the payment of termination benefits. The termination benefits expected to be paid within one year since the balance sheet date are classified as current liabilities.

S.F. HOLDING CO., LTD. NOTES TO THE FINANCIAL STATEMENTS FOR THE SIX MONTHS ENDED 30 JUNE 2019 (All amounts in RMB Yuan unless otherwise stated) [English translation for reference only]
144
2 Summary of significant accounting policies and accounting estimates (Cont’d)
(20) Employee benefits (Cont'd)
(d) Employee incentives The Group provides incentive plans for on-the-job employees who comply with certain conditions, and makes payments based on the schedule. Provisions for employee incentives are initially measured at the best estimate necessary to settle the present obligation, and expensed as incurred. The Group integrates separation rate, time value of money and other factors into account at initial measurement. Where the effect of the time value of money is material, the best estimate is determined by discounting the related future cash outflows. The increase in the discounted amount of the provision arising from passage of time is expensed as incurred. The carrying amount of provisions for employee incentives is reviewed at each balance sheet date and adjusted to reflect the current best estimate.
(21) Dividend distribution Cash dividends are recognised as liabilities in the period in which the dividends are approved by the shareholders’ meeting.
(22) Provisions Provisions are recognised when the Group has a present obligation, it is probable that an outflow of economic benefits will be required to settle the obligation, and the amount of the obligation can be measured reliably. A provision is initially measured at the best estimate of the expenditure required to settle the related present obligation. Factors surrounding a contingency, such as the risks, uncertainties and the time value of money, are taken into account as a whole in reaching the best estimate of a provision. Where the effect of the time value of money is material, the best estimate is determined by discounting the related future cash outflows. The increase in the discounted amount of the provision arising from passage of time is recognised as interest expense. The carrying amount of provisions is reviewed at each balance sheet date and adjusted to reflect the current best estimate. The provisions expected to be settled within one year since the balance sheet date are classified as current liabilities.

S.F. HOLDING CO., LTD. NOTES TO THE FINANCIAL STATEMENTS FOR THE SIX MONTHS ENDED 30 JUNE 2019 (All amounts in RMB Yuan unless otherwise stated) [English translation for reference only]
145
2 Summary of significant accounting policies and accounting estimates (Cont’d)
(23) Share-based payments
(a) Categories of share-based payments A share-based payment is a transaction in which an enterprise grants equity instruments or assumes liabilities that are determined based on equity instruments, in exchange for services rendered by employees or another party. Equity instruments include the equity instruments that are linked to the enterprise, the parent company of the enterprise or another accounting entity within the same group. Share-based payments comprise equity-settled and cash-settled payments.
(b) Basis for determining the best estimate of exercisable equity instruments At each balance sheet date in the vesting period, the Group would make best estimate in accordance with the newly acquired information such as changes in the number of employees entitled to equity instruments, and amend the number of exercisable equity instruments. On the exercisable date, the ultimate estimated number of exercisable equity instruments coincides with the actual number.
(c) Accounting treatment of implementation of share-based payments
(i) Equity-settled share-based payment The equity-settled share-based payment where the Group grants shares or other equity instruments as a consideration in return for services, is measured at the fair value of the equity instruments at the grant date. Where the share-based payment is not exercisable until the service in the vesting period is completed or specified performance conditions are met, then at each balance sheet date within the vesting period, the service obtained in the current period shall be included in relevant cost or expenses and in capital reserve at the fair value of the equity instruments at the grant date based on the best estimates of the quantity of exercisable equity instruments made by the Group, in accordance with latest changes in the number of exercisable employees and subsequent information.
(ii) Cash-settled share-based payments The cash-settled share-based payment where the Group calculates and determines the cash payment or any other asset obligation on the basis of shares or other equity instruments in return for services, is measured at the fair value of the liabilities calculated based on relevant equity instruments. Where the share-based payment is not exercisable until the service in the vesting period is completed or specified performance conditions are met, then at each balance sheet date within the vesting period, the service obtained in the current period shall be included in cost or expenses and in liabilities at the fair value of the Group’s liabilities based on the best estimates of the quantity of exercisable equity instruments made by the Group. At each balance sheet date and settlement date before relevant liabilities are settled, the fair value of the liabilities is remeasured and the changes are recognised in profit or loss.

S.F. HOLDING CO., LTD. NOTES TO THE FINANCIAL STATEMENTS FOR THE SIX MONTHS ENDED 30 JUNE 2019 (All amounts in RMB Yuan unless otherwise stated) [English translation for reference only]
146
2 Summary of significant accounting policies and accounting estimates (Cont’d)
(24) Factoring The factoring business of the Group mainly represents factoring with recourse. Factoring with recourse is a kind of financing activity where the customer transfers the creditor's rights of accounts receivable that meet relevant requirements and are accepted by the Group to the Group according to the purchase and sale contract and relevant agreements, so as to obtain short-term trade financing, and agrees to repurchase the financing business in full if the creditor's rights cannot be recovered in full. The Group's factoring business is accounted for with Factoring receivables based on the amount paid for the creditor’s rights of accounts receivable (Note 2(9)).
(25) Revenue recognition The amount of revenue is determined in accordance with the fair value of the consideration received or receivable for the sales of goods and services in the ordinary course of the Group’s activities. Revenue is shown net of discounts and returns. Revenue is recognised when the economic benefits associated with the transaction will flow to the Group, the related revenue can be reliably measured, and the specific criteria of revenue recognition have been met for each type of the Group’s activities as described below. The principles are set out below:
(a) Rendering of services Revenue from express delivery and supply chain services includes revenue from inbound and outbound express delivery services; revenue from international freight forwarding agency services; revenue from domestic and international transport services of aviation cargoes; revenue from express delivery agency services; and revenue from providing solutions services. Besides the aforesaid revenue, the Group’s revenue from rendering of services includes revenue from communication service and maintenance service. Revenue from rendering of services is recognised when the service is completed and the right to collect payment is obtained.
(b) Sales of goods Revenue from the sales of goods is recognised when significant risks and rewards of ownership of the goods are transferred to the buyer, the Group retains neither continuing managerial involvement to the degree usually associated with ownership nor effective control over the goods sold, and the economic benefit associated with the transaction will flow to the Group and the relevant revenue and costs can be measured reliably.
(c) Interest income The interest income from factoring business, loans to customers and advances business and bank deposit are measured on the basis of time proportion and the effective interest rate.

S.F. HOLDING CO., LTD. NOTES TO THE FINANCIAL STATEMENTS FOR THE SIX MONTHS ENDED 30 JUNE 2019 (All amounts in RMB Yuan unless otherwise stated) [English translation for reference only]
147
2 Summary of significant accounting policies and accounting estimates (Cont’d)
(26) Government grants Government grants refer to the monetary or non-monetary assets obtained by the Group from the government, including tax return, financial subsidy, etc. Government grants are recognised when the grants can be received and the Group can comply with all attached conditions. If a government grant is a monetary asset, it will be measured at the amount received or receivable. If a government grant is a non-monetary asset, it will be measured at its fair value. If it is unable to obtain its fair value reliably, it will be measured at its nominal amount. Government grants related to assets refer to the government grants which are obtained by the Group for the purposes of purchase, construction or acquisition of the long-term assets. Government grants related to income refer to the government grants other than those related to assets. Government grants related to assets are recorded as deferred income and recognised in profit or loss on a systemic basis over the useful lives of the assets. Government grants related to income that compensate the future costs, expenses or losses are recorded as deferred income and recognised in profit or loss, or deducted against related costs, expenses or losses in reporting the related expenses; government grants related to income that compensate the incurred costs, expenses or losses are recognised in profit or loss, or deducted against related costs, expenses or losses directly in current period. The Group applies the presentation method consistently to the similar government grants in the financial statements. Government grants related to daily corporate activities are included in operating profit. Government grants not related to daily corporate activities are included in non-operating income or expenses. Policy-based loans with prime rate to the Group are recorded at actual amount of borrowing received, and related borrowing costs are calculated with borrowing principal and policy-based prime rate. Financial discounts directly received by the Group are deducted against related borrowing costs.
(27) Deferred tax assets and deferred tax liabilities Deferred tax assets and deferred tax liabilities are calculated and recognised based on the differences arising between the tax bases of assets and liabilities and their carrying amounts (temporary differences). Deferred tax asset is recognised for the deductible tax losses that can be carried forward to subsequent years for deduction of the taxable profit in accordance with the tax laws. No deferred tax liability is recognised for a temporary difference arising from the initial recognition of goodwill. No deferred tax asset or deferred tax liability is recognised for the temporary differences resulting from the initial recognition of assets or liabilities due to a transaction other than a business combination, which affects neither accounting profit nor taxable profit (or deductible tax losses). At the balance sheet date, deferred tax assets and deferred tax liabilities are measured at the tax rates that are expected to apply to the period when the asset is realised or the liability is settled.

S.F. HOLDING CO., LTD. NOTES TO THE FINANCIAL STATEMENTS FOR THE SIX MONTHS ENDED 30 JUNE 2019 (All amounts in RMB Yuan unless otherwise stated) [English translation for reference only]
148
2 Summary of significant accounting policies and accounting estimates (Cont’d)
(27) Deferred tax assets and deferred tax liabilities (Cont’d) Deferred tax assets are only recognised for deductible temporary differences, deductible tax losses and tax credits to the extent that it is probable that taxable profit will be available in the future against which the deductible temporary differences, deductible tax losses and tax credits can be utilised. Deferred tax liabilities are recognised for temporary differences arising from investments in subsidiaries, associates and joint ventures, except where the Group is able to control the timing of reversal of the temporary difference, and it is probable that the temporary difference will not reverse in the foreseeable future. When it is probable that the temporary differences arising from investments in subsidiaries, associates and joint ventures will be reversed in the foreseeable future and that the taxable profit will be available in the future against which the temporary differences can be utilised, the corresponding deferred tax assets are recognised. Deferred tax assets and deferred tax liabilities are offset when: the deferred tax assets and liabilities are related to the same tax payer within the Group and
the same taxation authority; and, that tax payer within the Group has a legally enforceable right to offset current tax assets
against current tax liabilities.
(28) Leases A finance lease is a lease that transfers substantially all the risks and rewards incidental to ownership of an asset. An operating lease is a lease other than a finance lease.
(a) Operating leases Lease payments under an operating lease are recognised on a straight-line basis over the period of the lease, and are either capitalised as part of the cost of related assets, or charged as an expense for the current period. Lease income under an operating lease is recognised on a straight-line basis over the period of the lease.
(b) Finance leases (as the leasee) The leased asset is recognised at the lower of the fair value of the leased asset and the present value of the minimum lease payments. The difference between the recorded amount of the leased asset and the minimum lease payments is accounted for as unrecognised finance charge and is amortised using the effective interest method over the period of the lease. A long-term payable is recorded at the amount equal to the minimum lease payments less the unrecognised finance charge.

S.F. HOLDING CO., LTD. NOTES TO THE FINANCIAL STATEMENTS FOR THE SIX MONTHS ENDED 30 JUNE 2019 (All amounts in RMB Yuan unless otherwise stated) [English translation for reference only]
149
2 Summary of significant accounting policies and accounting estimates (Cont’d)
(28) Leases (Cont’d)
(c) Finance leases (as the lessor) At the commencement date of the lease term, lease finance receivables are accounted at the sum of the minimum lease proceeds and the initial direct cost on the lease commencement date; unrealised finance gains are recognised at the difference between the sum of the minimum lease proceeds and the initial direct cost and its present value. Finance lease income is recognised using the effective interest method over the lease term.
(29) Segment information The Group identifies operating segments based on the internal organisation structure, management requirements and internal reporting system, and discloses segment information of reportable segments which is determined on the basis of operating segments. An operating segment is a component of the Group that satisfies all of the following conditions: (1) the component is able to earn revenue and incur expenses from its ordinary activities; (2) whose operating results are regularly reviewed by the Group’s management to make decisions about resources to be allocated to the segment and to assess its performance, and (3) for which the information on financial position, operating results and cash flows is available to the Group. If two or more operating segments have similar economic characteristics and satisfy certain conditions, they are aggregated into one single operating segment.
(30) Critical accounting estimates and judgements The Group continually evaluates the critical accounting estimates and key judgements applied based on historical experience and other factors, including expectations of future events that are believed to be reasonable.
(a) Critical accounting estimates and key assumptions
(i) Deferred tax assets Deferred tax assets are recognised for the deductible tax losses and deductible temporary differences that can be carried forward to subsequent years to the extent that it is probable that taxable profit in the future will be available against which the deductible tax losses and deductible temporary differences can be utilised. Whether to recognise the deferred tax assets arising from deductible tax losses and deductible temporary differences largely depends on the judgement of management on: (i) whether the accumulated deductible tax losses and deductible temporary differences in prior years are still effective, and (ii) whether sufficient taxable income that can be used to deduct deductible tax losses and deductible temporary differences can be obtained in the future period. Where there is a difference between the situation and the original estimate, such difference will affect the Group’s deferred tax assets and income tax expenses in the future period.

S.F. HOLDING CO., LTD. NOTES TO THE FINANCIAL STATEMENTS FOR THE SIX MONTHS ENDED 30 JUNE 2019 (All amounts in RMB Yuan unless otherwise stated) [English translation for reference only]
150
2 Summary of significant accounting policies and accounting estimates (Cont’d)
(30) Critical accounting estimates and judgements (Cont’d)
(a) Critical accounting estimates and key assumptions (Cont’d)
(ii) Risk of impairment on long-term assets As described in Note 2(19), fixed assets with impairment indication, construction in progress, intangible assets, investment properties measured using cost model, long-term equity investments and other long-term assets are tested for impairment annually at the end of each year; and whether with impairment indication, goodwill are tested for impairment annually at least. When assessing whether the above assets are impaired, management mainly evaluates and analyses: (1) whether events affecting asset impairment occurred; (2) whether the present value of expected cash flows arising from the continuing use or disposal of the asset is lower than its carrying amount; and (3) whether the significant assumptions used in the calculation of the present value of the estimated cash flows are appropriate. Relevant assumptions adopted by the Group to determine impairment, e.g. changes in assumptions on discount rate and growth rate used to calculate the present value of future cash flows, may have material impact on the present value used in the impairment test, and cause impairment in the above-mentioned long-term assets of the Group.
(iii) Determination of fair value of financial instruments by valuation techniques The fair value of a financial instrument that is not traded in an active market is determined by valuation techniques. Valuation techniques primarily refer to direct comparison method and income method, including reference to the prices used in recent orderly transactions between market participants, reference to the current fair value of other financial instruments that are substantially identical, discounted cash flow analysis, option pricing models, etc. Observable market information is applied in valuation techniques to the extent possible. When observable market information is not available, the management will make estimate of significant unobservable information included in the valuation method. Different valuation techniques or inputs may lead to significant differences between fair value estimates.
(iv) The assessment of the fair value of identifiable net assets in acquisition transactions and goodwill recognition As stated in Note 2(5)(b), identifiable net assets acquired in a business combination are recognised at the fair value on the acquisition date, and if the combination cost is greater than the fair value of the acquiree’s identifiable net assets on the acquisition date, the difference is recognised as goodwill. The assessment of the fair value of identifiable assets and liabilities involves significant estimates and judgements from management, in particular, the identification of intangible assets and the evaluation of their fair values, thereby affecting the recognition of goodwill. As stated in Note 5(1)(b), key assumptions used in the assessment of the fair value of intangible assets include revenue growth rate, profit margin, assets contribution rate, customer churn rate, the remaining useful life of the identified intangible assets, and discount rate, etc. Different input values in key assumptions may result in significant differences in estimated fair value.

S.F. HOLDING CO., LTD. NOTES TO THE FINANCIAL STATEMENTS FOR THE SIX MONTHS ENDED 30 JUNE 2019 (All amounts in RMB Yuan unless otherwise stated) [English translation for reference only]
151
2 Summary of significant accounting policies and accounting estimates (Cont’d)
(30) Critical accounting estimates and judgements (Cont’d)
(b) Critical judgments in applying the accounting policies
(i) Judgement on significant influence of the Group over investees The investees over which the Group has significant influence are accounted for under the equity method. In judging the significant influence over an investee, the management considers based on one or more of the following circumstances and all facts and circumstances: (1) the shareholding in the investee; (2) whether it appoints representative in the Board of Directors or a similar authority of the investee; (3) whether it participates in making decisions on financial and operating policies of the investee; (4) whether it has significant transaction with the investee; (5) whether it assigns management personnel to the investee; (6) whether it provides key technical materials to the investee, and all facts and circumstances are considered.
(31) Changes in significant accounting policies The Ministry of Finance released the revised CAS 22 - Recognition and Measurement of Financial Instruments, CAS 23 - Transfer of Financial Assets and CAS 37 - Presentation of Financial Instruments (hereinafter referred to as “new financial instruments standards”) in 2017 and the Circular on the Amendment to the Formats of Corporate Financial Statements for the Year of 2019 (Cai Kuai [2019] No. 6) in 2019. The financial statements for the six months ended 30 June 2019 are prepared in accordance with the above standards and circular, and the impacts are as follows:
(a) Revisions on the formats of corporate financial statements
(i) The impacts on the balance sheet are as follows: i) The Group split the notes receivable and accounts receivable into separate items, which are
listed as notes receivable and accounts receivable. The comparative period financial statements are restated.
ii) The Group collects the interest receivables originally included in other receivables based on the
effective interest method into the corresponding book balance of financial assets such as cash at bank and on hand, factoring receivables, loans and advances,etc. The comparative period financial statements are not restated.
iii) The Group collects the interest payables originally included in other payables based on the
effective interest method into the corresponding book balance of financial liabilities such as short-term borrowings, other non-current assets, current portion of non-current liabilities, etc. The comparative period financial statements are not restated.
(ii) The impacts on the cash flow statement are as follows:
Pursuant to the Circular on the Amendment to the Formats of Corporate Financial Statements for the Year of 2018 (Cai Kuai [2018] No. 15) and relevant interpretations issued by the Ministry of Finance in 2018, the Group reclassified the cash received from government grants related to assets from cash received relating to other investment activities to cash received relating to other operating activities for the six months ended 30 June 2018. The amount affected was RMB 37,982,039.01.

S.F. HOLDING CO., LTD. NOTES TO THE FINANCIAL STATEMENTS FOR THE SIX MONTHS ENDED 30 JUNE 2019 (All amounts in RMB Yuan unless otherwise stated) [English translation for reference only]
152
2 Summary of significant accounting policies and accounting estimates (Cont’d)
(31) Changes in significant accounting policies (Cont’d)
(b) Financial instruments Since 1 January, 2019, the Group has adopted the new financial instrument standards. In accordance with relevant provisions of the new financial instruments standards, the Group and the Company recognised the cumulative effect of initially applying the standard as an adjustment to the opening balance of retained earnings in 2019 and other relevant line items in the financial statements. The comparatives were not restated. During the comparative period, the accounting and presentation method is according to CAS 22 - Recognition and Measurement of Financial Instruments and CAS 23 - Transfer of Financial Assets issued by the Ministry of Finance in 2006, and CAS 37 - Presentation of Financial Instruments issued by the Ministry of Finance in 2014 (hereinafter referred to as “original financial instruments standards”).
(i) Impacts on financial statements as at 1 January,2019 at the date of initial application of new financial instruments standards Accounting policies under the new financial instruments standards are listed in Note 2(9). At the date of initial application, the Group and the Company analyzed the business model of financial assets and cash flow characteristics of financial assets, and evaluated the impact of the new financial instrument standards on the financial statements of the Group and the Company.

S.F. HOLDING CO., LTD. NOTES TO THE FINANCIAL STATEMENTS FOR THE SIX MONTHS ENDED 30 JUNE 2019 (All amounts in RMB Yuan unless otherwise stated) [English translation for reference only]
153
2 Summary of significant accounting policies and accounting estimates (Cont’d)
(31) Changes in significant accounting policies (Cont’d)
(b) Financial instruments (Cont’d)
(i) Impacts on financial statements as at 1 January,2019 at the date of initial application of new financial instruments standards (Cont’d) As at 1 January 2019, the financial assets presented in the Group’s consolidated financial statements were classified and measured in accordance with the old/new financial instruments standards as follows:
Original financial instruments standards New financial instruments standards Line item Measurement Carrying amount Line item Measurement Carrying amount Cash at bank and on hand Amortised cost 16,131,119,850.56 Cash at bank and on hand Amortised cost 16,131,119,850.56 Financial assets at fair value
through profit or loss Fair value through profit or loss 14,441,978.09 Financial assets held for trading Fair value through profit or loss 14,441,978.09 Notes receivable Amortised cost 20,958,746.36 Notes receivable Amortised cost 20,958,746.36 Accounts receivable Amortised cost 7,352,877,748.87 Accounts receivable Amortised cost 7,352,877,748.87 Factoring receivables Amortised cost 447,173,258.65 Factoring receivables Amortised cost 447,173,258.65 Loans and advances Amortised cost 95,070,625.30 Loans and advances Amortised cost 95,070,625.30 Other receivables Amortised cost 1,397,913,483.52 Other receivables Amortised cost 1,397,913,483.52 Current portion of non-current
assets Amortised cost 123,197,466.26 Current portion of non-current
assets Amortised cost 123,197,466.26
Other current assetsNote 1 Amortised cost 564,456,452.05 Other current assets Amortised cost 60,108,657.53 Financial assets held for trading Fair value through profit or loss 504,347,794.52
Available-for-sale financial assets
Fair value through other comprehensive income (debt instruments) 178,403,812.08 Other non-current financial assets Fair value through profit or loss 178,403,812.08
Fair value through other comprehensive income (equity instruments) 3,070,327,696.74
Financial assets held for trading Fair value through profit or loss 72,373.06 Investments in other equity
instruments Fair value through other
comprehensive income 2,725,569,435.71 Other non-current financial assets Fair value through profit or loss 344,685,887.97
Cost (equity instruments) 174,795,551.45
Investments in other equity instruments
Fair value through other comprehensive income 87,260,649.19
Other non-current financial assets Fair value through profit or loss 105,000,000.00 Long-term receivables Amortised cost 571,493,790.74 Long-term receivables Amortised cost 571,493,790.74 Total 30,142,230,460.67 Total 30,159,695,558.41

S.F. HOLDING CO., LTD. NOTES TO THE FINANCIAL STATEMENTS FOR THE SIX MONTHS ENDED 30 JUNE 2019 (All amounts in RMB Yuan unless otherwise stated) [English translation for reference only]
154
2 Summary of significant accounting policies and accounting estimates (Cont’d)
(31) Changes in significant accounting policies (Cont’d)
(b) Financial instruments (Cont'd)
(i) Impacts of adopting new financial instruments standards on financial statements at the date of initial application (January 1, 2019) (Cont’d) Note 1: As at 31 December 2018, other current assets held by the Group at amortised cost were banking wealth management products. Due to the application of above revised standards, the affected amount for equity attributable to shareholders of the parent Company in the Group’s consolidated financial statements amounted to RMB 17,465,097.74, including other comprehensive income of RMB 17,465,097.74, and the affected amount in minority interests and retained earnings was zero. As at 1 January 2019, the financial assets presented in the Company’s financial statements were classified and measured in accordance with the old/new financial instruments standards as follows:
Original financial instruments standards New financial instruments standards Line item Measurement Carrying amount Line item Measurement Carrying amount Cash at bank and on hand Amortised cost 1,136,288,489.11 Cash at bank and on hand Amortised cost 1,136,288,489.11 Other receivables Amortised cost 9,542,466,126.10 Other receivables Amortised cost 9,542,466,126.10 Total 10,678,754,615.21 Total 10,678,754,615.21
Due to the above revised standards, the affected amount for equity of the Company and retained earnings was zero on 1 January 2019.

S.F. HOLDING CO., LTD. NOTES TO THE FINANCIAL STATEMENTS FOR THE SIX MONTHS ENDED 30 JUNE 2019 (All amounts in RMB Yuan unless otherwise stated) [English translation for reference only]
155
2 Summary of significant accounting policies and accounting estimates (Cont’d)
(31) Changes in significant accounting policies (Cont’d)
(b) Financial instruments (Cont'd) (ii) As at 1 January 2019, the carrying amount of financial assets is reconciled from the original financial
instruments standards to the new financial instruments standards based on the new measurement:
Measurement under the new financial instruments standards Financial assets at amortised cost Table 1 Financial assets at fair value through profit or loss Table 2 Financial assets at fair value through other comprehensive income Table 3
Table 1: Financial assets at amortised cost under the new financial instruments standards Carrying amount Consolidated Company Cash at bank and on hand As at 31 December 2018
16,131,119,850.56 1,136,288,489.11
As at 1 January 2019 16,131,119,850.56 1,136,288,489.11 Receivables As at 31 December 2018 (Note 2) 10,008,685,119.70 9,542,466,126.10 As at 1 January 2019 10,008,685,119.70 9,542,466,126.10 Other current assets As at 31 December 2018
564,456,452.05 -
Less: Transfer to financial assets at fair value through profit or loss (under the new financial instruments standards) (Note 3) (504,347,794.52) -
As at 1 January 2019 60,108,657.53 - Financial assets at amortised cost 26,199,913,627.79 10,678,754,615.21 Note 2: As at 31 December 2018 and 1 January 2019, receivables included notes receivable,
accounts receivable, factoring receivables, loans and advances, other receivables, current portion of non-current assets and long-term receivables.
Note 3: As at 31 December 2018, the book value of structured deposits held by the Group was RMB
504,347,794.52. After the implementation of the new financial instrument standards, the contractual cash flow characteristics of the structured deposits did not meet the basic lending arrangements. Therefore, on 1 January 2019, the Group re-measured the structured deposits from other current assets to fair value. Financial assets whose changes are included in the current profit and loss are presented as financial assets held for trading.

S.F. HOLDING CO., LTD. NOTES TO THE FINANCIAL STATEMENTS FOR THE SIX MONTHS ENDED 30 JUNE 2019 (All amounts in RMB Yuan unless otherwise stated) [English translation for reference only]
156
2 Summary of significant accounting policies and accounting estimates (Cont’d)
(31) Changes in significant accounting policies (Cont’d)
(b) Financial instruments (Cont'd)
(ii) As at 1 January 2019, the carrying amount of financial assets is reconciled from the original financial instruments standards to the new financial instruments standards based on the new measurement (Cont’d): Table 2: Financial assets at fair value through profit or loss under the new financial instruments standards Carrying amount Consolidated Financial assets held for trading As at 31 December 2018
-
Add: Transfer from financial assets at fair value through profit or loss (under the original financial instruments standards) 14,441,978.09
Transfer from available-for-sale financial assets measured at fair value (under original financial instrument standards) 72,373.06
Remeasurement: From amortised cost to fair value (Note 3) 504,347,794.52 As at 1 January 2019 518,862,145.67 Other non-current financial assets As at 31 December 2018
-
Add: Transfer from available-for-sale financial assets measured at fair value (under original financial instrument standards) (Note 4) 523,089,700.05
Remeasurement: From cost to fair value (Note 5) 105,000,000.00 As at 1 January 2019 628,089,700.05 Total financial assets at fair value through profit or
loss (under the new financial instruments standards)
1,146,951,845.72 Note 4: As at 31 December 2018, the Group held asset-backed special scheme securities
(hereinafter referred to as the "Special Scheme") with book value of RMB 178,403,812.08. Following the implementation of the new financial Instruments standards, the Group reclassifies the Special Scheme from available-for-sale financial assets into financial assets at fair value through profit or loss, and lists them as other non-current financial assets.
As at 31 December, 2018, the Group held Simple Agreement for Future Equity (hereinafter referred to as the "SAFE") with book value of RMB 344,685,887.97. Following the implementation of the new Financial Instruments Standards, the Group reclassifies it from available-for-sale financial assets into financial assets at fair value through profit or loss, and lists them as other non-current financial assets.
Note 5: As at 31December, 2018, the Group held an investment in industrial funds measure at cost with a book value of RMB 105,000,000.00. Following the implementation of the new Financial Instruments Standards, the Group recalculates such industrial fund investments from from available-for-sale financial assets into financial assets at fair value through profit or loss, and lists them as other non-current financial assets.

S.F. HOLDING CO., LTD. NOTES TO THE FINANCIAL STATEMENTS FOR THE SIX MONTHS ENDED 30 JUNE 2019 (All amounts in RMB Yuan unless otherwise stated) [English translation for reference only]
157
2 Summary of significant accounting policies and accounting estimates (Cont’d)
(31) Changes in significant accounting policies (Cont’d)
(b) Financial instruments (Cont'd)
(ii) As at 1 January 2019, the carrying amount of financial assets is reconciled from the original financial instruments standards to the new financial instruments standards based on the new measurement (Cont’d): Table 3: Financial assets at fair value through other comprehensive income under the new financial instruments standards Carrying amount Consolidated
Investments in other equity instruments As at 31 December 2018
-
Add: Transfer from available-for-sale financial assets measured at fair value (under the original financial instruments standards) (Note 6) 2,725,569,435.71
Remeasurement: From cost to fair value (Note 7) 87,260,649.19 As at 1 January 2019 2,812,830,084.90 Total financial assets at fair value through other comprehensive income (under the new financial instruments standards)
2,812,830,084.90 Note 6: As at 31 December 2018, certain equity investments that were measured at fair value at an
amount of RMB 2,725,569,435.71 were designated to financial assets at fair value through other comprehensive income on 1 January 2019 due to the Group’s strategic investment consideration.
Note 7: As at 31 December 2018, certain equity investments that were measured at cost at an
amount of RMB 69,795,551.45 were designated to financial assets at fair value through other comprehensive income on 1 January 2019 due to the Group’s strategic investment consideration. The difference between fair value and original book value is RMB 17,465,097.74, adjusting other comprehensive income at the beginning of the period.

S.F. HOLDING CO., LTD. NOTES TO THE FINANCIAL STATEMENTS FOR THE SIX MONTHS ENDED 30 JUNE 2019 (All amounts in RMB Yuan unless otherwise stated) [English translation for reference only]
158
2 Summary of significant accounting policies and accounting estimates (Cont’d)
(31) Changes in significant accounting policies (Cont’d)
(b) Financial instruments (Cont'd)
(iii) As at 1 January 2019, the Group’s reconciliation from the provision for impairment of financial assets under the original financial instruments standards to loss provision under the new financial instruments standards is as below:
Measurement
Loss provision under the original
financial instruments
standards Remeasurement
Loss provision under the new
financial instruments
standards Consolidated Consolidated Financial assets at amortised cost -
Provision for impairment of accounts receivable 79,456,513.05 - 79,456,513.05
Provision for impairment of other receivables 12,857,692.63 - 12,857,692.63
Provision for impairment of long-term receivables 11,234,212.14 - 11,234,212.14
Provision for impairment of Factoring receivables 9,655,084.16 - 9,655,084.16
Provision for impairment of loans and advances 11,158,725.91 - 11,158,725.91
Financial assets at fair value through
other comprehensive income - Provision for impairment of
available-for-sale financial assets 4,596,187.92 (4,596,187.92) -
Total 128,958,415.81 (4,596,187.92) 124,362,227.89
Measurement
Loss provision under the original financial
instruments standards Remeasurement
Loss provision under the new financial
instruments standards Company Company Financial assets at amortised cost - Provision for impairment of other
receivables - - -

S.F. HOLDING CO., LTD. NOTES TO THE FINANCIAL STATEMENTS FOR THE SIX MONTHS ENDED 30 JUNE 2019 (All amounts in RMB Yuan unless otherwise stated) [English translation for reference only]
159
3 Taxation The main categories and rates of taxes applicable to the Group are set out below: Category Tax rate Tax base Enterprise income tax Note (1) Taxable income Value-added tax (“VAT”) Note (2) Taxable value-added amount (Tax payable is
calculated using the taxable sales amount/taxable service income multiplied by the applicable tax rate less deductible VAT input of the current period or taxable turnover amount multiplied by the VAT rate)
City maintenance and construction tax
7%, 5%, 1% Amount of VAT paid
Educational surcharge 3% Amount of VAT paid Local educational
surcharge 2% Amount of VAT paid
Customs duty At applicable tax rate Customs dutiable value through examination and approval of the Customs
In addition, pursuant to the Interim Measures for the Collection, Use and Management of the Civil Aviation Development Fund (Cai Zong [2012] No. 17) issued by the Ministry of Finance, SF Airlines Company Limited (“SF Airlines”) pays the civil aviation development fund based on classification of flight routes, maximum take-off weight, flight mileage and applicable collection standards, and includes such payment in cost.

S.F. HOLDING CO., LTD. NOTES TO THE FINANCIAL STATEMENTS FOR THE SIX MONTHS ENDED 30 JUNE 2019 (All amounts in RMB Yuan unless otherwise stated) [English translation for reference only]
160
3 Taxation (Cont'd)
(1) Enterprise income tax Pursuant to the Notice on the Deduction of Enterprise Income Tax Policies for Equipment and Apparatus (Cai Shui [2018] No. 54) and related regulations issued by the State Administration of Taxation, the cost of equipment purchased less than RMB 5,000,000 from 1 January 2018 to 31 December 2020 can be deducted against taxable on a straight-line basis over income in the following month after the assets are put into use, instead of being deducted annually in it’s useful life. The subsidiaries entitled to the preferential tax are presented as follows:
(a) Pursuant to the Notice on the Policies and Catalogue of Income Tax Preferences for Enterprises in Guangdong Hengqin New Area, Fujian Pingtan Comprehensive Experimental Zone, and Shenzhen Qianhai Shenzhen-Hong Kong Modern Service Industry Cooperative Zone (Cai Shui [2014] No. 26) jointly issued by the Ministry of Finance and the State Administration of Taxation, the Company’s subsidiaries as below are subject to enterprise income tax at the preferential rate of 15% from 2014 to 2020. Name of subsidiary Local statutory tax rate Preferential tax rate Guangdong S.F. E-commerce Co., Ltd. 25% 15% Shenzhen S.F. Supply Chain Co., Ltd. 25% 15% Shenzhen S.F. International Logistics Co., Ltd. 25% 15% Shenzhen S.F. DDJ Technology Co., Ltd. 25% 15% Shenzhen S.F. Information Service Technology Co.,
Ltd 25% 15%
(b) Pursuant to the Notice on Tax Policy Issues Concerning Further Implementing the Western China Development Strategy (Cai Shui [2011] No. 58) and the Notice on Issues Concerning the Implementation of the Tax Policies for the Development of Western China by Ganzhou City (Cai Shui [2013] No. 4) jointly issued by the Ministry of Finance, the General Administration of Customs and the State Administration of Taxation, the Company’s subsidiaries as below are subject to enterprise income tax at the preferential rate of 15% up to 2020: Name of subsidiary Local statutory tax rate Preferential tax rate S.F. Express (Chongqing) Co., Ltd. 25% 15% Guizhou S.F. Express Co., Ltd. 25% 15% Yunnan S.F. Express Co., Ltd. 25% 15% Sichuan S.F. Express Co., Ltd. 25% 15% Xi'an S.F. Express Co., Ltd. 25% 15% Guangxi S.F. Express Co., Ltd. 25% 15% S.F. Express (Ningxia) Co., Ltd. 25% 15% Inner Mongolia S.F. Express Co., Ltd. 25% 15% Xinjiang S.F. Express Co., Ltd. 25% 15% Qinghai S.F. Express Co., Ltd. 25% 15% Lanzhou S.F. Express Co., Ltd. 25% 15% Ganzhou S.F. Express Co., Ltd. 25% 15% Xi'an Shunlu Logistics Co., Ltd. 25% 15% Chongqing Huiyifeng Logistics Co., Ltd. 25% 15% Chengdu Taishun Logistics Co., Ltd. 25% 15% Xi'an SF Information Service Co., Ltd. 25% 15%

S.F. HOLDING CO., LTD. NOTES TO THE FINANCIAL STATEMENTS FOR THE SIX MONTHS ENDED 30 JUNE 2019 (All amounts in RMB Yuan unless otherwise stated) [English translation for reference only]
161
3 Taxation (Cont'd)
(1) Enterprise income tax (Cont'd)
(c) Pursuant to the Notice of the People's Government of the Tibet Autonomous Region on Issuing the Regulations on Preferential Policies for Investment Promotion of the Tibet Autonomous Region (Provisional) (Zang Zheng Fa [2018] No. 25), the Company’s subsidiaries, which are registered in Tibet Autonomous Region, are subject to enterprise income tax at the preferential rate of 15% as stipulated in the Western China Development Strategy from 1 January 2018 to 31 December 2020, and are temporarily exempt from the region’s share of entitlement to enterprise income tax payable from 1 January 2018 to 31 December 2021. In other words, the region’s share of entitlement to 40% in the enterprise income tax payable at the rate of 15% is exempted during the above period. Name of subsidiary Local statutory tax rate Preferential tax rate Tibet S.F. Express Co., Ltd. 25% 9%
(d) In accordance with Article 2 of the Notice on Implementing the Inclusive Tax Deduction and Exemption Policies for Micro and Small Enterprises (Cai Shui [2019] No. 13) jointly issued by the Ministry of Finance and the State Administration of Taxation, the taxable income of the Company’s subsidiaries below is recognised at 50% of income and they are subject to enterprise income tax at the rate of 20%:
Name of subsidiary Local statutory tax rate Preferential tax rate Weifang Fengtai E-Commerce Industrial Park
Management Ltd. 25% 20% Ezhou Shunlu Logistics Co., Ltd. 25% 20% Shenzhen S.F. Research Institution Co., Ltd. 25% 20% Shenzhen Fenglian Technology Co., Ltd. 25% 20% Ezhou Fengtai Qisheng Logistics Development Co.,
Ltd. 25% 20% Ezhou Fengyutai Helin Logistics Development Co.,
Ltd. 25% 20% Shenzhen Youli Technology Co., Ltd. 25% 20% Zhengzhou Shuncheng Logistics Co., Ltd. 25% 20% Shanghai Fengtai Yuanxing Property Management
Service Co., Ltd. 25% 20%
(e) In accordance with Article 1 of the Notice on Implementing the Inclusive Tax Deduction and Exemption Policies for Micro and Small Enterprises (Cai Shui [2019] No. 13) jointly issued by the Ministry of Finance and the State Administration of Taxation, the taxable income of the Company and its subsidiaries below is recognised at 25% of income and they are subject to enterprise income tax at the rate of 20%: Name of subsidiary Local statutory tax rate Preferential tax rate Ningbo Shuncheng Logistics Co., Ltd. 25% 20% Hangzhou Shunyifeng Import & Export Trading Co
Ltd. 25% 20% Shanghai Chengbai Technology Co., Ltd. 25% 20% Shenyang Fengtai E-Commerce Industrial Park
Management Ltd. 25% 20% Guizhou Shunlu Logistics Co., Ltd. 25% 20%

S.F. HOLDING CO., LTD. NOTES TO THE FINANCIAL STATEMENTS FOR THE SIX MONTHS ENDED 30 JUNE 2019 (All amounts in RMB Yuan unless otherwise stated) [English translation for reference only]
162
3 Taxation (Cont'd)
(1) Enterprise income tax (Cont'd)
(f) Pursuant to the Notice on Enterprise Income Tax Policies for Further Encouraging the Development of Software and Integrated Circuit Industries (Cai Shui [2012] No. 27) jointly issued by the Ministry of Finance and the State Administration of Taxation, the Notice on the Issues of the Policies of Enterprise Income Tax Preferences for Software and Integrated Circuit Industries (Cai Shui [2016] No. 49) jointly issued by the Ministry of Finance, the State Administration of Taxation, National Development and Reform Commission and the Ministry of Industry and Information Technology, and the Announcement on Issuing the Revised Measures for the Matters concerning Preferential Enterprise Income Tax Policies (Announcement [2018]) No. 23) issued by the State Administration of Taxation, and through filing with Shenzhen Nanshan District Taxation Bureau, the Company’s subsidiaries below were subject to enterprise income tax at the preferential rate of 10% from 1 January 2017 as a key software enterprise under the national planning and layout: Name of subsidiary Local statutory tax rate Preferential tax rate SF Technology Co., Ltd. (“SF Technology”) 25% 10%
(g) As per Article 28 of the Enterprise Income Tax Law of the People's Republic of China, the high and new technology enterprises eligible for key support from the State are entitled to a reduced tax rate of 15%. Through filing with local taxation bureaus, the Company’s subsidiaries as below are qualified as high and new technology enterprises, and entitled to the preferential tax rates for high and new technology enterprises eligible for key support from the State. The subsidiaries as below were subject to a tax rate of 15% in the reporting period. Name of subsidiary Local statutory tax rate Preferential tax rate S.F. Hengtong Pay Co., Ltd. 25% 15% Beijing Shunfeng Deda Logistics Technology
Co., Ltd(“Beijing Deda”) 25% 15% In addition, the Company’s subsidiaries located in Hong Kong, Singapore, Japan, Korea and USA are subject to enterprise income tax at the rates of 16.5%, 17%, 23.2%, 22% and 21% respectively in the reporting period. In addition to the above subsidiaries, the Company and its other major subsidiaries are subject to enterprise income tax at the rate of 25%.

S.F. HOLDING CO., LTD. NOTES TO THE FINANCIAL STATEMENTS FOR THE SIX MONTHS ENDED 30 JUNE 2019 (All amounts in RMB Yuan unless otherwise stated) [English translation for reference only]
163
3 Taxation (Cont'd)
(2) VAT According to different businesses, VAT rates applicable to the Group include: Business type Applicable VAT rates Sales of goods and leasing (i) 17% (before 1 May 2018),
16% (from 1 May 2018 to 31 March 2019), 13% (implement from 1 April 2019)
Transportation service (i) 11% (before 1 May 2018),
10% (from 1 May 2018 to 31 March 2019), 9% (implement from 1 April 2019)
Logistics supporting service 6% R&D and technical service 6% Information technology service 6% Property leases (i) 11% (before 1 May 2018),
10% (from 1 May 2018 to 31 March 2019), 9% (implement from 1 April 2019)
(i) Pursuant to the Notice on Adjustment of VAT Tax Rate (Cai Shui [2018] No. 32), taxpayers who
engage in VAT taxable sales or imported goods are subject to 17% and 11% tax rates, and the tax rates are adjusted to 16% and 10% respectively. The aforesaid circular has been effective since 1 May 2018. Pursuant to the Announcement on Policies for Deepening the Value-Added Tax Reform (Cai Shui [2019] No. 39), the VAT taxable sales or goods import, which were subject to the tax rates of 16% and 10%, are subject to 13% and 9% respectively upon adjustment. The aforesaid circular has been effective since 1 April 2019.

S.F. HOLDING CO., LTD. NOTES TO THE FINANCIAL STATEMENTS FOR THE SIX MONTHS ENDED 30 JUNE 2019 (All amounts in RMB Yuan unless otherwise stated) [English translation for reference only]
164
4 Notes to the consolidated financial statements
(1) Cash at bank and on hand 30 June 2019 31 December 2018 Cash on hand 925,135.67 1,333,057.53 Cash at bank (a) 11,793,650,488.63 15,181,387,817.87 Balances with central bank from Group
Finance Company 596,684,272.44 886,346,294.94 Including: Balances with central bank -
statutory reserve (b) 592,676,085.96 873,705,941.98 Balances with central bank -
excess reserve (c) 4,008,186.48 12,640,352.96 Other cash balances (a) 95,958,058.41 62,052,680.22 12,487,217,955.15 16,131,119,850.56
Including: Total overseas deposits 1,418,614,001.59 1,539,296,677.54
(a) As at 30 June 2019, RMB 32,247.00 (31 December 2018: RMB 139,907.00) of the other cash balances represented guarantee deposits with banks for letter of guarantee and was restricted. As at 31 December 2018, the secured bank borrowings of RMB 86,400,000.00 were pledged by the Group’s fixed deposits of RMB 30,000,000.00, and such pledge was released within the reporting period.
(b) On 18 September 2016, Taisen Holdings incorporated S.F. Holding Group Finance Co., Ltd. (hereinafter “Group Finance Company”). Statutory reserve of Group Finance Company deposited with the central bank represents required statutory reserve paid by financial enterprises in the People's Bank of China (“PBOC”) at 6% of deposits from customers denominated in RMB. Statutory reserve deposits are not available for use by the Group in its day to day operations, which are restricted cash.
(c) Surplus reserve of Group Finance Company deposited with the central bank represents the excess over the required statutory reserve paid by financial institutions in the central bank, and it is bank deposit that can be readily drawn on demand.
(2) Financial assets at fair value through profit or loss 31 December 2018 Investments in equity instrument held for
trading 13,715,336.78 Forward interest rate swap contracts 726,641.31 14,441,978.09
(3) Financial assets held for trading 30 June 2019 Structural deposits 2,509,960,802.13 Others 15,803,836.66 2,525,764,638.79

S.F. HOLDING CO., LTD. NOTES TO THE FINANCIAL STATEMENTS FOR THE SIX MONTHS ENDED 30 JUNE 2019 (All amounts in RMB Yuan unless otherwise stated) [English translation for reference only]
165
4 Notes to the consolidated financial statements (Cont’d)
(4) Accounts receivable 30 June 2019 31 December 2018 Accounts receivable 8,594,782,325.79 7,432,334,261.92 Less: Provision for bad debts (156,621,134.24) (79,456,513.05) 8,438,161,191.55 7,352,877,748.87 The Group adopts regular settlement method for express & logistics comprehensive services provided to some customers. At each month-end, the outstanding part becomes accounts receivable.
(a) The ageing of accounts receivable is analysed below: 30 June 2019 31 December 2018 Within 1 year (inclusive) 8,484,572,828.94 7,359,283,705.95 1 - 2 years (inclusive) 62,814,614.58 53,918,666.20 Over 2 years 47,394,882.27 19,131,889.77 8,594,782,325.79 7,432,334,261.92
(b) The Group’s accounts receivable comprise the accounts receivable from the customers under monthly settlement. As at 30 June 2019, the five largest amounts of accounts receivable aggregated by debtors were summarised and analysed as follows: 30 June 2019
Amount Amount of provision
for bad debts % of total balance
Sum of the five largest accounts receivable 736,619,491.42 (3,683,097.46) 8.57%

S.F. HOLDING CO., LTD. NOTES TO THE FINANCIAL STATEMENTS FOR THE SIX MONTHS ENDED 30 JUNE 2019 (All amounts in RMB Yuan unless otherwise stated) [English translation for reference only]
166
4 Notes to the consolidated financial statements (Cont’d)
(4) Accounts receivable (Cont’d)
(c) Provision for bad debts Under the new financial instrument standards, the Group always prepares losses for accounts receivable based on the expected credit losses for the entire duration. As at 30 June 2019, accounts receivable for which the related provision for bad debts is provided on the individual basis are analysed as follows:
Ending balance
Lifetime expected credit
loss rate Provision for bad
debts Reason Receivables
from related parties 13,255,247.18 100.00% (13,255,247.18)
The debtor encountered
financial difficulties, etc.
Receivables from non-related parties 93,265,994.45 100.00% (93,265,994.45)
106,521,241.63 (106,521,241.63) As at 30 June 2019, accounts receivable for which the related provision for bad debts was provided on the grouping basis were analysed as follows: 30 June 2019 Ending balance Provision for bad debts
Amount Lifetime expected
credit loss rate Amount The group of
related parties 290,106,155.59 - - The group of non-
related parties 8,198,154,928.57 0.61% (50,099,892.61) 8,488,261,084.16 (50,099,892.61) Under the revised financial instrument standards, the Group's provision for bad debts of accounts receivable is analyzed as follows: As at 31 December 2018 Ending balance Provision for bad debts Amount % of total balance Amount Percentage Provision for bad debts on individual
basis Receivables from related parties 13,261,064.53 0.18% (13,261,064.53) 100.00% Receivables from non-related
parties 23,795,014.21 0.32% (23,795,014.21) 100.00% Provision for bad debts on grouping
basis Receivables from related parties 174,836,472.94 2.35% - - Receivables from non-related
parties 7,220,441,710.24 97.15% (42,400,434.31) 0.59% 7,432,334,261.92 100.00% (79,456,513.05) 1.07%

S.F. HOLDING CO., LTD. NOTES TO THE FINANCIAL STATEMENTS FOR THE SIX MONTHS ENDED 30 JUNE 2019 (All amounts in RMB Yuan unless otherwise stated) [English translation for reference only]
167
4 Notes to the consolidated financial statements (Cont’d)
(4) Accounts receivable (Cont’d)
(c) Provision for bad debts(Cont’d)
For the six months ended 30 June 2019, the Group’s provision for bad debts amounted to RMB 79,264,307.29, and there was no provision for bad debts reversed(Note 4(24)).
For the six months ended 30 June 2019, the provision for bad debts of accounts receivable that was written off amounted to RMB 14,624,394.24 and no accounts receivable with amounts that are individually significant were written off(Note 4(24)).
(5) Other receivables 30 June 2019 31 December 2018 Current accounts receivable from related
parties (Note 8(4)(c)) 292,919,000.57 188,372,946.30 Guarantees and deposits 629,903,832.40 567,057,200.70 Cash on delivery service 222,195,652.03 180,008,388.19 Equity transfer receivable 106,979,595.37 - Employee borrowings and advances 100,562,324.57 117,914,472.13 Entrusted loans receivable 27,000,000.00 27,000,000.00 Social insurance premium prepaid 16,998,234.49 17,332,616.45 Interest receivable - 47,810,100.13 Others 336,585,963.19 265,275,452.25 1,733,144,602.62 1,410,771,176.15 Less: Provision for bad debts (17,497,977.70) (12,857,692.63) 1,715,646,624.92 1,397,913,483.52
(a) The ageing of other receivables is analysed as follows: 30 June 2019 31 December 2018 Within 1 year (inclusive) 1,358,279,331.12 1,065,321,416.55 1 - 2 years (inclusive) 172,364,701.01 136,307,658.64 Over 2 years 202,500,570.49 209,142,100.96 1,733,144,602.62 1,410,771,176.15

S.F. HOLDING CO., LTD. NOTES TO THE FINANCIAL STATEMENTS FOR THE SIX MONTHS ENDED 30 JUNE 2019 (All amounts in RMB Yuan unless otherwise stated) [English translation for reference only]
168
4 Notes to the consolidated financial statements (Cont’d)
(5) Other receivables (Cont’d)
(b) Provision for losses:
(i) Under the new financial instrument standard, the Group measures the loss for other receivables based on the expected credit losses for the next twelve months or the entire duration. Stage 1 Stage 3
Expected credit losses in the following 12
months (grouping) Lifetime expected credit losses (credit
impaired)
Total
Ending balance Provision for bad
debts
Ending balance Provision for bad
debts Provision for
bad debts 1 January 2019 1,383,519,550.55 (4,506,067.03) 27,251,625.60 (8,351,625.60) (12,857,692.63) Increase in the current
period
330,783,096.97 (13,049,955.57)
- -
(13,049,955.57) Write-off in the current
period
(8,409,670.50) 8,409,670.50
- -
8,409,670.50 30 June 2019 1,705,892,977.02 (9,146,352.10) 27,251,625.60 (8,351,625.60) (17,497,977.70)

S.F. HOLDING CO., LTD. NOTES TO THE FINANCIAL STATEMENTS FOR THE SIX MONTHS ENDED 30 JUNE 2019 (All amounts in RMB Yuan unless otherwise stated) [English translation for reference only]
169
4 Notes to the consolidated financial statements (Cont’d)
(5) Other receivables (Cont’d)
(b) Provision for losses (Cont’d): As at 30 June 2019, for other receivables at stage 1, the related provision for bad debts was analysed below:
Ending balance
Expected credit loss rate in the following 12 months
Provision for bad debts Reason
Provided on the grouping basis: Related party grouping 292,919,000.57 - - Not applicable
Non-related party grouping 1,412,973,976.45 0.65%
(9,146,352.10) Expected credit
loss method 1,705,892,977.02 (9,146,352.10)
As at 30 June 2019, the Group did not have any other receivables at stage 2.
As at 30 June 2019, for other receivables at stage 3, the related provision for bad debts was analysed below:
Ending balance Lifetime expected
credit losses Provision for bad
debts Reason Provided on the individual
basis:
Entrusted loans receivable 27,000,000.00 30.00%
(8,100,000.00) The debtor encountered
financial difficulties
Others 251,625.60 100.00%
(251,625.60) The debtor encountered
financial difficulties 27,251,625.60 (8,351,625.60)
(ii) Under the revised financial instrument standards, the provision for bad debts of other receivables
accrued by the Group is as follows: As at 31 December 2018 Ending balance Provision for bad debts
Amount % of total
balance Amount Percentage Provision for bad debts on
individual basis Receivables from related
parties 251,625.60 0.02% (251,625.60) 100.00% Receivables from non-related
parties 27,000,000.00 1.92% (8,100,000.00) 30.00% Provision for bad debts on
grouping basis Receivables from related
parties 188,121,320.70 13.33% - - Receivables from non-related
parties 1,195,398,229.85 84.73% (4,506,067.03) 0.38% 1,410,771,176.15 100.00% (12,857,692.63) 0.91%
(c) For the six months ended 30 June 2019, the Group’s provision for bad debts amounted to RMB
13,044,791.88, and there was no provision for bad debts reversed (Note 4(24)).
(d) For the six months ended 30 June 2019, the Group’s other receivables that were written off amounted to RMB 8,409,670.50, and no other receivables with amounts that are individually significant were written off(Note 4(24)).

S.F. HOLDING CO., LTD. NOTES TO THE FINANCIAL STATEMENTS FOR THE SIX MONTHS ENDED 30 JUNE 2019 (All amounts in RMB Yuan unless otherwise stated) [English translation for reference only]
170
4 Notes to the consolidated financial statements (Cont’d)
(5) Other receivables (Cont’d)
(e) As at 30 June 2019, the five largest other receivables aggregated by debtor were summarised and analysed as follows: 30 June 2019
Nature of business Ageing Amount Amount of provision
for bad debts % of total balance
Shenzhen Hive Box Technology Co.,
Ltd. (“Hive Box Technology”) (Note 8(4)(c))
Agency collection and payment
Within 1 year 189,018,739.98 - 10.91%
Shurui (Xiamen) Science and Technology Co., Ltd.
Equity transfer receivable
Within 1 year 101,500,000.00 (507,500.00) 5.86%
MHK Restaurants Limited”) (Note 8(4)(c))
Agency collection and payment
Within 1 year 54,008,413.33 - 3.12%
Hangzhou International Airport Airlines subsidy Within 1
year 49,000,000.00 (245,000.00) 2.83% Guangdong Baolichi New Energy
Automobile Service Co., Ltd. Deposit and
security deposit Within 2
year 42,000,000.00 (210,000.00) 2.42% 435,527,153.31 (962,500.00) 25.14%

S.F. HOLDING CO., LTD. NOTES TO THE FINANCIAL STATEMENTS FOR THE SIX MONTHS ENDED 30 JUNE 2019 (All amounts in RMB Yuan unless otherwise stated) [English translation for reference only]
171
4 Notes to the consolidated financial statements (Cont’d)
(6) Advances to suppliers
(a) The ageing of advances to suppliers is analysed below:
30 June 2019 31 December 2018 Ageing Amount % of total balance Amount % of total balance Within 1 year (inclusive) 2,397,061,306.56 98.01% 2,465,558,542.39 97.96% 1 - 2 years (inclusive) 32,815,207.44 1.34% 20,098,754.74 0.80% Over 2 years 15,891,876.66 0.65% 31,193,904.22 1.24% 2,445,768,390.66 100.00% 2,516,851,201.35 100.00% As at 30 June 2019, advances to suppliers with ageing over one year were mainly prepaid property rents, fuel cards, etc. As relevant business transactions were not completed, the amounts were not settled yet.

S.F. HOLDING CO., LTD. NOTES TO THE FINANCIAL STATEMENTS FOR THE SIX MONTHS ENDED 30 JUNE 2019 (All amounts in RMB Yuan unless otherwise stated) [English translation for reference only]
172
4 Notes to the consolidated financial statements (Cont’d)
(6) Advances to suppliers (Cont'd)
(b) As at 30 June 2019, the amount of top five advances to suppliers was analysed as follows: 30 June 2019
Amount % of total balance
Sum of the five largest advances to suppliers 466,378,919.43 19.07%
(7) Factoring receivables As at 30 June 2019 and 31 December 2018, Factoring receivables were from the subsidiary Shenzhen Shuncheng Lefeng Factoring Co., Ltd (“Lefeng Factoring”). 30 June 2019 31 December 2018 Factoring receivables 149,670,834.23 456,828,342.81 Less: Provision for bad debts (62,735,595.93) (9,655,084.16) 86,935,238.30 447,173,258.65
(a) Factoring receivables are disclosed by category as follows: 30 June 2019
Amount Proportion Provision for bad
debts Net amount Factoring with
recourse 149,670,834.23 100.00% (62,735,595.93) 86,935,238.30 31 December 2018
Amount Proportion Provision for bad
debts Net amount Factoring with
recourse 456,828,342.81 100.00% (9,655,084.16) 447,173,258.65

S.F. HOLDING CO., LTD. NOTES TO THE FINANCIAL STATEMENTS FOR THE SIX MONTHS ENDED 30 JUNE 2019 (All amounts in RMB Yuan unless otherwise stated) [English translation for reference only]
173
4 Notes to the consolidated financial statements (Cont’d)
(7) Factoring receivables (Cont’d)
(b) As at 30 June 2019, the Group's overdue factoring totaled RMB 140,658,622.66 (31 December 2018: RMB 152,268,731.29), with an age of less than one year.
(c) For the six months ended 30 June 2019, the Group’s provision for bad debts and bad debts reversed
amounted to RMB 58,118,407.06 and RMB 5,037,895.29 respectively, and there was no provision for bad debts written-off (Note 4(24)).
(d) As at 30 June 2019, the Group’s Factoring receivables that are individually for which related provision for bad debts is provided on individual basis amounted to RMB 122,527,142.92, and the related provision for bad debts RMB 61,263,571.46.
(8) Loans and advances As at 30 June 2019 and 31 December 2018, loans and advances were all from S.F. Finance (Hong Kong) Limited (“S.F. Finance”), which is a subsidiary of the Group in Hong Kong.
(a) Loans and advances by individual and enterprise 30 June 2019 31 December 2018 Personal loans 134,667.77 178,001.67 Enterprise loans
Non-related party loans 101,238,468.43 106,051,349.54 Loans and advances - total 101,373,136.20 106,229,351.21 Less: Provision for loan losses (14,137,195.17) (11,158,725.91) Loans and advances - net 87,235,941.03 95,070,625.30

S.F. HOLDING CO., LTD. NOTES TO THE FINANCIAL STATEMENTS FOR THE SIX MONTHS ENDED 30 JUNE 2019 (All amounts in RMB Yuan unless otherwise stated) [English translation for reference only]
174
4 Notes to the consolidated financial statements (Cont’d)
(8) Loans and advances (Cont’d)
(b) Loans and advances analysed by type of collateral 30 June 2019 31 December 2018 Unsecured loans 94,198,708.43 99,024,069.54 Guaranteed loans 7,174,427.77 7,205,281.67 Loans and advances - total 101,373,136.20 106,229,351.21
(c) Overdue loans are presented by pass-due ageing as follows: 30 June 2019
Within 3 months
3 months - 1 year 1 - 3 years Over 3 years Total
Unsecured loans 515,254.11 2,425,415.55 - - 2,940,669.66
31 December 2018
Within 3 months
3 months - 1 year 1 - 3 years Over 3 years Total
Unsecured loans 436,925.53 226,867.83 - - 663,793.36
(d) For the six months ended 30 June 2019, the Group’s provision for bad debts and bad debts written-
off amounted to RMB 3,475,742.51 and RMB 497,273.25 respectively, and there was no provision for bad debts reversed (Note 4(24)).
(e) As at 30 June 2019, the Group had no loans of which related provision for bad debts was provided on individual basis.

S.F. HOLDING CO., LTD. NOTES TO THE FINANCIAL STATEMENTS FOR THE SIX MONTHS ENDED 30 JUNE 2019 (All amounts in RMB Yuan unless otherwise stated) [English translation for reference only]
175
4 Notes to the consolidated financial statements (Cont’d) (9) Inventories
Inventories are summarised by category as follows: 30 June 2019
Ending balance
Provision for decline in the value of
inventories Carrying amount Raw materials in stock 348,000,845.70 - 348,000,845.70 Aviation consumables 172,181,040.62 - 172,181,040.62 Finished goods 110,680,654.39 - 110,680,654.39 Properties under
development 79,078,000.00 - 79,078,000.00 Low-value consumables 25,172,360.84 - 25,172,360.84 735,112,901.55 - 735,112,901.55 31 December 2018
Ending balance
Provision for decline in the value of
inventories Carrying amount Raw materials in stock 426,581,892.04 - 426,581,892.04 Finished goods 128,321,781.99 - 128,321,781.99 Aviation consumables 125,375,475.35 - 125,375,475.35 Properties under
development 79,078,000.00 - 79,078,000.00 Low-value consumables 34,613,558.73 - 34,613,558.73 Others 24,079,316.91 - 24,079,316.91 818,050,025.02 - 818,050,025.02
(10) Other current assets 30 June 2019 31 December 2018 Bank wealth management products (i) 2,418,220,958.88 564,456,452.05 Input VAT to be offset 2,419,809,267.10 2,345,446,399.93 Prepaid enterprise income tax 101,190,094.81 87,966,412.84 Others 1,277,361.93 6,090,309.48 4,940,497,682.72 3,003,959,574.30
(i) The investment cycle of bank wealth management products is generally within 1 month to 3 months. According to the contract, the contractual cash flow characteristics are in line with the basic loan arrangement and are therefore measured at amortized cost.

S.F. HOLDING CO., LTD. NOTES TO THE FINANCIAL STATEMENTS FOR THE SIX MONTHS ENDED 30 JUNE 2019 (All amounts in RMB Yuan unless otherwise stated) [English translation for reference only]
176
4 Notes to the consolidated financial statements (Cont’d)
(11) Available-for-sale financial assets Under the original financial instrument standards, the Group's available-for-sale financial assets are analysed as follows: 31 December 2018 Measured at fair value
- Available-for-sale debt instruments (a) 178,403,812.08 - Available-for-sale equity instruments (b) 3,070,327,696.74
Measured at cost
- Available-for-sale equity instruments 174,795,551.45 3,423,527,060.27
(a) Available-for-sale debt instruments measured at fair value: 31 December 2018 Available-for-sale debt instruments
- Fair value 178,403,812.08 - Amortised cost 183,000,000.00 - Accumulated provision for impairment (4,596,187.92)
(b) Available-for-sale equity instruments measured at fair value:
31 December 2018 Available-for-sale equity instruments
- Fair value 3,070,327,696.74 - Cost 2,718,113,957.55 - Accumulated amount recognised in
other comprehensive income 352,213,739.19 - Accumulated provision for impairment -

S.F. HOLDING CO., LTD. NOTES TO THE FINANCIAL STATEMENTS FOR THE SIX MONTHS ENDED 30 JUNE 2019 (All amounts in RMB Yuan unless otherwise stated) [English translation for reference only]
177
4 Notes to the consolidated financial statements (Cont’d)
(12) Long-term receivables 30 June 2019 31 December 2018 Finance lease receivables (a) - - Interest-free loans to employees
receivable (b) 228,011,459.71 324,736,080.74 Deposit for house purchase 246,757,710.00 246,757,710.00 474,769,169.71 571,493,790.74
(a) Finance lease receivables 30 June 2019 31 December 2018 Finance lease receivables 30,620,458.62 73,046,804.28 Less: Unrealised financing income (1,198,046.77) (4,121,125.88) Amortised cost of finance lease receivables 29,422,411.85 68,925,678.40 Less: Current portion of finance lease
receivables (18,541,854.93) (57,691,466.26) Provision for bad debts (10,880,556.92) (11,234,212.14)
- - Finance lease receivables that should be received after the balance sheet date are as follows: 30 June 2019 31 December 2018
Amount % of total
balance Provision for
bad debts Amount % of total
balance Provision for
bad debts Within 1
year 30,620,458.62 100.00% (10,880,556.92) 73,046,804.28 100.00% (11,234,212.14)

S.F. HOLDING CO., LTD. NOTES TO THE FINANCIAL STATEMENTS FOR THE SIX MONTHS ENDED 30 JUNE 2019 (All amounts in RMB Yuan unless otherwise stated) [English translation for reference only]
178
4 Notes to the consolidated financial statements (Cont’d)
(12) Long-term receivables (Cont’d) (b) Interest-free loans to employees receivable
30 June 2019 31 December 2018 Interest-free loans to employees receivable 366,980,000.00 435,850,000.00 Less: Prepaid discount interest (36,580,984.73) (45,607,919.26) Amortised cost of interest-free loans to
employees 330,399,015.27 390,242,080.74 Less: Current portion of interest-free loans to
employees (102,387,555.56) (65,506,000.00) Provision for bad debts - -
228,011,459.71 324,736,080.74 As at 30 June 2019, interest-free loans to employees receivable the interest-free loans to qualified employees with a term of 5 years.
(13) Long-term equity investments 30 June 2019 31 December 2018 Cost: Joint ventures 1,341,533,741.80 1,326,581,550.05 Associates 984,020,811.60 934,446,087.67 2,325,554,553.40 2,261,027,637.72 Less: Provision for impairment of long-term
equity investments
- Joint ventures (30,718,697.26) (28,236,883.66) - Associates (43,988,895.88) (29,359,632.03)
(74,707,593.14) (57,596,515.69) Joint ventures (a) 1,310,815,044.54 1,298,344,666.39 Associates (b) 940,031,915.72 905,086,455.64 2,250,846,960.26 2,203,431,122.03

S.F. HOLDING CO., LTD. NOTES TO THE FINANCIAL STATEMENTS FOR THE SIX MONTHS ENDED 30 JUNE 2019 (All amounts in RMB Yuan unless otherwise stated) [English translation for reference only]
179
4 Notes to the consolidated financial statements (Cont’d)
(13) Long-term equity investments (Cont’d)
(a) Joint ventures
Movements in the current period
Carrying amount as at 31 December
2018
Increase in investments
Decrease in investments
Share of net profit/(loss) under
equity method
Exchange differences on translation of
foreign currency financial
statements
Other changes in equity (i)
Accrual of provision for
impairment loss
Carrying amount as at 30 June 2019
Balance of
provision for impairment loss at the end of the
period Hubei International Logistics Airport Co., Ltd. 919,822,243.93 - - (3,012,908.47) - - - 916,809,335.46 - ZBHA Group Co., Ltd. (“ZBHA”) 207,521,652.37 - - 1,877,757.19 - - - 209,399,409.56 - Beijing Wulian Shuntong Technology Co., Ltd. 30,000,000.00 40,000,000.00 - (7,490,933.68) - - - 62,509,066.32 - Hubei International Aviation Industry Metro
Development Co., Ltd. 40,206,913.74 - - 2,412.05 - - - 40,209,325.79 - Zhongyunda Aviation Ground Services Co., Ltd. 30,049,574.25 - - (4,275,768.23) - - - 25,773,806.02 - POST11OÜ 15,921,028.91 - - 6,865,530.12 - - - 22,786,559.03 - Beijing Shunhetongxin Technology Co., Ltd. 15,145,429.40 - - (3,921,499.47) - - - 11,223,929.93 - Shenzhen Shenghai Information Service Co., Ltd.
(“Shenghai Information”) 6,770,965.97 - - 493,158.21 - - - 7,264,124.18 - CR-SF International Express Co., Ltd. 4,858,622.97 - - 2,009,488.32 - - - 6,868,111.29 - Wenzhou Fengbaoke Technology Co., Ltd. 2,000,000.00 - - (397,818.79) - 842,393.75 - 2,444,574.96 - Shanghai Geling Information Technology Co., Ltd.
(“Geling Information”) 1,842,672.10 - - 134,595.44 - - - 1,977,267.54 - Shanghai Pharma DHL Supply Chain (Shanghai) Co.,
Ltd. (ii) - 2,030,750.79 - 7,078.40 (64,750.68) - - 1,973,078.51 - Global Connect Holding Limited 1,036,999.03 - - 539,456.92 - - - 1,576,455.95 - Shang Shun Supply Chain Management (China) Co.,
Ltd. 23,168,563.72 - (22,785,996.03) - (382,567.69) - - - - Guangzhou Leshou Network Technologies Co., Ltd.
(“Leshou Network”) - 2,500,000.00 - (18,186.40) - - (2,481,813.60) - (30,718,697.26) 1,298,344,666.39 44,530,750.79 (22,785,996.03) (7,187,638.39) (447,318.37) 842,393.75 (2,481,813.60) 1,310,815,044.54 (30,718,697.26)
(i) Those represent changes in equity resulting from capital injections by investors other than the Group.

S.F. HOLDING CO., LTD. NOTES TO THE FINANCIAL STATEMENTS FOR THE SIX MONTHS ENDED 30 JUNE 2019 (All amounts in RMB Yuan unless otherwise stated) [English translation for reference only]
180
4 Notes to the consolidated financial statements (Cont’d)
(13) Long-term equity investments (Cont’d)
(b) Associates
Movements in the current period
Carrying amount as at 31 December
2018 Increase in
investments
Share of net profit/(loss) under
equity method
Exchange differences on translation of
foreign currency financial
statements
Other comprehensive
income adjustment
Accrual of provision for
impairment loss Carrying amount as
at 30 June 2019
Balance of provision for
impairment loss at the end of the
period Zhejiang Galaxis Technology Co., Ltd. 165,725,961.09 - 154,360.56 - - - 165,880,321.65 - Zhuhai Sui Bian Technology Co., Ltd. (“Zhuhai
Sui Bian”) 157,457,861.35 - (33,835,933.64) - -
- 123,621,927.71 (8,031,343.63) Jiangsu Chiata Foton Co., Ltd. 109,489,454.90 - (993,283.11) - - - 108,496,171.79 - Beijing Dazhangfang Network Technology Co.,
Ltd. (hereinafter “Beijing Dazhangfang”) 105,360,602.87 - (3,388,313.11) - -
- 101,972,289.76 - Shenzhen Bai Mi Life Co., Ltd. 93,653,469.59 - (140,240.22) - - - 93,513,229.37 - DHL Weiheng (Zhuhai) Supply Chain
Management Co., Ltd. (ii) - 63,403,384.03 (85,533.65) 302,189.44 -
- 63,620,039.82 -
Feng Wang Investment Co., Ltd. 49,583,185.02 - 1,463,551.38 - (1,956,923.83) - 49,089,812.57 - Langxing UAV System Co., Ltd. 42,286,144.93 - (782,584.79) - - - 41,503,560.14 - Shenzhen Canbeidou Supply Chain
Management Co., Ltd. “Canbeidou Supply Chain”) 31,203,326.00 5,000,000.00 (2,066,177.19) - -
- 34,137,148.81 - Little Red Hat Issuance Co., Ltd. (“Little Red
Hat”) 39,935,693.38 - 1,203,989.34 - -
(14,629,263.85) 26,510,418.87 (14,629,263.85) Beijing GreenValley Technology Limited 22,303,055.14 - (271,203.36) - - - 22,031,851.78 - Shenzhen SF Lottery Technology Development
Co., Ltd. (“SF Lottery”) 20,243,932.95 - (594,766.39) - -
- 19,649,166.56 - PT TRI ADI BERSAMA 11,030,861.92 10,358,610.85 (2,526,240.70) (20,673.26) - - 18,842,558.81 - Shenzhen Zhi Hang UAV Co., Ltd. 20,725,087.16 - (2,272,901.17) - - - 18,452,185.99 - Guangdong Shucheng Technology Co., Ltd. 11,111,112.00 - (337,679.75) - - - 10,773,432.25 - Shenzhen Shun Jie Feng Da Express Co., Ltd. 9,797,782.97 - 197,366.34 - - - 9,995,149.31 (20,480,557.60)

S.F. HOLDING CO., LTD. NOTES TO THE FINANCIAL STATEMENTS FOR THE SIX MONTHS ENDED 30 JUNE 2019 (All amounts in RMB Yuan unless otherwise stated) [English translation for reference only]
181
4 Notes to the consolidated financial statements (Cont’d)
(13) Long-term equity investments (Cont’d)
(b) Associates (Cont’d)
Movements in the current period
Carrying amount as at 31 December
2018 Increase in
investments
Share of net profit/(loss) under
equity method
Exchange differences on translation of
foreign currency financial
statements
Other comprehensive
income adjustment
Accrual of provision for
impairment loss Carrying amount as
at 30 June 2019
Balance of provision for
impairment loss at the end of the
period
Xi'an Huahan Air Passenger and Freight Service
Co., Ltd. 4,914,936.19 2,106,401.22 1,062,406.31 - - - 8,083,743.72 - Kin Shun Information Technology Limited - 5,609,808.75 (1,047,837.51) (16,700.51) - - 4,545,270.73 - Chongqing Boqiang Logistics Co., Ltd. 3,083,249.31 1,321,392.56 45,378.54 - - - 4,450,020.41 - Beijing Prettyfeather Brand Management Co.,
Ltd. 4,551,225.71 - (254,623.81) -
-
- 4,296,601.90 - Wuhan Jinyu DHL Supply Chain Management
Co., Ltd. - 3,798,169.58 (39,493.95) (120,957.44)
-
- 3,637,718.19 - Qingdao Dakai Cargo Agency Co., Ltd. 2,128,255.53 912,109.51 (17,971.33) - - - 3,022,393.71 - KINGS (HK) INTERNATIONAL LIMITED - 2,111,928.00 803,097.67 12,799.83 - - 2,927,825.50 - GSEXPRESSHOLDINGSPTE.LTD - 550,956.34 - - - - 550,956.34 - Shenzhen Xiaofeng Technology Co., Ltd.
(“Xiaofeng Technology”) 501,257.63 - (73,137.60) - -
- 428,120.03 (847,730.80) 905,086,455.64 95,172,760.84 (43,797,771.14) 156,658.06 (1,956,923.83) (14,629,263.85) 940,031,915.72 (43,988,895.88)
(ii) Those represent the Group's joint ventures and associates acquired through the acquisition of DHL Supply Chain (Hong Kong) Limited (“DHL HK”) and DHL
Logistics (Beijing) Co., Ltd. (“DHL BJ”) (Note 5(1)(b)) via business combination.

S.F. HOLDING CO., LTD. NOTES TO THE FINANCIAL STATEMENTS FOR THE SIX MONTHS ENDED 30 JUNE 2019 (All amounts in RMB Yuan unless otherwise stated) [English translation for reference only]
182
4 Notes to the consolidated financial statements (Cont’d)
(14) Investments in other equity instruments 30 June 2019 Equity of listed companies 792,918,258.45 Equity of unlisted companies 3,249,780,185.56 4,042,698,444.01
Item
Dividend income recognised in the
current period
Accumulated gains or losses recognised in
other comprehensive income
Equity of listed companies - 36,493,952.74 Equity of unlisted companies - 412,148,625.59 - 448,642,578.33

S.F. HOLDING CO., LTD. NOTES TO THE FINANCIAL STATEMENTS FOR THE SIX MONTHS ENDED 30 JUNE 2019 (All amounts in RMB Yuan unless otherwise stated) [English translation for reference only]
183
4 Notes to the consolidated financial statements (Cont’d) (14) Investments in other equity instruments (Cont’d)
31 December
2018 Changes in
accounting policies 1 January 2019 Increase in the current period
Changes in fair value of current period
Disposal in the current period
Foreign exchange gains or losses and exchange differences on translation of
foreign currency financial
statements 30 June 2019
Listed company
equity - 815,357,936.75 815,357,936.75 - 31,339,063.00 (54,996,904.28) 1,218,162.98 792,918,258.45 Non-listed
company equity - 1,997,472,148.15 1,997,472,148.15 1,257,296,652.39 (6,709,480.35) (175,682.00) 1,896,547.37 3,249,780,185.56
- 2,812,830,084.90 2,812,830,084.90 1,257,296,652.39 24,629,582.65 (55,172,586.28) 3,114,710.35 4,042,698,444.01

S.F. HOLDING CO., LTD. NOTES TO THE FINANCIAL STATEMENTS FOR THE SIX MONTHS ENDED 30 JUNE 2019 (All amounts in RMB Yuan unless otherwise stated) [English translation for reference only]
184
4 Notes to the consolidated financial statements (Cont’d)
(15) Other non-current financial assets 30 June 2019 Financial assets held for trading (over one
year): Industry fund investments 195,283,651.74 Special scheme equity-class securities 138,000,000.00 Discounted stock option 71,781,728.81
405,065,380.55
(16) Investment properties Buildings Land use rights Total Cost As at 31 December 2018 1,545,871,953.21 1,058,161,494.78 2,604,033,447.99
Transfer from self-used assets in the current period (Note 4 (17), (18), (19)) 338,082,842.02 98,289,203.86 436,372,045.88
Transfer to self-used assets in the current period (Note 4(17), (19)) (307,239,281.03) (94,397,480.70) (401,636,761.73)
Effect of translation of foreign currency financial statements 1,072,695.90 1,510,780.24 2,583,476.14
As at 30 June 2019 1,577,788,210.10 1,063,563,998.18 2,641,352,208.28 Accumulated depreciation As at 31 December 2018 74,842,688.75 75,259,257.70 150,101,946.45
Transfer from self-used assets in the current period (Note 4(17), (19)) 2,452,041.69 7,130,087.95 9,582,129.64
Provision in the current period 19,201,960.24 13,403,196.82 32,605,157.06 Transfer to self-used assets in the
current period (Note 4(17), (19)) (21,507,647.05) (8,148,525.75) (29,656,172.80) Effect of translation of foreign
currency financial statements 93,178.43 106,779.43 199,957.86 As at 30 June 2019 75,082,222.06 87,750,796.15 162,833,018.21 Carrying amount As at 30 June 2019 1,502,705,988.04 975,813,202.03 2,478,519,190.07 As at 31 December 2018 1,471,029,264.46 982,902,237.08 2,453,931,501.54
For the six months ended 30 June 2019, no borrowing cost was recognised in investment properties (for the six months ended 30 June 2018: Nil). As at 30 June 2019, the Group was still in the process of applying for certificates of ownership for certain buildings with carrying amount of RMB 571,234,394.63 (cost of RMB 577,383,288.40)(31 December 2018: carrying amount of RMB 600,697,558.47 and cost of RMB 602,571,540.07). In addition, as at 30 June 2019, the Group had no land use rights without certificates (31 December 2018: land use rights with carrying amount of RMB 95,106,403.06 and cost of RMB 102,600,875.61 with certificates being handled). As at 30 June 2019, investment properties with carrying amount of RMB 496,985,596.74 (cost of RMB 509,215,459.44) (31 December 2018: Nil) were pledged as collateral for long-term borrowings (Note 4(33)(b)). As at 30 June 2019 and 31 December 2018, the Group assessed that no impairment loss should be recognised for investment properties.

S.F. HOLDING CO., LTD. NOTES TO THE FINANCIAL STATEMENTS FOR THE SIX MONTHS ENDED 30 JUNE 2019 (All amounts in RMB Yuan unless otherwise stated) [English translation for reference only]
185
4 Notes to the consolidated financial statements (Cont’d)
(17) Fixed assets
Buildings
Motor vehicles
Computers and
electronic equipment
Aircraft, aircraft engines, rotables
and high-value maintenance tools
Machinery and equipment
Office equipment
and other equipment
Total Cost
As at 31 December 2018 3,907,817,817.37 5,235,525,474.79 2,837,932,643.79 5,846,203,808.20 2,329,971,443.62 3,529,504,542.15 23,686,955,729.92 Increase arising from business combinations - 3,143,691.24 63,820,257.05 - 230,377,559.28 56,203,155.54 353,544,663.11 Transfer from construction in progress (Note
4(18)) 84,477,850.43 9,970,095.95 6,037,050.12 1,222,649,334.86 102,573,355.29 295,745,451.85 1,721,453,138.50 Transfer from investment properties in the
current period (Note 4(16)) 307,239,281.03 - - - - - 307,239,281.03 Increase in the current period - 142,105,730.36 227,314,091.01 89,565,869.91 51,449,982.47 68,421,327.59 578,857,001.34 Transfer to investment properties in the current
period (Note 4(16)) (28,314,895.02) - - - - - (28,314,895.02) Decrease in the current period (30,709,329.29) (285,364,040.33) (200,814,899.29) (29,156,304.07) (8,470,233.51) (77,172,508.26) (631,687,314.75) Effect of translation of foreign currency
financial statements 2,211,605.68 316,571.87 1,022,467.04 623,053.21 2,687,136.52 389,968.02 7,250,802.34 As at 30 June 2019 4,242,722,330.20 5,105,697,523.88 2,935,311,609.72 7,129,885,762.11 2,708,589,243.67 3,873,091,936.89 25,995,298,406.47
Accumulated depreciation As at 31 December 2018 635,490,679.85 3,377,726,518.44 1,651,819,189.31 1,908,639,462.48 565,797,862.05 1,580,779,750.34 9,720,253,462.47 Increase arising from business combinations - 1,994,821.31 43,124,294.52 - 153,894,514.84 40,754,094.71 239,767,725.38 Transfer from investment properties in the
current period (Note 4(16)) 21,507,647.05 - - - - - 21,507,647.05 Provision in the current period 59,978,099.81 368,420,615.15 298,065,326.76 320,810,300.46 98,521,383.81 306,981,416.38 1,452,777,142.37 Transfer to investment properties in the current
period (Note 4(16)) (2,452,041.69) - - - - - - (2,452,041.69) Decrease in the current period (1,507,142.40) (263,557,749.81) (179,129,926.41) (21,225,201.49) (4,891,722.69) (59,489,352.58) (529,801,095.38) Effect of translation of foreign currency
financial statements 202,106.57 179,143.75 721,722.23 9,774.48 1,628,426.45 313,095.00 3,054,268.48 As at 30 June 2019 713,219,349.19 3,484,763,348.84 1,814,600,606.41 2,208,234,335.93 814,950,464.46 1,869,339,003.85 10,905,107,108.68
Carrying amount As at 30 June 2019 3,529,502,981.01 1,620,934,175.04 1,120,711,003.31 4,921,651,426.18 1,893,638,779.21 2,003,752,933.04 15,090,191,297.79
As at 31 December 2018 3,272,327,137.52 1,857,798,956.35 1,186,113,454.48 3,937,564,345.72 1,764,173,581.57 1,948,724,791.81 13,966,702,267.45

S.F. HOLDING CO., LTD. NOTES TO THE FINANCIAL STATEMENTS FOR THE SIX MONTHS ENDED 30 JUNE 2019 (All amounts in RMB Yuan unless otherwise stated) [English translation for reference only]
186
4 Notes to the consolidated financial statements (Cont’d)
(17) Fixed assets (Cont’d)
(i) For the sixth months ended 30 June 2019, the amount of depreciation expenses charged to cost of revenue, selling and distribution expenses, general and administrative expenses and research and development expenses was RMB 1,421,435,012.06 (for the sixth months ended 30 June 2018: RMB 1,240,833,610.69).
(ii) As at 30 June 2019, fixed assets with carrying amount of RMB 534,736,222.21 (cost of RMB 586,427,847.12) (31 December 2018: carrying amount of RMB 342,796,848.43 and cost of RMB 373,875,226.65) were pledged as collateral for long-term borrowings (Note 4(33)(b)).
(iii) Fixed assets with pending certificates of ownership 30 June 2019
Cost Accumulated depreciation
Provision for impairment loss Carrying amount
Buildings 140,011,128.99 (2,710,166.58) - 137,300,962.41
31 December 2018
Cost Accumulated depreciation
Provision for impairment loss
Carrying amount
Buildings 193,877,274.92 (6,799,047.80) - 187,078,227.12
In addition, as at 30 June 2019, buildings with carrying amount of RMB 24,485,697.49 and cost of RMB 29,844,036.64 (31 December 2018: carrying amount of RMB 25,189,141.24 and cost of RMB 29,844,036.64) represented public rental houses with restricted property rights purchased by the Group for entity talents.
(iv) As at 30 June 2019 and 31 December 2018, the Group assessed that no impairment loss should be recognised for fixed assets.

S.F. HOLDING CO., LTD. NOTES TO THE FINANCIAL STATEMENTS FOR THE SIX MONTHS ENDED 30 JUNE 2019 (All amounts in RMB Yuan unless otherwise stated) [English translation for reference only]
187
4 Notes to the consolidated financial statements (Cont’d)
(17) Fixed assets (Cont’d)
(v) Disposal of aircraft engines, rotables and high-value aero maintenance tools
For the six months ended 30 June 2019
Reason for disposal Cost Accumulated depreciation
Provision for impairment loss Carrying amount
Aircraft rotables Scrapped 459,094.82 (148,092.22) - 311,002.60
For the six months ended 30 June 2018
Reason for disposal Cost Accumulated depreciation
Provision for impairment loss Carrying amount
Aircraft rotables Sold 155,266.03 (15,709.71) - 139,556.32 Aircraft rotables Scrapped 91,319.37 (48,443.46) - 42,875.91 246,585.40 (64,153.17) - 182,432.23

S.F. HOLDING CO., LTD. NOTES TO THE FINANCIAL STATEMENTS FOR THE SIX MONTHS ENDED 30 JUNE 2019 (All amounts in RMB Yuan unless otherwise stated) [English translation for reference only]
188
4 Notes to the consolidated financial statements (Cont’d)
(18) Construction in progress
30 June 2019 31 December 2018 Chuangzhi Tiandi Building Project 2,808,727,620.95 2,807,629,439.13 Qianhai S.F. Headquarters Office 580,326,645.88 556,833,111.75 Aircraft import and refit 550,864,847.57 943,574,638.75 Industrial Buildings in Dongguan Songshan
Lake Zhigu Industrial Park 437,085,303.75 436,199,481.00 Changsha E-Commerce Industrial Park
Project 214,503,859.06 160,636,162.09 Intelligent Sorting Hefei Base Project 195,947,491.56 313,838,021.65 Dongguan Dalingshan Southern China
Comprehensive Warehouse Project 176,146,611.44 86,998,454.45 Wuhan E-Commerce Industrial Park Project 173,822,533.38 82,658,505.47 Chongqing Fengtai E-Commerce Industrial
Park Project 136,875,434.74 68,562,581.48 S.F. Ma'anshan Innovation Industrial Park
Project 102,472,181.77 31,343,700.01 Tianjin Fengtai E-Commerce Industrial Park
Project 97,022,622.78 257,973,670.95 Foshan Guicheng Fengtai E-Commerce
Industrial Park Project 87,455,704.61 62,684,757.42 Weihai S.F. E-Commerce Industrial Park
Project 81,310,777.07 55,326,012.10 Nantong Aviation Hub Project (Phase II) 81,227,855.04 60,934,684.78 Beijing Daxing Distribution Hub Project 50,062,319.97 63,049,546.34 Xi’an E-Commerce Industrial Park Project 38,217,700.80 37,491,895.04 Zhengzhou E-Commerce Industrial Park
Project 34,785,615.02 11,123,175.33 Others 369,287,675.06 471,049,475.33 6,216,142,800.45 6,507,907,313.07 As at 30 June 2019 and 31 December 2018, the Group assessed that no impairment loss should be recognised for construction in progress.

S.F. HOLDING CO., LTD. NOTES TO THE FINANCIAL STATEMENTS FOR THE SIX MONTHS ENDED 30 JUNE 2019 (All amounts in RMB Yuan unless otherwise stated) [English translation for reference only]
189
4 Notes to the consolidated financial statements (Cont’d)
(18) Construction in progress (Cont’d)
Name of projects Budget 31 December 2018 Increase in the current period
Transfer to long-term assets in the current period (iii))
Decrease in the current period 30 June 2019
% of project investment in
budget (ii)
Progress of
project
Accumulative amount of capitalised borrowing
costs
Including: Borrowing costs
capitalised in the current
period (Note 4(49))
Capitalisation rate Source of funds
Chuangzhi Tiandi Building Project 2,956,187,732.13 2,807,629,439.13 1,098,181.82 - - 2,808,727,620.95 95% 95% - - - Self-owned funds
Qianhai S.F. Headquarters Office 955,063,598.77 556,833,111.75 23,493,534.13 - - 580,326,645.88 61% 61% 48,247,952.06 10,096,711.26 4.72%
Self-owned funds and loans from financial
institutions Aircraft import and refit 1,553,941,896.72 943,574,638.75 852,107,725.70 (1,222,649,334.87) (22,168,182.01) 550,864,847.57 55% 55% - - - Self-owned funds Industrial Buildings in Dongguan
Songshan Lake Zhigu Industrial Park 563,116,062.82 436,199,481.00 885,822.75 - - 437,085,303.75 78% 78% - - - Self-owned funds
Changsha E-Commerce Industrial Park Project 433,118,340.70 160,636,162.09 53,867,696.97 - - 214,503,859.06 50% 50% - - - Self-owned funds
Intelligent Sorting Hefei Base Project 689,264,242.19 313,838,021.65 31,563,458.27 (149,453,988.36) - 195,947,491.56 50% 50% - - - Self-owned funds
Dongguan Dalingshan Southern China Comprehensive Warehouse Project 228,117,303.14 86,998,454.45 89,148,156.99 - - 176,146,611.44 77% 77% - - - Self-owned funds
Wuhan E-Commerce Industrial Park Project 656,613,327.16 82,658,505.47 91,164,027.91 - - 173,822,533.38 26% 26% - - - Self-owned funds
Chongqing Fengtai E-Commerce Industrial Park Project 276,327,944.87 68,562,581.48 68,312,853.26 - - 136,875,434.74 50% 50% - - - Self-owned funds
S.F. Ma'anshan Innovation Industrial Park Project 108,539,784.72 31,343,700.01 71,128,481.76 - - 102,472,181.77 94% 94% - - - Self-owned funds
Tianjin Fengtai E-Commerce Industrial Park Project 672,367,278.56 257,973,670.95 79,909,941.35 (240,860,989.52) - 97,022,622.78 50% 50% - - - Self-owned funds
Foshan Guicheng Fengtai E-Commerce Industrial Park Project 353,640,166.63 62,684,757.42 24,770,947.19 - - 87,455,704.61 25% 25% - - - Self-owned funds
Weihai S.F. E-Commerce Industrial Park Project 88,073,140.86 55,326,012.10 25,984,764.97 - - 81,310,777.07 92% 92% - - - Self-owned funds
Nantong Aviation Hub Project (Phase II) 313,999,540.45 60,934,684.78 20,293,170.26 - - 81,227,855.04 26% 26% - - - Self-owned funds
Beijing Daxing Distribution Hub Project 97,017,748.38 63,049,546.34 8,009,688.80 (606,953.66) (20,389,961.51) 50,062,319.97 73% 73% - - - Self-owned funds
Xi’an E-Commerce Industrial Park Project 596,106,274.76 37,491,895.04 725,805.76 - - 38,217,700.80 6% 6% - - - Self-owned funds
Zhengzhou E-Commerce Industrial Park Project 243,936,462.20 11,123,175.33 23,662,439.69 - - 34,785,615.02 14% 14% - - - Self-owned funds
Others - 471,049,475.33 491,276,689.53 (417,649,819.09) (175,388,670.71) 369,287,675.06 - - - - - Self-owned funds 6,507,907,313.07 1,957,403,387.11 (2,031,221,085.50) (217,946,814.23) 6,216,142,800.45 48,247,952.06 10,096,711.26
(i) As at 30 June 2019, no construction in progress was pledged as collateral for long-term borrowings (31 December 2018: RMB 229,810,226.10) (Note
4(33)(b)).
(ii) For aircraft import and refit, the percentage of project investment in budget is related to the investment for the current period; for the other projects, the percentage of project investment in budget is related to the accumulative investment.
(iii) Transfers from construction in progress for the current period amounted to RMB 2,031,221,085.50, including transfer to fixed assets of RMB 1,721,453,138.50 and transfer to investment properties of RMB 309,767,947.00.

S.F. HOLDING CO., LTD. NOTES TO THE FINANCIAL STATEMENTS FOR THE SIX MONTHS ENDED 30 JUNE 2019 (All amounts in RMB Yuan unless otherwise stated) [English translation for reference only]
190
4 Notes to the consolidated financial statements (Cont’d)
(19) Intangible assets
Land use rights Purchased
software Self-developed
software Patents Trademark rights Customer
relationships Others Total Cost As at 31 December 2018 4,743,645,037.94 409,761,858.21 1,696,690,578.75 54,960,582.79 255,569,142.46 562,141,621.71 76,077,413.36 7,798,846,235.22 Increase in the current period
Business combinations - 12,976,569.15 - - - 2,093,073,628.26 - 2,106,050,197.41 Transfer from investment properties
(Note 4(16)) 94,397,480.70 - - - - - - 94,397,480.70 Transfer from capitalised development
expenditures (Note 4(20)) - - 648,471,436.71 - - - 23,332,747.27 671,804,183.98 Addition 196,048,629.70 36,103,451.42 - 3,077,153.81 360,399.01 - 1,626,982.35 237,216,616.29
Decrease in the current period Transfer to investment properties in
the current period (Note 4(16)) (98,289,203.86) - - - - - - (98,289,203.86) Disposal - (13,454,619.57) (39,168,290.25) (42,079,429.53) (24,440,000.00) - (1,314,640.15) (120,456,979.50)
Effect of translation of foreign currency financial statements 2,986,823.75 110,559.91 - - 398,984.13 69,821,470.09 - 73,317,837.88
As at 30 June 2019 4,938,788,768.23 445,497,819.12 2,305,993,725.21 15,958,307.07 231,888,525.60 2,725,036,720.06 99,722,502.83 10,762,886,368.12 Accumulated amortisation As at 31 December 2018 329,558,225.50 258,179,090.62 483,295,081.62 32,310,856.99 14,791,777.27 11,988,125.64 6,625,603.69 1,136,748,761.33 Increase in the current period
Business combinations - 11,906,100.07 - - - - - 11,906,100.07 Transfer from investment properties
(Note 4(16)) 8,148,525.75 - - - - - - 8,148,525.75 Provision 57,062,495.72 28,453,073.88 198,442,640.18 1,477,465.54 5,984,344.84 57,269,233.10 4,795,575.32 353,484,828.58
Decrease in the current period Transfer to investment properties in
the current period (Note 4(16)) (7,130,087.95) - - - - - - (7,130,087.95) Disposal - (3,316,119.76) (5,505,347.82) (30,131,272.19) (8,757,666.67) - (683,926.09) (48,394,332.53)
Effect of translation of foreign currency financial statements 160,531.37 81,332.76 - - 96,612.66 878,153.47 - 1,216,630.26
As at 30 June 2019 387,799,690.39 295,303,477.57 676,232,373.98 3,657,050.34 12,115,068.10 70,135,512.21 10,737,252.92 1,455,980,425.51
S.F. HOLDING CO., LTD. NOTES TO THE FINANCIAL STATEMENTS FOR THE SIX MONTHS ENDED 30 JUNE 2019 (All amounts in RMB Yuan unless otherwise stated) [English translation for reference only]
191
4 Notes to the consolidated financial statements (Cont’d) (19) Intangible assets (Cont’d)
Land use rights Purchased
software Self-developed
software Patents Trademark rights Customer
relationships Others Total Provision for impairment loss As at 31 December 2018 - - - - - - - - Increase in the current period - - 37,001,101.69 - - - - 37,001,101.69 As at 30 June 2019 - - 37,001,101.69 - - - - 37,001,101.69 Carrying amount As at 30 June 2019 4,550,989,077.84 150,194,341.55 1,592,760,249.54 12,301,256.73 219,773,457.50 2,654,901,207.85 88,985,249.91 9,269,904,840.92 As at 31 December 2018 4,414,086,812.44 151,582,767.59 1,213,395,497.13 22,649,725.80 240,777,365.19 550,153,496.07 69,451,809.67 6,662,097,473.89
For the sixth months ended 30 June 2019, the amount of amortisation expenses charged to cost of revenue, selling and distribution expenses, general and administrative expenses and research and development expenses was RMB 316,497,477.63 (for the sixth months ended 30 June 2018: RMB 164,898,545.05).

S.F. HOLDING CO., LTD. NOTES TO THE FINANCIAL STATEMENTS FOR THE SIX MONTHS ENDED 30 JUNE 2019 (All amounts in RMB Yuan unless otherwise stated) [English translation for reference only]
192
4 Notes to the consolidated financial statements (Cont’d) (19) Intangible assets (Cont’d) (a) The Group’s land use rights pledged as collateral for long-term borrowings (Note 4(33)(b)):
30 June 2019
Cost Accumulated amortisation Carrying amount
Land use rights 1,430,182,230.55 (137,815,116.78) 1,292,367,113.77 31 December 2018
Cost Accumulated amortisation Carrying amount
Land use rights 1,470,189,474.60 (121,708,372.50) 1,348,481,102.10
(b) As at 30 June 2019, the Group was still in the process of applying for certificates for land use rights with carrying amount of RMB 222,749,760.19 (cost of RMB 225,924,030.40) (31 December 2018: carrying amount of RMB 135,510,548.64 and cost of RMB 138,476,438.12).
(c) As at 30 June 2019, the intangible assets developed by the Group accounted for 17.18% (31 December 2018: 18.21%) of the carrying amount of intangible assets. 30 June 2019 31 December 2018 Carrying amount of self-developed intangible
assets 1,592,760,249.54 1,213,395,497.13 Carrying amount of intangible assets 9,269,904,840.92 6,662,097,473.89 Proportion 17.18% 18.21%
(d) As at 30 June 2019, due to the discontinuation of some self-developed software, the Group made a provision for impairment loss of RMB 37,001,101.69 upon assessment (31 December 2018: Nil).

S.F. HOLDING CO., LTD. NOTES TO THE FINANCIAL STATEMENTS FOR THE SIX MONTHS ENDED 30 JUNE 2019 (All amounts in RMB Yuan unless otherwise stated) [English translation for reference only]
193
4 Notes to the consolidated financial statements (Cont’d)
(20) Capitalised development expenditures
31 December 2018
Transfer to intangible assets in the current
period (Note 4(19)) 30 June 2019 Increase in the current period
Unmanned Aerial Vehicle
Project 87,625,999.63 29,050,983.46 (11,721,070.29) 104,955,912.80 CPS 61,169,344.01 84,118,461.52 (103,991,544.02) 41,296,261.51 Fengsheng System 20,350,805.38 14,068,188.66 - 34,418,994.04 Intelligent hardware R&D
Project 18,372,828.56 3,250,052.01 - 21,622,880.57 Fengchi Project 66,510,593.38 35,569,681.86 (86,147,917.34) 15,932,357.90 Claim Risk Control Project - 13,725,059.40 - 13,725,059.40 Big Data Platform - 23,564,278.46 (11,419,461.94) 12,144,816.52 Warehousing Management
System 14,028,361.32 2,651,529.48 (5,520,000.00) 11,159,890.80 Foundation Revolution System
of Product Operation 24,626,556.68 29,194,685.23 (43,699,511.76) 10,121,730.15 Intra-city Express 20,135,507.88 21,539,626.35 (31,751,858.06) 9,923,276.17 SAP Settlement Platform
System 2,543,708.66 6,395,092.56 - 8,938,801.22 Operation Plan System - 8,067,609.92 - 8,067,609.92 Operation and Management
Platform Virtual System 1,608,736.69 4,808,946.17 (4,758,988.88) 1,658,693.98 International Export
Management System 1,608,837.29 77,782.28 (836,320.76) 850,298.81 Refrigerated Transport System
Project 15,310,087.42 2,227,992.50 (17,538,079.92) - Others 251,321,376.87 421,547,127.01 (354,419,431.01) 318,449,072.87
585,212,743.77 699,857,096.87 (671,804,183.98) 613,265,656.66
As at 30 June 2019, the Group assessed that no impairment loss should be recognised for research and capitalised development expenditures.

S.F. HOLDING CO., LTD. NOTES TO THE FINANCIAL STATEMENTS FOR THE SIX MONTHS ENDED 30 JUNE 2019 (All amounts in RMB Yuan unless otherwise stated) [English translation for reference only]
194
4 Notes to the consolidated financial statements (Cont’d)
(21) Goodwill All of the Group's goodwill has been allocated to the relevant asset group or asset group combination on the date of purchase. The allocation is as follows:
31 December 2018 Increase in the
current period (i) Decrease in the
current period (i)
Exchange rate changes in the current period 30 June 2019
Cost: DHL HK and DHL BJ (Note 5(1)(b)) - 2,886,703,468.48 - 95,081,521.91 2,981,784,990.39 Havi Logistics Services (Hong Kong) Ltd. (“Havi Hong Kong”) 355,135,836.43 - - 630,698.55 355,766,534.98 Guangdong Shunxin Express Co., Ltd. (“Guangdong Shunxin”) 149,587,124.73 - - - 149,587,124.73 Beijing Deda 22,702,800.86 - - - 22,702,800.86 Suzhou Hengding Logistics Co., Ltd. - 11,967,426.40 - - 11,967,426.40 Chongqing Xuehu Express LLC 10,555,317.54 - - - 10,555,317.54 Guizhou Xingcheng Zhaipei Express Co., Ltd. 10,199,760.21 - - - 10,199,760.21 Sichuan Wulianyida Technology Co., Ltd. 4,940,247.25 - - - 4,940,247.25 Chengdu Shunyifeng Pharmaceuticals Co., Ltd. 2,434,509.81 - - - 2,434,509.81 Hanxing Industrial Co., Ltd. 1,496,979.95 - - 2,658.54 1,499,638.49 Xiamen Ruite Information Technology Co., Ltd. (“Xiamen Ruite”) 56,502,329.98 - (56,502,329.98) - - 613,554,906.76 2,898,670,894.88 (56,502,329.98) 95,714,879.00 3,551,438,350.66

S.F. HOLDING CO., LTD. NOTES TO THE FINANCIAL STATEMENTS FOR THE SIX MONTHS ENDED 30 JUNE 2019 (All amounts in RMB Yuan unless otherwise stated) [English translation for reference only]
195
4 Notes to the consolidated financial statements (Cont’d)
(21) Goodwill (Cont'd) All of the Group's goodwill has been allocated to the relevant asset group or asset group combination on the date of purchase. The allocation is as follows (Cont’d):
31 December 2018
Increase in the
current period (i)
Decrease in the
current period (i)
Exchange rate changes in the current period
30 June 2019 Less: Provisions for impairment (Note 4(24)) -
Chengdu Shunyifeng Pharmaceuticals Co., Ltd. (2,434,509.81) - - - (2,434,509.81) Chongqing Xuehu Express LLC (10,555,317.54) - - - (10,555,317.54) Guizhou Xingcheng Zhaipei Express Co., Ltd. (10,199,760.21) - - - (10,199,760.21)
(23,189,587.56) - - - (23,189,587.56) 590,365,319.20 2,898,670,894.88 (56,502,329.98) 95,714,879.00 3,528,248,763.10
(i) Increase in goodwill in the current period arose from the acquisition of equity of DHL HK and DHL BJ (Note 5(1)(b)). Decrease in goodwill in the current
period arose from the disposal of equity of Xiamen Ruite (Note 5(3)).

S.F. HOLDING CO., LTD. NOTES TO THE FINANCIAL STATEMENTS FOR THE SIX MONTHS ENDED 30 JUNE 2019 (All amounts in RMB Yuan unless otherwise stated) [English translation for reference only]
196
4 Notes to the consolidated financial statements (Cont’d)
(22) Long-term prepaid expenses
31 December 2018 Increase in the
current period Amortisation in the
current period Decrease in the
current period
30 June 2019 Leasehold improvements 1,130,323,147.57 400,833,641.45 (297,235,387.56) (16,703,647.95) 1,217,217,753.51 Settling-in allowance and introduction fee for pilots 448,064,620.79 96,704,833.61 (31,913,585.25) (3,632,294.72) 509,223,574.43 Prepaid discount interest on interest-free loans to employees 45,607,919.26 - (8,653,429.72) (373,504.81) 36,580,984.73 Others 21,865,499.91 3,599,356.19 (4,643,429.21) (1,219,132.24) 19,602,294.65 1,645,861,187.53 501,137,831.25 (342,445,831.74) (21,928,579.72) 1,782,624,607.32

S.F. HOLDING CO., LTD. NOTES TO THE FINANCIAL STATEMENTS FOR THE SIX MONTHS ENDED 30 JUNE 2019 (All amounts in RMB Yuan unless otherwise stated) [English translation for reference only]
197
4 Notes to the consolidated financial statements (Cont’d)
(23) Other non-current assets 30 June 2019 31 December 2018 Prepaid engineering equipment 326,610,310.44 381,308,573.43 Prepaid land use rights 220,599,226.75 116,653,600.00 547,209,537.19 497,962,173.43

S.F. HOLDING CO., LTD. NOTES TO THE FINANCIAL STATEMENTS FOR THE SIX MONTHS ENDED 30 JUNE 2019 (All amounts in RMB Yuan unless otherwise stated) [English translation for reference only]
198
4 Notes to the consolidated financial statements (Cont’d)
(24) Provision for asset impairment
31 December 2018
Changes in accounting policies
(Note 2(31))
1 January 2019
Merge under non-identical
control
Provision in the
current period
Decrease in the current period
30 June 2019
Reversal in the current period
Write-off/ Disposal
Provision for bad debts 103,548,417.82 - 103,548,417.82 12,529,871.83 92,309,099.17 - (23,387,719.96) 184,999,668.86
Including: Provision for bad debts of accounts receivable (Note 4(4)) 79,456,513.05 - 79,456,513.05 12,524,708.14
79,264,307.29 - (14,624,394.24) 156,621,134.24 Provision for bad
debts of other receivables (Note 4(5)) 12,857,692.63 - 12,857,692.63 5,163.69
13,044,791.88 - (8,409,670.50) 17,497,977.70 Provision for bad
debts of long-term receivables (Note 4(12)) 11,234,212.14 - 11,234,212.14 -
- - (353,655.22) 10,880,556.92 Provision for impairment of
factoring receivables (Note 4(7)) 9,655,084.16 - 9,655,084.16 -
58,118,407.06 (5,037,895.29) - 62,735,595.93 Provision for impairment of
loans and advances (Note 4(8)) 11,158,725.91 - 11,158,725.91 -
3,475,742.51 - (497,273.25) 14,137,195.17 Provision for impairment of
available-for-sale financial assets (Note 4(11)) 4,596,187.92 (4,596,187.92) - -
- - - - Provision for impairment of
long-term equity investments (Note 4(13)) 57,596,515.69 - 57,596,515.69 -
17,111,077.45 - - 74,707,593.14 Provision for impairment of
intangible assets (Note 4(19)) - - - -
37,001,101.69 - - 37,001,101.69 Provision for impairment of
goodwill (Note 4(21)) 23,189,587.56 - 23,189,587.56 -
- - - 23,189,587.56 209,744,519.06 (4,596,187.92) 205,148,331.14 12,529,871.83 208,015,427.88 (5,037,895.29) (23,884,993.21) 396,770,742.35

S.F. HOLDING CO., LTD. NOTES TO THE FINANCIAL STATEMENTS FOR THE SIX MONTHS ENDED 30 JUNE 2019 (All amounts in RMB Yuan unless otherwise stated) [English translation for reference only]
199
4 Notes to the consolidated financial statements (Cont’d)
(25) Short-term borrowings 30 June 2019 31 December 2018 Unsecured borrowings 8,595,076,419.04 6,086,934,848.48 Guaranteed borrowings (a) 1,733,941,500.00 2,498,194,551.15 10,329,017,919.04 8,585,129,399.63
(a) As at 30 June 2019, guaranteed borrowings of RMB 1,733,941,500.00 (31 December 2018: RMB 2,498,194,551.15) were guaranteed by subsidiaries within the Group.
(b) As at 30 June 2019, the range of annual interest rate of short-term borrowings was 2.60% to 5.00% (31 December 2018: 2.74% to 5.30%).
(26) Accounts payable 30 June 2019 31 December 2018 Payables to related parties (Note 8(4)(f)) 135,976,802.99 101,316,142.44 Outsourcing cost payable 4,876,443,547.03 4,499,069,987.92 Transportation cost payable 1,317,850,101.89 1,315,973,595.67 Supply and material expenses payable 976,953,620.53 1,029,622,333.02 Office and rental fees payable 911,792,568.19 694,987,360.60 Customs cost payable 24,227,768.35 21,444,033.53 Others 256,569,297.51 224,929,376.65 8,499,813,706.49 7,887,342,829.83

S.F. HOLDING CO., LTD. NOTES TO THE FINANCIAL STATEMENTS FOR THE SIX MONTHS ENDED 30 JUNE 2019 (All amounts in RMB Yuan unless otherwise stated) [English translation for reference only]
200
4 Notes to the consolidated financial statements (Cont’d)
(26) Accounts payable (Cont’d) Accounts payable with ageing over 1 year are analysed as follows:
30 June 2019 31 December 2018 Main reason for
unsettlement Transportation cost
payable 3,945,106.91 6,872,109.99 No invoice issued
by supplier Office and rental fees
payable 1,377,602.71 964,421.09 No invoice issued
by supplier Supply and material
expenses payable 6,579,575.26 3,752,895.47 No invoice issued
by supplier Outsourcing cost
payable 15,131,790.25 1,078,046.50 No invoice issued
by supplier Others 2,811,607.23 4,062,160.95 29,845,682.36 16,729,634.00
(27) Advances from customers 30 June 2019 31 December 2018 Advances from related parties (Note 8(4)(g)) 31,522,074.85 21,548,724.88 Prepaid value cards 203,900,624.75 203,086,157.63 Advances of freight charges and others 429,096,293.95 242,976,408.93 664,518,993.55 467,611,291.44 As at 30 June 2019, the Group had no advances from customers with ageing over 1 year (31 December 2018: Nil).

S.F. HOLDING CO., LTD. NOTES TO THE FINANCIAL STATEMENTS FOR THE SIX MONTHS ENDED 30 JUNE 2019 (All amounts in RMB Yuan unless otherwise stated) [English translation for reference only]
201
4 Notes to the consolidated financial statements (Cont’d)
(28) Employee benefits payable 30 June 2019 31 December 2018 Short-term employee benefits payable (a) 2,493,766,632.49 2,931,841,446.33 Defined contribution plans payable (b) 33,604,449.53 35,626,116.08 2,527,371,082.02 2,967,467,562.41
(a) Short-term employee benefits payable
31 December 2018 Increase in the current period
Decrease in the current period 30 June 2019
Wages and salaries,
bonus, allowances and subsidies 2,594,559,221.36 8,419,707,741.91 (8,904,912,548.22) 2,109,354,415.05
Employee welfare 5,582,944.44 205,799,012.55 (197,499,521.66) 13,882,435.33 Social security
contributions 12,071,624.74 251,297,874.39 (249,605,885.45) 13,763,613.68 Including: Medical
insurance 10,175,009.26 210,659,626.27 (209,193,264.74) 11,641,370.79 Work injury
insurance 578,795.96 19,717,093.82 (19,793,743.91) 502,145.87 Maternity
insurance 1,317,819.52 20,921,154.30 (20,618,876.80) 1,620,097.02 Housing funds 10,631,685.86 123,049,019.35 (123,161,826.62) 10,518,878.59 Labour union funds and
employee education funds 284,626,306.58 128,838,441.51 (99,047,183.05) 314,417,565.04
Non-monetary welfare 5,877,075.79 356,028,475.22 (357,436,352.65) 4,469,198.36 Others 18,492,587.56 352,801,400.10 (343,933,461.22) 27,360,526.44 2,931,841,446.33 9,837,521,965.03 (10,275,596,778.87) 2,493,766,632.49
Non-monetary welfare provided by the Group for employees primarily were non-monetary subsidies in various forms which were measured at fair value.

S.F. HOLDING CO., LTD. NOTES TO THE FINANCIAL STATEMENTS FOR THE SIX MONTHS ENDED 30 JUNE 2019 (All amounts in RMB Yuan unless otherwise stated) [English translation for reference only]
202
4 Notes to the consolidated financial statements (Cont’d)
(28) Employee benefits payable (Cont'd)
(b) Defined contribution plans
31 December
2018 Increase in the current period
Decrease in the current period 30 June 2019
Basic pensions
insurance 34,208,014.20 457,622,115.32 (458,972,436.74) 32,857,692.78 Unemployment
insurance 1,418,101.88 21,654,707.41 (22,326,052.54) 746,756.75 35,626,116.08 479,276,822.73 (481,298,489.28) 33,604,449.53
(29) Taxes payable 30 June 2019 31 December 2018 Enterprise income tax payable 543,921,510.23 459,287,640.72 Unpaid VAT 154,342,603.66 108,728,116.39 Individual income tax payable 45,153,590.13 49,217,965.69 City maintenance and construction tax
payable 9,072,426.94 5,929,012.12 Educational surcharge payable 6,706,437.22 5,768,817.99 Others 20,862,519.75 10,364,428.08 780,059,087.93 639,295,980.99

S.F. HOLDING CO., LTD. NOTES TO THE FINANCIAL STATEMENTS FOR THE SIX MONTHS ENDED 30 JUNE 2019 (All amounts in RMB Yuan unless otherwise stated) [English translation for reference only]
203
4 Notes to the consolidated financial statements (Cont’d)
(30) Other payables 30 June 2019 31 December 2018 Current accounts payable to related parties
(Note 8(4)(g)) 55,921,179.46 20,094,094.27 Engineering equipment payable 1,617,086,520.06 1,741,749,484.87 Payables of cash on delivery service 1,154,684,729.72 1,377,763,159.38 Deposits payable 510,578,434.98 464,519,542.36 Warranty deposits payable 135,152,505.64 143,399,194.90 Temporary collection payable 75,704,179.64 91,229,288.16 Restricted share repurchases payable 59,249,144.83 200,619,019.91 Management fee payable 35,095,004.74 - Investments payable 26,710,805.23 113,122,100.23 Professional service fee payable 21,994,542.52 8,219,553.21 Interest payable - 134,234,622.47 Others 272,170,263.92 244,687,092.55
3,964,347,310.74 4,539,637,152.31 Other payables with ageing over 1 year
30 June 2019
31 December 2018 Main reason for
unsettlement
Deposits payable 124,219,334.43 165,847,015.19 Temporarily retained
for continuing business Engineering
equipment payable 37,312,781.07 46,828,801.92
Project payment unsettled
Warranty deposits payable 29,830,294.79 37,078,772.04 Warranty in effect
Indemnities from insurance company
claims on hold Others 16,129,943.67 34,022,955.34 and others 207,492,353.96 283,777,544.49

S.F. HOLDING CO., LTD. NOTES TO THE FINANCIAL STATEMENTS FOR THE SIX MONTHS ENDED 30 JUNE 2019 (All amounts in RMB Yuan unless otherwise stated) [English translation for reference only]
204
4 Notes to the consolidated financial statements (Cont’d) (31) Current portion of non-current liabilities
30 June 2019 31 December 2018 Current portion of long-term borrowings
(Note 4(33)) 388,939,083.61 173,076,233.94 Current portion of employee incentives
(Note 4(36)) 24,643,718.44 99,901,113.14 Current portion of debentures payable
(Note 4(34)) 163,439,474.65 - Current portion of long-term payables
(Note 4(35)) 245,474.57 245,474.57 577,267,751.27 273,222,821.65
(32) Other current liabilities 30 June 2019 31 December 2018 Super&short term commercial paper
The First Phase of 2018 - 499,729,547.99 The Second Phase of 2018 510,850,466.33 499,649,357.38 The First Phase of 2019 503,305,011.80 -
Others 6,532,843.28 - 1,020,688,321.41 999,378,905.37 The specific information of the super&short term commercial paper is as follows:
Par value Date of issue Period of commercial
paper Interest
rate The First Phase
of 2018 500,000,000.00 17 September 2018 270 days 3.21% The Second
Phase of 2018 500,000,000.00 22 November 2018 270 days 3.60% The First Phase
of 2019 500,000,000.00 10 April 2019 270 days 3.20%
(33) Long-term borrowings 30 June 2019 31 December 2018 Unsecured borrowings 1,430,567,499.77 9,000,000.00 Guaranteed borrowings (a) 3,949,278,501.26 403,799,557.64 Secured borrowings (b) 931,274,205.06 758,564,511.49 6,311,120,206.09 1,171,364,069.13 Less: Current portion of long-term
borrowings (Note 4(31)) Unsecured borrowings (201,567,500.00) (9,000,000.00) Guaranteed borrowings (105,124,935.77) (122,576,233.94) Secured borrowings (82,246,647.84) (41,500,000.00) (388,939,083.61) (173,076,233.94) 5,922,181,122.48 998,287,835.19

S.F. HOLDING CO., LTD. NOTES TO THE FINANCIAL STATEMENTS FOR THE SIX MONTHS ENDED 30 JUNE 2019 (All amounts in RMB Yuan unless otherwise stated) [English translation for reference only]
205
4 Notes to the consolidated financial statements (Cont’d)
(33) Long-term borrowings (Cont'd)
(a) As at 30 June 2019, the Group's guaranteed borrowings were all guaranteed by the subsidiaries within the Group. As at 31 December 2018, the Group's guaranteed borrowings of RMB 63,799,557.64 was guaranteed by the subsidiaries within the Group, and the guaranteed borrowings of RMB 340,000,000.00 was guaranteed by Mingde Holdings.
(b) As at 30 June 2019, the secured bank borrowings of RMB 81,600,000.00 (31 December 2018: RMB 86,400,000.00) were secured by the Group’s intangible assets with carrying amount of RMB 19,204,680.05 (31 December 2018: Nil), fixed assets with carrying amount of RMB 164,682,362.64 (31 December 2018: Nil) and investment properties with carrying amount of RMB 28,931,982.76 (31 December 2018: Nil) and were fully guaranteed by Taisen Holdings. The interest is paid quarterly. The principal should be repaid during the period from 22 September 2017 to 23 September 2025 by instalments. As at 30 June 2019, the secured bank borrowings of RMB 123,270,000.00 (31 December 2018: RMB 101,770,000.00) were secured by the Group’s fixed assets with carrying amount of RMB 11,585,501.37 (31 December 2018: construction in progress of RMB 229,810,226.10), investment properties with carrying amount of RMB 290,486,938.08 (31 December 2018: Nil) and intangible assets with carrying amount of RMB 2,409,490.09 (31 December 2018: RMB 60,885,374.67) respectively and were fully guaranteed by Taisen Holdings. The interest is paid quarterly. The principal should be repaid during the period from 19 October 2019 to 20 October 2033 by instalments. As at 30 June 2019, the secured bank borrowings of RMB 216,000,000.00 (31 December 2018: RMB 220,000,000.00) were secured by the Group’s fixed assets with carrying amount of RMB 333,917,311.80 (31 December 2018: RMB 342,796,843.43) and intangible assets of RMB 38,737,836.24 (31 December 2018: RMB 39,486,373.07) and were fully guaranteed by Taisen Holdings, and S.F. Express Co., Ltd. (hereinafter “S.F. Express”) was the co-borrower. The interest is paid quarterly. The principal should be repaid during the period from 25 July 2016 to 30 July 2023 by instalments. As at 30 June 2019, the secured bank borrowings of RMB 437,971,556.99 (31 December 2018: RMB 408,794,511.49) were secured by the Group’s intangible assets with carrying amount of RMB 1,227,450,168.41 (31 December 2018: RMB 1,244,458,715.78). The interest is paid quarterly. The principal should be repaid during the period from 18 November 2019 to 18 November 2026 by instalments. As at 30 June 2019, the secured bank borrowings of RMB 71,036,000.00 (31 December 2018: Nil) were secured by the Group’s fixed assets with carrying amount of RMB 24,551,046.40 (31 December 2018: Nil), intangible assets of RMB 4,564,938.98 (31 December 2018: Nil) and investment properties with carrying amount of RMB 177,566,675.90 (31 December 2018: Nil). The interest is paid quarterly. The principal should be repaid during the period from 20 April 2020 to 18 January 2034 by instalments. In addition, as at 31 December 2018, the secured bank borrowings of RMB 28,000,000.00 were secured by the Group’s land use rights with carrying amount of RMB 3,650,638.58 and were fully guaranteed by Taisen Holdings. Such borrowings were repaid in January 2019 in advance.
(c) As at 30 June 2019, the range of annual interest rate of long-term borrowings was 3.43% to 5.39% (31 December 2018: 3.58% to 5.39%).

S.F. HOLDING CO., LTD. NOTES TO THE FINANCIAL STATEMENTS FOR THE SIX MONTHS ENDED 30 JUNE 2019 (All amounts in RMB Yuan unless otherwise stated) [English translation for reference only]
206
4 Notes to the consolidated financial statements (Cont’d)
(34) Debentures payable
31 December 2018
Interest accrual
Amortisation of premium/ discount
Foreign
exchange gains or losses and
exchange differences on translation of
foreign currency financial
statements
Current portion of debentures
payable (Note 4(31))
30 June 2019
The First Debentures
of 2017 (a) 529,610,589.31 17,269,166.73
105,927.24 - (17,269,166.73)
529,716,516.55 The First Debentures
of 2018 (a) 799,166,867.25 31,364,666.67
153,262.44 - (31,364,666.67)
799,320,129.69 The Second
Debentures of 2018 (a) 669,513,577.98 19,246,866.67
131,235.84 - (19,246,866.67)
669,644,813.82 Overseas debentures
denominated in USD (b) 3,407,199,722.59 60,622,107.88
3,110,016.19 (537,971.52) (60,622,107.88)
3,409,771,767.26 The First Middle-term
Notes of 2018 (c) 999,545,169.27 34,936,666.70
79,710.48 - (34,936,666.70)
999,624,879.75
6,405,035,926.40 163,439,474.65
3,580,152.19 (537,971.52) (163,439,474.65)
6,408,078,107.07
Currency Par value Date of issue Term Amount
(equivalent to RMB) The First Debentures of
2017 (a) RMB 530,000,000.00 17 October 2017 5 years 530,000,000.00 The First Debentures of
2018 (a) RMB 800,000,000.00 From 1 August 2018 to
2 August 2018 3 years 800,000,000.00 The Second Debentures
of 2018 (a) RMB 670,000,000.00 From 22 October 2018
to 23 October 2018 2 +1 years 670,000,000.00 Overseas debentures
denominated in USD (b) USD 500,000,000.00 27 July 2018 5 years 3,407,508,933.00
The First Middle-term Notes of 2018 (c) RMB 1,000,000,000.00 19 September 2018 3 years 1,000,000,000.00
(a) Taisen Holdings was approved to issue corporate debentures of no more than RMB 2 billion (inclusive)
in instalments to the public under the Regulatory Permission [2017] No. 1015 as issued by China Securities Regulatory Commission. In 2017, Taisen Holdings publicly issued the corporate debentures (1st instalment) (hereinafter “the First Debentures of 2017”) to qualified investors. The debenture interest shall be annually calculated at simple interest rate, and the nominal interest rate is 4.6%, with interest paid annually and the final instalment of interest paid with the principal. In 2018, Taisen Holdings publicly issued the corporate debentures (1st instalment) (hereinafter “the First Debentures of 2018”) to qualified investors. The debenture interest shall be annually calculated at simple interest rate, and the nominal interest rate is 4.29%, with interest paid annually and the final instalment of interest paid with the principal. In 2018, Taisen Holdings publicly issued the corporate debentures (2nd instalment) (hereinafter “the Second Debentures of 2018”) to qualified investors. The debenture interest shall be annually calculated at simple interest rate, and the nominal interest rate is 4.17%, with interest paid annually and the final instalment of interest paid with the principal.

S.F. HOLDING CO., LTD. NOTES TO THE FINANCIAL STATEMENTS FOR THE SIX MONTHS ENDED 30 JUNE 2019 (All amounts in RMB Yuan unless otherwise stated) [English translation for reference only]
207
4 Notes to the consolidated financial statements (Cont’d)
(34) Debentures payable (Cont’d)
(b) On 26 July 2018, S.F. Holding Investment Limited, a wholly-owned subsidiary of the Company, issued debentures of USD 500 million overseas. The debentures were listed on the Stock Exchange of Hong Kong Limited on 27 July 2018. The nominal interest rate is 4.125% per annum, and the interest is paid semi-annually, for which the Company provides unconditional and irrevocable cross-border guarantee.
(c) According to the Notice of Acceptance of Registration issued by the National Association of Financial Market Institutional Dealers (Zhong Shi Zhu Xie [2017] MTN443), Taisen Holdings’ quota of middle-term notes was RMB 2 billion. On 19 September 2018, Taisen Holdings issued the first middle-term notes of 2018 (hereinafter “the First Middle-term Notes of 2018”) totalling RMB 1 billion at a nominal interest rate of 4.46%, with interest paid annually and the final instalment of interest paid with the principal.
(35) Long-term payables 30 June 2019 31 December 2018 Long-term advances payable 44,915,616.35 43,935,616.37 Long-term payables to China Development
Fund Co., Ltd. 20,346,603.34 20,392,825.23 Others 40,984,444.92 19,572,058.05 Less: Current portion of long-term payables
(Note 4(3)) (245,474.57)
(245,474.57) 106,001,190.04 83,655,025.08
(36) Long-term employee benefits payable 30 June 2019 31 December 2018 Employee incentives 130,251,833.98 205,819,013.16 Less: Current portion of employee incentives
(Note 4(31)) (24,643,718.44)
(99,901,113.14) Long-term service bonus 53,035,836.78 36,797,359.69 158,643,952.32 142,715,259.71

S.F. HOLDING CO., LTD. NOTES TO THE FINANCIAL STATEMENTS FOR THE SIX MONTHS ENDED 30 JUNE 2019 (All amounts in RMB Yuan unless otherwise stated) [English translation for reference only]
208
4 Notes to the consolidated financial statements (Cont’d)
(37) Deferred income
31 December 2018 Increase in the current period
Decrease in the current period 30 June 2019 Source
Received government
grants Government
grants (a) 152,944,183.19 46,947,663.33 (16,509,299.54) 183,382,546.98 pending for future
recognition in income
(a) The government grants related to deferred income in the current period are presented as follows:
Government grants 31 December
2018
Grants addition in the current
period
Amount recognised in
other income in the current period
(Note 4(52))
30 June 2019 Related to
assets/income Comprehensive pilot program of
Shanghai modern service industry 26,937,433.84 - (504,792.48) 26,432,641.36 Related to assets
Ancillary grant of infrastructure for Wuhu E-Commerce Industrial Park 26,430,374.01 - (280,625.88) 26,149,748.13 Related to assets
Construction development fund for Tianjin Project 21,000,000.00 - (68,416.44) 20,931,583.56 Related to assets
Entity Expansion Fund 7,825,678.33 4,572,700.00 (1,799,517.12) 10,598,861.21 Related to assets Yancheng Smart E-Commerce
Logistics Park Project 10,221,221.18 - (108,352.20) 10,112,868.98 Related to assets Grant for maintenance of aircraft
engines 10,195,916.38 - (283,160.59) 9,912,755.79 Related to assets Ma'anshan Industrial Park Project - 7,000,000.00 - 7,000,000.00 Related to assets Special subsidy for logistics
standardisation from the Commerce Bureau - 6,873,400.00 (63,642.59) 6,809,757.41 Related to assets
Subsidy for new energy vehicles - 7,155,752.54 (670,167.98) 6,485,584.56 Related to assets Specific subsidy for modern
service industry granted by Jinhua Transportation Authority 6,203,438.00 - (60,007.74) 6,143,430.26 Related to assets
Shenzhen intelligent logistics project fund - 5,000,000.00 - 5,000,000.00 Related to assets
Yiwu Comprehensive Service Centre Project 5,342,546.78 - (413,565.48) 4,928,981.30 Related to assets
Special fund of Shenzhen industrial design development - 3,000,000.00 - 3,000,000.00 Related to assets
Logistics Project of Yiwu Industrial Park 2,938,072.85 - (97,394.70) 2,840,678.15 Related to assets
Tianjin Port Free Trade Zone supply chain system construction project - 3,098,800.00 (260,661.57) 2,838,138.43 Related to assets
Compensation for land acquisition of Nanning Distribution Hub 3,168,203.97 - (432,265.38) 2,735,938.59 Related to assets
Construction subsidy for Taizhou Shunfeng E-Commerce Service Platform 1,199,386.61 - (206,079.56) 993,307.05 Related to assets
North China Air Express Pivot 1,197,924.62 - (941,107.20) 256,817.42 Related to assets Others 30,283,986.62 10,247,010.79 (10,319,542.63) 30,211,454.78 Related to assets 152,944,183.19 46,947,663.33 (16,509,299.54) 183,382,546.98
S.F. HOLDING CO., LTD. NOTES TO THE FINANCIAL STATEMENTS FOR THE SIX MONTHS ENDED 30 JUNE 2019 (All amounts in RMB Yuan unless otherwise stated) [English translation for reference only]
209
4 Notes to the consolidated financial statements (Cont’d)
(38) Deferred tax assets and deferred tax liabilities
(a) Deferred tax assets before offsetting 30 June 2019 31 December 2018 Deductible
temporary differences and
deductible tax losses
Deferred tax assets
Deductible temporary
differences and deductible tax
losses
Deferred tax assets Deductible losses 2,267,704,531.32 516,121,115.30 2,106,408,366.25 445,292,056.78 Accrued expenses 643,532,634.69 138,037,750.14 477,502,124.17 102,418,612.28 Unrealised profits
from internal transactions 313,689,547.92 78,422,386.98 205,785,722.06 51,446,430.51
Employee incentives 116,876,127.51 29,219,031.88 105,902,775.73 26,475,693.93
Provision for asset impairment 229,671,367.81 54,926,249.61 85,859,422.40 20,729,601.03
Deferred income 162,408,138.76 38,591,680.15 152,739,530.39 37,423,690.25 Depreciation and
amortisation differences 268,309,974.54 41,532,340.35 268,188,022.13 54,965,938.00
Share-based payment 42,002,857.43 8,670,846.15 33,845,759.93 7,221,273.29
Changes in fair value of available-for-sale financial assets -
-
50,328,715.36
12,582,178.84 4,044,195,179.98 905,521,400.56 3,486,560,438.42 758,555,474.91 Including: Expected to be
recovered within one year (inclusive)
233,707,569.21
171,522,613.57 Expected to be
recovered after one year 671,813,831.35 587,032,861.34
905,521,400.56 758,555,474.91
(b) Deductible tax losses and deductible temporary differences that are not recognised as deferred tax
assets are analysed as follows: 30 June 2019 31 December 2018 Deductible tax losses (c) 2,553,934,154.60 1,983,381,113.08 Deductible temporary differences 57,942,744.40 35,779,714.55 2,611,876,899.00 2,019,160,827.63

S.F. HOLDING CO., LTD. NOTES TO THE FINANCIAL STATEMENTS FOR THE SIX MONTHS ENDED 30 JUNE 2019 (All amounts in RMB Yuan unless otherwise stated) [English translation for reference only]
210
4 Notes to the consolidated financial statements (Cont’d)
(38) Deferred tax assets and deferred tax liabilities (Cont’d)
(c) The following table shows unrecognised deductible tax losses based on its expiration date:
30 June 2019 31 December 2018 2019 365,124,698.48 382,184,105.91 2020 217,346,174.73 207,216,534.82 2021 263,641,382.24 262,402,324.95 2022 185,639,014.66 209,567,751.03 2023 and subsequent years 1,522,182,884.49 922,010,396.37 2,553,934,154.60 1,983,381,113.08
(d) Deferred tax liabilities before offsetting 30 June 2019 31 December 2018
Taxable temporary
differences Deferred tax
liabilities Taxable temporary
differences Deferred tax
liabilities Changes in fair value of
other equity instruments 243,649,970.00 60,912,492.51 - -
Changes in fair value of other non-current financial assets 16,000,000.00 4,000,000.00 - -
Changes in fair value of available-for-sale financial assets - - 110,043,220.00 27,510,805.00
Changes in fair value upon reclassification of remaining equity of Hive Box Technology 446,796,225.96 111,699,056.49 446,796,225.96 111,699,056.49
Changes in fair value upon reclassification of remaining equity of Shenzhen Fengyi Technology Co., Ltd. ("Fengyi Technology") 28,000,000.00 7,000,000.00 - -
Depreciation of fixed assets 1,867,783,819.66 466,945,954.90 1,543,907,080.21 350,447,802.47
Appreciation in asset value arising from business combination 3,008,978,791.18
701,696,250.10
955,722,159.84
218,485,004.96 Unrealised profits from
internal transactions 13,993,557.08 3,498,389.27 12,163,386.92 3,040,846.73 5,625,202,363.88 1,355,752,143.27 3,068,632,072.93 711,183,515.65 Including: Expected to be
recovered within one year (inclusive)
162,568,980.70
114,632,346.16 Expected to be
recovered after one year 1,193,183,162.57 596,551,169.49
1,355,752,143.27 711,183,515.65
S.F. HOLDING CO., LTD. NOTES TO THE FINANCIAL STATEMENTS FOR THE SIX MONTHS ENDED 30 JUNE 2019 (All amounts in RMB Yuan unless otherwise stated) [English translation for reference only]
211
4 Notes to the consolidated financial statements (Cont’d)
(38) Deferred tax assets and deferred tax liabilities (Cont’d)
(e) The net balances of deferred tax assets and liabilities after offsetting are as follows: 30 June 2019 31 December 2018 Deferred tax assets - net 721,940,063.72 584,462,905.44 Deferred tax liabilities - net 1,172,170,806.43 537,090,946.18
(39) Share capital
31 December
2018 Increase in the current period
Decrease in the current period
(Note 9(1)) 30 June 2019 Ordinary shares
denominated in RMB 4,418,767,258.00 - (4,181,993.00) 4,414,585,265.00
31 December
2017 Increase in the current period
Decrease in the current period 31 December 2018
Ordinary shares
denominated in RMB 4,411,015,524.00 7,788,643.00 -
4,418,804,167.00
(40) Capital reserve
31 December 2018 Increase in the
current period Decrease in the
current period
30 June 2019 Share premium
- Capital contribution by shareholders 15,768,464,376.95 - - 15,768,464,376.95
- Business combinations involving entities under common control (76,026,021.35) - - (76,026,021.35)
- Share-based payment in capital contribution by shareholders (Note 4(41)) 193,344,979.29 - (104,584,725.90) 88,760,253.39
Other capital surplus - Share-based payment
included in capital reserve (Note 9(2)) 44,965,842.16
14,581,133.08
-
59,546,975.24 - Others 138,869,988.62 5,959,966.12 - 144,829,954.74
16,069,619,165.67 20,541,099.20 (104,584,725.90) 15,985,575,538.97

S.F. HOLDING CO., LTD. NOTES TO THE FINANCIAL STATEMENTS FOR THE SIX MONTHS ENDED 30 JUNE 2019 (All amounts in RMB Yuan unless otherwise stated) [English translation for reference only]
212
4 Notes to the consolidated financial statements (Cont’d)
(40) Capital reserve (Cont’d)
31 December 2017 Increase in the
current period Decrease in the
current period
30 June 2018 Share premium
- Capital contribution by shareholders 15,768,464,376.95 - - 15,768,464,376.95
- Business combinations involving entities under common control 213,592,671.52 - (43,617,193.55) 169,975,477.97
- Share-based payment in capital contribution by shareholders (Note 4(41)) - 194,466,894.22 - 194,466,894.22
Other capital surplus - Share-based payment
included in capital reserve (Note 9(2)) 419,902.42
23,930,346.08
-
24,350,248.50 - Others 104,066,451.66 14,094,942.26 (23,663,996.34) 94,497,397.58
16,086,543,402.55 232,492,182.56 (67,281,189.89) 16,251,754,395.22
(41) Treasury stock
31 December
2018 Increase in the
current period Decrease in the
current period
30 June 2019
Restricted shares 200,928,467.28 394,996,314.03 (141,663,846.07) 454,260,935.24
31 December
2017 Increase in the current period
Decrease in the current period 30 June 2018
Restricted shares - 202,255,537.22 - 202,255,537.22 As stated in Note 9(2), ordinary A shares, which were issued by the Company to the incentive recipients of the restricted shares incentive plan in 2017 and 2018, counted at 7,788,643.00 shares with raised funds totalling RMB 202,255,537.22, including an increment of share capital of RMB 7,788,643.00 and an increment of capital reserve of RMB 194,466,894.22. In addition, the repurchasing obligation is recognised in liabilities (as purchase of treasury stock) at the number of restricted shares issued multiplied by the repurchasing price (Note 4(30)). In 2018, some of the Company’s original incentive recipients resigned and lost their right to receive incentives, therefore the Company repurchased and cancelled the restricted shares previously held by these incentive recipients (36,909.00 shares in total) with a deduction from the treasury share of RMB 1,082,171.88, including a reduction of RMB 36,909.00 in share capital, and RMB 1,045,262.88 in capital reserve.

S.F. HOLDING CO., LTD. NOTES TO THE FINANCIAL STATEMENTS FOR THE SIX MONTHS ENDED 30 JUNE 2019 (All amounts in RMB Yuan unless otherwise stated) [English translation for reference only]
213
4 Notes to the consolidated financial statements (Cont’d)
(41) Treasury stock (Cont’d) As at 3 January 2019, the Company held the 18th session of the fourth Board of Directors, at which the Proposal of the Accomplishment of the Unlocking Conditions of the First Post Lock-up Period for the Restricted Shares for 2017 was reviewed. The Company recognised that the unlocking conditions for the first post lock-up period for the restricted shares for 2017 were met, and the treasury stock of RMB 32,393,334.30 were deducted.In addition, the criteria of the performance assessment for the second post lock-up period for the restricted shares incentive plan for 2017 and the first post lock-up period for the restricted shares incentive plan for 2018 were not met, therefore the Company repurchased and cancelled the restricted shares previously held by these incentive recipients (3,741,407.00 shares in total) during the reporting period with a deduction from the treasury share of RMB 96,583,654.6, including a reduction of RMB 3,741,407.00 in share capital, and RMB 92,842,247.60 in capital reserve. For the current reporting period, some of the Company’s original incentive recipients resigned and lost their right to receive incentives, therefore the Company repurchased and cancelled the restricted shares previously held by these incentive recipients (440,586.00 shares in total) with a deduction from the treasury share of RMB 12,183,064.30, including a reduction of RMB 440,586.00 in share capital, and RMB 11,742,478.30 in capital reserve. During the reporting period, the Company deducted the treasury stock by RMB 503,792.87 based on the revocable cash dividends distributed to holders whose restricted shares were expected to be unlocked in the restricted shares incentive plan for 2018. In addition, as at 31 January 2019, at the 19th session of the fourth Board of Directors, the Proposal of Repurchasing Shares by Centralised Price Bidding was approved. The Company repurchase a portion of corporate shares for employee stock ownership plan or share-based incentive plan through centralised price bidding by self-owned funds in a total of 11,010,729.00 shares and treasury stock of RMB 394,996,314.03 was recognised.
(42) Special reserve 31 December
2018 Increase in the
current period Decrease in the
current period
30 June 2019
Safety reserve - 3,776,493.37 (3,776,493.37) - 31 December
2017 Increase in the
current period Decrease in the
current period
30 June 2018
Safety reserve - 2,727,907.70 (2,727,907.70) - Pursuant to the Administrative Measures for the Collection and Utilisation of Enterprise Work Safety Funds (Cai Qi [2012] No. 16) issued by the Ministry of Finance and the State Administration of Work Safety on 14 February 2012, 1% of the income from the "Common cargo transportation business" which is operated by certain subsidiaries of the Group is appropriated to safety reserve. The safety reserve is recognised in profit or loss as the "Special reserve" item for the current period. When the accrued safety reserve is used under the prescribed conditions, it is written off against the original amount directly.

S.F. HOLDING CO., LTD. NOTES TO THE FINANCIAL STATEMENTS FOR THE SIX MONTHS ENDED 30 JUNE 2019 (All amounts in RMB Yuan unless otherwise stated) [English translation for reference only]
214
4 Notes to the consolidated financial statements (Cont’d)
(43) Surplus reserve
31 December 2018
Increase in the current period
Decrease in the current period
30 June 2019
Statutory surplus
reserve 601,132,890.32 - - 601,132,890.32
31 December
2017 Increase in the
current period Decrease in the
current period
30 June 2018
Statutory surplus reserve 586,501,527.41 - - 586,501,527.41
(44) Retained earnings
For the six months ended 30 June 2019 2018 Undistributed profits at the end of the prior year 14,960,151,735.98 11,478,728,731.98 Add: Net profit attributable to shareholders of the
parent company 3,101,111,638.63 2,209,579,126.20 Less: Ordinary share dividends payable (a) (924,735,176.17) (970,985,880.70)
Transfer from other comprehensive income to retained earnings (54,334,158.75) -
Retained earnings at the end of the period 17,082,194,039.69 12,717,321,977.48
(a) The Company held shareholders’ meeting on 9 April 2019. On the basis of the total share capital at
the registration date on which the profit distribution plan was implemented less the special shares repurchased by the Company, a total of RMB 925,302,561.11 of cash dividends were distributed to all shareholders at RMB 2.10 (including tax) per 10 shares, without bonus shares being given or capital reserve being converted into the share capital.
During the reporting period, the Company adjusted dividends of ordinary shares by RMB 567,384.94 in total (including 2,628,136 shares of the unregistered restricted stock corresponding to common stock dividends of RMB 551,908.56), based on the restricted shares that were expected not to be unlockable (due to employee resignation or share forfeiture) in the future for the restricted shares incentive plan for 2018. The adjusted ordinary share dividends payable is RMB 924,735,176.17.
(45) Revenue and cost of revenue For the six months ended 30 June 2019 2018 Revenue from main operations (a) 50,023,101,039.35 42,520,634,130.47 Revenue from other operations (b) 51,602,994.50 30,272,624.95 Total revenue 50,074,704,033.85 42,550,906,755.42 Cost of revenue from main operations (a) 40,120,963,760.73 34,472,523,685.77 Cost of revenue from other operations (b) 31,080,464.00 11,038,458.62 Total cost of revenue 40,152,044,224.73 34,483,562,144.39

S.F. HOLDING CO., LTD. NOTES TO THE FINANCIAL STATEMENTS FOR THE SIX MONTHS ENDED 30 JUNE 2019 (All amounts in RMB Yuan unless otherwise stated) [English translation for reference only]
215
4 Notes to the consolidated financial statements (Cont’d) (45) Revenue and cost of revenue (Cont’d)
(a) Revenue and cost of revenue from main operations:
For the six months ended 30 June 2019 2018
Revenue from main
operations
Cost of revenue from main operations
Revenue from main operations
Cost of revenue from main operations
Express logistic
and supply chain 49,479,804,469.27 39,676,010,637.56 42,160,162,854.77 34,214,278,112.75
Sales of goods 253,670,085.55 244,437,355.69 54,768,168.17 54,683,418.92 Others 289,626,484.53 200,515,767.48 305,703,107.53 203,562,154.10 50,023,101,039.35 40,120,963,760.73 42,520,634,130.47 34,472,523,685.77
(b) Revenue and cost of revenue from other operations:
For the six months ended 30 June 2019 2018
Revenue from
other operations
Cost of revenue from other operations
Revenue from other operations
Cost of revenue from other operations
Disposal of
materials 5,366,068.43 3,135,831.83 7,873,198.29 3,839,357.84 Others 46,236,926.07 27,944,632.17 22,399,426.66 7,199,100.78 51,602,994.50 31,080,464.00 30,272,624.95 11,038,458.62
(46) Taxes and surcharges For the six months ended 30 June 2019 2018 Payment criterion City maintenance and
construction tax 38,783,027.88 37,811,919.68 Refer to Note 3 Educational
surcharge 28,667,288.45 28,097,637.46 Refer to Note 3 Stamp tax 26,174,629.84 23,936,519.60 Property tax 20,621,947.62 14,519,251.20 Land use tax 6,263,679.64 5,607,928.31 Flood-control project
expenses 117,176.63 347,591.97 Others 377,126.98 175,001.91 121,004,877.04 110,495,850.13

S.F. HOLDING CO., LTD. NOTES TO THE FINANCIAL STATEMENTS FOR THE SIX MONTHS ENDED 30 JUNE 2019 (All amounts in RMB Yuan unless otherwise stated) [English translation for reference only]
216
4 Notes to the consolidated financial statements (Cont’d)
(47) Selling and distribution expenses For the six months ended 30 June 2019 2018 Employee benefits 318,510,509.75 402,086,961.72 Information technology service - outsourcing 208,263,429.24 207,446,231.11 Marketing expenses 105,880,810.06 132,624,859.37 IT and information platform expenses 90,956,344.09 91,023,863.25 Office and rental fees 57,350,290.67 84,864,070.37 Supply and material expenses 13,090,938.53 22,961,218.78 Depreciation and amortisation expenses 69,638,430.07 9,675,871.70 Travelling and transportation expenses 13,360,325.69 9,787,510.78 Others 7,498,378.66 13,147,639.24 884,549,456.76 973,618,226.32
(48) General and administrative expenses
For the six months ended 30 June 2019 2018 Employee benefits 3,889,881,251.00 3,104,847,897.47 Office and rental fees 258,203,417.98 233,644,740.55 Depreciation and amortisation expenses 209,628,709.57 164,874,997.40 Professional service fee 145,893,419.37 90,274,734.43 Entertainment expenses 83,172,264.44 78,994,338.33 Travelling and transportation expenses 64,149,585.92 65,888,125.26 Royalties 35,565,574.35 - Supply and material expenses 30,892,230.32 44,336,206.17 IT and information platform expenses 27,373,472.94 - Taxes 14,129,992.87 13,277,832.26 Others 84,771,537.18 48,624,453.45 4,843,661,455.94 3,844,763,325.32

S.F. HOLDING CO., LTD. NOTES TO THE FINANCIAL STATEMENTS FOR THE SIX MONTHS ENDED 30 JUNE 2019 (All amounts in RMB Yuan unless otherwise stated) [English translation for reference only]
217
4 Notes to the consolidated financial statements (Cont’d)
(49) Research and development expenses For the six months ended 30 June
2019 2018 Employee benefits 274,413,117.59 258,975,780.70 Outsourcing cost 21,612,421.02 41,631,096.16 IT and information platform expenses 62,492,335.64 34,299,055.93 Office and rental fees 16,593,373.66 13,657,314.41 Supply and material expenses 2,380,344.87 2,403,283.33 Depreciation and amortisation expenses 108,581,274.94 35,543,273.50 Travelling and transportation expenses 8,374,048.34 5,695,346.39 Professional service fee 8,386,104.63 3,810,153.83 Others 6,261,353.20 7,509,100.91
509,094,373.89 403,524,405.16
(50) Financial costs For the six months ended 30 June 2019 2018 Interest on borrowings 443,050,621.03 298,640,675.72 Less: Capitalised interest (Note 4(18)) (10,096,711.26) (7,765,050.78) Interest expenses 432,953,909.77 290,875,624.94 Less: Interest income (140,657,962.96) (258,040,873.83) Net losses/(gains) on exchange 4,779,048.26 (5,507,106.10) Commission expenses and others 34,534,612.53 27,093,078.80 331,609,607.60 54,420,723.81

S.F. HOLDING CO., LTD. NOTES TO THE FINANCIAL STATEMENTS FOR THE SIX MONTHS ENDED 30 JUNE 2019 (All amounts in RMB Yuan unless otherwise stated) [English translation for reference only]
218
4 Notes to the consolidated financial statements (Cont’d)
(51) Expenses by nature The cost of revenue, selling and distribution expenses, general and administrative expenses and R&D expenses in the income statement are listed as follows by nature: For the six months ended 30 June 2019 2018 Outsourcing cost 22,516,293,483.01 18,054,257,870.76 Employee benefits 10,187,960,965.68 9,771,095,076.21 Transportation cost 4,591,767,428.13 4,433,684,663.63 Including: Aircraft maintenance costs 122,550,201.24 83,909,218.24 Office and rental fees 3,370,766,894.22 2,479,218,545.33 Depreciation and amortisation expenses 2,112,983,478.49 1,673,643,034.23 Supply and material expenses 1,821,849,752.17 1,834,735,272.78 IT and information platform expenses 376,367,330.53 250,093,161.82 Claims expenses 286,839,014.36 379,775,938.43 Cost of revenue of goods 244,437,355.69 54,683,418.92 Professional service fee 154,279,523.99 94,084,888.26 Customs cost 146,219,546.06 140,239,527.49 Travelling and transportation expenses 121,361,182.76 109,191,030.98 Marketing expenses 105,880,810.06 132,624,859.37 Brand usage fee 35,565,574.35 - Taxes 15,370,055.24 14,943,003.13 Others 301,407,116.58 283,197,809.85 46,389,349,511.32 39,705,468,101.19 For the six months ended 30 June 2019, the Group’s government grants which were offset against expenses amounted to RMB 44,298,310.60 (for the six months ended 30 June 2018: RMB 20,576,287.11) and were fully offset against the cost of revenue. Therein, the amount that was recognised in non-recurring profit or loss amounted to RMB 44,298,310.60 (for the six months ended 30 June 2018: RMB 11,541,881.11).
(52) Other income For the six months ended 30 June
2019
2018
Fiscal appropriation for
logistics 75,056,584.88 49,953,937.49 Related to income Tax preference 54,037,453.25 6,139,529.02 Related to income Grant from Social
Security Bureau 18,743,054.92 6,318,349.17 Related to income Amortisation of
deferred income (Note 4(37))
16,509,299.54 12,318,561.87 Related to assets 164,346,392.59 74,730,377.55

S.F. HOLDING CO., LTD. NOTES TO THE FINANCIAL STATEMENTS FOR THE SIX MONTHS ENDED 30 JUNE 2019 (All amounts in RMB Yuan unless otherwise stated) [English translation for reference only]
219
4 Notes to the consolidated financial statements (Cont’d)
(53) Investment income For the six months ended 30 June 2019 2018
Investment income from sale of equity interests of Fengyi Technology 216,691,565.20 -
Investment income from financial assets held for trading 79,742,073.62 7,555,719.72
Investment income from remeasurement of the remaining equity interests in Fengyi Technology measure at fair value 64,204,908.21 -
Income from disposal on other long-term equity investments 47,334,607.83 90,348,615.94
Investment income from wealth management products 29,086,155.52 102,830,226.45
Investment income from entrusted loans - 30,827,736.38 Investment loss from disposal of other
available-for-sale financial assets, etc. - 8,121,553.19 Share of net profit or loss of investees
under equity method (Note 4(13)) (50,985,409.53) 8,841,240.97 386,073,900.85 248,525,092.65 There is no significant restriction on recovery of investment income of the Group.
(54) Gains/(losses) arising from changes in fair value For the six months ended 30 June 2019 2018 Structural deposits 9,960,802.13 - SAFE and discounted stock option 304,239,702.03
- Others 16,007,107.39 (4,812,095.66)
330,207,611.55 (4,812,095.66)
(55) Credit impairment losses
For the six months
ended 30 June 2019 Loss from bad debts of accounts receivable 79,264,307.29 Loss from impairment of factoring receivables 53,080,511.77 Loss from bad debts of other receivables 13,044,791.88 Impairment loss on loans and advances 3,475,742.51 148,865,353.45

S.F. HOLDING CO., LTD. NOTES TO THE FINANCIAL STATEMENTS FOR THE SIX MONTHS ENDED 30 JUNE 2019 (All amounts in RMB Yuan unless otherwise stated) [English translation for reference only]
220
4 Notes to the consolidated financial statements (Cont’d)
(56) Asset impairment losses For the six months ended 30 June 2019 2018 Impairment loss of intangible assets 37,001,101.69 - Losses on impairment of long-term equity
investments 17,111,077.45 - Loss from bad debts - 10,425,741.65 Loss from impairment of factoring
receivables - 3,703,600.13 Impairment loss on loans and advances - (91,323.02) Impairment loss on available-for-sale
financial assets - 12,356,790.57 54,112,179.14 26,394,809.33
(57) Losses on disposal of assets For the six months ended 30 June
2019
Amount recognised in non-recurring
profit or loss in 2019
2018
Amount recognised in non-recurring
profit or loss in 2018
Gains on disposal of fixed assets 22,537,744.97 22,537,744.97 12,251,310.61 12,251,310.61
Losses on disposal of fixed assets (35,413,896.70) (35,413,896.70) (19,234,090.64) (19,234,090.64)
(12,876,151.73) (12,876,151.73) (6,982,780.03) (6,982,780.03)
(58) Non-operating income and expenses
(a) Non-operating income For the six months ended 30 June
2019
Amount recognised in non-recurring
profit or loss in 2019
2018
Amount recognised in non-recurring
profit or loss in 2018
Government grants (i) 17,708,816.27 17,708,816.27 18,468,239.86 18,468,239.86 Compensation income 5,971,898.89 5,971,898.89 4,997,518.01 4,997,518.01 Income from penalty 1,198,197.30 1,198,197.30 774,761.71 774,761.71 Others 45,274,628.31 45,274,628.31 35,079,309.37 35,079,309.37 70,153,540.77 70,153,540.77 59,319,828.95 59,319,828.95

S.F. HOLDING CO., LTD. NOTES TO THE FINANCIAL STATEMENTS FOR THE SIX MONTHS ENDED 30 JUNE 2019 (All amounts in RMB Yuan unless otherwise stated) [English translation for reference only]
221
4 Notes to the consolidated financial statements (Cont’d)
(58) Non-operating income and expenses (Cont’d) (a) Non-operating income (Cont'd) (i) Details of government grants
For the six months ended 30 June
2019
Related to assets/income 2018
Related to assets/income
General fiscal
appropriation 16,722,833.19 Related to
income 16,917,029.86 Related to
income
Others 985,983.08 Related to
income 1,551,210.00 Related to
income 17,708,816.27 18,468,239.86
(b) Non-operating expenses For the six months ended 30 June
2019
Amount recognised in non-recurring
profit or loss in 2019
2018
Amount recognised in non-recurring
profit or loss in 2018
Compensation expenses 19,532,798.24 19,532,798.24 10,805,478.76 10,805,478.76 Donation expenses 5,150,996.20 5,150,996.20 21,455,358.49 21,455,358.49 Penalties and overdue
fines 8,615,819.45 8,615,819.45 8,884,826.16 8,884,826.16 Others 8,461,646.82 8,461,646.82 9,432,058.02 9,432,058.02 41,761,260.71 41,761,260.71 50,577,721.43 50,577,721.43
(59) Income tax expenses For the six months ended 30 June 2019 2018 Current income tax 891,418,578.47 755,698,296.11 Deferred income tax (8,776,281.95) 35,251,433.97 882,642,296.52 790,949,730.08

S.F. HOLDING CO., LTD. NOTES TO THE FINANCIAL STATEMENTS FOR THE SIX MONTHS ENDED 30 JUNE 2019 (All amounts in RMB Yuan unless otherwise stated) [English translation for reference only]
222
4 Notes to the consolidated financial statements (Cont’d)
(59) Income tax expenses (Cont'd) The reconciliation from income tax calculated based on the applicable tax rates and total profit presented in the income statement to the income tax expenses is listed below: For the six months ended 30 June 2019 2018 Total profit 3,925,906,538.62 2,974,329,972.99 Income tax expenses calculated at the
standard tax rate of 25% 981,476,634.66 743,582,493.25 Costs, expenses and losses not deductible
for tax purposes 39,552,923.73 23,793,243.80 Effect of last-year tax filing differences (29,736,018.06) 22,825,134.33 Effect of different tax rates among different
subsidiaries and branches on income tax expenses (43,180,878.92) (25,695,497.51)
Deductible tax losses and deductible temporary differences for which no deferred tax asset was recognised in the current period 141,663,070.72 92,129,867.03
Reversal of previously recognised deductible losses for which deferred tax asset was recognised 44,911,454.39 -
Utilisation of deductible tax losses and other deductible temporary differences for which no deferred tax asset was recognised in prior periods (134,263,952.26) (49,201,665.06)
Recognition of deductible tax losses and other deductible temporary differences for which no deferred tax asset was recognised in prior periods (2,500,000.00) (6,394,907.15)
Tax preference (10,678,902.56) (6,505,389.39) Income not subject to tax (104,602,035.18) (3,583,549.22) Income tax expenses 882,642,296.52 790,949,730.08

S.F. HOLDING CO., LTD. NOTES TO THE FINANCIAL STATEMENTS FOR THE SIX MONTHS ENDED 30 JUNE 2019 (All amounts in RMB Yuan unless otherwise stated) [English translation for reference only]
223
4 Notes to the consolidated financial statements (Cont’d) (60) Earnings per share (a) Basic earnings per share
Basic earnings per share are calculated by dividing consolidated net profit attributable to ordinary shareholders of the parent company by the weighted average number of outstanding ordinary shares of the parent company: For the six months ended 30 June 2019 2018 Consolidated net profit attributable to ordinary
shareholders of the parent company 3,101,111,638.63 2,209,579,126.20 Less: Cash dividends distributed to holders
whose restricted shares are expected to be unlocked (503,792.87) (554,345.44)
Adjusted consolidated net profit attributable to ordinary shareholders of the parent company for calculation of earnings per share 3,100,607,845.76 2,209,024,780.76
Weighted average number of outstanding ordinary shares of the Company 4,407,421,565.50 4,411,015,524.00
Basic earnings per share 0.70 0.50 Including: - Basic earnings per share from continuing
operations 0.70 0.50
(b) Diluted earnings per share Diluted earnings per share are calculated by dividing consolidated net profit attributable to ordinary shareholders of the parent company adjusted based on the dilutive potential ordinary shares by the adjusted weighted average number of outstanding ordinary shares of the Company. For the six months ended 30 June 2019, the Company had dilutive potential ordinary shares (for the six months ended 30 June 2018: the same): For the six months ended 30 June 2019 2018 Consolidated net profit attributable to ordinary
shareholders of the parent company 3,101,111,638.63 2,209,579,126.20 Weighted average number of outstanding
ordinary shares of the Company 4,407,421,565.50
4,411,015,524.00 Weighted average number of ordinary shares
increased from share-based payment - 294,453.28 Weighted average number of outstanding
diluted ordinary shares 4,407,421,565.50 4,411,309,977.28 Diluted earnings per share 0.70 0.50

S.F. HOLDING CO., LTD. NOTES TO THE FINANCIAL STATEMENTS FOR THE SIX MONTHS ENDED 30 JUNE 2019 (All amounts in RMB Yuan unless otherwise stated) [English translation for reference only]
224
4 Notes to the consolidated financial statements (Cont’d)
(61) Minority interests
30 June 2019 31 December 2018
Havi Hong Kong 190,162,913.29 190,294,212.29 Beijing Deda 122,622,416.49 120,633,401.06 Xiamen Ruite - 46,511,906.07 Guangdong Shunxin Express (66,861,525.76) (9,492,458.61) Chengdu Fengcheng Logistics Co., Ltd. (15,546,781.86) (15,272,143.06) Others 55,547,535.16 20,256,715.52
285,924,557.32 352,931,633.27

S.F. HOLDING CO., LTD. NOTES TO THE FINANCIAL STATEMENTS FOR THE SIX MONTHS ENDED 30 JUNE 2019 (All amounts in RMB Yuan unless otherwise stated) [English translation for reference only]
225
4 Notes to the consolidated financial statements (Cont’d)
(62) Other comprehensive income Other comprehensive income, the related income tax effect and the reclassifications to profit or loss for the six months ended 30 June 2019 and 30 June 2018: Other comprehensive income in balance sheet Changes in other comprehensive income for the six months ended 30 June 2019
·
Less: Income taxes expenses
Less: Reclassification
of other comprehensive
income to retained earnings
Attributable to the parent
company - net of tax
Attributable to minority
shareholders - net of tax
31 December 2018
Changes in accounting
policies
1 January 2019
Attributable to the parent
company in the current
period - net of tax
30 June 2019
Amount incurred before
tax
Exchange differences on translation of foreign currency financial statements 191,026,574.28 - 191,026,574.28 15,179,377.55 206,205,951.83 15,265,426.96 - - 15,179,377.55 86,049.41
Other comprehensive income of convertible gains and losses under the equity method - - - (1,956,923.83) (1,956,923.83) (1,956,923.83) - - (1,956,923.83) -
Changes in fair value of investments in other equity instruments - 353,622,821.31 353,622,821.31 32,979,875.05 386,602,696.36 24,629,582.65 (45,983,866.35) 54,334,158.75 32,979,875.05 -
Changes in fair value of available-for-sale financial assets 336,157,723.57 (336,157,723.57) - - - - - - -
527,184,297.85 17,465,097.74 544,649,395.59 46,202,328.77 590,851,724.36 37,938,085.78 (45,983,866.35) 54,334,158.75 46,202,328.77 86,049.41

S.F. HOLDING CO., LTD. NOTES TO THE FINANCIAL STATEMENTS FOR THE SIX MONTHS ENDED 30 JUNE 2019 (All amounts in RMB Yuan unless otherwise stated) [English translation for reference only]
226
4 Notes to the consolidated financial statements (Cont’d)
(62) Other comprehensive income (Cont'd)
· Other comprehensive income in balance sheet Changes in other comprehensive income for the six months ended 30 June 2019
31 December 2017
Attributable to
the parent company in the current period -
net of tax
30 June 2018
Amount incurred before tax
Less: Reclassification
of other comprehensive income to profit
or loss
Less: Income tax expenses
Attributable to the parent
company - net of tax
Attributable to minority
shareholders - net of tax
Share of the other comprehensive income of the investee accounted for using equity method which will be reclassified subsequently to profit and loss - 147,032.76 147,032.76 147,032.76 - - 147,032.76 -
Exchange differences on translation of foreign currency financial statements 17,159,014.31 29,321,142.79 46,480,157.10 27,716,932.12 - - 29,321,142.79 (1,604,210.67)
Changes in fair value of available-for-sale financial assets 202,671,218.52 (106,747,986.27) 95,923,232.25 (127,625,141.88) 3,066,230.82 17,810,924.79 (106,747,986.27) -
219,830,232.83 (77,279,810.72) 142,550,422.11 (99,761,177.00) 3,066,230.82 17,810,924.79 (77,279,810.72) (1,604,210.67)

S.F. HOLDING CO., LTD. NOTES TO THE FINANCIAL STATEMENTS FOR THE SIX MONTHS ENDED 30 JUNE 2019 (All amounts in RMB Yuan unless otherwise stated) [English translation for reference only]
227
4 Notes to the consolidated financial statements (Cont’d) (63) Notes to the cash flow statement (a) Cash received relating to other operating activities
For the six months ended 30 June 2019 2018 Inflows from cash on delivery service 24,744,324,674.22 24,226,774,735.21 Government grants 202,754,430.01 147,569,681.66 Interest income 153,109,828.49 276,913,014.71 Finance lease received 23,511,252.99 211,694,980.76 Wealth management funds received on
behalf of other parties - 698,301,656.78 Net cash received from Mingde Holdings - 61,663,743.90 Others 500,498,245.42 661,262,635.06 25,624,198,431.13 26,284,180,448.08
(b) Cash paid relating to other operating activities For the six months ended 30 June 2019 2018 Outflows from cash on delivery service 25,075,406,925.83 24,535,583,400.73 Office and rental fees 3,138,436,865.23 2,687,326,759.30 IT and information platform expenses 398,949,370.36 264,420,482.55 Claims expenses 286,839,014.36 379,775,938.43 Professional service fee 149,761,306.12 107,278,510.85 Customs cost 143,435,811.24 143,671,679.56 Travelling and transportation expenses 128,642,853.73 114,989,173.89 Marketing expenses 112,233,658.66 139,315,147.22 Entertainment expenses 89,436,984.88 83,699,510.54 Bank charges 34,534,612.53 25,816,237.28 Compensation and penalty 28,148,617.69 19,690,204.92 Donation expenses 5,150,996.20 21,455,358.49 Wealth management funds paid on behalf of
other parties - 1,090,386,560.21 Others 511,993,829.17 934,884,941.51 30,102,970,846.00 30,548,293,905.48
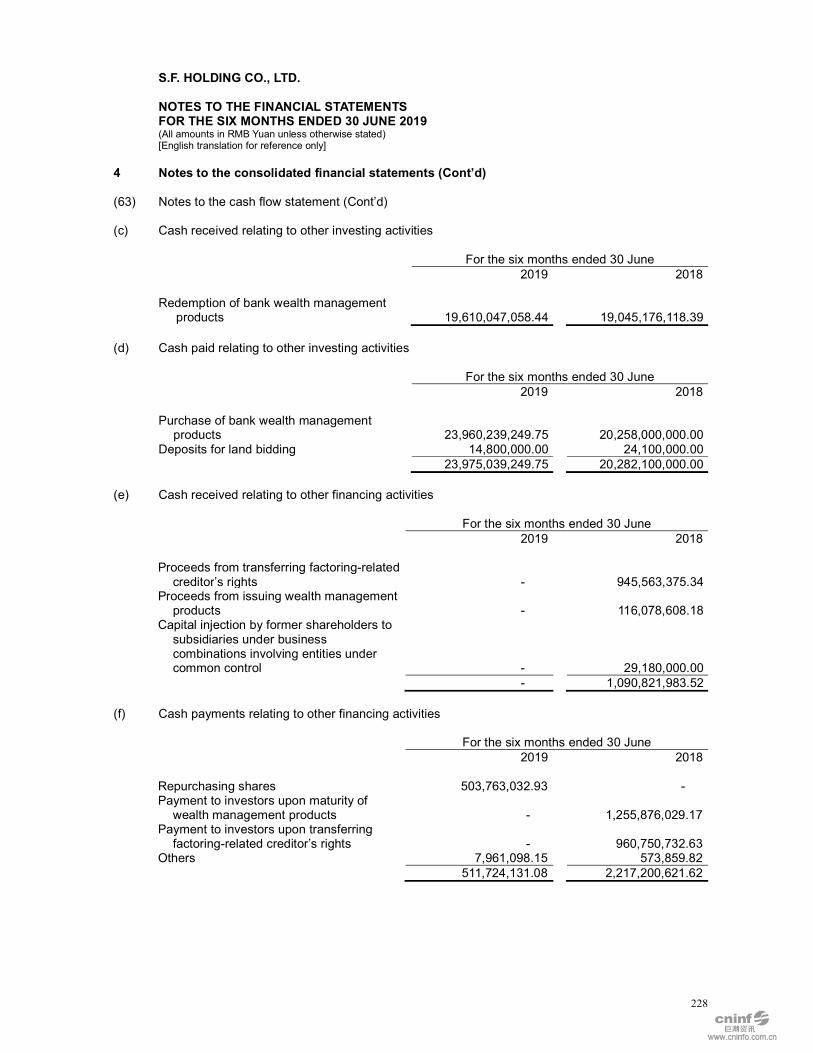
S.F. HOLDING CO., LTD. NOTES TO THE FINANCIAL STATEMENTS FOR THE SIX MONTHS ENDED 30 JUNE 2019 (All amounts in RMB Yuan unless otherwise stated) [English translation for reference only]
228
4 Notes to the consolidated financial statements (Cont’d)
(63) Notes to the cash flow statement (Cont’d)
(c) Cash received relating to other investing activities For the six months ended 30 June 2019 2018 Redemption of bank wealth management
products 19,610,047,058.44 19,045,176,118.39
(d) Cash paid relating to other investing activities For the six months ended 30 June 2019 2018 Purchase of bank wealth management
products 23,960,239,249.75 20,258,000,000.00 Deposits for land bidding 14,800,000.00 24,100,000.00 23,975,039,249.75 20,282,100,000.00
(e) Cash received relating to other financing activities For the six months ended 30 June 2019 2018 Proceeds from transferring factoring-related
creditor’s rights - 945,563,375.34 Proceeds from issuing wealth management
products - 116,078,608.18 Capital injection by former shareholders to
subsidiaries under business combinations involving entities under common control - 29,180,000.00
- 1,090,821,983.52
(f) Cash payments relating to other financing activities For the six months ended 30 June 2019 2018 Repurchasing shares 503,763,032.93 - Payment to investors upon maturity of
wealth management products
-
1,255,876,029.17
Payment to investors upon transferring factoring-related creditor’s rights
-
960,750,732.63 Others 7,961,098.15 573,859.82 511,724,131.08 2,217,200,621.62

S.F. HOLDING CO., LTD. NOTES TO THE FINANCIAL STATEMENTS FOR THE SIX MONTHS ENDED 30 JUNE 2019 (All amounts in RMB Yuan unless otherwise stated) [English translation for reference only]
229
4 Notes to the consolidated financial statements (Cont’d) (64) Supplementary information to the cash flow statement (a) Notes to the cash flow statement Reconciliation from net profit to cash flows from operating activities
For the six months ended 30 June 2019 2018 Net profit 3,043,264,242.10 2,183,380,242.91 Add: Provision for asset impairment 54,112,179.14 26,394,809.33
Provision for credit impairment 148,865,353.45 - Depreciation of fixed assets 1,421,435,012.06 1,240,833,610.69 Depreciation of investment properties 32,605,157.06 25,713,133.85 Amortisation of intangible assets 316,497,477.63 164,898,545.05 Amortisation of long-term prepaid
expenses 342,445,831.74 247,231,821.97 Net losses on disposal of fixed assets 12,876,151.73 6,982,780.03 (Gains)/losses arising from changes in
fair value (330,207,611.55) 4,812,095.66 Financial costs 438,039,577.86 280,334,441.51 Investment income (386,073,900.85) (248,525,092.65) Recognised expenses on share-based
payments 15,597,712.81 23,930,346.08 (Increase)/decrease in deferred tax
assets (108,325,029.39) 27,692,143.89 Increase in deferred tax liabilities 99,548,747.44 7,559,290.08 Amortisation of deferred income (16,509,299.54) (12,318,561.87) Decrease/(increase) in inventories 73,895,759.23 (52,815,615.42) Decrease/(increase) in operating
receivables 762,706,058.73 (197,859,966.11) Decrease in operating payables (1,103,886,869.97) (1,358,635,234.20)
Net cash flows from operating activities 4,816,886,549.68 2,369,608,790.80

S.F. HOLDING CO., LTD. NOTES TO THE FINANCIAL STATEMENTS FOR THE SIX MONTHS ENDED 30 JUNE 2019 (All amounts in RMB Yuan unless otherwise stated) [English translation for reference only]
230
4 Notes to the consolidated financial statements (Cont’d)
(64) Supplementary information to the cash flow statement (Cont'd)
(a) Notes to the cash flow statement (Cont'd) Net increase/(decrease) in cash and cash equivalents For the six months ended 30 June 2019 2018 Cash and cash equivalents at the end of the
period 11,928,010,057.41 12,316,809,110.31 Less: Cash and cash equivalents at the
beginning of the period (15,299,270,711.01) (16,149,528,832.49) Net decrease in cash and cash equivalents (3,371,260,653.60) (3,832,719,722.18)
(b) Cash and cash equivalents 30 June 2019 31 December 2018 Cash on hand 925,135.67 1,333,057.53 Cash at bank that can be readily drawn on
demand 11,769,573,155.34 15,164,028,170.83 Other cash balances that can be readily
drawn on demand 95,925,811.41 61,912,773.22 Other balances that can be readily drawn on
demand 61,585,954.99 71,996,709.43 11,928,010,057.41 15,299,270,711.01
(c) Acquisition of subsidiaries For the six months ended 30 June 2019 2018 Cash and cash equivalents paid in the
current period for business combination incurred in the current period 5,346,964,309.54 20,858,612.00 Including: DHL HK and DHL BJ 5,325,964,309.54 -
Others 21,000,000.00 20,858,612.00 Less: Cash and cash equivalents held by
subsidiaries at the acquisition date (265,848,954.38) - Including: DHL HK and DHL BJ (254,733,022.95) -
Others (11,115,931.43) - Add: Cash paid in the period for business
combination in previous periods 86,411,295.00 - Net cash paid to acquire subsidiaries 5,167,526,650.16 20,858,612.00

S.F. HOLDING CO., LTD. NOTES TO THE FINANCIAL STATEMENTS FOR THE SIX MONTHS ENDED 30 JUNE 2019 (All amounts in RMB Yuan unless otherwise stated) [English translation for reference only]
231
4 Notes to the consolidated financial statements (Cont’d)
(65) Monetary items denominated in foreign currency As at 30 June 2019 and 31 December 2018, the Group's companies whose recording currency is RMB held no significant assets or liabilities denominated in foreign currency. Those companies operating in Hong Kong with HKD as recording currency held assets and liabilities denominated in non-recording currency (mainly USD and RMB), of which the equivalent amounts in HKD (recording currency of companies operating in Hong Kong) and RMB (presentation currency of these financial statements) are listed as below: 30 June 2019
Amount in the original
currency
Exchange rate to
HKD Equivalent to HKD Equivalent to RMB
Cash at bank and on hand -
RMB 93,646,253.31 1.1368 106,457,060.76 93,646,253.31 USD 10,336,623.15 7.8148 80,778,642.59 71,061,183.17
Accounts receivable -
RMB 3,019,374.25 1.1368 3,432,424.65 3,019,374.25 USD 3,138,605.15 7.8148 24,527,571.53 21,576,968.82
Accounts payable -
RMB 3,147,533.02 1.1368 3,578,115.54 3,147,533.02 USD 5,685,501.50 7.8148 44,431,057.12 39,086,117.16 31 December 2018
Amount in the original
currency
Exchange rate to
HKD Equivalent to HKD Equivalent to RMB
Cash at bank and on hand -
RMB 155,585,448.67 1.1413 177,569,672.57 155,585,448.67 USD 10,063,726.14 7.8329 78,828,160.48 69,069,365.24 Accounts
receivable -
RMB 6,584,773.28 1.1413 7,515,201.74 6,584,773.28 Accounts
payable -
RMB 30,803.76 1.1413 35,156.33 30,803.76
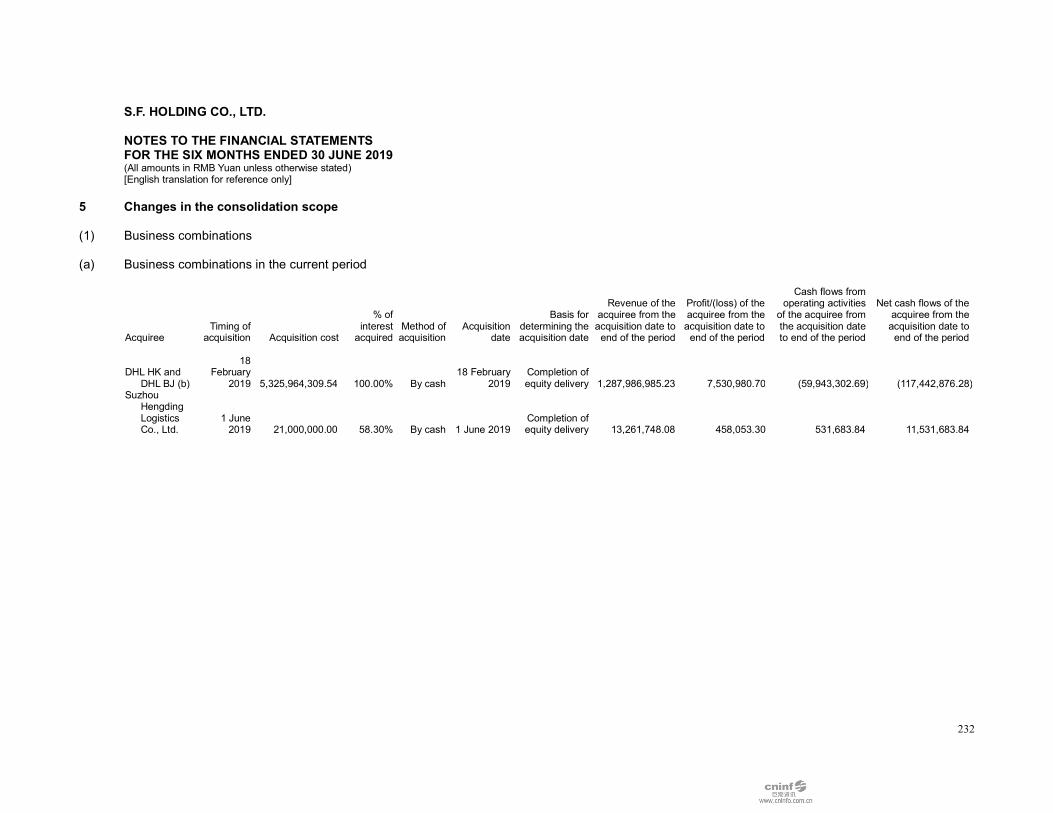
S.F. HOLDING CO., LTD. NOTES TO THE FINANCIAL STATEMENTS FOR THE SIX MONTHS ENDED 30 JUNE 2019 (All amounts in RMB Yuan unless otherwise stated) [English translation for reference only]
232
5 Changes in the consolidation scope
(1) Business combinations
(a) Business combinations in the current period
Acquiree Timing of
acquisition
Acquisition cost
% of interest
acquired
Method of acquisition
Acquisition date
Basis for determining the acquisition date
Revenue of the acquiree from the
acquisition date to end of the period
Profit/(loss) of the acquiree from the
acquisition date to end of the period
Cash flows from operating activities
of the acquiree from the acquisition date to end of the period
Net cash flows of the
acquiree from the acquisition date to
end of the period
DHL HK and DHL BJ (b)
18 February
2019 5,325,964,309.54 100.00% By cash 18 February
2019 Completion of equity delivery 1,287,986,985.23 7,530,980.70 (59,943,302.69) (117,442,876.28)
Suzhou Hengding Logistics Co., Ltd.
1 June 2019 21,000,000.00 58.30% By cash 1 June 2019
Completion of equity delivery 13,261,748.08 458,053.30 531,683.84 11,531,683.84

S.F. HOLDING CO., LTD. NOTES TO THE FINANCIAL STATEMENTS FOR THE SIX MONTHS ENDED 30 JUNE 2019 (All amounts in RMB Yuan unless otherwise stated) [English translation for reference only]
233
5 Changes in the consolidation scope (Cont'd)
(1) Business combinations (Cont’d)
(b) DHL HK and DHL BJ On 18 February 2019, the Group completed the acquisition of 100% equity of DHL HK and DHL BJ with a consideration of RMB 5,325,964,309.54. As at the acquisition date, the Group obtained control over DHL HK and DHL BJ, and included DHL HK and DHL BJ in the scope of consolidation.
(i) Details of the consideration of combination and goodwill recognised are as follows: DHL HK and DHL BJ Combination cost
- Cash 5,325,964,309.54 Less: Fair value of the share of identifiable net
assets acquired (2,439,260,841.06) Goodwill 2,886,703,468.48
(ii) The assets and liabilities of DHL HK and DHL BJ as at 18 February 2019 (the “acquisition date”) are as follows:
Fair value on the acquisition date
Carrying amount
on the acquisition date
Carrying amount on 31 December
2018 Cash at bank and on hand 254,733,022.95 254,733,022.95 457,610,020.95 Accounts receivable 1,216,859,696.21 1,216,859,696.21 1,278,629,434.34 Advances to suppliers 134,241,148.09 134,241,148.09 62,682,240.80 Other current assets 166,545,687.78 166,545,687.78 257,365,274.04 Fixed assets 113,777,184.90 113,777,184.90 114,481,903.83 Intangible assets 2,094,144,099.98 1,070,471.72 988,195.13 Deferred tax assets 50,890,814.68 50,890,814.68 55,651,465.97 Other non-current assets 115,287,722.53 115,287,722.53 118,403,520.50 Less: Accounts payable (873,680,255.02) (873,680,255.02) (953,693,659.12)
Other current liabilities (317,178,443.31) (317,178,443.31) (486,346,543.11) Deferred tax liabilities (490,247,396.37) - (685,652.66) Other non-current liabilities (26,112,441.36) (26,112,441.36) (17,974,245.73)
Net assets obtained 2,439,260,841.06 836,434,609.17 887,111,954.94
Note: The carrying amount is the total carrying amount of DHL HK and DHL BJ.

S.F. HOLDING CO., LTD. NOTES TO THE FINANCIAL STATEMENTS FOR THE SIX MONTHS ENDED 30 JUNE 2019 (All amounts in RMB Yuan unless otherwise stated) [English translation for reference only]
234
5 Changes in the consolidation scope (Cont'd)
(1) Business combinations (Cont’d)
(b) DHL HK and DHL BJ (Cont'd)
(ii) The assets and liabilities of DHL HK and DHL BJ as at 18 February 2019 (the “acquisition date”) are as follows: As at the acquisition date, the fair value of identifiable net assets exceeded the carrying amount by RMB 1,602,826,231.88, mainly comprising the recognition of intangible assets - customer relationships (Note 4(19)). The Group has engaged an independent valuer to assist in the identification and assessment of the fair value of DHL HK and DHL BJ's intangible assets. The valuation methods of major assets are presented as follows: Customer relationships are valued mainly using the multi-period excess earnings method that calculates the current value of customer relationships on the base date of evaluation by using an appropriate discount rate to discount the aggregated present value of excess earnings after deduction of asset contribution from the after-tax economic benefits expected to arise from leveraging the customer relationships in future years.
(2) Business combinations involving entities under common control
On 31 October 2018, Taisen Holdings acquired 100% equity of Lefeng Factoring, Shenzhen Shunheng Rongfeng Investment Co., Ltd. (“Rongfeng Investment”) and Shenzhen Hengyi Logistics Service Co., Ltd. (“Hengyi Logistics”), which were owned by the ultimate parent company Mingde Holdings. The combination date of this transaction is 31 October 2018, on which Taisen Holdings effectively obtained the control over Lefeng Factoring, Rongfeng Investment and Hengyi Logistics. This transaction is classified as a business combination involving entities under common control as Lefeng Factoring, Rongfeng Investment, Hengyi Logistics and Taisen Holdings are all ultimately controlled by Mingde Holdings prior and subsequent to the combination and the control is not temporary. On 31 October 2018, SF Holding Limited, one of the Company’s subsidiaries, acquired 100% equity of Luxuriant View Limited held by Mingde Holdings Limited, which was under common control of Mingde Holdings, the ultimate parent company. The combination date of this transaction is 31 October 2018, on which SF Holding Limited effectively obtained the control over Luxuriant View Limited. This transaction is classified as a business combination involving entities under common control as Luxuriant View Limited and SF Holding Limited are both ultimately controlled by Mingde Holdings prior and subsequent to the combination and the control is not temporary. The above subsidiaries acquired in a business combination involving entities under common control were included in the consolidated financial statements from the date when they come under control of the Company’s ultimate controlling party. Therefore, the Company adjusted the comparative consolidated financial statements for the six months ended 30 June 2018.

S.F. HOLDING CO., LTD. NOTES TO THE FINANCIAL STATEMENTS FOR THE SIX MONTHS ENDED 30 JUNE 2019 (All amounts in RMB Yuan unless otherwise stated) [English translation for reference only]
235
5 Changes in the consolidation scope (Cont'd) (3) Disposal of subsidiaries
(a) Aggregated information of subsidiaries disposed in the current period:
Name of subsidiary Proceeds from
disposal Disposal
proportion Method of
disposal Timing of losing
control
Basis for judgement of
timing of losing control
Difference between proceeds from disposal
and corresponding shares of net assets in
the consolidated financial statements
Amount transferred from other comprehensive
income related to initial equity investment to
investment income or loss
Fengyi Technology (i) 135,000,000.00 67.50% Sales of
equity 31 May 2019 Transfer of
control right 216,691,565.20 -
Xiamen Ruite 203,000,000.00 70.00% Sales of
equity 31 January 2019 Transfer of
control right 48,778,482.36 - S.F. Medical Supply Chain
(Nanjing) Co., Ltd. 7,000,000.00 100.00% Sales of
equity 30 June 2019 Transfer of
control right (1,443,874.53) - 345,000,000.00 264,026,173.03 -

S.F. HOLDING CO., LTD. NOTES TO THE FINANCIAL STATEMENTS FOR THE SIX MONTHS ENDED 30 JUNE 2019 (All amounts in RMB Yuan unless otherwise stated) [English translation for reference only]
236
5 Changes in the consolidation scope (Cont'd)
(3) Disposal of subsidiaries (Cont'd)
(b) Gains or losses on disposal are as follows:
(i) Fengyi Technology The calculation of gains or losses on disposal is as follows: Amount Consideration received from the disposal 135,000,000.00 Add: Bear the loss of Fengyi Technology in the consolidated financial
statements 81,691,565.20 216,691,565.20 Add: Other comprehensive income transferred to the profit and loss
for the current period - Investment income from disposal 216,691,565.20
(4) Other changes in the consolidation scope
(a) In the current period, the Group set up the following subsidiaries by cash: Shanghai Fengpaida Supply Chain Co., Ltd. Shenzhen Green Ear Technology Co., Ltd. Shenzhen SF Express Zhongyuan Network Technology Co., Ltd. Shenzhen Yike Technology Co., Ltd. Beijing Fenglejia Hotel Management Co., Ltd. SF Pharmaceutical Supply Chain (Jilin) Co., Ltd. Shanghai Haosiju Supply Chain Management Co., Ltd. Shanghai Chengbai Technology Co., Ltd. Wenzhou Jietai Enterprise Management Co., Ltd. Huai'an Fengtai Enterprise Management Co., Ltd. Suzhou Fengyutai Enterprise Management Co., Ltd. Shenzhen Fenglian Technology Co., Ltd. Hefei Jietai Enterprise Management Co., Ltd. Shanghai Binxian Supply Chain Management Co., Ltd. Yunnan Shunzhu Xinfeng Express Co., Ltd. Xinjiang Shunxin Jeda Express Co., Ltd. Fenghao Supply Chain (Shenzhen) Co., Ltd. Shanghai Fang’anjia Supply Chain Co., Ltd. Luoyang Fengnong Technology Co., Ltd. Hangzhou Shuangjie Supply Chain Co., Ltd. Quanzhou fengyutai Business Management Yiwu Fengyutai Enterprise Management Co., Ltd. Jiaxing Hongjie Enterprise Management Co., Ltd. SF Intra-city Holdings Limited Exel Logistics (Weihai) Co., Ltd. Wuhan Jufeng Supply Chain Management Co., Ltd. Yangzhou Fengyutai Enterprise Management Co., Ltd. Shenzhen Fengchi Shuntong Information Technology Co., Ltd. Wuhan Shunheng Express Co., Ltd. Langfang SF Express Co., Ltd.

S.F. HOLDING CO., LTD. NOTES TO THE FINANCIAL STATEMENTS FOR THE SIX MONTHS ENDED 30 JUNE 2019 (All amounts in RMB Yuan unless otherwise stated) [English translation for reference only]
237
5 Changes in the consolidation scope (Cont'd)
(4) Other changes in the consolidation scope (Cont'd)
(a) In the current period, the Group set up the following subsidiaries by cash (Cont'd): SF Sharing Precision Information Technology (Shenzhen) Co., Ltd. Xi'an SF Information Service Co., Ltd. Shenzhen Yijiayi Technology Co., Ltd. Guangdong Zhifan Technology Co., Ltd. SF Logistics Private Limited Shanghai Shunru Fenglai Technology Co., Ltd. Hangzhou SF Intra-city Industrial Co., Ltd. Sichuan Fengnong Technology Co., Ltd.

S.F. HOLDING CO., LTD. NOTES TO THE FINANCIAL STATEMENTS FOR THE SIX MONTHS ENDED 30 JUNE 2019 (All amounts in RMB Yuan unless otherwise stated) [English translation for reference only]
238
6 Interests in other entities
(1) Interests in subsidiaries
(a) First-tier and second-tier subsidiaries of the Group are as follows: Shareholding (%)
Place of
registration
Major business location Registered capital Nature of business Direct Indirect Method of acquisition
Taisen Holdings Shenzhen Shenzhen RMB 2 billion Investment holding 100% - Reverse acquisitions
S.F. Express Shenzhen Shenzhen RMB 150 million International freight forwarding, domestic
and international express service, etc. - 100% Business combination involving
enterprises under common control
SF Technology Shenzhen Shenzhen RMB 50 million Technical maintenance and development
service - 100% By new establishment
Shenzhen Shunlu Logistics Co., Ltd. Shenzhen Shenzhen RMB 150 million Cargo transportation and freight
forwarding - 100% Business combination involving
enterprises under common control Anhui S.F. Telecommunication Service
Co., Ltd. Anhui
Province Anhui
Province RMB 50 million Value-added telecommunication service - 100% By new establishment Shenzhen Yuhui Management Consulting
Co., Ltd. Shenzhen Shenzhen RMB 250 million Consulting service - 100% Business combination involving
enterprises under common control
Shenzhen S.F. Supply Chain Co., Ltd. Shenzhen Shenzhen RMB 700 million Supply chain management and other
services - 100% By new establishment
SF Airlines Shenzhen Shenzhen RMB 1,500 million Transport service of aviation cargo - 100% Business combination involving
enterprises under common control
Dongguan Jiada Express Service Co., Ltd. Dongguan Dongguan RMB 4 million Cargo express agent service - 100% Business combination involving
enterprises under common control Shenzhen Fengtai E-Commerce Industrial
Park Asset Management Ltd. Shenzhen Shenzhen RMB 4,800 million E-Commerce industrial park asset
management - 100% Business combination involving
enterprises under common control Shenzhen Fengtai E-Commerce Industrial
Park Investment Ltd. Shenzhen Shenzhen RMB 55 million Management consulting - 100% By new establishment Shenzhen S. F. Airport Investment Co.,
Ltd. Shenzhen Shenzhen RMB 100 million Industrial investment - 100% By new establishment
SF Holding Limited Hong Kong Hong Kong HKD 10,000 Investment holding - 100% Business combination involving
enterprises under common control
Group Finance Company
Shenzhen
Shenzhen
RMB 1,000 million Financing, wealth management and
consulting services
-
100% By new establishment

S.F. HOLDING CO., LTD. NOTES TO THE FINANCIAL STATEMENTS FOR THE SIX MONTHS ENDED 30 JUNE 2019 (All amounts in RMB Yuan unless otherwise stated) [English translation for reference only]
239
6 Interests in other entities (Cont'd)
(1) Interests in subsidiaries (Cont'd)
(a) First-tier and second-tier subsidiaries of the Group are as follows (Cont'd):
Shareholding
(%)
Place of
registration Major business
location Registered capital Nature of business Direct Indirect Method of acquisition Shenzhen SF Chuangxing Investment Co., Ltd. Shenzhen Shenzhen RMB 150 million Industrial investment - 100% By new establishment Shenzhen Fengnong Technology Co., Ltd. Shenzhen Shenzhen RMB 5 million Retail - 100% By new establishment
Shenzhen Fenglang Supply Chain Co., Ltd. Shenzhen Shenzhen RMB 30 million Supply chain management
and other services - 100% By new establishment Shenzhen Shunfeng Runtai Management Consulting Co., Ltd. Shenzhen Shenzhen RMB 5 million Consulting service - 100% By new establishment Shunyuan Leasing (Tianjin) Company Limited Tianjin Tianjin RMB 170 million Leasing business - 100% By new establishment SF Multimodal Transport Co., Ltd. Shenzhen Shenzhen RMB 200 million Goods delivery services - 100% By new establishment Shenzhen Zhongpulasi Network Technology Co., Ltd. Shenzhen Shenzhen RMB 20 million Freight forwarding service - 100% By new establishment Shenzhen Shunxi Management Consulting Co., Ltd. Shenzhen Shenzhen RMB 2 million Management consulting - 100% By new establishment S.F. Insurance Broker (Shenzhen) Co., Ltd. Shenzhen Shenzhen RMB 50 million Insurance business - 100% By new establishment Shenzhen S.F. Tongcheng Logistics Co., Ltd. Shenzhen Shenzhen RMB 100 million Freight forwarding service - 100% By new establishment S.F. Duolian Technology Co., Ltd. Dongguan Dongguan RMB 150 million Technology development - 100% By new establishment
Dongguan SF Taisen Enterprise Management Co., Ltd. Dongguan Dongguan RMB 30 million Real estate development and
operation - 100% By new establishment
SF Innovative Technology Co., Ltd. Dongguan Dongguan RMB 50 million Information technology
service - 100% By new establishment
Rongyilian Technology (Shenzhen) Co., Ltd. Shenzhen Shenzhen RMB 50 million R&D, development and sales
of systems - 100% By new establishment
Shunheng Rongfeng Shenzhen Shenzhen RMB 100 million Consulting service - 100%
Business combination involving enterprises under
common control
Hengyi Logistics Shenzhen Shenzhen RMB 100 million Freight forwarding service - 100%
Business combination involving enterprises under
common control
Lefeng Factoring Shenzhen Shenzhen RMB 50 million Factoring - 100%
Business combination involving enterprises under
common control

S.F. HOLDING CO., LTD. NOTES TO THE FINANCIAL STATEMENTS FOR THE SIX MONTHS ENDED 30 JUNE 2019 (All amounts in RMB Yuan unless otherwise stated) [English translation for reference only]
240
6 Interests in other entities (Cont'd)
(1) Interests in subsidiaries (Cont'd)
(a) First-tier and second-tier subsidiaries of the Group are as follows (Cont'd): Shareholding (%)
Place of
registration Major business
location Registered capital Nature of business Direct Indirect Method of acquisition
Hangzhou SF Intra-city Industrial Co., Ltd. Hangzhou Hangzhou RMB 160 million Supply chain management
and other services - 92.50% By new establishment
Shanghai Haosiju Supply Chain Management Co., Ltd. Shanghai Shanghai RMB 20 million Supply chain management
and other services - 100% By new establishment
SF Intra-city Holdings Limited Hangzhou Hangzhou RMB 425 million Supply chain management
and other services - 96.47% By new establishment Shenzhen SF Express Zhongyuan Network Technology
Co., Ltd. Shenzhen Shenzhen RMB 10 million Technology development
and consulting services - 100% By new establishment SF Sharing Precision Information Technology (Shenzhen)
Co., Ltd. Shenzhen Shenzhen RMB 30 million Information technology
service - 100% By new establishment
Shanghai Fengpaida Supply Chain Co., Ltd. Shanghai Shanghai RMB 20 million
Supply chain management and other
services - 100% By new establishment
Hangzhou Shuangjie Supply Chain Co., Ltd. Hangzhou Hangzhou RMB 50 million
Supply chain management and other
services - 100% By new establishment
Shenzhen SF Express Co., Ltd. Shenzhen Shenzhen RMB 50 million
Domestic and international freight forwarding services - 100% By new establishment

S.F. HOLDING CO., LTD. NOTES TO THE FINANCIAL STATEMENTS FOR THE SIX MONTHS ENDED 30 JUNE 2019 (All amounts in RMB Yuan unless otherwise stated) [English translation for reference only]
241
6 Interests in other entities (Cont'd)
(1) Interests in subsidiaries (Cont'd)
(b) Subsidiaries in which the Group has significant minority interests
As at 30 June 2019, minority interests of the Group's subsidiaries had no significant influence on the Group.
(2) Interests in joint ventures and associates
(a) The Group’s associates have no significant influence on the Group and are summarised as follows: Ending balance/
Amount in the current period
Opening balance/ Amount in the prior
period Aggregated carrying amount of investments
(Note 4(13)(b)) 940,031,915.72 905,086,455.64 Aggregation of the following items in
proportion: Net loss (43,797,771.14) (46,275,641.77) Other comprehensive income (1,956,923.83) (40,122.08) Total comprehensive income (45,754,694.97) (46,315,763.85)
As at 30 June 2019, an unrecognised investment loss amounted to RMB 4,895,575.74 (for the six months ended 30 June 2018: RMB 13,429,763.49) in the financial statements for the current period because the carrying amount of long-term equity investments in investees was written down to RMB 0.
(b) The Group’s joint ventures have no significant influence on the Group and are summarised as follows: Ending balance/
Amount in the current period
Opening balance/ Amount in the prior
period Aggregated carrying amount of investments
(Note 4(13)(a)) 1,310,815,044.54 1,298,344,666.39 Aggregation of the following items in
proportion:
Net (loss)/profit (7,187,638.39) 8,955,723.70 Other comprehensive income 842,393.75 1,422,854.91 Total comprehensive income (6,345,244.64) 10,378,578.61

S.F. HOLDING CO., LTD. NOTES TO THE FINANCIAL STATEMENTS FOR THE SIX MONTHS ENDED 30 JUNE 2019 (All amounts in RMB Yuan unless otherwise stated) [English translation for reference only]
242
7 Segment information
The segment information is not presented any more since the Group mainly provides express & logistics service and there is only one major business segment.
8 Related parties and related party transactions
(1) General information of the controlling shareholder and subsidiaries The general information and other related information of the subsidiaries are set out in Note 6(1).
(a) General information of the controlling shareholder Place of registration Nature of business Mingde Holdings Shenzhen Investment The Company’s ultimate holding company is Mingde Holdings, and the ultimate controlling person is Wang Wei.
(b) The balances and changes of registered capital of the controlling shareholder 31 December
2018 Increase in the
current period Decrease in the
current period
30 June 2019 Mingde Holdings 113,405,734.21 - - 113,405,734.21
(c) The percentages of shareholding and voting rights in the Company held by the parent company 30 June 2019 31 December 2018
Shareholding
(%) Voting rights
(%) Shareholding
(%) Voting rights
(%) Mingde Holdings 61.20% 61.20% 61.15% 61.15%

S.F. HOLDING CO., LTD. NOTES TO THE FINANCIAL STATEMENTS FOR THE SIX MONTHS ENDED 30 JUNE 2019 (All amounts in RMB Yuan unless otherwise stated) [English translation for reference only]
243
8 Related parties and related party transactions (Cont’d)
(2) Nature of related parties that do not control/are not controlled by the Company
Major related parties are listed as follows:
Relationship with the Company in the reporting
period
Juneyao Airlines Co., Ltd. Note 1 Significantly influenced by the key management of
the Company before June 2017
Shenzhen Henglu Logistics Co., Ltd. Significantly influenced by the key management of
the Company before September 2018 Ping An Insurance (Group) Company of China, Ltd.
(“Ping An Insurance”) and its subsidiaries Significantly influenced by the key management of
the Company China Pacific Insurance (Group) Co., Ltd. (“Pacific
Insurance”) and its subsidiaries Significantly influenced by the key management of
the Company
McDonald’s and its subsidiaries Significantly influenced by the key management of
the Company
Shenzhen Qianhai Webank Co., Ltd. Significantly influenced by the key management of
the Company CITIC Securities Co., Ltd. (“CITIC Securities”) and its
subsidiaries Note 2 Significantly influenced by the key management of
the Company Shenghai Information The Group’s joint venture POST11OÜ The Group’s joint venture ZBHA and its subsidiaries The Group’s joint venture CR-SF International Express Co., Ltd.Note 3 The Group’s joint venture Wenzhou Fengbaoke Technology Co., Ltd.Note 3 The Group’s joint venture Zhongyunda Aviation Ground Services Co., Ltd. The Group’s joint venture Geling Information and its subsidiaries The Group’s joint venture Global Connect Holding Limited The Group’s joint venture Wulian Shuntong and its subsidiaries Note 3 The Group’s joint venture Beijing Shunhe Tongxin Technology Co., Ltd. The Group’s joint venture Shenzhen Shun Jie Feng Da Express Co., Ltd. The Group’s associate SF Lottery The Group’s associate Little Red Hat and its subsidiaries The Group’s associate Hubei Jiuzhou Tongda Technology Development Co.,
Ltd. The Group’s associate Shenzhen Zhihang UAV Co., Ltd. The Group’s associate Xi'an Huahan Airline Passenger and Cargo Service
Co., Ltd.Note 3 The Group’s associate Qingdao Dakai Cargo Agency Co., Ltd.Note 3 The Group’s associate Beijing Dazhangfang and its subsidiaries Note 3 The Group’s associate Canbeidou Supply Chain and its subsidiaries Note 3 The Group’s associate Chongqing Boqiang Logistics Co., Ltd. Note 3 The Group’s associate Kin Shun Information Technology Co., Ltd. Note 4 The Group’s associate Shanghai Qianqu Network Technology Co., Ltd.
(“Qianqu Network”) and its subsidiaries The Group’s associate
Fengyi Technology Note 5 Controlled by the ultimate controlling person of the
Company
S. F. Holding (Group) Commerce Co., Ltd. Note 6 Controlled by the ultimate controlling person of the
Company

S.F. HOLDING CO., LTD. NOTES TO THE FINANCIAL STATEMENTS FOR THE SIX MONTHS ENDED 30 JUNE 2019 (All amounts in RMB Yuan unless otherwise stated) [English translation for reference only]
244
8 Related parties and related party transactions (Cont’d)
(2) Nature of related parties that do not control or are not controlled by the Company (Cont'd)
Relationship with the Company in the reporting period Zhuhai Shunxiaofeng Commercial Co.,
Ltd.Note 6 Controlled by the ultimate controlling person of the Company Zhongshan Shunxiaofeng Commerce Co.,
Ltd.Note 6 Controlled by the ultimate controlling person of the Company Huizhou S.F. Commercial Co., Ltd.Note 6 Controlled by the ultimate controlling person of the Company Heyuan S.F. Commercial Co., Ltd.Note 6 Controlled by the ultimate controlling person of the Company Changzhou Shunxiaofeng Commerce Co.,
Ltd.Note 6 Controlled by the ultimate controlling person of the Company Shantou S.F. Commercial Co., Ltd.Note 6 Controlled by the ultimate controlling person of the Company Jiangmen Shunyifeng Commercial Co.,
Ltd.Note 6 Controlled by the ultimate controlling person of the Company Jiangsu Shunxiaofeng Commerce Co.,
Ltd.Note 6 Controlled by the ultimate controlling person of the Company Suzhou Industrial Park Shunhengshun
Commerce Co., Ltd.Note 6 Controlled by the ultimate controlling person of the Company Lianyungang Shunxiaofeng Commerce Co.,
Ltd.Note 6 Controlled by the ultimate controlling person of the Company Zhenjiang S.F. Commerce Co., Ltd.Note 6 Controlled by the ultimate controlling person of the Company Xuzhou Shunxiaofeng Commerce Co.,
Ltd.Note 6 Controlled by the ultimate controlling person of the Company Suqian Shunxiaofeng Commerce Co.,
Ltd.Note 6 Controlled by the ultimate controlling person of the Company Huai'an Shunxiaofeng Commerce Co.,
Ltd.Note 6 Controlled by the ultimate controlling person of the Company Yangzhou Shunheng Commerce Co.,
Ltd.Note 6 Controlled by the ultimate controlling person of the Company Taizhou Shunjiefeng Commerce Co., Ltd.Note 6 Controlled by the ultimate controlling person of the Company Qinghai Shunxiaofeng Commerce Co.,
Ltd.Note 6 Controlled by the ultimate controlling person of the Company Wuxi Shunfengshun Commerce Co., Ltd.Note 6 Controlled by the ultimate controlling person of the Company Yancheng Shunxiaofeng Commerce Co.,
Ltd.Note 6 Controlled by the ultimate controlling person of the Company Zhejiang S.F. Commerce Co., Ltd.Note 6 Controlled by the ultimate controlling person of the Company Wenzhou S.F. Commercial Co., Ltd.Note 6 Controlled by the ultimate controlling person of the Company Taizhou Shunxiaofeng Commerce Co.,
Ltd.Note 6 Controlled by the ultimate controlling person of the Company Shaoxing Shunxiaofeng Commerce Co.,
Ltd.Note 6 Controlled by the ultimate controlling person of the Company Ningbo Shunxiaofeng Commerce Co.,
Ltd.Note 6 Controlled by the ultimate controlling person of the Company Huzhou Shun Xiao Commerce Co., Ltd.Note 6 Controlled by the ultimate controlling person of the Company Jiaxing Shun Xiao Commerce Co., Ltd.Note 6 Controlled by the ultimate controlling person of the Company Jinhua S.F. Commercial Co., Ltd.Note 6 Controlled by the ultimate controlling person of the Company Shenzhen Shunshang Investment Co.,
Ltd.Note 6 Controlled by the ultimate controlling person of the Company Shenzhen S.F. Commerce Co., Ltd.Note 6 Controlled by the ultimate controlling person of the Company Foshan Shunxiaofeng Commerce Co.,
Ltd.Note 6 Controlled by the ultimate controlling person of the Company

S.F. HOLDING CO., LTD. NOTES TO THE FINANCIAL STATEMENTS FOR THE SIX MONTHS ENDED 30 JUNE 2019 (All amounts in RMB Yuan unless otherwise stated) [English translation for reference only]
245
8 Related parties and related party transactions (Cont’d)
(2) Nature of related parties that do not control/are not controlled by the Company (Cont’d)
Relationship with the Company in the reporting period Quzhou Shunyifeng Commerce Co., Ltd.Note 6 Controlled by the ultimate controlling person of the Company Liaoning Shunyifeng Commercial Co., Ltd.
Note 6 Controlled by the ultimate controlling person of the Company Dalian Shunyifeng Commerce Co., Ltd.Note 6 Controlled by the ultimate controlling person of the Company Shandong Shunxiaofeng Commerce Co., Ltd.
Note 6 Controlled by the ultimate controlling person of the Company Qingdao Shunyifeng Commercial Co., Ltd.
Note 6 Controlled by the ultimate controlling person of the Company Beijing Shunxiaofeng Commercial Co., Ltd.
Note 6 Controlled by the ultimate controlling person of the Company Shanghai S.F. Industrial Co., Ltd. Note 6 Controlled by the ultimate controlling person of the Company Xiamen S.F. Commerce Co., Ltd. Note 6 Controlled by the ultimate controlling person of the Company Chongqing Shunxiaofeng Commerce Co.,
Ltd. Note 6 Controlled by the ultimate controlling person of the Company Jiangxi Shunxiaofeng Commerce Co., Ltd.
Note 6 Controlled by the ultimate controlling person of the Company Tianjin Shunfengshun Commerce Co., Ltd.Note
6 Controlled by the ultimate controlling person of the Company Inner Mongolia S.F. Commerce Co., Ltd. Note 6 Controlled by the ultimate controlling person of the Company Shanxi Shunxiaofeng Commerce Co., Ltd.Note
6 Controlled by the ultimate controlling person of the Company Jilin S.F. Commerce Co., Ltd. Note 6 Controlled by the ultimate controlling person of the Company Guangxi Shunyifeng Commerce Co., Ltd.Note 6 Controlled by the ultimate controlling person of the Company Hainan S.F. Commercial Co., Ltd. Note 6 Controlled by the ultimate controlling person of the Company Shaanxi Shunyifeng Commerce Co., Ltd. Note 6 Controlled by the ultimate controlling person of the Company Hunan Shunyifeng Commercial Co., Ltd. Note 6 Controlled by the ultimate controlling person of the Company Hubei Shunyifeng Commercial Co., Ltd. Note 6 Controlled by the ultimate controlling person of the Company Anhui Shunxiaofeng Commerce Co., Ltd. Note
6 Controlled by the ultimate controlling person of the Company Henan Shunyifeng Commerce Co., Ltd. Note 6 Controlled by the ultimate controlling person of the Company Gansu S.F. Commercial Co., Ltd. Note 6 Controlled by the ultimate controlling person of the Company Hebei Shunxiaofeng Commerce Co., Ltd. Note
6 Controlled by the ultimate controlling person of the Company Fujian Shunyifeng Commercial Co., Ltd. Note 6 Controlled by the ultimate controlling person of the Company Sichuan Shunyifeng Commerce Co., Ltd. Note 6 Controlled by the ultimate controlling person of the Company Heilongjiang Shunyifeng Commerce Co., Ltd.
Note 6 Controlled by the ultimate controlling person of the Company Dongguan Shunxiaofeng Commerce Co., Ltd.
Note 6 Controlled by the ultimate controlling person of the Company Zhaoqing Shunyifeng Commerce Co., Ltd. Note
6 Controlled by the ultimate controlling person of the Company Dongguan S.F. Commercial Co., Ltd. Note 6 Controlled by the ultimate controlling person of the Company Shenzhen S.F. Electronic Commerce Co.,
Ltd. Note 6 Controlled by the ultimate controlling person of the Company Beijing S.F. E-commerce Co., Ltd. Note 6 Controlled by the ultimate controlling person of the Company S. F. You Xuan International Co., Ltd. Note 6 Controlled by the ultimate controlling person of the Company

S.F. HOLDING CO., LTD. NOTES TO THE FINANCIAL STATEMENTS FOR THE SIX MONTHS ENDED 30 JUNE 2019 (All amounts in RMB Yuan unless otherwise stated) [English translation for reference only]
246
8 Related parties and related party transactions (Cont’d)
(2) Nature of related parties that do not control/are not controlled by the Company (Cont’d)
Relationship with the Company in the reporting period
Fengchengda Network Technology Co., Ltd. Controlled by the ultimate controlling person of the
Company
Shenzhen S.F. Hefeng Microfinance Co., Ltd. Controlled by the ultimate controlling person of the
Company
Shenzhen Mingde Fengtai Investment Co., Ltd. Controlled by the ultimate controlling person of the
Company Hive Box Technology Held by the ultimate holding company
Zhiye Enterprise Co., Ltd. Significantly influenced by close family members of the
ultimate controlling person.
SF Charity Foundation
Organisation sponsored by controlling shareholders and the Company’s subsidiaries, in which director and supervisor of the company serve on the Board of
Management Suzhou Ruihuang Equity Investment Management
Limited Partnership Another company in which a director of the Group acts
as managing partner Note 1: Other companies on which key management personnel of the Company had significant influence
before 30 June 2017. Pursuant to the Listing Rules of Shenzhen Stock Exchange, Juneyao Airlines Co., Ltd. was no longer a related party of the Group since 30 June 2018. The related party transactions with Juneyao Airlines Co., Ltd. disclosed in the financial statements refer to the transaction volumes for the period from January to June 2018.
Note 2: CITIC Securities and its subsidiaries became related parties of the Group in may 2019, the related
transactions disclosed in the financial statement represents transactions from May to June 2019, and it's transactions with the Group during the period from January to June 2018 are presented as “Not applicable”.
Note 3: These companies became related parties of the Group in the period from July to December 2018,
so their transactions with the Group during the period from January to June 2018 are presented as “Not applicable”.
Note 4: The company is a new associate of the Group for the reporting period. The related party transactions disclosed in the financial statements refer to the ones made in the period from January to June 2019, so their transactions with the Group during the period from January to June 2018 are presented as “Not applicable”.
Note 5: The company used to be a subsidiary of the Group. As described in Note 5(3), the Group lost actual
control over Fengyi Technology since 1 June 2019 and stopped including it in the scope of consolidation. The related party transactions with Fengyi Technology disclosed in the financial statements represents the transation made in June 2019, so its transactions with the Group during the period from January to June 2018 are presented as “Not applicable”.
Note 6: They are subsidiaries of S. F. Holding (Group) Commerce Co., Ltd..S. F. Holding (Group) Commerce
Co., Ltd. and its subsidiaries are hereinafter referred to as “Commerce Holding and its subsidiaries”.

S.F. HOLDING CO., LTD. NOTES TO THE FINANCIAL STATEMENTS FOR THE SIX MONTHS ENDED 30 JUNE 2019 (All amounts in RMB Yuan unless otherwise stated) [English translation for reference only]
247
8 Related parties and related party transactions (Cont’d)
(3) Related party transactions
(a) Pricing policies
The pricing method of transactions and transaction price between the Group and related parties are determined, following arm's length principle, by making reference to the market price or through negotiation between both parties.
(b) Income from courier service, combined transport and freight forwarding services For the six months ended 30 June 2019 2018 McDonald’s and its subsidiaries 552,358,228.73 102,481,373.75 Commerce Holding and its subsidiaries 56,252,063.81 56,375,336.54 Ping An Insurance and its subsidiaries 49,226,861.66 38,999,609.26 Zhongyunda Aviation Ground Services Co.,
Ltd.
18,742,561.01
-
Pacific Insurance and its subsidiaries 12,548,160.80 9,151,322.54 Fengchengda Network Technology Co., Ltd. 3,530,601.86 6,145,205.76 Fengyi Technology 1,573,912.41 Not applicable CITIC Securities and its subsidiaries 1,358,208.06 Not applicable Shenzhen Henglu Logistics Co., Ltd. 1,076,516.85 725,251.59 Geling Information and its subsidiaries - 2,304,109.62 Others 2,281,523.70 2,692,606.58 698,948,638.89 218,874,815.64
(c) Communication income For the six months ended 30 June 2019 2018 Hive Box Technology 12,407,113.50 13,788,232.03 Others 645,461.54 565,644.90
13,052,575.04 14,353,876.93
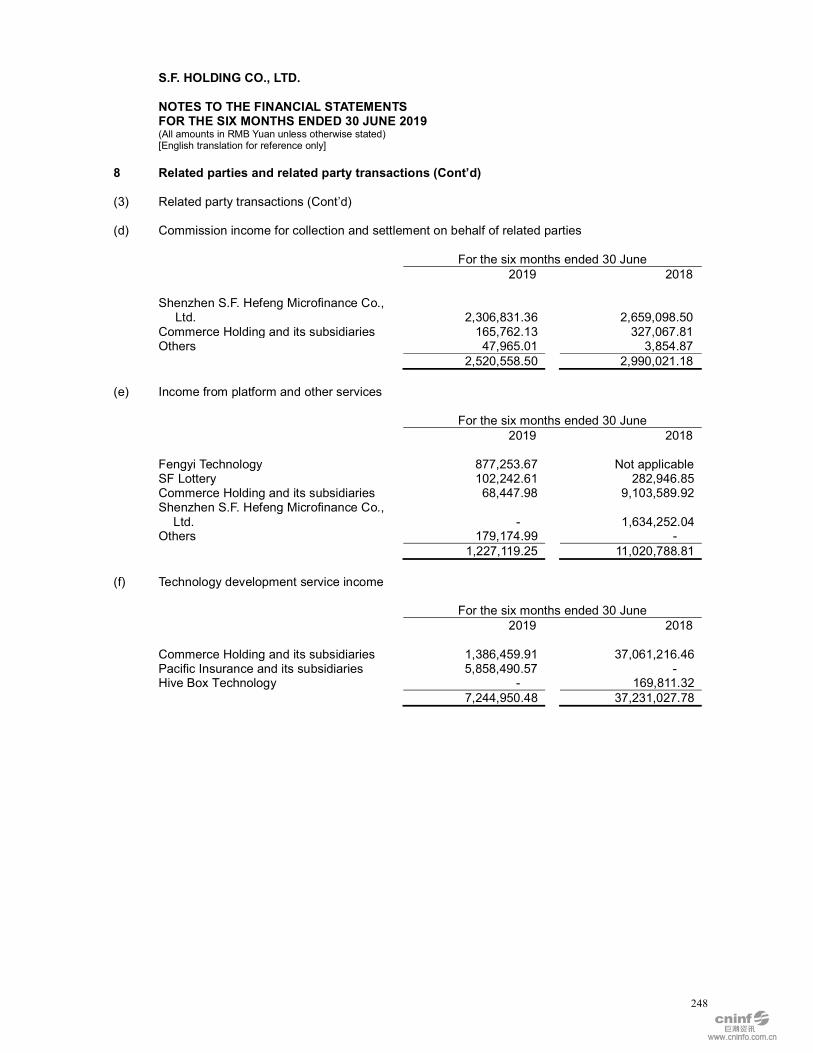
S.F. HOLDING CO., LTD. NOTES TO THE FINANCIAL STATEMENTS FOR THE SIX MONTHS ENDED 30 JUNE 2019 (All amounts in RMB Yuan unless otherwise stated) [English translation for reference only]
248
8 Related parties and related party transactions (Cont’d)
(3) Related party transactions (Cont’d)
(d) Commission income for collection and settlement on behalf of related parties
For the six months ended 30 June 2019 2018 Shenzhen S.F. Hefeng Microfinance Co.,
Ltd. 2,306,831.36 2,659,098.50 Commerce Holding and its subsidiaries 165,762.13 327,067.81 Others 47,965.01 3,854.87
2,520,558.50 2,990,021.18
(e) Income from platform and other services For the six months ended 30 June 2019 2018 Fengyi Technology 877,253.67 Not applicable SF Lottery 102,242.61 282,946.85 Commerce Holding and its subsidiaries 68,447.98 9,103,589.92 Shenzhen S.F. Hefeng Microfinance Co.,
Ltd. - 1,634,252.04 Others 179,174.99 -
1,227,119.25 11,020,788.81
(f) Technology development service income For the six months ended 30 June 2019 2018 Commerce Holding and its subsidiaries 1,386,459.91 37,061,216.46 Pacific Insurance and its subsidiaries 5,858,490.57 - Hive Box Technology - 169,811.32 7,244,950.48 37,231,027.78

S.F. HOLDING CO., LTD. NOTES TO THE FINANCIAL STATEMENTS FOR THE SIX MONTHS ENDED 30 JUNE 2019 (All amounts in RMB Yuan unless otherwise stated) [English translation for reference only]
249
8 Related parties and related party transactions (Cont’d)
(3) Related party transactions (Cont’d)
(g) Revenue from rent and property management
For the six months ended 30 June 2019 2018
Commerce Holding and its subsidiaries 531,933.13 230,658.63 Others 945,000.14 38,043.71
1,476,933.27 268,702.34
(h) Interest income
For the six months ended 30 June 2019 2018
Mingde Holdings - 2,070,126.30
(i) Sales of equity For the six months ended 30 June 2019 2018 Mingde Holdings 135,000,000.00 -
The Group transferred its 67.50% equity interest in Fengyi Technology to Mingde Holdings on 31
May 2019, and the income from sales of equity of RMB 216,691,565.20 was recognised (Note 5(3)).
(j) Purchase of equity For the six months ended 30 June 2019 2018 Shenzhen Mingde Fengtai Investment
Co., Ltd. - 67,042,100.00

S.F. HOLDING CO., LTD. NOTES TO THE FINANCIAL STATEMENTS FOR THE SIX MONTHS ENDED 30 JUNE 2019 (All amounts in RMB Yuan unless otherwise stated) [English translation for reference only]
250
8 Related parties and related party transactions (Cont’d)
(3) Related party transactions (Cont’d)
(k) Combined transport and freight forwarding expenses
For the six months ended 30 June 2019 2018 CR-SF International Express Co., Ltd. 80,777,966.02 Not applicable Shenzhen Shun Jie Feng Da Express Co.,
Ltd.
65,885,668.41 94,210,538.42 POST11OÜ 33,923,159.79 48,553,701.67 Zhongyunda Aviation Ground Services Co.,
Ltd. 11,072,794.55 - Kin Shun Information Technology Co., Ltd. 11,335,714.80 Not applicable Qingdao Dakai Cargo Agency Co., Ltd. 11,254,210.89 Not applicable Xi'an Huahan Airline Passenger and Cargo
Service Co., Ltd.
9,021,788.33 Not applicable Juneyao Airlines Co., Ltd. Not applicable 25,416,371.26 Little Red Hat and its subsidiaries 5,582,879.06 3,330,010.85 Wulian Shuntong and its subsidiaries 4,582,295.35 Not applicable Chongqing Boqiang Logistics Co., Ltd. 6,467,064.68 Not applicable Others - 316,786.48 239,903,541.88 171,827,408.68
(l) Express delivery agent and other service fees
For the six months ended 30 June 2019 2018
Hive Box Technology 10,158,052.14 1,490,566.23 Commerce Holding and its subsidiaries 2,595,990.29 4,604,362.86 Global Connect Holding Limited 510,519.23 - Others 330,530.72 429,333.33
13,595,092.38 6,524,262.42
(m) Interest expenses
For the six months ended 30 June 2019 2018
Mingde Holdings - 4,491,859.93

S.F. HOLDING CO., LTD. NOTES TO THE FINANCIAL STATEMENTS FOR THE SIX MONTHS ENDED 30 JUNE 2019 (All amounts in RMB Yuan unless otherwise stated) [English translation for reference only]
251
8 Related parties and related party transactions (Cont’d)
(3) Related party transactions (Cont’d)
(n) Collection commissions fee
For the six months ended 30 June 2019 2018
Hive Box Technology 38,292,379.47 24,193,805.30
(o) Security service fee
For the six months ended 30 June 2019 2018
ZBHA and its subsidiaries 57,702,536.53 2,283,057.50
(p) Rent and property management fees For the six months ended 30 June 2019 2018 Shenghai Information 9,266,275.07 6,791,744.03 Canbeidou Supply Chain and its
subsidiaries 1,699,556.69 Not applicable Zhiye Enterprise Co., Ltd. 155,909.70 163,514.20 11,121,741.46 6,955,258.23
(q) Management fee
For the six months ended 30 June
2019 2018
Suzhou Ruihuang Equity Investment Management Limited Partnership 5,000,000.00 5,000,000.00
(r) Technology development and operation & maintenance service fee
For the six months ended 30 June 2019 2018
Shenghai Information 14,216,580.06 5,961,166.33 Beijing Shunhe Tongxin Technology Co., Ltd. 1,328,216.32 - Shenzhen Zhihang UAV Co., Ltd. 342,676.74 - 15,887,473.12 5,961,166.33

S.F. HOLDING CO., LTD. NOTES TO THE FINANCIAL STATEMENTS FOR THE SIX MONTHS ENDED 30 JUNE 2019 (All amounts in RMB Yuan unless otherwise stated) [English translation for reference only]
252
8 Related parties and related party transactions (Cont’d)
(3) Related party transactions (Cont’d)
(s) Promotion fee
For the six months ended 30 June 2019 2018
Commerce Holding and its subsidiaries 5,138,819.77 7,272,898.58 Others 416,405.02 - 5,555,224.79 7,272,898.58
(t) Guarantee received
For the six months ended 30 June 2019 2018
Mingde Holdings - 200,000,000.00
(u) Purchase of materials
For the six months ended 30 June 2019 2018
Hubei Jiuzhou Tongda Technology Development Co., Ltd. 92,406,868.08 -
Commerce Holding and its subsidiaries 41,772,747.36 29,429,604.52 Wenzhou Fengbaoke Technology Co., Ltd. 6,823,613.26 Not applicable Shenghai Information 579,897.05 1,111,729.29 Others 73,636.83 - 141,656,762.58 30,541,333.81

S.F. HOLDING CO., LTD. NOTES TO THE FINANCIAL STATEMENTS FOR THE SIX MONTHS ENDED 30 JUNE 2019 (All amounts in RMB Yuan unless otherwise stated) [English translation for reference only]
253
8 Related parties and related party transactions (Cont’d)
(3) Related party transactions (Cont’d)
(v) Insurance premium
For the six months ended 30 June 2019 2018
Pacific Insurance and its subsidiaries 45,062,064.16 50,963,129.09 Ping An Insurance and its subsidiaries 2,111,341.83 - 47,173,405.99 50,963,129.09 Insurance premium represents the amount amortised over the benefit period of insurance policies.
(w) Donation expenses
For the six months ended 30 June 2019 2018
SF Charity Foundation 1,000,000.00 40,000,000.00
(x) Remuneration of key management
For the six months ended 30 June 2019 2018
Remuneration of key management 34,260,000.00 23,545,200.00

S.F. HOLDING CO., LTD. NOTES TO THE FINANCIAL STATEMENTS FOR THE SIX MONTHS ENDED 30 JUNE 2019 (All amounts in RMB Yuan unless otherwise stated) [English translation for reference only]
254
8 Related parties and related party transactions (Cont’d)
(4) Receivables from and payables to related parties
(a) Accounts receivable
30 June 2019 31 December 2018 McDonald’s and its subsidiaries 171,219,373.24 116,441,890.28 Commerce Holding and its subsidiaries 80,932,229.81 37,514,388.15 Qianqu Network and its subsidiaries(i) 13,255,247.18 13,261,064.53 Fengyi Technology 11,028,575.09 Not applicable Ping An Insurance and its subsidiaries 9,303,707.08 9,671,474.65 Zhongyunda Aviation Ground Services Co.,
Ltd. 8,575,329.03 6,816.00 Pacific Insurance and its subsidiaries 4,322,422.97 3,166,845.54 Geling Information and its subsidiaries 1,505,899.40 1,962,406.40 Fengchengda Network Technology Co., Ltd. 1,394,526.30 1,317,672.78 Shenzhen S.F. Hefeng Microfinance Co.,
Ltd. 860,781.46 3,385,444.13 Hive Box Technology 124,718.85 97,084.00 POST11OÜ - 598,526.15 Others 838,592.35 673,924.86
303,361,402.76 188,097,537.47
(i) The Group has made full provision for bad debts of accounts receivable of RMB 13,255,247.18 from Qianqu Network and its subsidiaries.
(b) Advances to suppliers 30 June 2019 31 December 2018 Pacific Insurance and its subsidiaries 12,786,790.55 20,150,437.55 CR-SF International Express Co., Ltd. 12,715,576.00 - Hive Box Technology 7,639,995.81 6,158,027.66 Ping An Insurance and its subsidiaries 1,127,200.44 1,927,651.63 Commerce Holding and its subsidiaries 504,847.48 2,712,227.05 Others 517,801.71 289,068.36
35,292,211.99 31,237,412.25

S.F. HOLDING CO., LTD. NOTES TO THE FINANCIAL STATEMENTS FOR THE SIX MONTHS ENDED 30 JUNE 2019 (All amounts in RMB Yuan unless otherwise stated) [English translation for reference only]
255
8 Related parties and related party transactions (Cont’d)
(4) Receivables from and payables to related parties (Cont’d)
(c) Other receivables
30 June 2019 31 December 2018 Hive Box Technology 189,018,739.98 125,183,355.20 McDonald’s and its subsidiaries 54,008,413.33 53,253,508.22 Beijing Dazhangfang and its subsidiaries 35,000,000.00 - Commerce Holding and its subsidiaries 8,094,310.54 9,323,931.18 Ping An Insurance and its subsidiaries 5,012,054.31 30,070.00 Shenzhen S.F. Hefeng Microfinance Co.,
Ltd.
753,606.03
-
Pacific Insurance and its subsidiaries 64,067.65 86,000.53 Others 967,808.73 496,081.17
292,919,000.57 188,372,946.30
(d) Other non-current assets
30 June 2019 31 December 2018
Hubei Jiuzhou Tongda Technology
Development Co., Ltd. - 52,158,000.00

S.F. HOLDING CO., LTD. NOTES TO THE FINANCIAL STATEMENTS FOR THE SIX MONTHS ENDED 30 JUNE 2019 (All amounts in RMB Yuan unless otherwise stated) [English translation for reference only]
256
8 Related parties and related party transactions (Cont’d)
(4) Receivables from and payables to related parties (Cont’d)
(e) Accounts payable
30 June 2019 31 December 2018
CR-SF International Express Co., Ltd. 43,587,022.65 10,109,885.26 Shenzhen Shun Jie Feng Da Express Co.,
Ltd. 20,327,676.11 7,112,807.99 POST11OÜ 13,952,739.48 24,146,862.13 Commerce Holding and its subsidiaries 12,311,158.70 15,672,110.75 Pacific Insurance and its subsidiaries 10,640,519.21 11,040,965.27 Shenghai Information 8,533,544.29 999,252.61 ZBHA and its subsidiaries 7,817,225.25 7,953,612.69 Zhongyunda Aviation Ground Services Co.,
Ltd. 5,704,009.43 1,561,827.81 Fengyi Technology 4,131,467.19 Not applicable Wulian Shuntong and its subsidiaries 3,737,623.15 - Shenzhen S.F. Hefeng Microfinance Co.,
Ltd. 2,377,056.73 2,431,348.44 Kin Shun Information Technology Co., Ltd. 2,071,625.37 Not applicable Wenzhou Fengbaoke Technology Co., Ltd. 509,946.79 15,362,813.16 Hive Box Technology 87,181.09 1,310,413.21 Little Red Hat and its subsidiaries - 858,030.61 Global Connect Holding Limited - 791,240.39 Others 188,007.55 1,964,972.12 135,976,802.99 101,316,142.44
(f) Advances from customers 30 June 2019 31 December 2018
McDonald’s and its subsidiaries 25,198,960.06 14,397,015.09 Commerce Holding and its subsidiaries 3,885,472.04 4,340,938.92 Ping An Insurance and its subsidiaries 973,044.49 1,147,918.49 Fengyi Technology 632,782.63 Not applicable Shenzhen Qianhai Webank Co., Ltd. 20,743.70 1,229,168.70 Others 811,071.93 433,683.68
31,522,074.85 21,548,724.88

S.F. HOLDING CO., LTD. NOTES TO THE FINANCIAL STATEMENTS FOR THE SIX MONTHS ENDED 30 JUNE 2019 (All amounts in RMB Yuan unless otherwise stated) [English translation for reference only]
257
8 Related parties and related party transactions (Cont’d)
(4) Receivables from and payables to related parties (Cont’d)
(g) Other payables
30 June 2019 31 December 2018 Beijing Dazhangfang and its subsidiaries 33,537,651.04 - McDonald’s and its subsidiaries 8,946,418.64 12,778,631.48 Suzhou Ruihuang Equity Investment
Management Limited Partnership 5,000,000.00 - Hubei Jiuzhou Tongda Technology
Development Co., Ltd. 1,770,685.84 683,500.00 Shenzhen S.F. Hefeng Microfinance Co.,
Ltd. 1,453,384.21 - Hive Box Technology 1,275,125.00 - Commerce Holding and its subsidiaries 1,165,233.11 1,234,103.14 Qianqu Network and its subsidiaries 897,104.92 897,104.92 Fengyi Technology 661,686.73 Not applicable Pacific Insurance and its subsidiaries 485,951.24 1,271,899.21 Shenghai Information 205,858.62 2,879,887.34 Others 522,080.11 348,968.18 55,921,179.46 20,094,094.27
9 Share-based payment
(1) Overview of share-based payment 30 June 2019 Total restricted shares granted at the beginning of the period 7,751,734.00 Add: Total restricted shares granted during the period - Less: Total restricted shares unlocked during the period (1,113,173.00)
Total restricted shares forfeited during the period (4,181,993.00) Total restricted shares granted at the end of the period 2,456,568.00
The exercise price of outstanding restricted shares at the end of the period
and residual life of the restricted shares contracts Refer to Note 9(2) Expenses recognised for the period arising from share-based payment were as follows: For the six months ended 30 June 2019 2018 Equity-settled share-based payment 15,597,712.81 23,930,346.08 Cash-settled share-based payment 17,652,804.63 423,976.70 33,250,517.44 24,354,322.78

S.F. HOLDING CO., LTD. NOTES TO THE FINANCIAL STATEMENTS FOR THE SIX MONTHS ENDED 30 JUNE 2019 (All amounts in RMB Yuan unless otherwise stated) [English translation for reference only]
258
9 Share-based payment(Cont’d)
(2) Information on equity-settled share-based payment
(a) Information on equity-settled share-based payment of the Company
As at 30 November 2017, the Company held the 4th interim shareholders’ meeting in 2017, at which the proposal of the Restricted Shares Incentive Plan (Draft) and Summary for 2017 was approved. Authorised by the 4th interim shareholders’ meeting in 2017, the Company held the 11th meeting of the 4th Board of Directors on 27 December 2017, at which the Proposal of Granting Restricted Shares to Incentive Recipients was approved. The restricted shares were granted on 27 December 2017 and entitled the holders to purchase restricted shares at a price of RMB 29.32 per share, which was 50% of RMB 58.63, the average share price on the prior trading day (total transaction amount on the prior trading day / total transaction volume on the prior trading day) before the Restricted Shares Incentive Plan (Draft) of S.F. Holding Co., Ltd. for 2017 was released. The Company’s Board of Directors was authorised to grant 802 qualified employees restricted ordinary A shares with a total number of 2,705,400 shares at a consideration of RMB 29.32 per share, accounting for about 0.06% of S.F. Holding’s total shares, which totalled 4,411,015,500 shares upon announcement of the incentive plan. As at 17 May 2018, the Company held the 2nd interim shareholders’ meeting in 2018, at which the proposal of the Restricted Shares Incentive Plan (Draft) and Summary for 2018 was approved. Authorised by the 2nd interim shareholders’ meeting in 2018, the Company held the 15th meeting of the 4th Board of Directors on 13 June 2018, at which the Proposal of Granting Restricted Shares to Incentive Recipients for 2018 was approved. The restricted shares were granted on 13 June 2018 and entitled the holders to purchase restricted shares at a price of RMB 24.33 per share, which was 50% of RMB 48.65, the average share price on the prior 20 trading days (total transaction amount on the prior 20 trading days / total transaction volume on the prior 20 trading days) before the Restricted Shares Incentive Plan (Draft) of S.F. Holding Co., Ltd. for 2018 was released. The Group’s Board of Directors was authorised to grant 1,181 qualified employees restricted ordinary A shares with a total number of 5,421,881 shares at a consideration of RMB 24.33 per share, accounting for about 0.12% of the Company’s total shares, which totalled 4,413,572,200 shares upon announcement of the incentive plan. The post lock-up periods and their schedules for the restricted shares for 2017 and 2018 are presented in the table below:
Post lock-up period Timing
Proportion of shares
exercisable
1st post lock-up period
From the first trading day after 12 months since the registration of granting to the last trading day within 24 months after the registration of granting 50%
2nd post lock-up period
From the first trading day after 24 months since the registration of granting to the last trading day within 36 months after the registration of granting 50%
In addition to the Company’s performance, individual performance assessment, which is specified in the Restricted Shares Incentive Plan, has also to be satisfied to unlock the restricted shares. After it comes into the post lock-up period, the Group deals with unlocking procedures for the holders that meet unlocking conditions as well as repurchases and cancels the restricted shares that do not meet unlocking conditions. The repurchasing price comprises the granting price plus the interest accruing thereon at the current deposit rate.

S.F. HOLDING CO., LTD. NOTES TO THE FINANCIAL STATEMENTS FOR THE SIX MONTHS ENDED 30 JUNE 2019 (All amounts in RMB Yuan unless otherwise stated) [English translation for reference only]
259
9 Share-based payment (Cont'd)
(2) Information on equity-settled share-based payment (Cont'd)
(a) Information on equity-settled share-based payment of the Company (Cont'd)
If the Company transfers capital reserve to paid-in capital, distributes share dividends, splits shares, pays dividends, allocates shares or reduces shares after restricted shares are granted, the number and the price of repurchasing restricted shares shall be adjusted in accordance with the Restricted Shares Incentive Plan. In 2017, the Group issued 2,556,661 ordinary A shares denominated in RMB according to the restricted shares incentive plan for 2017, with raised funds totalling RMB 74,961,331.87. AS at 9 January 2018, the Company completed the granting and registration of the restricted shares incentive plan for 2017. In 2018, the Group issued 5,231,982 ordinary A shares denominated in RMB according to the restricted shares incentive plan for 2018, with raised funds totalling RMB 127,294,205.35. As at 25 June 2018, the Company completed the granting and registration of the restricted shares incentive plan for 2018. As stated in Note 4(41), as at 30 June 2019, some of the Group's former incentive recipients of the restricted shares resigned due to personal reasons, they no longer met the requirements. In addition, according to the Group’s performance in 2018, the unlocking conditions for the second post lock-up period for the restricted shares incentive plan for 2017 and for the first post lock-up period for the restricted shares incentive plan for 2018 were not met. Therefore, the Company repurchased and cancelled a total of 4,218,902 restricted shares that had been granted and had not been released for resale. For the current reporting period, the unlocking conditions for the first post lock-up period for the restricted shares incentive plan for 2017 were met and 1,113,173 restricted shares were released. As at 30 June 2019, the restricted shares that were granted to and held by incentive recipients but not unlocked totalled 2,456,568 shares. As at 30 June 2019, the Group made best estimation of the quantity of unlockable equity instruments according to the latest information such as changes in the number of incentive recipients, company performance and incentive recipients’ individual performance. The Group recognised share-based compensation expense and capital reserve simultaneously in this period based on the fair value of equity instruments determined by the stock price at the grant date of the equity instruments. As at 30 June 2019, the equity-settled share-based payment recognised in the capital reserve accumulated to RMB 48,637,227.21 (31 December 2018: RMB 36,955,871.18). For the six months ended 30 June 2019, expenses recognised for equity-settled share-based payment amounted to RMB 11,681,356.03 (for the six months ended 30 June 2018: RMB 22,900,543.05).

S.F. HOLDING CO., LTD. NOTES TO THE FINANCIAL STATEMENTS FOR THE SIX MONTHS ENDED 30 JUNE 2019 (All amounts in RMB Yuan unless otherwise stated) [English translation for reference only]
260
9 Share-based payment (Cont'd)
(2) Information on equity-settled share-based payment (Cont'd)
(b) Information on equity-settled share-based payment of the Company’s subsidiaries
In 2017 and 2018, the Group granted some equities of several subsidiaries, to senior management and other employees of the aforesaid companies respectively. As at 30 June 2019, the equity-settled share-based payments of the above-mentioned companies recognised by the Group accumulated to RMB 13,272,564.17 (31 December 2018: RMB 9,356,207.39), including accumulated amounts attributable to shareholders of the Company of RMB 10,909,748.03 (31 December 2018: RMB 8,009,970.98). For the six months ended 30 June 2019, expenses recognised for equity-settled share-based payment amounted to RMB 3,916,356.78 (for the six months ended 30 June 2018: RMB 1,029,803.03).
(3) Information on cash-settled share-based payment
(a) Information on cash-settled share-based payment of the Company On 30 November 2017, the Company held the 4th interim shareholders’ meeting in 2017, at which the proposal of the Incentive Plan of Share Appreciation Rights (Draft) and Summary for 2017 was approved. Authorised by the 4th interim shareholders’ meeting in 2017, the Company held the 11th meeting of the 4th Board of Directors on 27 December 2017, at which the Proposal of Granting Share Appreciation Rights to Incentive Recipients was approved. The share appreciation rights were granted on 27 December 2017. The exercise price of the share appreciation rights was RMB 29.32 per share. The incentive recipients of the plan refer to 20 key foreign talents. On 17 May 2018, the Company held the 2nd interim shareholders’ meeting in 2018, at which the proposal of the Incentive Plan of Share Appreciation Rights (Draft) and Summary for 2018 was approved. Authorised by the 2nd interim shareholders’ meeting in 2018, the Company held the 15th meeting of the 4th Board of Directors on 13 June 2018, at which the Proposal of Granting Share Appreciation Rights to Incentive Recipients was approved. The share appreciation rights were granted on 13 June 2018. The exercise price of the share appreciation rights was RMB 24.33 per share. The incentive recipients of the plan refer to 29 key foreign talents.

S.F. HOLDING CO., LTD. NOTES TO THE FINANCIAL STATEMENTS FOR THE SIX MONTHS ENDED 30 JUNE 2019 (All amounts in RMB Yuan unless otherwise stated) [English translation for reference only]
261
9 Share-based payment (Cont'd)
(3) Information on cash-settled share-based payment (Cont'd)
(a) Information on cash-settled share-based payment of the Company (Cont'd)
The exercise periods and their schedules for the share appreciation rights for 2017 and 2018 are presented in the table below:
Exercise period Timing Exercise
proportion
1st exercise period
From the first trading day after 12 months since the registration of granting to the last trading day within 24 months after the registration of granting 50%
2nd exercise period
From the first trading day after 24 months since the registration of granting to the last trading day within 36 months after the registration of granting 50%
In addition to the Company’s performance, individual performance assessment, which is specified in the Restricted Shares Incentive Plan, has also to be satisfied for the share appreciation rights granted. As at 30 June 2019, the accumulated liabilities arising from cash-settled share-based payment amounted to RMB 421,146.60 (31 December 2018: RMB 223,945.97). For the six months ended 30 June 2019, expenses recognised for cash-settled share-based payment amounted to RMB 197,200.63 (for the six months ended 30 June 2018: RMB 423,976.70).
(b) Information on cash-settled share-based payment of the Company’s subsidiaries The Group granted the senior management of subsidiaries with the stock options of the subsidiaries with repurchase terms in 2018. As at 30 June 2019, liabilities arising from the cash-settled share-based payment accumulated to RMB 32,007,309.49 (31 December 2018: RMB 14,551,705.49). For the six months ended 30 June 2019, expenses recognised for cash-settled share-based payment in the current period amounted to RMB 17,455,604.00 (for the six months ended 30 June 2018: Nil).

S.F. HOLDING CO., LTD. NOTES TO THE FINANCIAL STATEMENTS FOR THE SIX MONTHS ENDED 30 JUNE 2019 (All amounts in RMB Yuan unless otherwise stated) [English translation for reference only]
262
10 Commitments
(1) Capital commitments
Capital expenditures contracted for by the Group but are not yet necessary to be recognised in the balance sheet at the balance sheet date are as follows: 30 June 2019 31 December 2018 Investment contracts that have been signed
but not fulfilled or not absolutely fulfilled 2,417,304,868.00
7,783,785,763.75 Buildings, machinery and equipment 1,760,366,540.17 1,838,275,575.89 Others 91,502,907.98 87,949,458.58 4,269,174,316.15 9,710,010,798.22
(2) Operating lease commitments The future minimum lease payments due under the signed irrevocable operating leases contracts are summarised as follows: 30 June 2019 31 December 2018 Within 1 year 4,059,476,735.47 3,452,250,034.37 1 to 2 years 2,823,099,999.00 2,265,599,687.20 2 to 3 years 1,688,882,965.50 1,364,554,994.07 Over 3 years 2,644,105,615.73 1,773,376,291.66 11,215,565,315.70 8,855,781,007.30
(3) Other commitment
(i) In December 2018, the Group issued asset-backed securities through the Special Scheme set up by Huatai Securities (Shanghai) Asset Management Co., Ltd. by using two logistics industrial parks held by it as underlying assets. Shanghai Fengtai Yuanxing Property Management Service Co., Ltd. (“Fengtai Yuanxing”), a wholly-owned subsidiary of the Group, worked as the property operator of the special scheme. In case that the actual operating income of the property assets does not reach 90% but is not lower than 80% of the objective amount, Fengtai Yuanxing was committed to compensate the insufficient part of the target amount with Taisen Holdings providing guarantee for the compensation obligation.
(ii) At the end of each three years, the manager of the Special Scheme accepts open-ended withdrawal and subscription of preferred securities within the withdrawal registering period. If the preferred securities shares that have not completed open-ended withdrawal are less than 20% of total undistributed principal of the preferred securities, RMB 1.12 billion, at the extension operation announcement date, Taisen Holdings will purchase it.

S.F. HOLDING CO., LTD. NOTES TO THE FINANCIAL STATEMENTS FOR THE SIX MONTHS ENDED 30 JUNE 2019 (All amounts in RMB Yuan unless otherwise stated) [English translation for reference only]
263
11 Events after the balance sheet date
As at 23 August 2019, the China Securities Regulatory Commission(“CSRC”) Issue Review Committee approved the Company’s application for the issuance of A-share convertible corporate bonds. The total amount for this public offering of A-share convertible corporate bonds shall not exceed RMB 5,800 million (RMB 5,800 million inclusive). As of the reporting date, the Company has not received the written approval document from CSRC.
12 Business combinations See Note 5(1) and 5(2).
13 Financial instrument and risk The Group's activities expose it to a variety of financial risks: market risk (primarily including foreign exchange risk, interest rate risk and other price risk), credit risk and liquidity risk. The above financial risks and the Group's risk management policies to mitigate the risks are as follows: The Board of Directors is responsible for planning and establishing the Group's risk management framework, formulating the Group's risk management policies and related guidelines, and supervising the implementation of risk management measures. The Group has established risk management policies to identify and analyse the risks faced by the Group. These risk management policies specify the risks such as market risk, credit risk and liquidity risk management. The Group regularly evaluates the market environment and changes in the Group's operating activities to determine whether to update the risk management policies and systems or not. The Group's risk management is carried out by the Risk Management Committee under policies approved by the Board of Directors. The Risk Management Committee closely cooperates with other departments of the Group to identify, evaluate and avoid relevant risks. The internal audit department of the Group conducts periodical audit to the controls and procedures for risk management and reports the audit results to the Risk Management Committee of the Group.
(1) Market risk
(a) Foreign exchange risk The Group’s major operational activities are carried out in Mainland China and a majority of the transactions are denominated in RMB. Some operational activities are carried out in regions/countries including Hong Kong, America and Korea and relevant transactions are settled in HKD, USD and KRW. Therefore, the Group is exposed to foreign exchange risk arising from the recognised assets and liabilities, and future transactions denominated in foreign currencies. The Group is responsible for monitoring the amount of assets and liabilities, and transactions denominated in foreign currencies, to reduce foreign exchange risk to the greatest extent.

S.F. HOLDING CO., LTD. NOTES TO THE FINANCIAL STATEMENTS FOR THE SIX MONTHS ENDED 30 JUNE 2019 (All amounts in RMB Yuan unless otherwise stated) [English translation for reference only]
264
13 Financial instrument and risk (Cont'd)
(1) Market risk (Cont’d)
(a) Foreign exchange risk (Cont’d)
As at 30 June 2019 and 31 December 2018, the companies within the Group whose recording currency is RMB held no significant assets or liabilities denominated in foreign currency. Those companies operating in Hong Kong with HKD as recording currency held assets and liabilities denominated in foreign currency (mainly USD and RMB), of which the equivalent amounts in HKD (recording currency of companies operating in Hong Kong) and RMB (presentation currency of these financial statements) are listed as below: 30 June 2019
RMB USD Total Total (HKD) (HKD) (HKD) (RMB) Financial assets
denominated in foreign currency Cash at bank and
on hand 106,457,060.76 80,778,642.59 187,235,703.35 164,707,436.48 Receivables 3,432,424.65 24,527,571.53 27,959,996.18 24,596,343.07 Investments in
other equity investments - 2,121,117,464.07 2,121,117,464.07 1,865,952,581.03
Other non-current financial assets - 81,597,725.01 81,597,725.01 71,781,732.12
109,889,485.41 2,308,021,403.20 2,417,910,888.61 2,127,038,092.70 Financial liabilities
denominated in foreign currency Payables 3,578,115.54 44,431,057.12 48,009,172.66 42,233,650.18
31 December 2018
RMB USD Total Total (HKD) (HKD) (HKD) (RMB) Financial assets
denominated in foreign currency Cash at bank
and on hand 177,569,672.57 78,828,160.48 256,397,833.05 224,654,813.91 Receivables 7,515,201.74 - 7,515,201.74 6,584,773.28
185,084,874.31 78,828,160.48 263,913,034.79 231,239,587.19 Financial liabilities
denominated in foreign currency Payables 35,156.33 - 35,156.33 30,803.76

S.F. HOLDING CO., LTD. NOTES TO THE FINANCIAL STATEMENTS FOR THE SIX MONTHS ENDED 30 JUNE 2019 (All amounts in RMB Yuan unless otherwise stated) [English translation for reference only]
265
13 Financial instrument and risk (Cont'd)
(1) Market risk (Cont’d)
(a) Foreign exchange risk (Cont’d)
As HKD is pegged to USD, there is little difference arising from translating the Group’s financial assets and financial liabilities denominated in USD to HKD and it does not have significant influence on the Group’s net profit. As at 30 June 2019, if the HKD strengthens/weakens by 10% against the RMB while holding all other variables constant, the Group’s profit before tax for the year would have been approximately HKD 10,631,000.00, equivalent to RMB 9,352,000.00 (31 December 2018: approximately HKD 18,505,000.00, equivalent to RMB 16,214,000.00) lower/higher for various financial assets and liabilities denominated in RMB. The changes in exchange rate of other foreign currencies have no significant influence on the Group’s operating activities.
(b) Interest rate risk The Group's interest rate risk arises from long-term interest bearing debts including long-term bank borrowings and debentures payable. Financial liabilities issued at floating rates expose the Group to cash flow interest rate risk. Financial liabilities issued at fixed rates expose the Group to fair value interest rate risk. The Group determines the relative proportions of its fixed rate and floating rate contracts depending on the prevailing market conditions. As at 30 June 2019, the Group’s long-term interest bearing debts were mainly related to the contracts of floating rate long-term borrowings denominated in RMB and HKD, and fixed rate debentures payable denominated in RMB and USD. Among them, the contract amount of floating rate long-term borrowings denominated in RMB was RMB 2,272,400,998.14 (31 December 2018: RMB 882,550,284.58), and floating rate long-term borrowings denominated in HKD amounted to HKD 4,202,480,783.95, equivalent to RMB 3,649,780,124.34 (31 December 2018: HKD 131,758,521.06, equivalent to RMB 115,737,550.61); the contract amount of fixed rate debentures payable denominated in RMB was RMB 3,000,000,000.00 (31 December 2018: RMB 3,000,000,000.00), and fixed rate debentures payable denominated in USD amounted to USD 500,000,000.00, equivalent to RMB 3,437,350,000.00 (31 December 2017: USD 500,000,000.00, equivalent to RMB 3,439,250,000.00). The Group continuously monitors the interest rate position of the Group. Increases in interest rates will increase the cost of new interest bearing borrowings and the interest expenses with respect to the Group’s outstanding floating rate borrowings, and therefore could have a material adverse effect on the Group’s financial performance. Management makes adjustments timely with reference to the latest market conditions and may enter into interest rate swap agreements to mitigate its exposure to interest rate risk. As at 30 June 2019, if interest rates on borrowings rise/fall by 50 basis points while holding all other variables constant, the Group’s profit before tax will decrease/increase by approximately RMB 29,610,000.00 (31 December 2018: RMB 4,991,000.00).
(c) Other price risk The Group's other price risk arises mainly from movements in price of various equity and debt instruments measured at fair value that will not be sold within 1 year. As at 30 June 2019, if the expected price of various investments in equity instruments mentioned above measured at fair value rises/falls by 10% while holding all other variables constant, the Group’s net profit and other comprehensive income will be approximately RMB 40,507,000.00 (31 December 2018: Nil) and RMB 404,270,000.00 (31 December 2018: approximately RMB 325,333,000.00) higher/lower respectively.

S.F. HOLDING CO., LTD. NOTES TO THE FINANCIAL STATEMENTS FOR THE SIX MONTHS ENDED 30 JUNE 2019 (All amounts in RMB Yuan unless otherwise stated) [English translation for reference only]
266
13 Financial instrument and risk (Cont'd)
(2) Credit risk
The Group's credit risk mainly arises from cash at bank and on hand, notes receivable, accounts receivable, factoring receivables, loans and advances, other receivables, current portion of non-current assets, long-term receivables, investments in debt instruments measured at fair value through profit or loss that are not included in the assessment of impairment, etc. At the balance sheet date, the Group's maximum exposure to credit risk represents the carrying amount of the Group's financial assets, except that the maximum exposure to credit risk of long-term receivables represents its undiscounted contractual cash flows. The Group expects that there is no significant credit risk associated with cash at bank and on hand since they are mainly deposits at state-owned banks and other medium or large size listed banks with good reputation and a higher credit rating. The Group does not expect that there will be any significant losses from non-performance by these counterparties. Notes receivable, accounts receivable, other receivables, current portion of non-current assets and long-term receivables include receivables from related parties and receivables from non-related parties. In respect of receivables from related parties, the Group considers that they have low credit risk; in respect of receivables from non-related parties, the Group will develop relevant policies to control the exposure to credit risk and will focus on their credit and recovery situation on a regular basis. In respect of customers with a poor credit history, the Group will use payment reminders, or shorten or cancel credit periods, to ensure the overall credit risk of the Group is limited to a controllable extent. As at 30 June 2019 and 31 December 2018, the factoring receivables were from the Group’s subsidiary Lefeng Factoring (Note 4(7)). Loans and advances were from S.F. Finance, an overseas subsidiary of the Group (Note 4(8)). The Group developed credit policies and operational implementation rules in accordance with the requirements of relevant state regulatory authorities, and implemented standardised management over the entire process of credit granting. In addition, the Group further improved the systems for credit risk monitoring and early warning and defective credit extension management. The Group actively responded to the changes in the credit environment, regularly analysed the situation and dynamic of credit risks and took risk control measures on a forward-looking basis. The Group also established an optimisation management mechanism for defective credit and accelerated the optimisation progress of defective credit to avoid non-performing loans. As at 30 June 2019, The Group had no significant collateral or other credit enhancements held as a result of debtor’s mortgage.

S.F. HOLDING CO., LTD. NOTES TO THE FINANCIAL STATEMENTS FOR THE SIX MONTHS ENDED 30 JUNE 2019 (All amounts in RMB Yuan unless otherwise stated) [English translation for reference only]
267
13 Financial instrument and risk (Cont'd)
(3) Liquidity risk
Cash flow forecasting is performed by each subsidiary of the Group and aggregated by the Group’s finance department in its headquarters. Cash flow forecasting is aggregated by the Group. The Group monitors rolling forecasts of the Group's short-term and long-term liquidity requirements to ensure it has sufficient cash and securities that are readily convertible to cash to meet operational needs, while maintaining sufficient headroom on its undrawn committed borrowing facilities from major financial institutions so that the Group does not breach borrowing limits or covenants on any of its borrowing facilities to meet the short-term and long-term liquidity requirements. The financial liabilities of the Group at the balance sheet date are analysed by their maturity date below at their undiscounted contractual cash flows: 30 June 2019 Within 1 year 1 to 2 years 2 to 5 years Over 5 years Total Accounts payable 8,499,813,706.49 - - - 8,499,813,706.49 Other payables 3,964,347,310.74 - - - 3,964,347,310.74 Short-term
borrowings 10,549,092,558.05 - - - 10,549,092,558.05 Other current
liabilities 1,031,833,528.22 - - - 1,031,833,528.22 Current portion of
non-current liabilities 562,341,754.79 - - - 562,341,754.79
Long-term borrowings 229,693,827.45 1,109,210,113.27 5,422,378,427.64 104,955,033.46 6,866,237,401.82
Debentures payable 273,079,187.50 273,079,187.50 6,786,545,961.47 - 7,332,704,336.47
Long-term payables - 26,389,372.14 25,921,201.55 53,690,616.35 106,001,190.04
25,110,201,873.24 1,408,678,672.91 12,234,845,590.66 158,645,649.81 38,912,371,786.62
31 December 2018 Within 1 year 1 to 2 years 2 to 5 years Over 5 years Total Deposits from
customers 10,269,542.51 - - - 10,269,542.51 Accounts payable 7,887,342,829.83 - - - 7,887,342,829.83 Other payables 4,539,637,152.31 - - - 4,539,637,152.31 Short-term
borrowings 8,760,599,478.79 - - - 8,760,599,478.79 Other current
liabilities 1,027,375,000.00 - - - 1,027,375,000.00 Current portion of
non-current liabilities 277,598,072.61 - - - 277,598,072.61
Long-term borrowings 46,986,294.28 304,037,905.73 745,806,442.63 51,386,474.79 1,148,217,117.43
Debentures payable 271,785,988.56 271,785,988.56 6,932,140,688.26 - 7,475,712,665.38
Long-term payables - 25,647,058.05 6,075,000.00 52,710,616.37 84,432,674.42
22,821,594,358.89 601,470,952.34 7,684,022,130.89 104,097,091.16 31,211,184,533.28

S.F. HOLDING CO., LTD. NOTES TO THE FINANCIAL STATEMENTS FOR THE SIX MONTHS ENDED 30 JUNE 2019 (All amounts in RMB Yuan unless otherwise stated) [English translation for reference only]
268
14 Fair value estimates
The level in which fair value measurement is categorised is determined by the level of the fair value hierarchy of the lowest level input that is significant to the entire fair value measurement: Level 1: Quoted prices (unadjusted) in active markets for identical assets or liabilities. Level 2: Inputs other than quoted prices included within Level 1 that are observable for the asset or liability, either directly or indirectly. Level 3: Unobservable inputs for the asset or liability.
(1) Financial assets and liabilities measured at fair value on a recurring basis As at 30 June 2019, the financial assets measured at fair value on a recurring basis by the above three levels were analysed below:
Level 1 Level 2 Level 3 Total
Financial assets held for trading- Structural deposits - 2,509,960,802.13 - 2,509,960,802.13 Others 15,420,732.91 383,103.75 - 15,803,836.66
Other non-current financial assets Special scheme equity-class
securities - - 138,000,000.00 138,000,000.00 Discounted stock option - - 71,781,728.81 71,781,728.81 Industry fund investments - - 195,283,651.74 195,283,651.74
Investments in other equity instruments- Available-for-sale equity
instruments 792,918,258.45 - 3,249,780,185.56 4,042,698,444.01 Total financial assets 808,338,991.36 2,510,343,905.88 3,654,845,566.11 6,973,528,463.35
As at 31 December 2018, the financial assets measured at fair value on a recurring basis by the above three levels were analysed below: Level 1 Level 2 Level 3 Total Financial assets at fair value through
profit or loss Investments in equity instrument
held for trading 13,715,336.78 - - 13,715,336.78 Forward interest rate swap
contracts - 726,641.31 - 726,641.31 Available-for-sale financial assets
Available-for-sale equity instruments 794,053,309.82 - 2,276,274,386.92 3,070,327,696.74
Available-for-sale debt instruments - - 178,403,812.08 178,403,812.08
Total financial assets 807,768,646.60 726,641.31 2,454,678,199.00 3,263,173,486.91

S.F. HOLDING CO., LTD. NOTES TO THE FINANCIAL STATEMENTS FOR THE SIX MONTHS ENDED 30 JUNE 2019 (All amounts in RMB Yuan unless otherwise stated) [English translation for reference only]
269
14 Fair value estimates (Cont’d)
(1) Financial assets and liabilities measured at fair value on a recurring basis (Cont’d)
The Group takes the date on which events causing the transfers between the levels take place as the timing specific for recognising the transfers. There is no transfer between the levels for the current period. The fair value of financial instruments traded in an active market is determined at the quoted market price; and the fair value of those not traded in an active market is determined by the Group using valuation technique. The valuation models used mainly comprise discounted cash flow model and market comparable company model. The inputs of the valuation technique mainly include risk-free interest rate, benchmark rate, exchange rate, credit spread, liquidity premium, EBITDA multiplier, liquidity discount, etc. The changes in Level 3 financial assets are analysed below:
Available-for-sale
financial assets Available-for-sale
financial assets Other non-current
financial assets Other non-current
financial assets Other non-current
financial assets Other equity investments
-Available-for-sale
debt instruments -Available-for-sale equity instruments
-Special scheme equity-class
securities
-SAFE and discounted stock
option -Industry fund
investments -Available-for-sale equity instruments
As at 31 December 2018 178,403,812.08 2,276,274,386.92 - - - - Changes in accounting policies (178,403,812.08) (2,276,274,386.92) 178,403,812.08 344,685,887.97 105,000,000.00 1,997,472,148.15 As at 1 January 2019 - - 178,403,812.08 344,685,887.97 105,000,000.00 1,997,472,148.15
Increase in the current period - - - - 74,283,651.74 1,257,296,652.39 Decrease in the current period - - (40,403,812.08) (577,143,861.19) - (175,682.00) Gains or losses recognised in profit or
loss - - - 304,239,702.03 16,000,000.00 - Gains or losses recognised in other
comprehensive income (i) - - - - - (4,812,932.98) As at 30 June 2019 - - 138,000,000.00 71,781,728.81 195,283,651.74 3,249,780,185.56
(i) The above is affected by changes in the fair value of the invested entities and exchange differences on translation of foreign currency financial statements.

S.F. HOLDING CO., LTD. NOTES TO THE FINANCIAL STATEMENTS FOR THE SIX MONTHS ENDED 30 JUNE 2019 (All amounts in RMB Yuan unless otherwise stated) [English translation for reference only]
270
14 Fair value estimates (Cont’d)
(1) Financial assets and liabilities measured at fair value on a recurring basis (Cont’d)
Available-for-sale
financial assets Available-for-sale
financial assets
-Available-for-sale debt
instruments -Available-for-sale equity
instruments As at 1 January 2018 58,363,532.08 1,050,000,000.00 Increase in the current period 138,000,000.00 977,953,000.75 Decrease in the current period (6,477,537.61) - Total gains or losses in the current period (11,482,182.39) 248,321,386.17 Losses recognised in profit or loss (11,482,182.39) - Gains recognised in other comprehensive
income - 248,321,386.17 As at 31 December 2018 178,403,812.08 2,276,274,386.92
(2) Financial assets and liabilities not measured at fair value but disclosed The Group’s financial assets and liabilities measured at amortised cost mainly include receivables, factoring receivables, loans and advances, current portion of non-current liabilities, long-term receivables, short-term borrowings, payables, long-term borrowings, debentures payable, current portion of non-current liabilities, other current liabilities and long-term payables. The carrying amount of financial assets and liabilities not measured at fair value is a reasonable approximation of their fair value. The fair value of debentures payable that are traded in an active market is determined at quoted prices in the active market, categorised within Level 1 of the fair value hierarchy. The fair value of long-term borrowings and long-term payables is the present value of the contractually determined stream of future cash flows discounted at the rate of interest applied at that time by the market to instruments of comparable credit status and providing substantially the same cash flows on the same terms, and categorised within Level 3 of the fair value hierarchy.

S.F. HOLDING CO., LTD. NOTES TO THE FINANCIAL STATEMENTS FOR THE SIX MONTHS ENDED 30 JUNE 2019 (All amounts in RMB Yuan unless otherwise stated) [English translation for reference only]
271
15 Capital management
The Group’s capital management policies aim to safeguard the Group’s ability to continue as a going concern in order to provide returns for shareholders and benefits for other stakeholders, and to maintain an optimal capital structure to reduce the cost of capital. In order to maintain or adjust the capital structure, the Group may adjust the amount of dividends paid to shareholders, refund capital to shareholders, issue new shares or sell assets to reduce debts. The Group's total capital is calculated as “Equity” as shown in the consolidated balance sheet. The Group is not subject to external mandatory capital requirements. As at 30 June 2019 and 31 December 2018, the Group's gearing ratio was as follows: 30 June 2019 31 December 2018 Gearing ratio 52.26% 48.45%
16 Notes to the Company’s financial statements
(1) Cash at bank and on hand 30 June 2019 31 December 2018 Cash at bank 357,848,795.35 1,136,148,582.11 Other cash balances 139,907.00 139,907.00 357,988,702.35 1,136,288,489.11
(2) Other receivables 30 June 2019 31 December 2018 Dividends receivable from Taisen Holdings 1,117,405,390.21 2,117,405,390.21 Raised funds granted to the subsidiaries - 7,421,843,560.89 Others 1,713,652.77 3,217,175.00 1,119,119,042.98 9,542,466,126.10 Less: Provision for bad debts - - 1,119,119,042.98 9,542,466,126.10

S.F. HOLDING CO., LTD. NOTES TO THE FINANCIAL STATEMENTS FOR THE SIX MONTHS ENDED 30 JUNE 2019 (All amounts in RMB Yuan unless otherwise stated) [English translation for reference only]
272
16 Notes to the Company’s financial statements (Cont’d)
(2) Other receivables (Cont’d)
The ageing of other receivables is analysed as follows: 30 June 2019 31 December 2018 Within 1 year 1,119,119,042.98 3,529,984,352.31 1 to 2 years - 6,012,481,773.79 1,119,119,042.98 9,542,466,126.10
(3) Long-term receivables 30 June 2019 31 December 2018 Raised funds granted to the subsidiaries 7,776,179,035.82 - The above raised funds granted to the subsidiaries essentially constitutes the long-term equity investments in the subsidiaries.
(4) Long-term equity investments 30 June 2019 31 December 2018 Subsidiaries (a) 43,348,872,192.32 43,337,179,817.15 Less: Provision for impairment of long-term
equity investments - - 43,348,872,192.32 43,337,179,817.15 There is no significant restriction on sales of the long-term equity investments held by the Company.

S.F. HOLDING CO., LTD. NOTES TO THE FINANCIAL STATEMENTS FOR THE SIX MONTHS ENDED 30 JUNE 2019 (All amounts in RMB Yuan unless otherwise stated) [English translation for reference only]
273
16 Notes to the Company’s financial statements (Cont'd)
(4) Long-term equity investments (Cont’d)
(a) Subsidiaries
Accounting method
31 December 2018
Increase in the current period 30 June 2019
Shareholding
(%)
Voting rights
(%)
Explanation of disparity between
percentages of shareholding and
voting rights
Provision for
impairment loss
Cash
dividends declared in the current period
Taisen Holdings Cost
method 43,337,179,817.15 11,692,375.17 43,348,872,192.32 100.00% 100.00% Not applicable - -

S.F. HOLDING CO., LTD. NOTES TO THE FINANCIAL STATEMENTS FOR THE SIX MONTHS ENDED 30 JUNE 2019 (All amounts in RMB Yuan unless otherwise stated) [English translation for reference only]
274
16 Notes to the Company’s financial statements (Cont'd)
(5) Investment income
For the six months ended 30 June 2019 2018 Investment income from wealth management
products 2,044,740.25 45,445,973.04 Income from utilisation of raised funds by
subsidiaries - 54,419,718.73 Others (115,448.74) - 1,929,291.51 99,865,691.77

S.F. HOLDING CO., LTD. SUPPLEMENTARY INFORMATION TO THE FINANCIAL STATEMENTS FOR THE SIX MONTHS ENDED 30 JUNE 2019 (All amounts in RMB Yuan unless otherwise stated) [English translation for reference only]
275
1 Statement of non-recurring profit or loss For the six months ended 30 June 2019 2018 Gains on disposal of non-current assets 315,373,555.74 83,365,835.91 Government grants recognised in profit or
loss for the current period (government grants recognised in non-operating income, other income and deducted against related cost and expenses) 175,408,699.42 104,740,498.52
Gains/(losses) arising from changes in fair value of financial assets and liabilities held for trading and investment losses arising from disposals of financial assets and liabilities held for trading and available-for-sale financial assets 347,394,450.91 (7,644,717.08)
Net loss of the subsidiaries for the period from the beginning of the period to the combination date arising from business combinations involving entities under common control - (37,645,258.17)
Net amount of other non-operating income and expenses 10,683,463.79 (11,214,444.33)
Subtotal 848,860,169.86 131,601,914.85 Less: Income tax effect (78,025,730.22) (11,671,788.69) Less: Total non-recurring profit or loss
attributable to minority shareholders (32,917.44) (723,413.33) Non-recurring profit or loss attributable to
shareholders of the parent company 770,801,522.20 119,206,712.83 Including: Non-recurring profit or loss from
continuing operations 770,801,522.20 119,206,712.83 Basis for preparation of statement of non-recurring profit or loss Pursuant to the Explanatory Announcement for Information Disclosure of Companies Offering Securities to the Public No.1 - Non-recurring Profit or Loss (2008) issued by China Securities Regulatory Commission, non-recurring profit or loss refers to profit or loss arising from transactions and events those are not directly related to the company’s normal course of business, also from transactions and events those even are related to the company’s normal course of business, but will interfere with the right judgement of users of the financial statements on the company’s operation performance and profitability due to their special nature and occasional occurrence.

S.F. HOLDING CO., LTD. SUPPLEMENTARY INFORMATION TO THE FINANCIAL STATEMENTS FOR THE SIX MONTHS ENDED 30 JUNE 2019 (All amounts in RMB Yuan unless otherwise stated) [English translation for reference only]
276
2 Return on net assets and earnings per share Weighted average Earnings per share return on net assets (%) Basic earnings per share Diluted earnings per share For the six months ended 30 June For the six months ended 30 June For the six months ended 30 June 2019 2018 2019 2018 2019 2018 Net profit attributable to
ordinary shareholders of the Company 8.23% 6.57%
0.70 0.50
0.70 0.50 Net profit attributable to
ordinary shareholders of the Company after deducting non-recurring profit or loss 6.19% 6.25%
0.53 0.47
0.53 0.47 Including: - Continuing operations Net profit attributable to
ordinary shareholders of the Company 8.23% 6.57% 0.70 0.50 0.70 0.50
Net profit attributable to ordinary shareholders of the Company after deducting non-recurring profit or loss 6.19% 6.25% 0.53 0.47 0.53 0.47

S.F. Holding Co., Ltd. 2019 Semi-Annual Report
277
Chapter 11 List of Documents Available for Inspection
(I). Financial statements with the signatures and seals of the Company principal, the principal of finances, and the principal of the auditor; (II). Texts of all the Company's documents ever publicly disclosed in newspapers designated by the CSRC in the reporting period and the originals of the public announcements; (III). Original 2019 Semi-Annual Report with the signature of the Chairman of the Board of Directors; (IV). Place for archiving the above-mentioned documents for reference: office of the Company's Board of Directors.

278