SEZs in India - A study
29
BITHIKAA BISHESH RESEARCH SCHOLAR, SHARDA UNIVERSITY, GREATER NOIDA & SUPERVISOR: DR. ASSISTANT PROFESSOR SHARDA UNIVERSITY, GREATER NOIDA Analysis of Economic growth from Special Economic Zones
-
Upload
binay-shrivastav -
Category
Economy & Finance
-
view
62 -
download
1
Transcript of SEZs in India - A study
BITHIKAA BISHESHRESEARCH SCHOLAR, SHARDA UNIVERSITY, GREATER
NOIDA&
SUPERVISOR: DR.ASSISTANT PROFESSOR SHARDA UNIVERSITY, GREATER NOIDA
Analysis of Economic growth from Special
Economic Zones

INTRODUCTION
Defining SEZ:Specific Geographical regionsFenced-in Industrial Estate
SEZs in India:Pioneer in Asia- Kandla SEZ in 1965.SEZ policy (2000): EPZ coverted to- SEZs

SEZ OBJECTIVES (SEZ policy, 2000)
1. Generation of additional economic activity2. Promotion of exports of goods & Services3. Stimulate investment4. Generate employment opportunities5. Development of Infrastructure facilities
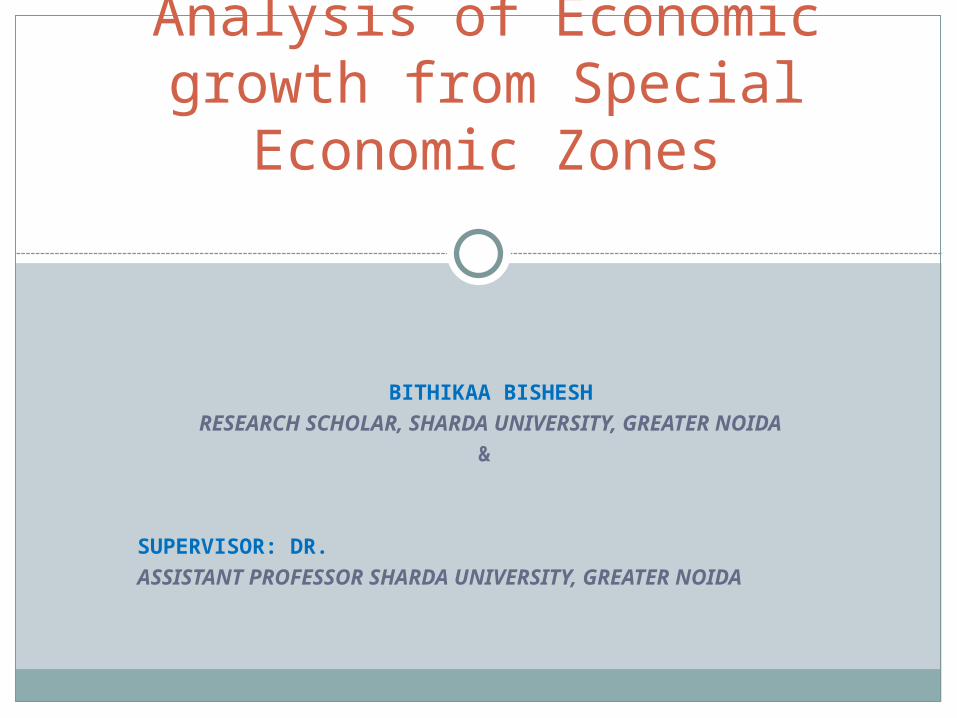
SEZ act(2005) & SEZ Rules (2006)As per SEZ India data (2.09.2016)No. of Approved SEZs (Formal) = 405No. of Approved SEZs (In-principle) = 31Total No. of notified SEZs = 352Total No. of Operational SEZs = 196Central government= 7State Govt/Private Sector SEZs set up prior to the
SEZ Act 0f 2005= 11SEZs notified under the SEZ Act of 2005 = 186

LITERATURE REVIEW- 1
Little research on SEZ performance in India during the period 2000-2010 (Aggarwal, 2004).
There is exhaustive literature analyzing the efficacy of SEZ . Grandos (2003) pointed out that growth models based on export promotion instead of import substitution are better models.
Success factors for SEZ have been researched by several authors. CII report(2008), Smart& Hsu(2004), and Cling & Letilly (2001) have argued that Geographical location is the most important factor behind SEZ success in India and China.
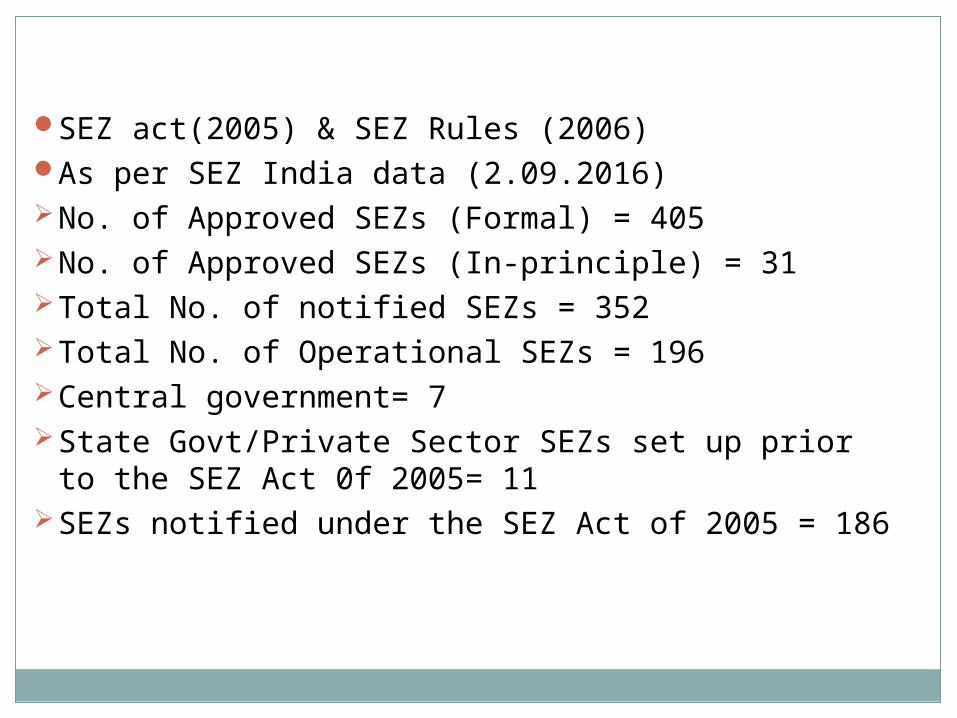
LITERATURE REVIEW- 2
Kumar (1989), and Wei Gi (1999) have found that Economic infrastructure and favourable govt. policy are critical for SEZ success in S. Asia, India and China. Kumar (1998)
The existing literature has mainly judged the success of SEZs/EPZs in terms of employment generation, export growth, linkages to the host economy, foreign exchange GDP growth and regional imbalances in growth.
Efficiency of SEZs in India is far below the threshold level (Tantri, 2011).
No tool for growth measurement

RESEARCH GAP
Thus an attempt is made to evaluate the performance of SEZs in India in relation to three attributes—namely, exports, employment and investment. Further land use has also been studied.
No tool for growth measurement and continual performance monitoring of SEZ has been developed .
The present Research attempts to develope this monitoring tool in order to generate a competitive environment for SEZ operations to allow the Decision makers to go for a periodical course-correction.

RESEARCH PROBLEM
Economic development through Export led growth strategy (ELG).
SEZ led to INR 1,75,874 crore worth of revenue loss during 2013-14 (CBEC).
Implementation of SEZ policy, 2000 has come under heavy criticism.
Lack of clarity in Incentive package: only 15 years exemption on export income
First 5 years - 100%; thereafter, 50 % (next 5 years); 50 %( next 5 years)

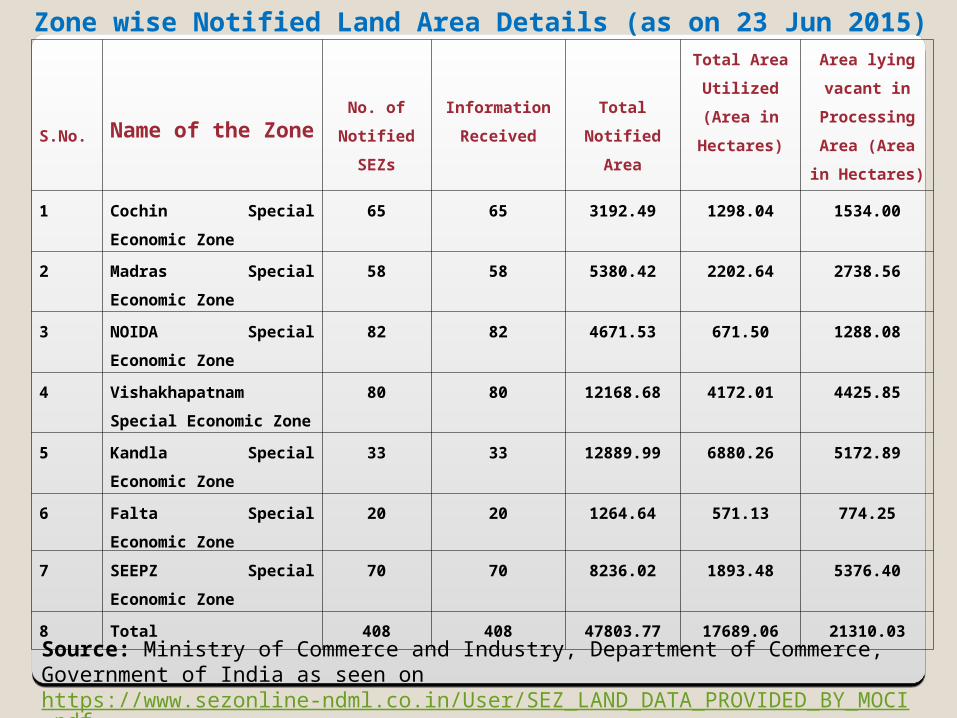
S.No. Name of the ZoneNo. of
Notified
SEZs
Information
Received
Total Notified
Area
Total Area
Utilized
(Area in
Hectares)
Area lying
vacant in
Processing Area
(Area in
Hectares)
1 Cochin Special Economic
Zone
65 65 3192.49 1298.04 1534.00
2 Madras Special Economic
Zone
58 58 5380.42 2202.64 2738.56
3 NOIDA Special Economic
Zone
82 82 4671.53 671.50 1288.08
4 Vishakhapatnam Special
Economic Zone
80 80 12168.68 4172.01 4425.85
5 Kandla Special Economic
Zone
33 33 12889.99 6880.26 5172.89
6 Falta Special Economic Zone 20 20 1264.64 571.13 774.25
7 SEEPZ Special Economic
Zone
70 70 8236.02 1893.48 5376.40
8 Total 408 408 47803.77 17689.06 21310.03
Zone wise Notified Land Area Details (as on 23 Jun 2015)
Source: Ministry of Commerce and Industry, Department of Commerce, Government of India as seen on https://www.sezonline-ndml.co.in/User/SEZ_LAND_DATA_PROVIDED_BY_MOCI.pdf
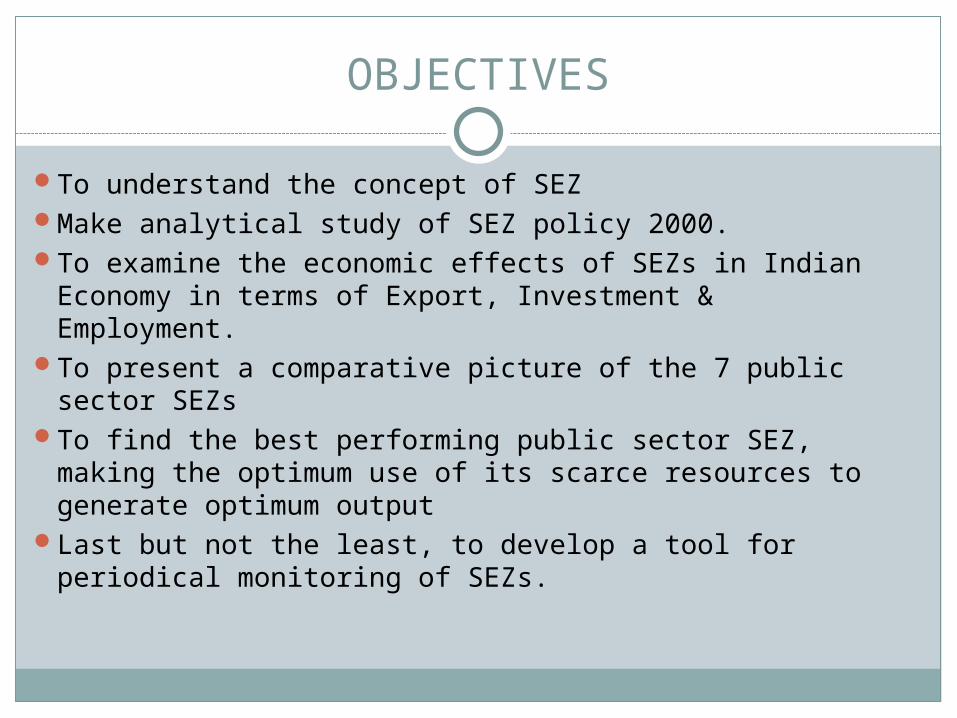
OBJECTIVES
To understand the concept of SEZMake analytical study of SEZ policy 2000.To examine the economic effects of SEZs in Indian
Economy in terms of Export, Investment & Employment.To present a comparative picture of the 7 public sector
SEZsTo find the best performing public sector SEZ, making
the optimum use of its scarce resources to generate optimum output
Last but not the least, to develop a tool for periodical monitoring of SEZs.

RESEARCH QUESTION
Do the Indian SEZs have the potential to optimize their activities for achieving their establishment objectives and act as engines of Economic growth?

RESEARCH METHODOLOGY
In order to make the study more systematic following framework has been adopted.
Sample selection: 7 Central Government SEZs; Purposive Sampling
Period of study: 2005-2006 till 2014-15Statistical tools used in the study: Mean,
Standard Deviation, CAGR, correlation, t- test; f-test; ANOVA;
Quantitative technique: Goal-programming application

Data Collection
a. Development Commissioner’s Office of respective SEZs b. Economic Survey of India. c. Export Import data bank. d. Export Promotion Council for Export Oriented Units (EOUs) and SEZ. e. SEZ and Department of Commerce Website. f. Reserve Bank of India Website. g. Department of Industrial Policy and Promotion Website. h. Journals- Journal of Development Studies, Economic and Political Weekly,
Chartered Accountant, Social Action, Man & Development, Mainstream, Indian Journal of Economics, Third Concept, The Management Accountant, Asian Survey, Indian Management Studies Journal, etc
i. Books– SEZ Manual 2007; Special Economic Zones/EOUs/ EHTPs & STPs- Law & Practice 2008; Special Economic Zones- Issues, Laws and Procedures; Special Economic Zones and the Economic Transition in China; Special
Economic Zones in India- Lesson from China etc.

Limitations of the Study
Confined for the period 2005-2015. Due to the unavailability of data even after applying under the
Right to Information Act (RTI), the researcher was forced to carry out with the available data which ultimately affects involving more number of parameters in measuring the performance of the SEZs.
The involved SEZ were hesitant to provide data which disabled the researcher to collect data beyond the performance indicators or else the study could have involved more number of performance indicators.
Websites related to SEZ is not updated and took many follow ups. Cost-benefit analysis of SEZs could be done but due to non-
availability of cost data, research is limited to performance/benefit analysis only.
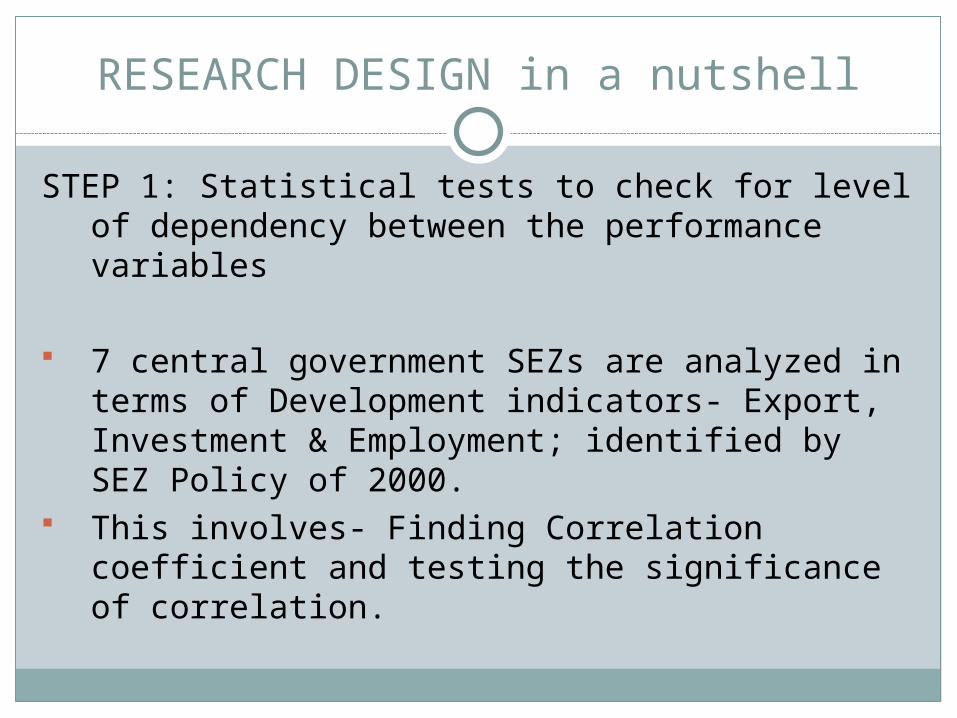
RESEARCH DESIGN in a nutshell
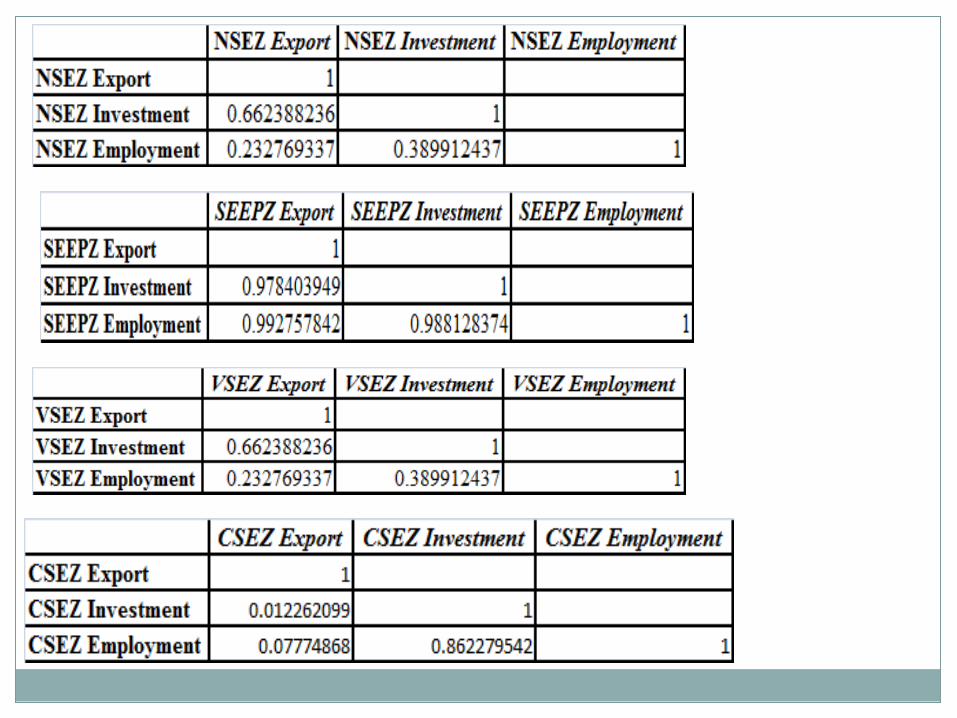
STEP 1: Statistical tests to check for level of dependency between the performance variables
7 central government SEZs are analyzed in terms of Development indicators- Export, Investment & Employment; identified by SEZ Policy of 2000.
This involves- Finding Correlation coefficient and testing the significance of correlation.

HYPOTHESIS
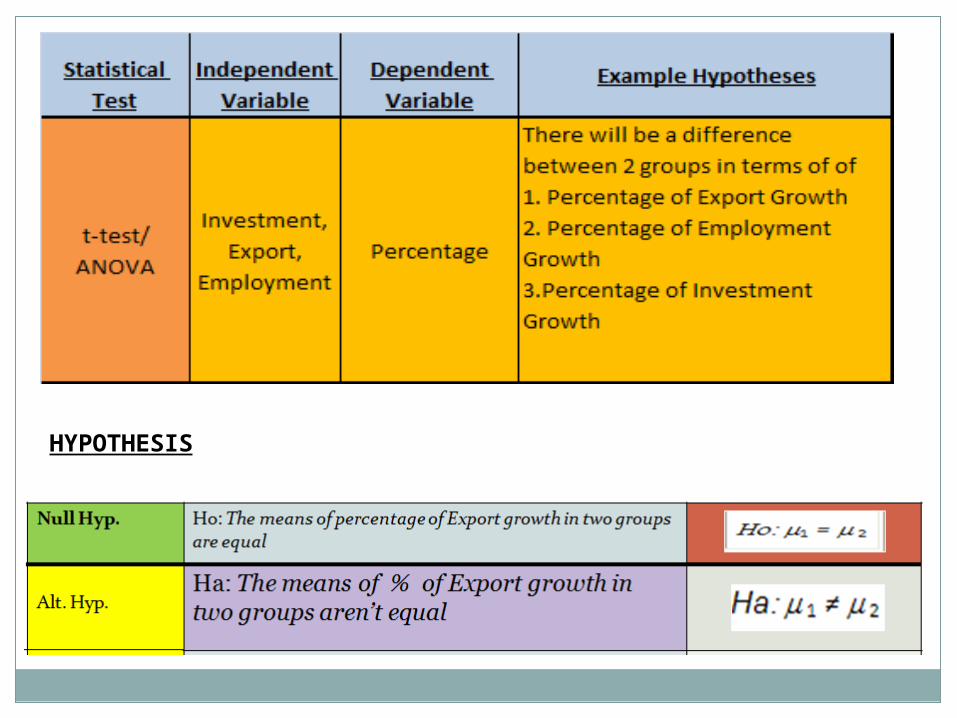
HYPOTHESIS

Inter- region study: Cumulative Indian SEZ in comparison to Indian Scenario Eg ISEZ’s Export- India’s Export ISEZ’s Employment- India’s Employment ISEZ’s Investment- India’s Investment Individual SEZ in comparison to cumulative Indian SEZs Eg- Export of Noida SEZ correlation with- Export of Indian SEZs & Employment of Noida SEZ correlation with- Employment of Indian SEZs Investment of Noida SEZ correlation with- Indian SEZs Investment
Intra- region study: Correlation between Export, Investment & Employment of SEZs- ISEZ
and Public sector SEZs

STEP-2 GOAL PROGRAMMING-Principles
Application of Goal Programming Model
PRINCIPLES OF GOAL PROGRAMMING
Convert Multiple Objective into Single Goal by Minimizing deviations between: Target Values & Realized results i.e.,
o Minimize under or overachievement of target (Minimize d– or d+ as the case may be)
o To understand it more clearly,o Say, x1=1, x2=1 Then obviously, x1 + x2 = 2o However, if the Goal is to make x1 + x2 =1, we add a
negative quantity d- (called deviation variable d-), with a value of -1, and re-write the equation as, x1 + x2 + d- = 1 then the equation is satisfied.

GOAL PROGRAMMING-Data Preparation
PERFORMANCE OF SEZ FROM 2005-2006 TO 2014-2015
S E Z-
DECISION VARIABLE-
SANTACRUZ
X 1
VIZAG
X 2
COCHIN
X 3
FALTA
X 4
KANDLA
X 5
MADRAS
X 6
NOIDA
X 7Export Sum Total of 10 years (2005-2006 TO 2014-2015), Rs Crore
258449.97 14958.22 121331.27 10730.332 25036.28 58974 84078.932
Investment Sum Total of last 10 years (2005-2006 TO 2014-2015), Rs Crore 191311.61 7868.49 5071.69 2289.41 5204.99 22635 89325.44
Employment in 10th year (2014-2015), No. 360571 4647 23152 11546 25759 42197 47715
Problem StatementThe study is about selecting or rejecting a SEZ based on its overall performance i.e. Maximum of cumulative Export is attained with Minimum Investment yielding a Maximum Employment at the end of 10th year.

GOAL PROGRAMMING-Formulation
If, X1, X2 …. = 0, the Equations are satisfied If, X1, X2 …. = 1, the Equations are not satisfied 258449.97 X1 + 14958.22 X2 + 121331.27 X3 +
10730.332 X4 + 25036.28 X5 + 58974 X6 + 84078.932 X7 = 0
191311.61X1 + 7868.49X2 + 5071.69X3 + 2289.41X4 + 5204.99X5 + 22635 X6 + 89325.44X7 = 0
360571X1 + 4647X2 + 23152X3 + 11546X4 + 25759X5 + 42197 X6 + 47715X7 = 0
In every Eqns, how to have one Xi=1 and rest as “0” ?

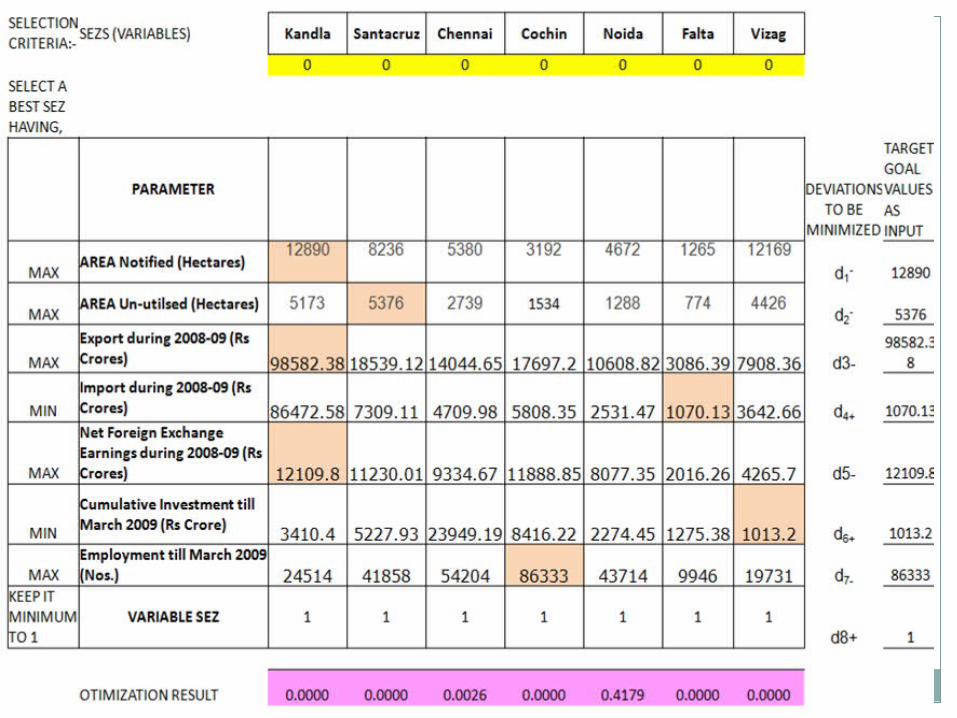
GOAL PROGRAMMING-Output
+ve / -ve
SELECTION CRITERIAPERFORMANCE MEASUREVIZAG COCHIN SANTACRUZ
FALTA KANDLA MADRAS NOIDAINITIAL INPUT
CHOOSE ANY 1 Available SEZs 1 1 1 1 1 1 1 0 = 1MAXIMUM EXPORT
Export Sum Total of last 5 years, Rs Crore
10,973.57 86,438.85 205,338.29 6,020.11 16,026.77 41,873.00 47,626.76 0=
205,338.29
MINIMUM INVESTMENT
Investment Sum Total of last 5 years, Rs Crore
5,507.82 3,069.90 158,583.32 567.79 2,730.69 11,309.00 53,316.44 0=
567.79
MAXIMUM EMPLOYMENT
Employment in 5th year, No. 22,738.00 87,367.00 1,321,919.00 55,561.00 117,914.00 197,183.00 254,739.00 0
=1,321,919.00
INPUT DATA TABLESEZ Options (DECISION VARIABLES)
TARGET (RHS)CONSTRAIN
ING RELATION
OBJECTIVE FUNCTION
MINIMIZE ALL DEVIATION VARIABLES
1465676.2TARGET CELL
SOLUTION TO PROBLEM VIZAG COCHIN SANTACR
UZ FALTA KANDLA MADRAS NOIDA
INITIAL INPUT 0 0 0 0 0 0 0FINAL OPTIMAL OUTPUT 0.0000 0.0000 0.0000 1.0000 0.0000 0.0000 0.0000
SELECTED

OUTPUT


CONCLUSION
Strengthen the Overall Best performing Zone- Noida and keeping it as BENCHMARK strengthen other SEZs for Balanced growth of Regions
Holistic approach of Land Allotment (Ref:Table). Vacant un-utilised Land may be re-allotted to better performing sectors
Ensures Pragmatic approach by Central & State Governments
Assessment of Opportunity Cost to Primary Sector