
Sex-Disaggregated Household Survey Data and Progress on SDGs 1.4 and 5a (Talip Kilic, World Bank)
27
Sex-Disaggregated Household Survey Data and Progress on SDGs 1.4 and 5a Talip Kilic Senior Economist & Head of Survey Methods Team Survey Unit & Rome Center for Development Data Development Data Group, The World Bank Expert Consultation on “Methodology for an Information System on Rural Livelihoods and Sustainable Development Goals Indicators on Smallholder Productivity and Income FAO Headquarters – Rome, Italy, November 7, 2016
-
Upload
externalevents -
Category
Education
-
view
27 -
download
1
Transcript of Sex-Disaggregated Household Survey Data and Progress on SDGs 1.4 and 5a (Talip Kilic, World Bank)
Sex-Disaggregated Household Survey Data and Progress on SDGs 1.4 and 5a
Talip KilicSenior Economist & Head of Survey Methods Team Survey Unit & Rome Center for Development Data
Development Data Group, The World Bank
Expert Consultation on “Methodology for an Information System on Rural Livelihoods and Sustainable Development
Goals Indicators on Smallholder Productivity and Income FAO Headquarters – Rome, Italy, November 7, 2016
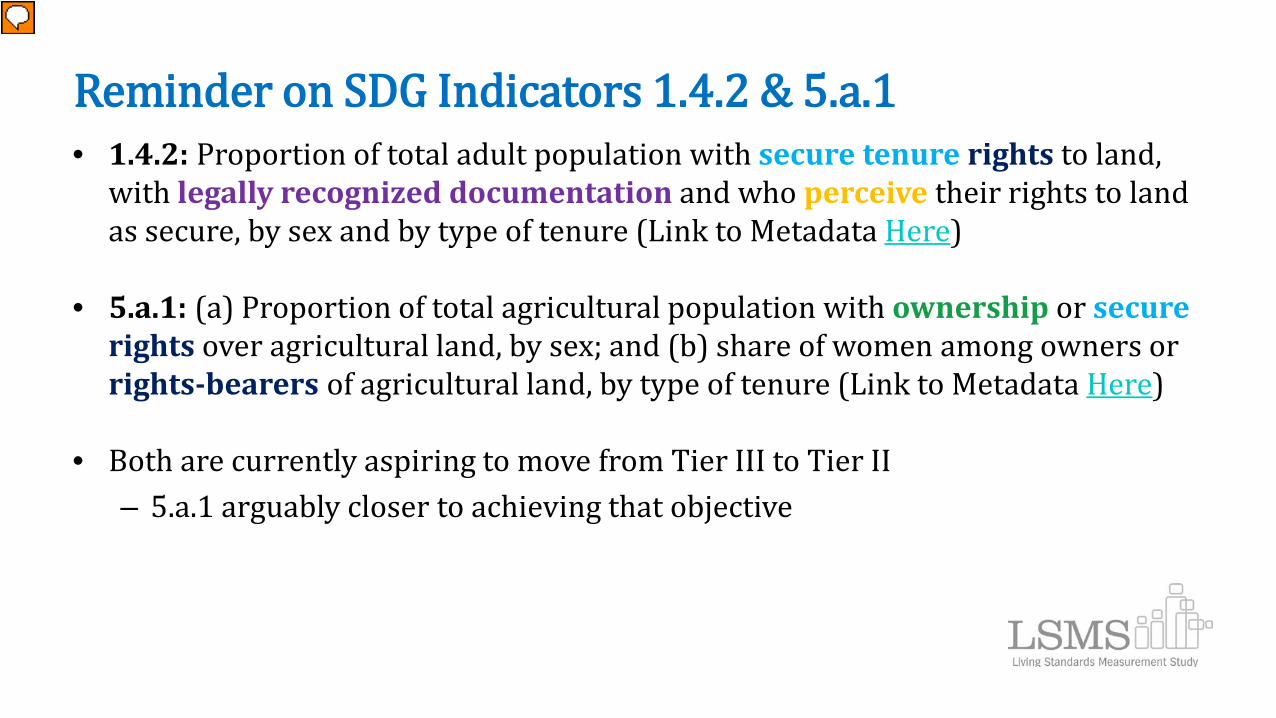
Reminder on SDG Indicators 1.4.2 & 5.a.1• 1.4.2: Proportion of total adult population with secure tenure rights to land,
with legally recognized documentation and who perceive their rights to land as secure, by sex and by type of tenure (Link to Metadata Here)
• 5.a.1: (a) Proportion of total agricultural population with ownership or securerights over agricultural land, by sex; and (b) share of women among owners or rights-bearers of agricultural land, by type of tenure (Link to Metadata Here)
• Both are currently aspiring to move from Tier III to Tier II– 5.a.1 arguably closer to achieving that objective
Presenter
Presentation Notes
SDG 1.4: By 2030, ensure that all men and women, in particular the poor and the vulnerable, have equal rights to economic resources, as well as access to basic services, ownership and control over land and other forms of property, inheritance, natural resources, appropriate new technology and financial services, including microfinance SDG 5.a: Undertake reforms to give women equal rights to economic resources, as well as access to ownership and control over land and other forms of property, financial services, inheritance and natural resources, in accordance with national laws Legally recognized documentation: The most common type of such documentation are ownership documents (titles or deeds) issued by a government institution. Other types of documents (tax receipts, utility bills, private contracts confer legal recognition in the sense that they can be used as evidence of rights in a court of law. This implies that a continuum of documentary evidence needs to be recognized. For purposes of constructing the indicator, reference will be made to formal and informal documents - the former to be obtained from administrative records and the latter from household surveys that are cross-checked with formal records. Country-specific notes can provide a more detailed explanation on the types of documents. Tenure security: All forms of tenure should provide all persons with a degree of tenure security, with states protecting legitimate tenure rights, and ensuring that people are not arbitrarily evicted and that their legitimate tenure rights are not otherwise extinguished or infringed. Secure tenure rights: Secure tenure rights are use or ownership rights to land that are legally recognized, even if not a formal document is not issued, customary rights being the most prominent example and it does not require ownership (i.e. long term leases or short term ones that are routinely renewed as well as group rights qualify). Security implies that an individual cannot be deprived of his or her land rights involuntarily. This normally requires that duration, subject, and object of rights are clearly defined. For the latter, physical markers or a map or sketch (not necessarily a high precision survey) that shows the parcel’s position relative to others is normally needed. Perceived security of tenure: We define perceptions of tenure to be secure if individual or households do not feel a threat of being deprived of legitimately acquired use or ownership rights to land or of these rights being disputed by others (either the Government of individuals). Perceived security is important in settings where formal documentation does not exist or where, largely due to gaps in institutional quality or the transparency with which land records are administered, formal documents may not increase tenure security. It is thus an important complement to the above indicator with recognition that methodological study of the extent to which perceptions can be captured will be desirable.

On Individual-Level Data• World Bank Commitments to 2016-2030 Global Household Survey Agenda
– Support 78 IDA countries to produce an LSMS-style household survey every 3 years– Specific IDA18 Commitment: Support 6 countries in producing intra-household, individual-
level survey data on employment, entrepreneurship and asset ownership• Acute gaps in individual data & survey methods in three dimensions of economic opportunity:
Employment, Entrepreneurship, Asset Ownership• Disconnect between current commitments & available (methodological, human & financial)
resources for countries & technical assistance providers• Requirements for improving availability & quality of individual-level data
– Resources for data production & technical assistance – Resources for methodological research & setting of statistical standards – Partnerships among countries, international agencies
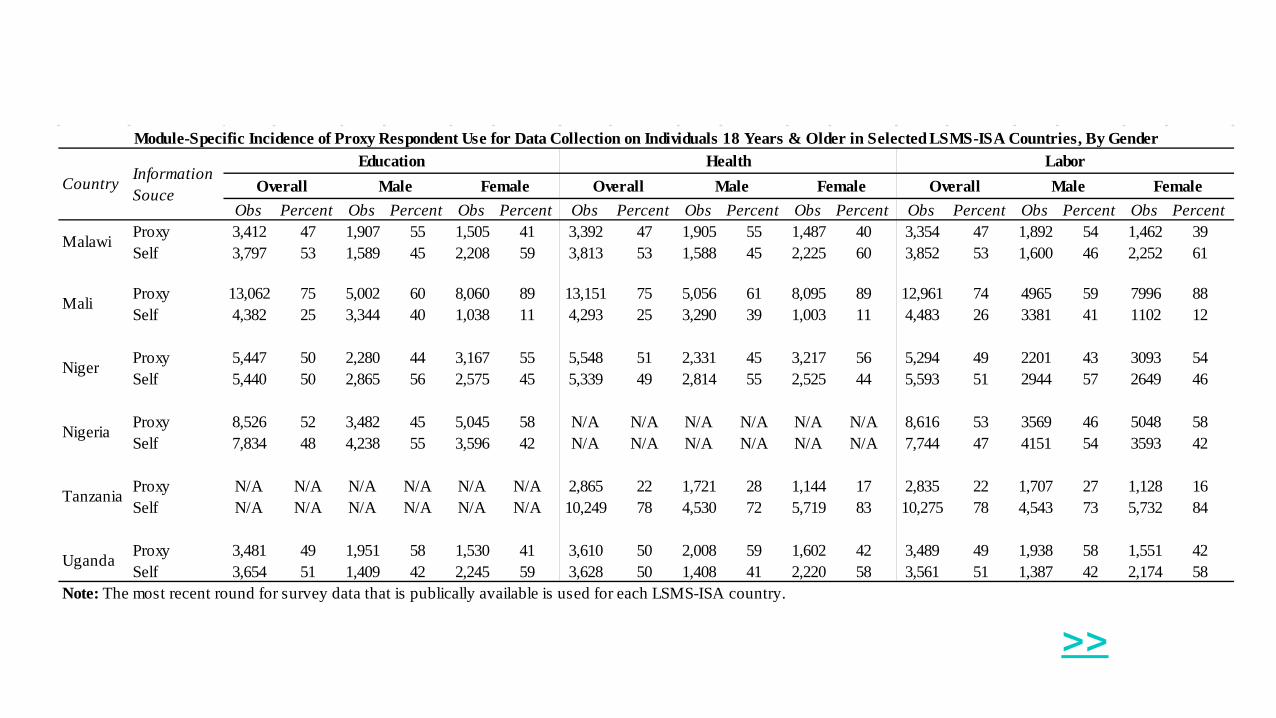
Obs Percent Obs Percent Obs Percent Obs Percent Obs Percent Obs Percent Obs Percent Obs Percent Obs PercentProxy 3,412 47 1,907 55 1,505 41 3,392 47 1,905 55 1,487 40 3,354 47 1,892 54 1,462 39Self 3,797 53 1,589 45 2,208 59 3,813 53 1,588 45 2,225 60 3,852 53 1,600 46 2,252 61
Proxy 13,062 75 5,002 60 8,060 89 13,151 75 5,056 61 8,095 89 12,961 74 4965 59 7996 88Self 4,382 25 3,344 40 1,038 11 4,293 25 3,290 39 1,003 11 4,483 26 3381 41 1102 12
Proxy 5,447 50 2,280 44 3,167 55 5,548 51 2,331 45 3,217 56 5,294 49 2201 43 3093 54Self 5,440 50 2,865 56 2,575 45 5,339 49 2,814 55 2,525 44 5,593 51 2944 57 2649 46
Proxy 8,526 52 3,482 45 5,045 58 N/A N/A N/A N/A N/A N/A 8,616 53 3569 46 5048 58Self 7,834 48 4,238 55 3,596 42 N/A N/A N/A N/A N/A N/A 7,744 47 4151 54 3593 42
Proxy N/A N/A N/A N/A N/A N/A 2,865 22 1,721 28 1,144 17 2,835 22 1,707 27 1,128 16Self N/A N/A N/A N/A N/A N/A 10,249 78 4,530 72 5,719 83 10,275 78 4,543 73 5,732 84
Proxy 3,481 49 1,951 58 1,530 41 3,610 50 2,008 59 1,602 42 3,489 49 1,938 58 1,551 42Self 3,654 51 1,409 42 2,245 59 3,628 50 1,408 41 2,220 58 3,561 51 1,387 42 2,174 58
Niger
Nigeria
Tanzania
Uganda
Note: The most recent round for survey data that is publically available is used for each LSMS-ISA country.
Malawi
Mali
Overall Male FemaleLabor
Overall Male Female
Module-Specific Incidence of Proxy Respondent Use for Data Collection on Individuals 18 Years & Older in Selected LSMS-ISA Countries, By Gender
Country Information Souce
Education HealthOverall Male Female
>>
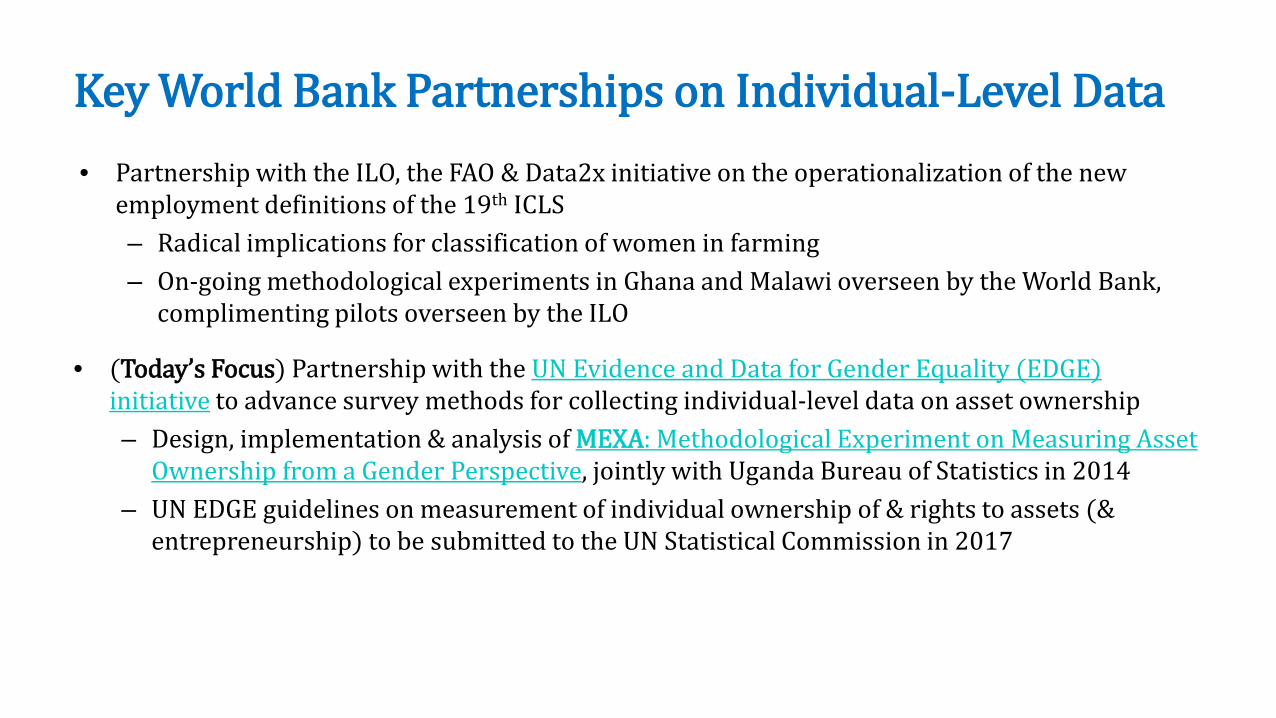
• Partnership with the ILO, the FAO & Data2x initiative on the operationalization of the new employment definitions of the 19th ICLS– Radical implications for classification of women in farming– On-going methodological experiments in Ghana and Malawi overseen by the World Bank,
complimenting pilots overseen by the ILO
• (Today’s Focus) Partnership with the UN Evidence and Data for Gender Equality (EDGE) initiative to advance survey methods for collecting individual-level data on asset ownership– Design, implementation & analysis of MEXA: Methodological Experiment on Measuring Asset
Ownership from a Gender Perspective, jointly with Uganda Bureau of Statistics in 2014– UN EDGE guidelines on measurement of individual ownership of & rights to assets (&
entrepreneurship) to be submitted to the UN Statistical Commission in 2017
Key World Bank Partnerships on Individual-Level Data
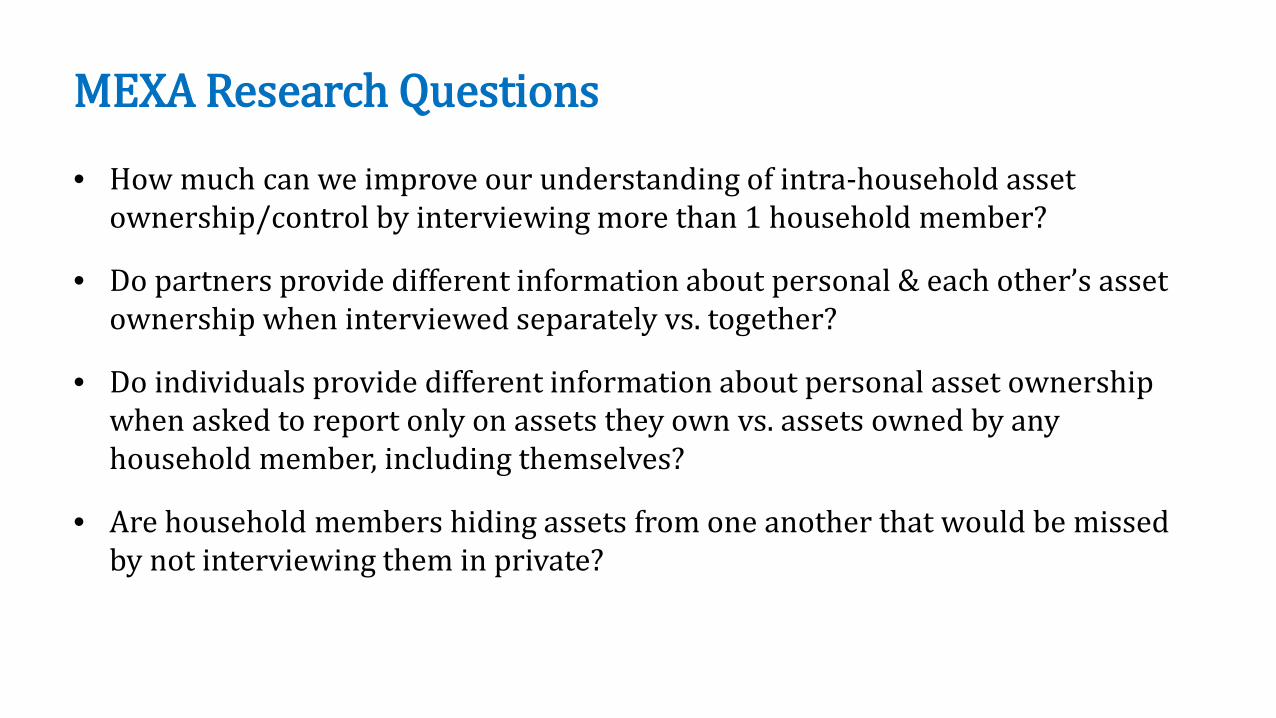
MEXA Research Questions
• How much can we improve our understanding of intra-household asset ownership/control by interviewing more than 1 household member?
• Do partners provide different information about personal & each other’s asset ownership when interviewed separately vs. together?
• Do individuals provide different information about personal asset ownership when asked to report only on assets they own vs. assets owned by any household member, including themselves?
• Are household members hiding assets from one another that would be missed by not interviewing them in private?
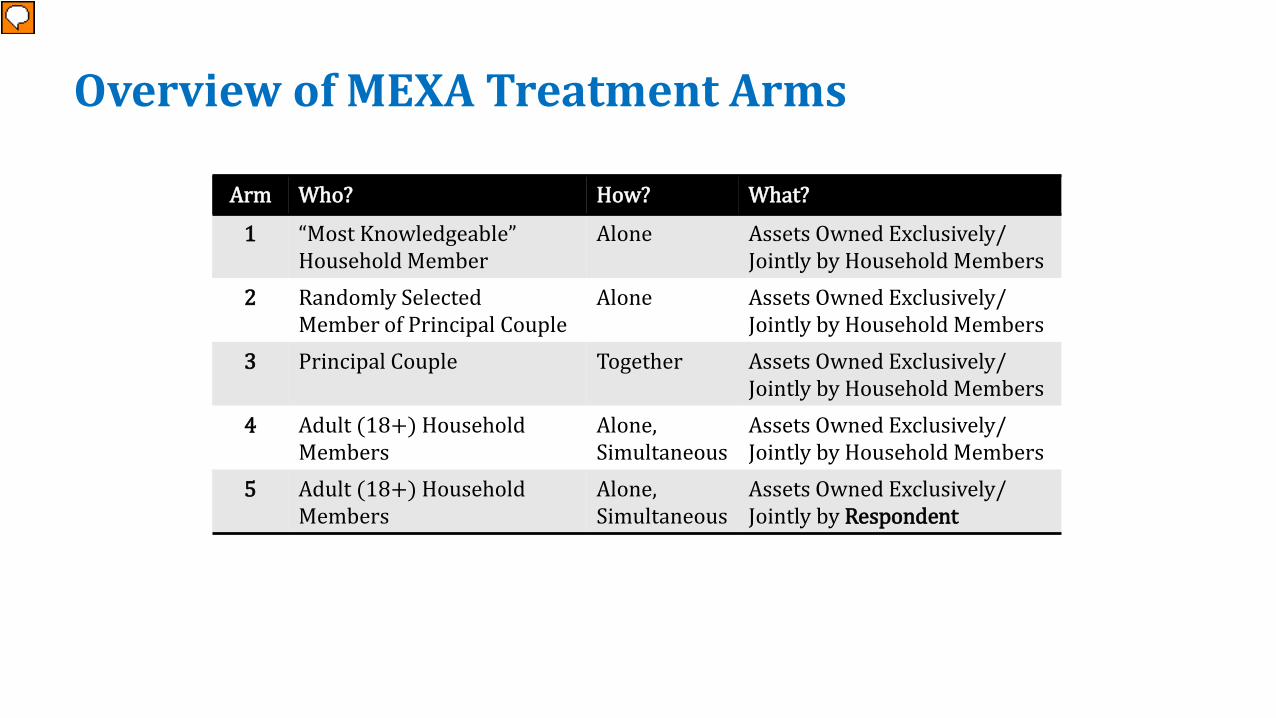
Overview of MEXA Treatment Arms
Arm Who? How? What?
1 “Most Knowledgeable”Household Member
Alone Assets Owned Exclusively/ Jointly by Household Members
2 Randomly Selected Member of Principal Couple
Alone Assets Owned Exclusively/ Jointly by Household Members
3 Principal Couple Together Assets Owned Exclusively/ Jointly by Household Members
4 Adult (18+) Household Members
Alone, Simultaneous
Assets Owned Exclusively/ Jointly by Household Members
5 Adult (18+) Household Members
Alone, Simultaneous
Assets Owned Exclusively/Jointly by Respondent
Presenter
Presentation Notes
The review of the survey instruments and protocols linked to the Gender Asset Gap Project, Women’s Empowerment in Agriculture Index (WEAI), Demographic and Health Surveys, and Living Standards Measurement Study – Integrated Surveys on Agriculture (LSMS-ISA) initiative was important for distilling the prominent approaches to respondent selection in household surveys across the developing world.
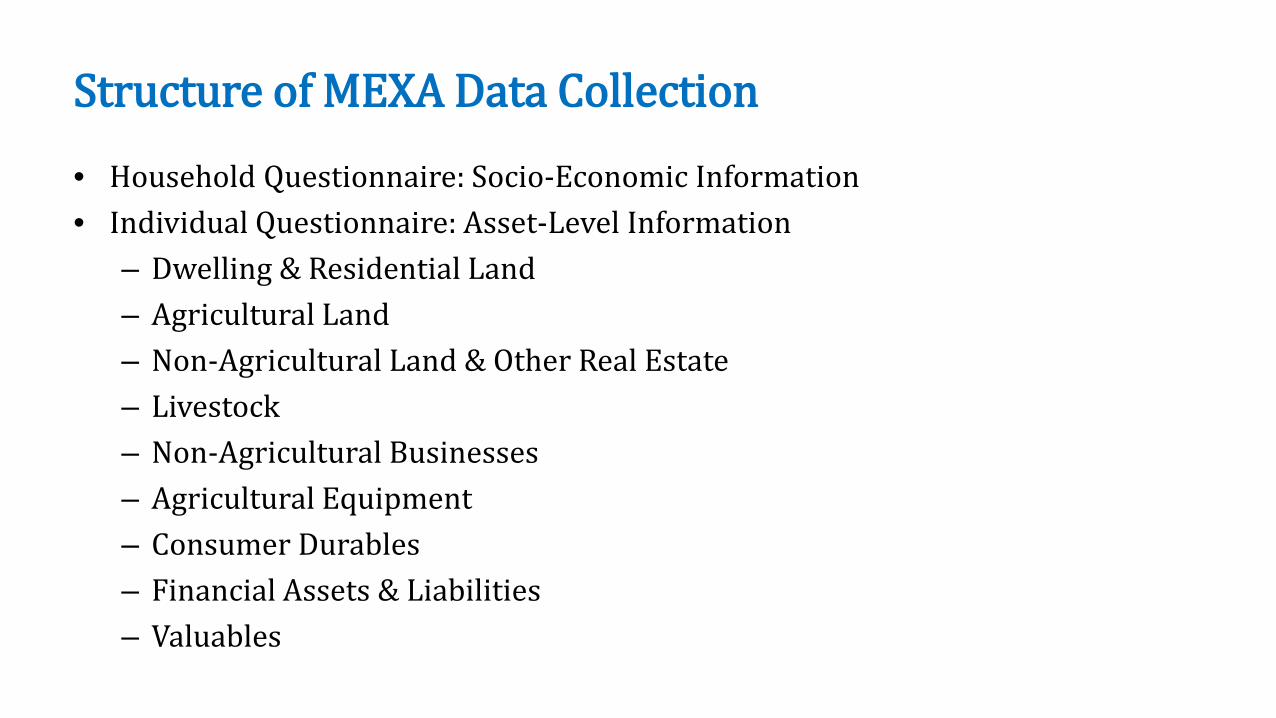
Structure of MEXA Data Collection
• Household Questionnaire: Socio-Economic Information• Individual Questionnaire: Asset-Level Information
– Dwelling & Residential Land– Agricultural Land– Non-Agricultural Land & Other Real Estate– Livestock – Non-Agricultural Businesses – Agricultural Equipment– Consumer Durables– Financial Assets & Liabilities– Valuables
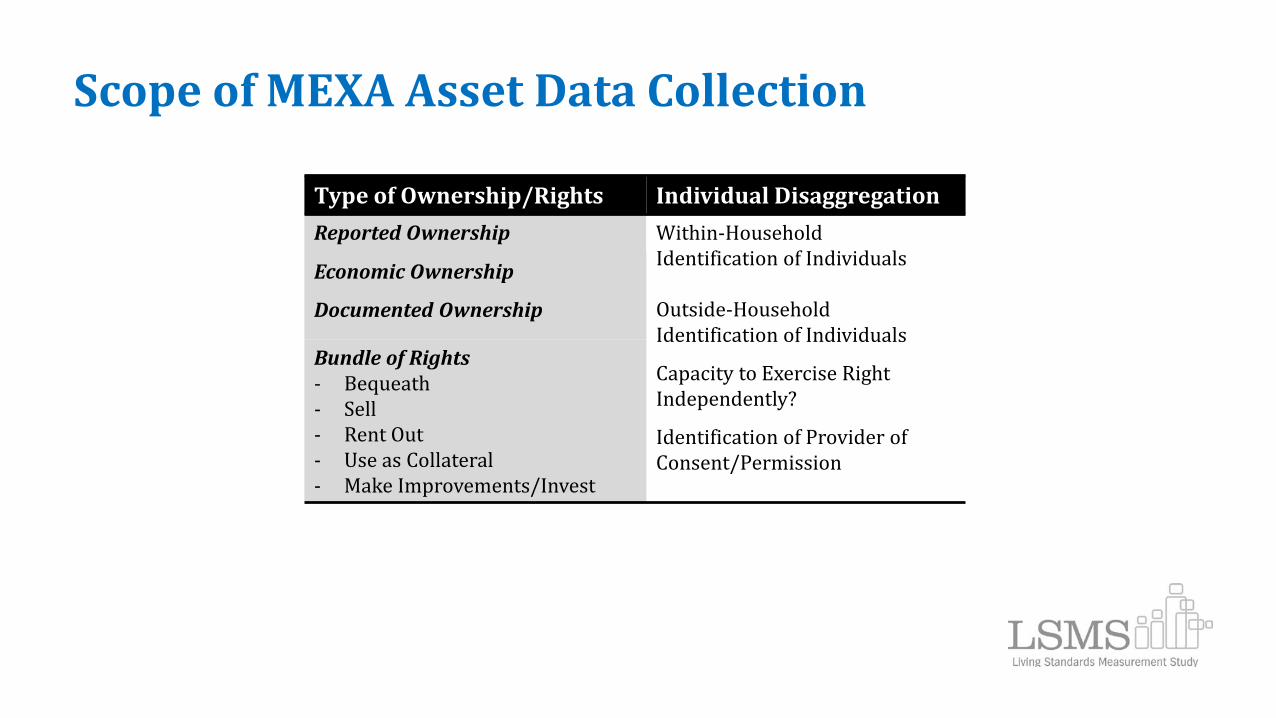
Scope of MEXA Asset Data Collection
Type of Ownership/Rights Individual DisaggregationReported Ownership Within-Household
Identification of Individuals
Outside-Household Identification of Individuals
Capacity to Exercise RightIndependently?
Identification of Provider of Consent/Permission
Economic Ownership
Documented Ownership
Bundle of Rights- Bequeath- Sell- Rent Out- Use as Collateral- Make Improvements/Invest
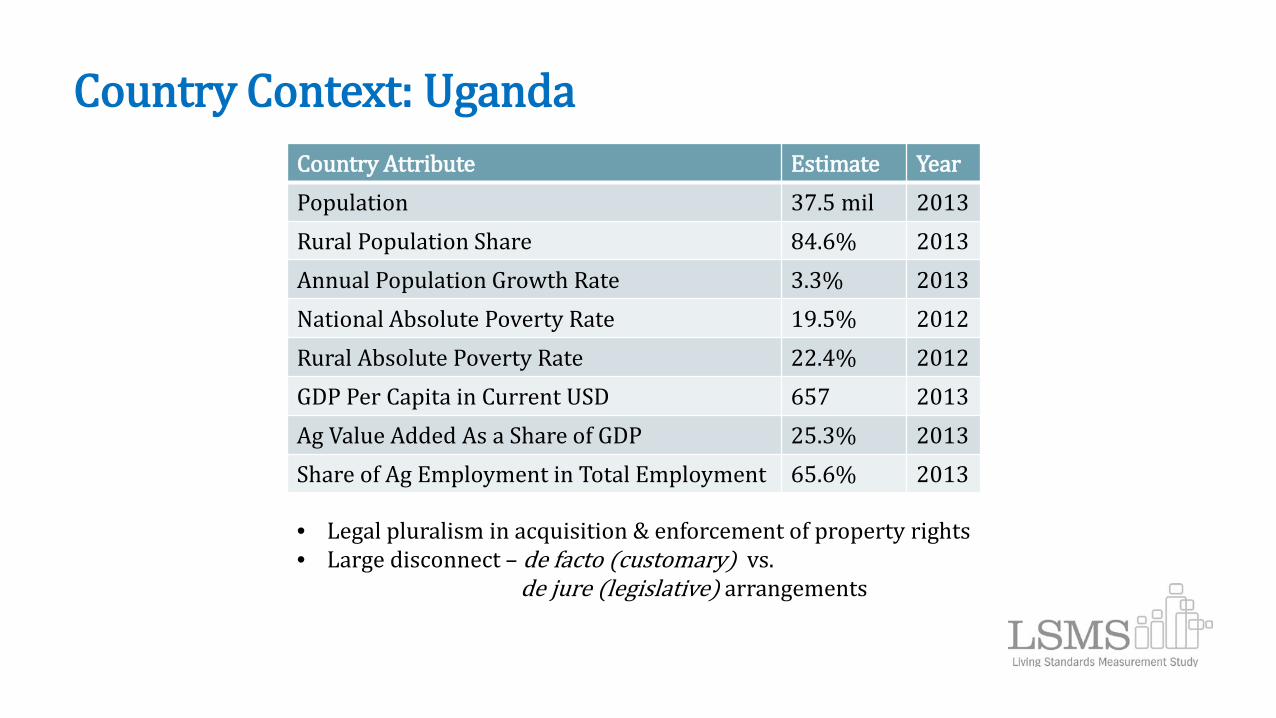
Country Context: UgandaCountry Attribute Estimate YearPopulation 37.5 mil 2013Rural Population Share 84.6% 2013Annual Population Growth Rate 3.3% 2013National Absolute Poverty Rate 19.5% 2012Rural Absolute Poverty Rate 22.4% 2012GDP Per Capita in Current USD 657 2013Ag Value Added As a Share of GDP 25.3% 2013Share of Ag Employment in Total Employment 65.6% 2013
• Legal pluralism in acquisition & enforcement of property rights• Large disconnect – de facto (customary) vs.
de jure (legislative) arrangements
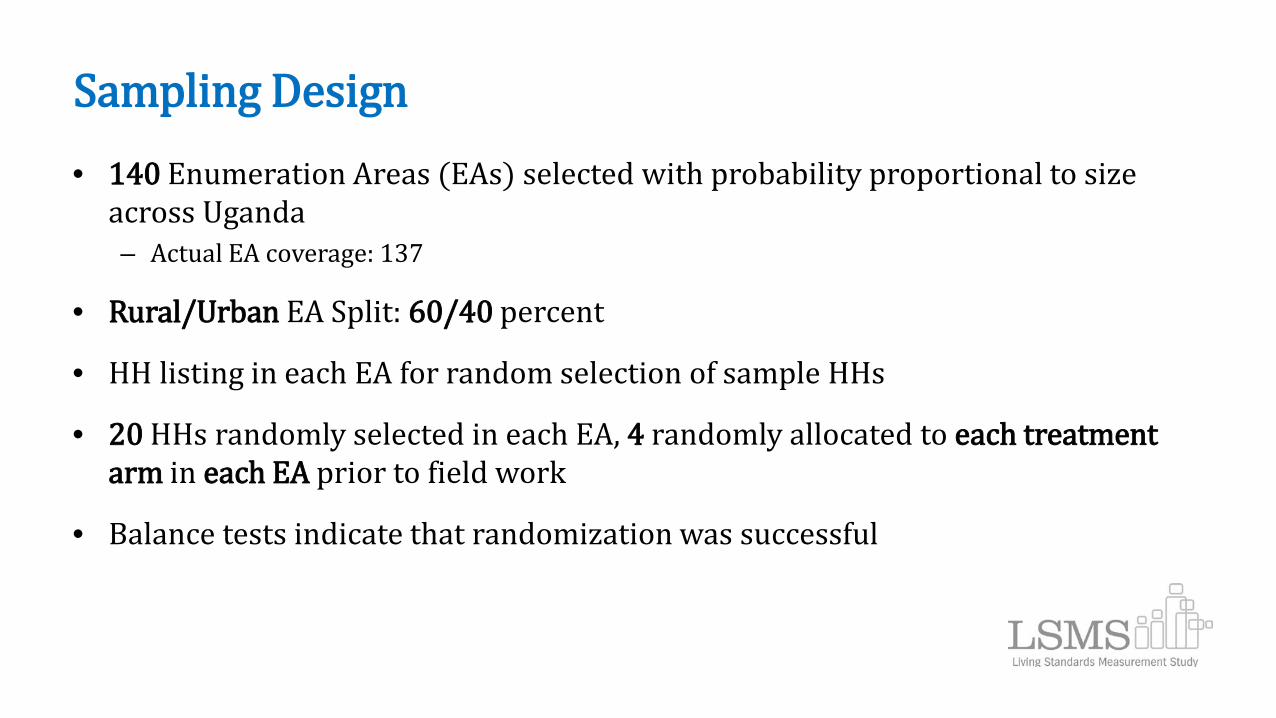
Sampling Design• 140 Enumeration Areas (EAs) selected with probability proportional to size
across Uganda– Actual EA coverage: 137
• Rural/Urban EA Split: 60/40 percent
• HH listing in each EA for random selection of sample HHs
• 20 HHs randomly selected in each EA, 4 randomly allocated to each treatment arm in each EA prior to field work
• Balance tests indicate that randomization was successful

Headline MEXA Findings• See Kilic, T, and Moylan, H. (2016). “Methodological Experiment on Measuring Asset Ownership
from a Gender Perspective (MEXA): Technical Report” Washington, DC: World Bank for details.
• #1: Both female & male adults more inclusive in their reporting on reported/economic/documented asset ownership among adults of the opposite sex in Arm 4 vis-à-vis Arm 1
– #2: Headline finding #1 is anchored in two discoveries• Positive, large & significant Arm 4 effects in priority asset classes only present in the pooled data,
vanish in the analysis of the respondent data• Non-ignorable share female & male respondents in Arm 4 identified as owners/right holders by others
in the same household when they report themselves without ownership/specific rights
Presenter
Presentation Notes
Findings 1 & 2 hold true for priority asset classes of dwelling, agricultural land, livestock and financial accounts.

Headline MEXA Findings (2)– #3: Questionnaire design has a bearing on respondents’ reporting regarding personal ownership
of & rights to assets• Neither male nor female respondents in Arm 4 are more likely to tag themselves as owners/right
holders compared to Arms 1–3 • Large gains in ownership indicators for female respondents (& to a lesser extent male respondents) in
Arm 5 compared to Arms 1–4
• #4: Share of self-reported male owners with each right is substantially higher than share of self-reported female owners with that right
• #5: No statistically significant effects of Arm 2, irrespective of pooled vs. respondent data analysis, priority asset class or outcome variable
• #6: Arm 3 exerts statistically significant positive effects only in pooled data, on overall & joint dwelling & livestock reported ownership
Presenter
Presentation Notes
#3: Remind the questionnaire design difference between Arm 1-4 versus Arm 5. #4: Note that the finding holds true for both exclusive and joint reported and economic ownership, & does not exhibit variation by priority asset class or treatment arm.

MEXA Recommendations• For collecting intra-household information on individuals ownership of & rights
to assets: Implement Arm 5!– Reduce the reliance on a single respondent, notably the so-called most knowledgeable
household member– Interview multiple age-eligible individuals per household– Probe directly & solely regarding respondents’ personal ownership of & rights to assets
• Individual interviews would alleviate distortionary proxy respondent effects more broadly: education, health, employment, food insecurity,…
• But… there are outstanding methodological research questions
Presenter
Presentation Notes
Implementing Arm 5 minimizes the extent to which intra-household discrepancies exist, eliminates distortionary proxy respondent effects on the treatment of respondents’ own assessment of personal ownership, and reveals hidden assets, if any.
[1] [2] [3] [4] [5] [6] [6]-[3]Female Male Dif Female Male Dif
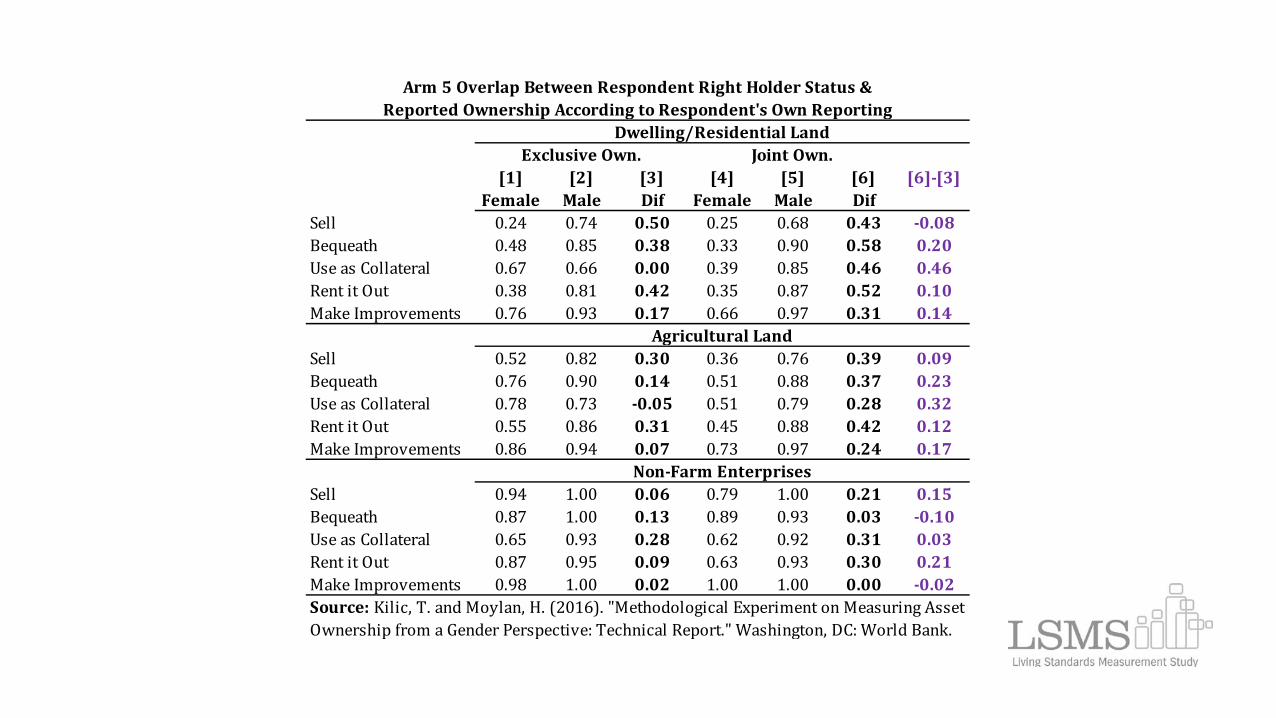
Sell 0.24 0.74 0.50 0.25 0.68 0.43 -0.08Bequeath 0.48 0.85 0.38 0.33 0.90 0.58 0.20Use as Collateral 0.67 0.66 0.00 0.39 0.85 0.46 0.46Rent it Out 0.38 0.81 0.42 0.35 0.87 0.52 0.10Make Improvements 0.76 0.93 0.17 0.66 0.97 0.31 0.14
Sell 0.52 0.82 0.30 0.36 0.76 0.39 0.09Bequeath 0.76 0.90 0.14 0.51 0.88 0.37 0.23Use as Collateral 0.78 0.73 -0.05 0.51 0.79 0.28 0.32Rent it Out 0.55 0.86 0.31 0.45 0.88 0.42 0.12Make Improvements 0.86 0.94 0.07 0.73 0.97 0.24 0.17
Sell 0.94 1.00 0.06 0.79 1.00 0.21 0.15Bequeath 0.87 1.00 0.13 0.89 0.93 0.03 -0.10Use as Collateral 0.65 0.93 0.28 0.62 0.92 0.31 0.03Rent it Out 0.87 0.95 0.09 0.63 0.93 0.30 0.21Make Improvements 0.98 1.00 0.02 1.00 1.00 0.00 -0.02Source: Kilic, T. and Moylan, H. (2016). "Methodological Experiment on Measuring Asset Ownership from a Gender Perspective: Technical Report." Washington, DC: World Bank.
Agricultural Land
Non-Farm Enterprises
Dwelling/Residential Land
Arm 5 Overlap Between Respondent Right Holder Status & Reported Ownership According to Respondent's Own Reporting
Exclusive Own. Joint Own.

How to Operationalize?
• Operationalization of recommendations not out of reach given constraints shared by MEXA & other HH surveys
• Key requirements: – Careful questionnaire design & piloting– Sensitization of field staff & communities– Agile, gender-balanced, mobile teams– Re-thinking fieldwork management, scheduling interviews– Enabling asset: CAPI (Survey Solutions)
• Arm 5 implementation unit cost per household is 31 percent higher than the comparable figure in Arm 1, but cost cutting measures exist
Presenter
Presentation Notes
The strength of the relative cost calculations is not only anchored in the detailed budget and paradata that are available to us but also feeds off of the MEXA design in the sense that there was a sample of households in each EA that was subject to each of the five survey treatments, and that the field teams were instructed to cover all households in a given EA within a rather inflexible timeline. The latter practice mirrors the approach to other multi-topic household surveys in Uganda that would be candidates for the operationalization of the recommendations. Critical to the calculations of implementation unit costs is the calculation of the augmented total burden for each treatment arm, which takes into account (1) the sum of all household and individual interview durations in each treatment arm, (2) the average within-EA day spread between the start and end of all interviews associated with the households sampled for a specific treatment arm, and (3) the treatment arm specific percentage shortfall in the number of households with respect to the non-response adjusted expectations prior to the start of the fieldwork. The second adjustment is meant to capture the within-EA, across-arm heterogeneity in the effort exerted by the enumerators to schedule the necessary household and individual interviews within the more or less fixed timeline that each team was given to cover each EA in order to complete the MEXA fieldwork in time for the 2014 National Population and Housing Census. The third adjustment recognizes the across-arm heterogeneity in the “sunk costs” associated with the time spent with the non-responding households during the enumerators’ unsuccessful attempts to sensitize them and secure their participation in the survey. Cost cutting measures: 1 - Creation of a household inventory of assets, as opposed to independent inventories that are created by each interviewee. 2- Limiting the focus of the work to the priority assets that are covered as part of the MEXA analysis (i.e. shortening the questionnaire.
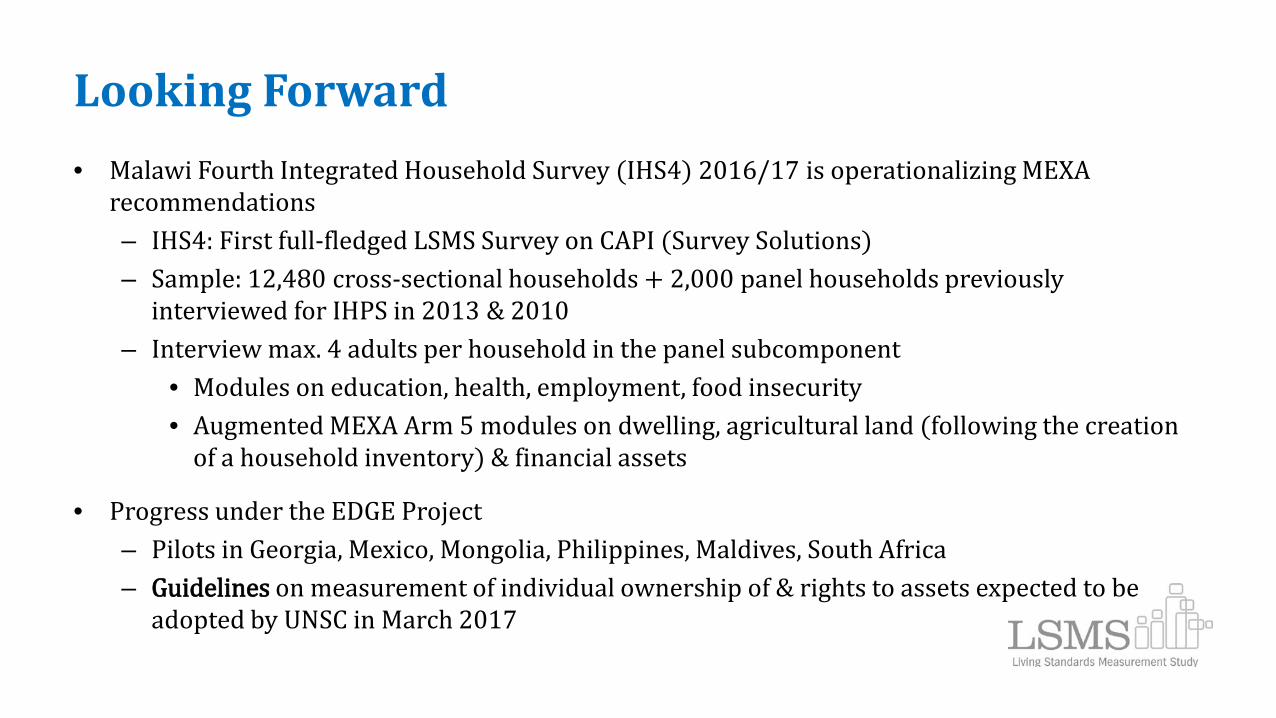
Looking Forward• Malawi Fourth Integrated Household Survey (IHS4) 2016/17 is operationalizing MEXA
recommendations– IHS4: First full-fledged LSMS Survey on CAPI (Survey Solutions) – Sample: 12,480 cross-sectional households + 2,000 panel households previously
interviewed for IHPS in 2013 & 2010– Interview max. 4 adults per household in the panel subcomponent
• Modules on education, health, employment, food insecurity • Augmented MEXA Arm 5 modules on dwelling, agricultural land (following the creation
of a household inventory) & financial assets
• Progress under the EDGE Project – Pilots in Georgia, Mexico, Mongolia, Philippines, Maldives, South Africa– Guidelines on measurement of individual ownership of & rights to assets expected to be
adopted by UNSC in March 2017
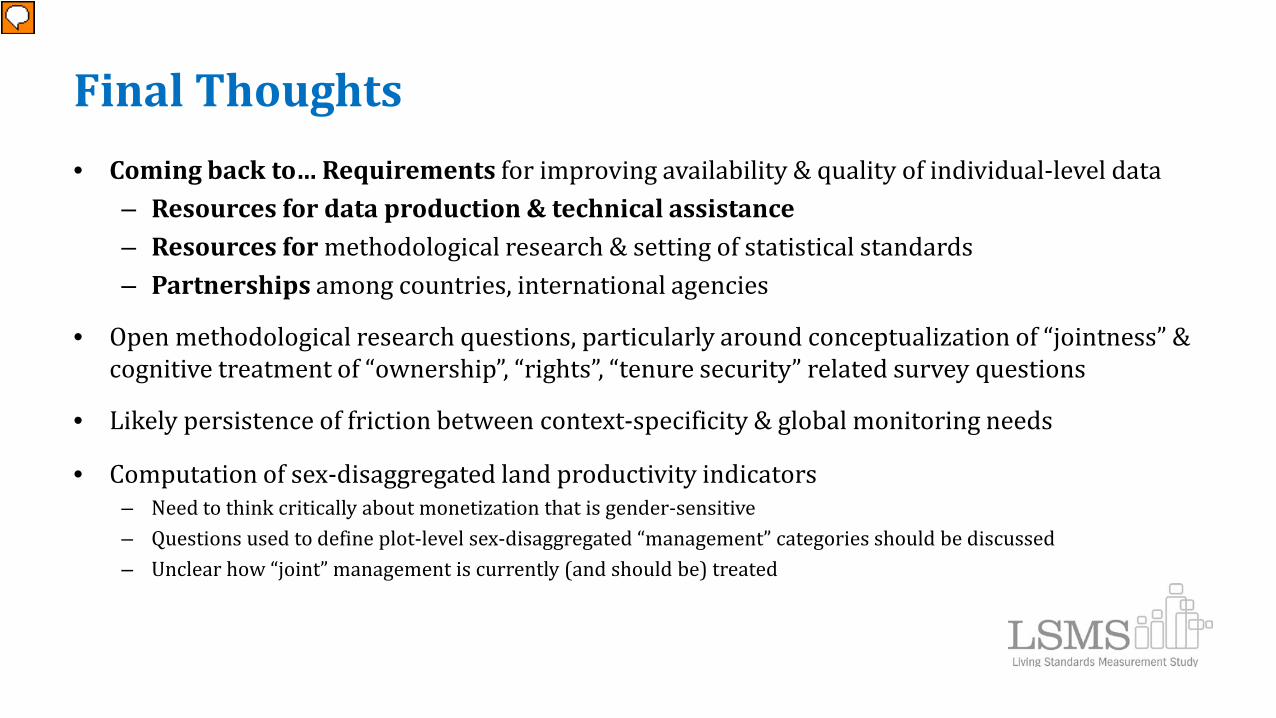
Final Thoughts• Coming back to… Requirements for improving availability & quality of individual-level data
– Resources for data production & technical assistance – Resources for methodological research & setting of statistical standards – Partnerships among countries, international agencies
• Open methodological research questions, particularly around conceptualization of “jointness” & cognitive treatment of “ownership”, “rights”, “tenure security” related survey questions
• Likely persistence of friction between context-specificity & global monitoring needs
• Computation of sex-disaggregated land productivity indicators– Need to think critically about monetization that is gender-sensitive– Questions used to define plot-level sex-disaggregated “management” categories should be discussed– Unclear how “joint” management is currently (and should be) treated
Presenter
Presentation Notes
Further methodological research will vary by indicator but open research questions exist, particularly around how “jointness” is tackled in household surveys. On partnerships, talk about World Bank Commitment to the Global Household Survey Agenda, GRAINS,
Sex-Disaggregated Household Survey Data and Progress on SDGs 1.4 and 5a
Talip KilicSenior Economist & Head of Survey Methods Team Survey Unit & Rome Center for Development Data
Development Data Group, The World Bank
Expert Consultation on “Methodology for an Information System on Rural Livelihoods and Sustainable Development
Goals Indicators on Smallholder Productivity and Income FAO Headquarters – Rome, Italy, November 7, 2016

DATA PRODUCTIONEXTRA SLIDES ON LSMS-ISA & APPLICATIONS TO STUDY GENDER DIFFERENCES IN LAND PRODUCTIVITY IN AFRICA
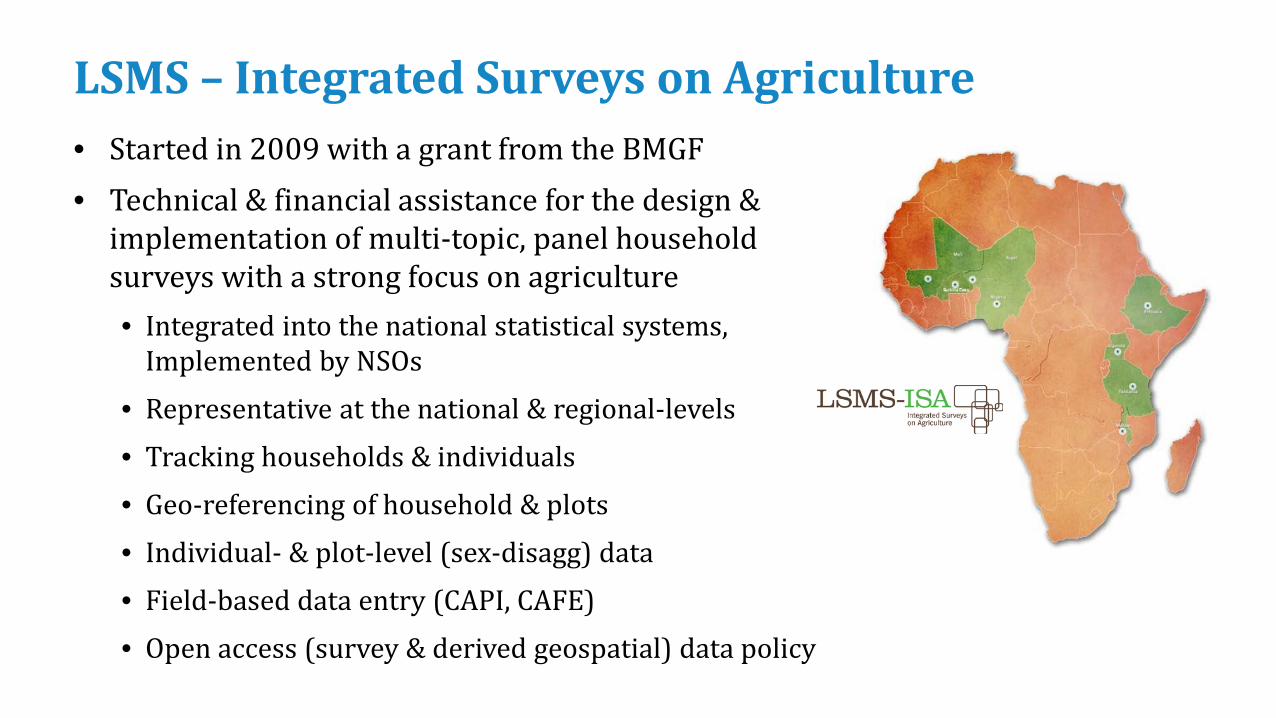
LSMS – Integrated Surveys on Agriculture• Started in 2009 with a grant from the BMGF• Technical & financial assistance for the design &
implementation of multi-topic, panel household surveys with a strong focus on agriculture• Integrated into the national statistical systems,
Implemented by NSOs• Representative at the national & regional-levels• Tracking households & individuals• Geo-referencing of household & plots• Individual- & plot-level (sex-disagg) data• Field-based data entry (CAPI, CAFE)• Open access (survey & derived geospatial) data policy
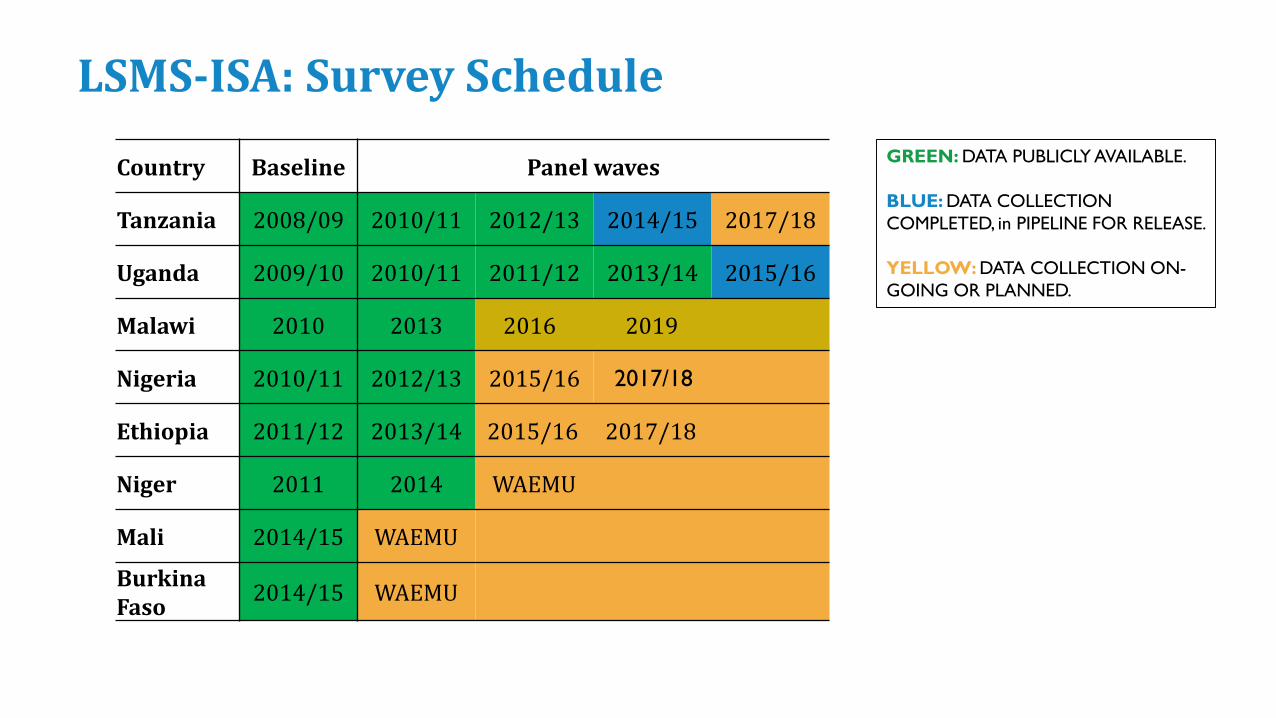
LSMS-ISA: Survey Schedule
Country Baseline Panel waves
Tanzania 2008/09 2010/11 2012/13 2014/15 2017/18
Uganda 2009/10 2010/11 2011/12 2013/14 2015/16
Malawi 2010 2013 2016 2019
Nigeria 2010/11 2012/13 2015/16 2017/18
Ethiopia 2011/12 2013/14 2015/16 2017/18
Niger 2011 2014 WAEMU
Mali 2014/15 WAEMU
Burkina Faso 2014/15 WAEMU
GREEN: DATA PUBLICLY AVAILABLE.
BLUE: DATA COLLECTION COMPLETED, in PIPELINE FOR RELEASE.
YELLOW: DATA COLLECTION ON-GOING OR PLANNED.
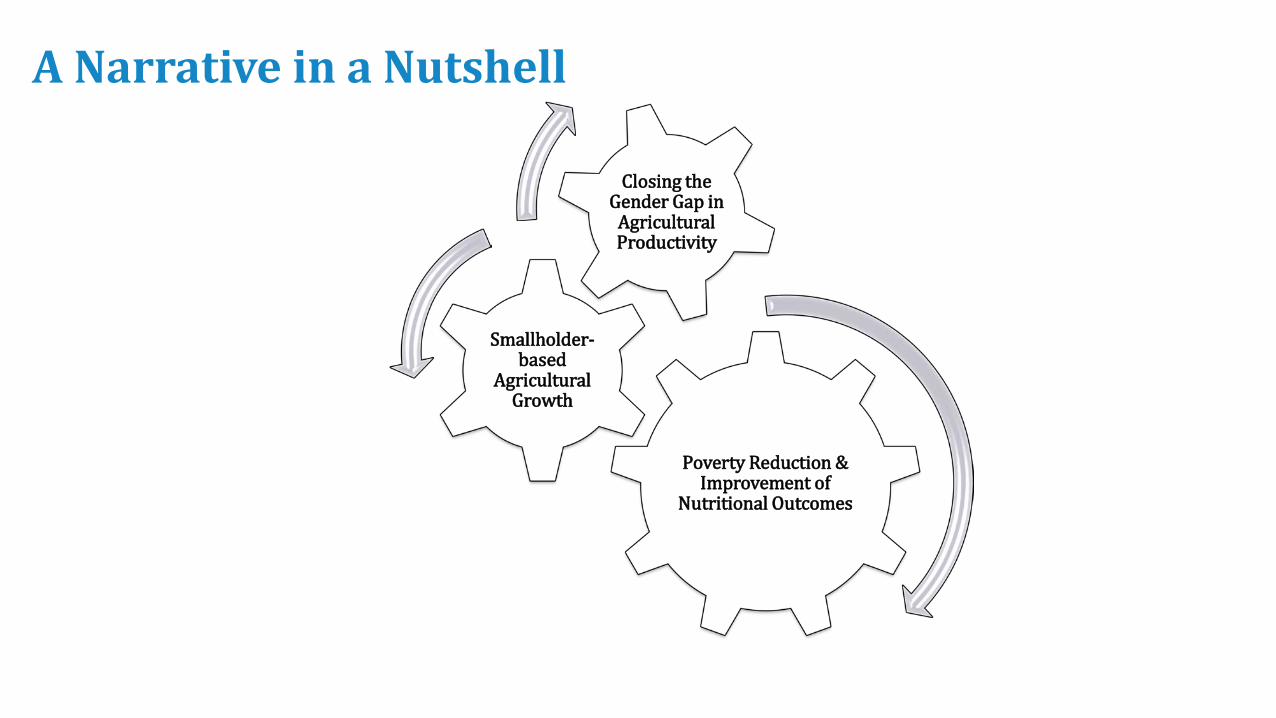
A Narrative in a Nutshell
Poverty Reduction & Improvement of
Nutritional Outcomes
Smallholder-based
Agricultural Growth
Closing the Gender Gap in
Agricultural Productivity
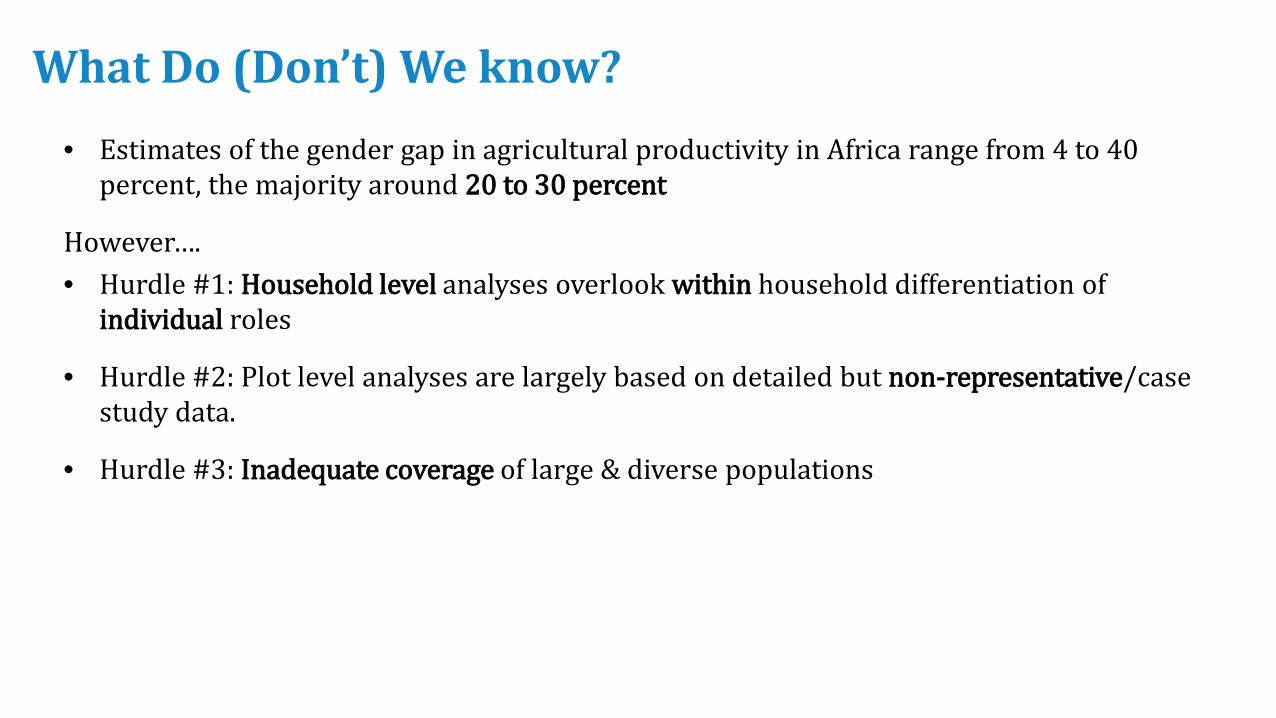
What Do (Don’t) We know?• Estimates of the gender gap in agricultural productivity in Africa range from 4 to 40
percent, the majority around 20 to 30 percent
However…. • Hurdle #1: Household level analyses overlook within household differentiation of
individual roles
• Hurdle #2: Plot level analyses are largely based on detailed but non-representative/case study data.
• Hurdle #3: Inadequate coverage of large & diverse populations
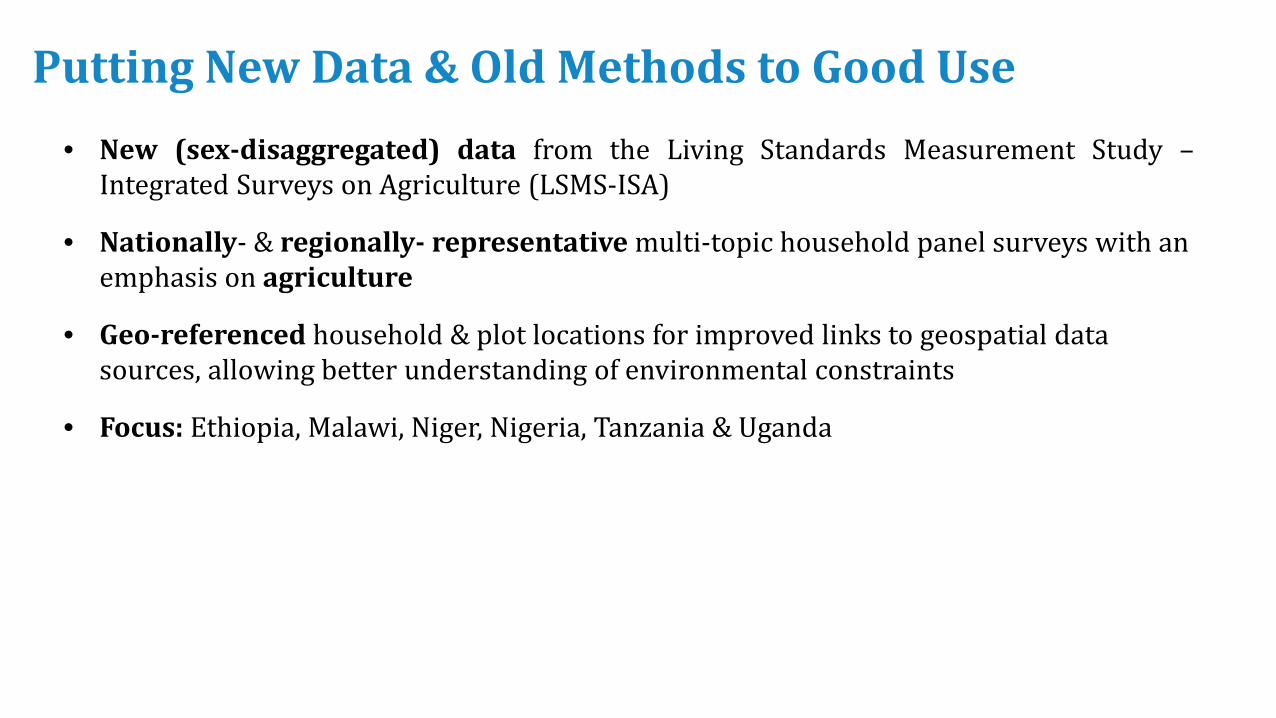
Putting New Data & Old Methods to Good Use• New (sex-disaggregated) data from the Living Standards Measurement Study –
Integrated Surveys on Agriculture (LSMS-ISA)
• Nationally- & regionally- representative multi-topic household panel surveys with an emphasis on agriculture
• Geo-referenced household & plot locations for improved links to geospatial data sources, allowing better understanding of environmental constraints
• Focus: Ethiopia, Malawi, Niger, Nigeria, Tanzania & Uganda
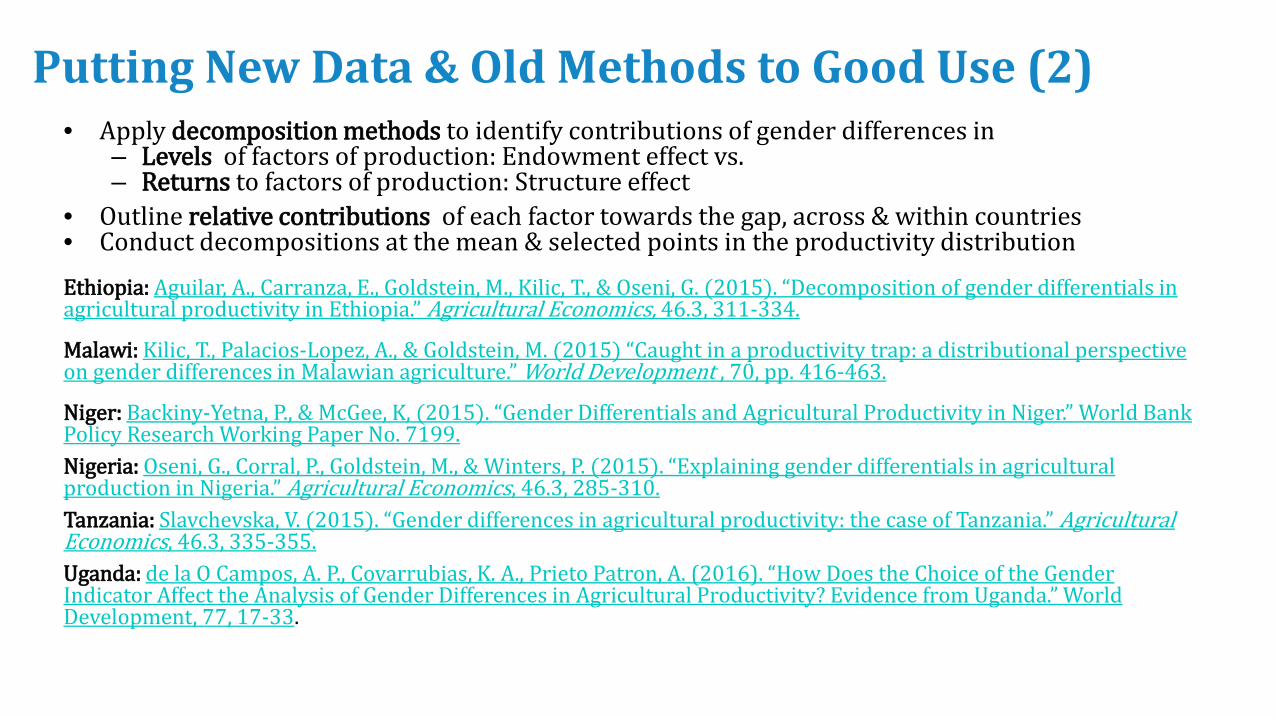
Putting New Data & Old Methods to Good Use (2)• Apply decomposition methods to identify contributions of gender differences in
– Levels of factors of production: Endowment effect vs.– Returns to factors of production: Structure effect
• Outline relative contributions of each factor towards the gap, across & within countries• Conduct decompositions at the mean & selected points in the productivity distributionEthiopia: Aguilar, A., Carranza, E., Goldstein, M., Kilic, T., & Oseni, G. (2015). “Decomposition of gender differentials in agricultural productivity in Ethiopia.” Agricultural Economics, 46.3, 311-334.
Malawi: Kilic, T., Palacios-Lopez, A., & Goldstein, M. (2015) “Caught in a productivity trap: a distributional perspective on gender differences in Malawian agriculture.” World Development , 70, pp. 416-463.
Niger: Backiny-Yetna, P., & McGee, K, (2015). “Gender Differentials and Agricultural Productivity in Niger.” World Bank Policy Research Working Paper No. 7199.Nigeria: Oseni, G., Corral, P., Goldstein, M., & Winters, P. (2015). “Explaining gender differentials in agricultural production in Nigeria.” Agricultural Economics, 46.3, 285-310.Tanzania: Slavchevska, V. (2015). “Gender differences in agricultural productivity: the case of Tanzania.” Agricultural Economics, 46.3, 335-355.Uganda: de la O Campos, A. P., Covarrubias, K. A., Prieto Patron, A. (2016). “How Does the Choice of the Gender Indicator Affect the Analysis of Gender Differences in Agricultural Productivity? Evidence from Uganda.” World Development, 77, 17-33.
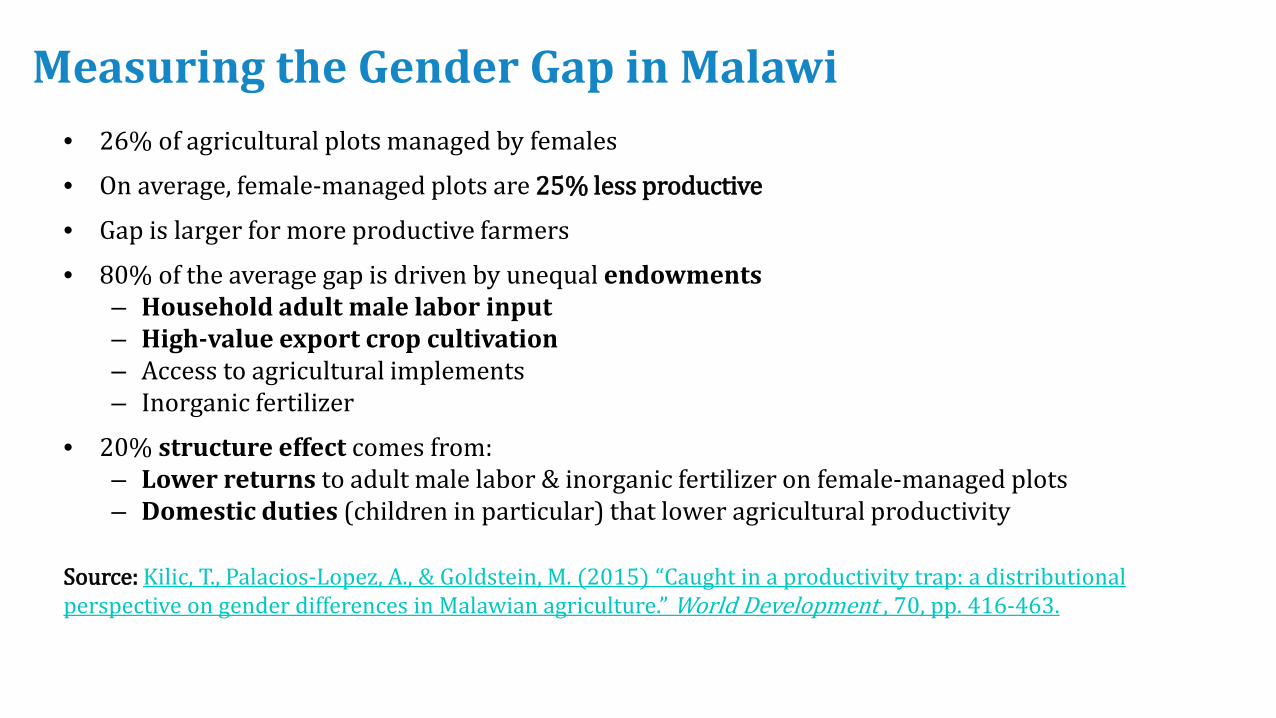
Measuring the Gender Gap in Malawi• 26% of agricultural plots managed by females
• On average, female-managed plots are 25% less productive
• Gap is larger for more productive farmers
• 80% of the average gap is driven by unequal endowments– Household adult male labor input – High-value export crop cultivation– Access to agricultural implements– Inorganic fertilizer
• 20% structure effect comes from:– Lower returns to adult male labor & inorganic fertilizer on female-managed plots– Domestic duties (children in particular) that lower agricultural productivity
Source: Kilic, T., Palacios-Lopez, A., & Goldstein, M. (2015) “Caught in a productivity trap: a distributional perspective on gender differences in Malawian agriculture.” World Development , 70, pp. 416-463.


![Talip Kucukcan_Arab Image in Turkey [2010]](https://static.fdocuments.us/doc/165x107/577c853c1a28abe054bc43da/talip-kucukcanarab-image-in-turkey-2010.jpg)


