Sex differences in risk factors for cardiovascular disease ... · 1 Sex differences in risk factors...
27
1 Sex differences in risk factors for cardiovascular disease: The PERU MIGRANT Study Antonio Bernabe-Ortiz, MD, MPH 1,2 , Catherine Pastorius Benziger, MD 1,3 , Robert H. Gilman MD 1,4,5 , Liam Smeeth PhD 1,6 , and J. Jaime Miranda MD, PhD 1,6,7 * 1. CRONICAS Center of Excellence in Chronic Diseases, Universidad Peruana Cayetano Heredia, Lima, Peru 2. Epidemiology Unit, School of Public Health and Administration, Universidad Peruana Cayetano Heredia, Lima, Peru 3. University of Minnesota Medical School, Minneapolis, MN, USA 4. Department of International Health, Johns Hopkins Bloomberg School of Public Health, Baltimore, MD, USA 5. Área de Investigación y Desarrollo, A.B. PRISMA, Lima, Peru 6. Faculty of Epidemiology and Population Health, London School of Hygiene and Tropical Medicine, London, United Kingdom 7. Department of Medicine, School of Medicine, Universidad Peruana Cayetano Heredia, Lima, Peru Running head: Sex differences in CVD risk factors in Peru *Corresponding author: J. Jaime Miranda, MD, MSc, PhD E-mail: [email protected] Address: Armendariz 497, Miraflores, Lima, Peru Word count: 211 words Word count (excluding abstract, references and tables): 2,312 words
Transcript of Sex differences in risk factors for cardiovascular disease ... · 1 Sex differences in risk factors...
1
Sex differences in risk factors for cardiovascular disease: The
PERU MIGRANT Study
Antonio Bernabe-Ortiz, MD, MPH1,2
, Catherine Pastorius Benziger, MD1,3
, Robert H.
Gilman MD1,4,5
, Liam Smeeth PhD1,6
, and J. Jaime Miranda MD, PhD1,6,7
*
1. CRONICAS Center of Excellence in Chronic Diseases, Universidad Peruana
Cayetano Heredia, Lima, Peru
2. Epidemiology Unit, School of Public Health and Administration, Universidad
Peruana Cayetano Heredia, Lima, Peru
3. University of Minnesota Medical School, Minneapolis, MN, USA
4. Department of International Health, Johns Hopkins Bloomberg School of Public
Health, Baltimore, MD, USA
5. Área de Investigación y Desarrollo, A.B. PRISMA, Lima, Peru
6. Faculty of Epidemiology and Population Health, London School of Hygiene and
Tropical Medicine, London, United Kingdom
7. Department of Medicine, School of Medicine, Universidad Peruana Cayetano
Heredia, Lima, Peru
Running head: Sex differences in CVD risk factors in Peru
*Corresponding author:
J. Jaime Miranda, MD, MSc, PhD
E-mail: [email protected]
Address: Armendariz 497, Miraflores, Lima, Peru
Word count: 211 words
Word count (excluding abstract, references and tables): 2,312 words
2
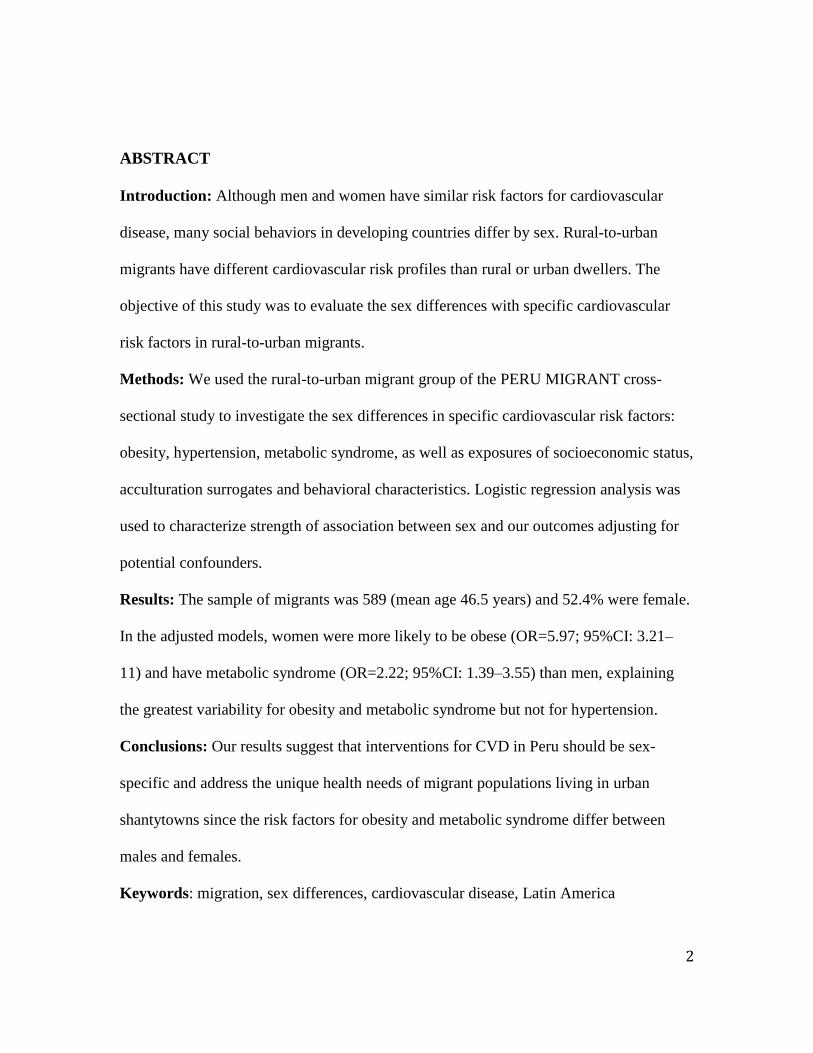
ABSTRACT
Introduction: Although men and women have similar risk factors for cardiovascular
disease, many social behaviors in developing countries differ by sex. Rural-to-urban
migrants have different cardiovascular risk profiles than rural or urban dwellers. The
objective of this study was to evaluate the sex differences with specific cardiovascular
risk factors in rural-to-urban migrants.
Methods: We used the rural-to-urban migrant group of the PERU MIGRANT cross-
sectional study to investigate the sex differences in specific cardiovascular risk factors:
obesity, hypertension, metabolic syndrome, as well as exposures of socioeconomic status,
acculturation surrogates and behavioral characteristics. Logistic regression analysis was
used to characterize strength of association between sex and our outcomes adjusting for
potential confounders.
Results: The sample of migrants was 589 (mean age 46.5 years) and 52.4% were female.
In the adjusted models, women were more likely to be obese (OR=5.97; 95%CI: 3.21–
11) and have metabolic syndrome (OR=2.22; 95%CI: 1.39–3.55) than men, explaining
the greatest variability for obesity and metabolic syndrome but not for hypertension.
Conclusions: Our results suggest that interventions for CVD in Peru should be sex-
specific and address the unique health needs of migrant populations living in urban
shantytowns since the risk factors for obesity and metabolic syndrome differ between
males and females.
Keywords: migration, sex differences, cardiovascular disease, Latin America
3
INTRODUCTION
Cardiovascular diseases are rapidly becoming the leading causes of morbidity and
mortality in low- and middle-income countries (LMIC) (1). In these settings,
urbanization, due mainly to internal migration, is one of the main contributors to the
transition towards increasing CVD (2-4). Thus, rise in cardiovascular diseases in LMIC
can be attributed to changes in social and health behaviors, such as physical inactivity,
decreased fruit intake and increased intake of energy dense foods and salt, as well as
tobacco use and alcohol consumption (5, 6).
Rural-to-urban migrants have different cardiovascular risk profiles than rural or urban
dwellers; yet, most of these studies are limited to international migrant pattern from
developing to developed countries, particularly those residing in the United States. Few
studies have addressed the impact of rural-to-urban migration on cardiovascular
outcomes in LMIC, e.g. the Kenyan Luo migration study (7), Yi People Study in China
(8), Indian Migration Study in India (9), and the PERU-MIGRANT study in Peru (10).
Recently, a systematic review of rural-to-urban migration studies concluded that several
cardiovascular risk factors are higher or more common in migrants than in rural groups,
but lower or less common than in urban groups (11).
While men and women have similar risk factors for cardiovascular diseases, many social
behaviors in LMIC differ by sex. For example, women who smoke have three times the
risk of heart attacks and have their first heart attacks much earlier than men and woman
non-smokers (12). A Brazilian study demonstrated that high cholesterol and hypertension
were more prevalent among women compared to men (13). In Peru, three studies have

4
shown that metabolic syndrome, abdominal obesity, and low high density lipoprotein-
cholesterol (HDL) are higher in women than men while there seems to be no differences
in hypertension, hypertriglyceridemia or high fasting glucose (14-16).
Reliable estimates of prevalence, patterns and population distribution of cardiovascular
risk factors in Latin American populations are needed in order to design effective
treatment programs. The PERU MIGRANT study found that the impact of rural-to-urban
migration on cardiovascular risk profile was not uniform across different risk factors, and
was further influenced by the age at which migration occurred (10). Moreover, a gradient
was observed for some risk factors across study groups. The objectives of this study were
to evaluate the sex differences in exposures to socioeconomic, acculturation and
behavioral characteristics and assess the impact of sex on specific cardiovascular risk
factors (obesity, hypertension, and metabolic syndrome) in a rural-to-urban migrant
population.
METHODS
Study design, setting, and participants
The general objectives and design of the PERU-MIGRANT study have been previously
published (17). Briefly, a cross-sectional survey was performed using a single-stage
random sampling and involving migrants from rural to urban areas in Peru. Potential
participants, born in the rural setting of Ayacucho, who migrated to, and were currently
living in the urban setting of Lima, were asked to participate. The area called “Las

5
Pampas de San Juan de Miraflores” was the setting where this study was undertaken. The
sampling frame for this migrant group was the local census performed in 2000, updated
in 2006, to identify all those who stated they had been born in the Department of
Ayacucho and were currently living in Lima. The sample was stratified by sex and age
groups to reduce the confounding due to these variables.
Data collection
A team of community health workers was trained to enroll participants and to conduct the
questionnaires assessing socio-demographic, acculturation and behavioral variables. As
part of this evaluation, participants were invited to a clinic visit where height, weight,
waist circumference (WC), systolic (SBP) and diastolic (DBP) blood pressure, as well as
blood samples were obtained using standardized methods and calibrated tools (17). Total
cholesterol, triglycerides and HDL were measured in serum, whereas fasting glucose was
assessed in plasma.
Outcomes and variable definitions
Three were our outcomes of interest: obesity, hypertension, and metabolic syndrome.
Obesity was defined as body mass index (BMI) ≥ 30 kg/m2 for men and women
according to accepted guidelines (18). Hypertension was considered whether SBP ≥ 140
and/or DBP ≥ 90 mm Hg, or self-report of physician diagnosis and currently receiving
anti-hypertensive medication (19, 20). Abdominal obesity was assessed by International
Diabetes Federation cut-off criteria of WC ≥ 90 cm (men) or ≥ 80 cm (women) for South
America (21, 22) as well as Latin American Consortium in Obesity Studies (LASO) cut-

6
off criteria of WC ≥ 97 cm (men) or ≥ 94 cm (women) (23, 24). Finally, according to the
harmonized criteria participants having 3 or more of the following criteria were defined
as having metabolic syndrome: (1) abdominal obesity (ethnic specific cut-offs of WC >90
cm in men and >80 cm in women); (2) triglycerides ≥150 mg/dL or drug therapy for
elevated triglycerides; (3) low HDL-cholesterol (<40 mg/dL in men and <50 mg/dL in
women) or drug therapy for low HDL cholesterol; (4) SBP ≥130 mm Hg, DBP ≥85 mm
Hg, or current pharmacologic treatment for hypertension; (5) fasting glucose ≥100 mg/dL
or current antidiabetic medication use (insulin or oral agents) (21). A detailed description
of the socio-demographic, acculturation and behavioral variables is shown in Table 1.
Statistical analysis
STATA 11 for Windows (STATA CORP, College Station, Texas, USA) was used for all
analyses. Initially, a brief description of the socio-demographic, acculturation, behavioral,
and clinical variables was performed according to sex. Frequencies and percentages were
used to present categorical variables. Then, age-adjusted odds ratios (OR) and 95%
confidence intervals (95%CI) were estimated using logistic regression (crude model).
Finally, the strength of the association between sexes (male as reference) and our
outcomes of interest were estimated adjusting for potential confounders. Diverse models
were generated including different confounders such as socio-demographic variables
(education level, socioeconomic status using household assets); acculturation surrogates
(language spoken at home, language preferences for listening, age at first migration, and
lifetime urban exposure); and behavioral variables (smoking, alcohol consumption, and
physical activity level).
7
Ethics
Ethical approval for this protocol was obtained from ethics committees at Universidad
Peruana Cayetano Heredia in Peru and London School of Hygiene and Tropical Medicine
in the UK. All enrolled participants gave written informed consent.
RESULTS
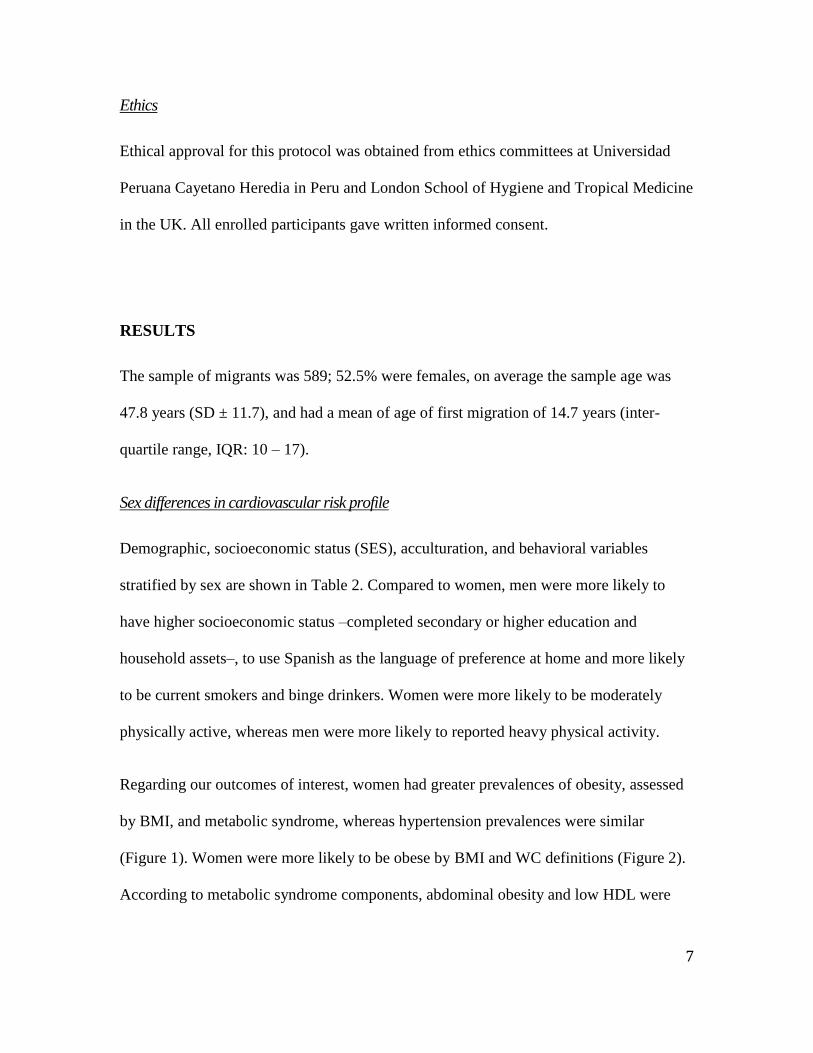
The sample of migrants was 589; 52.5% were females, on average the sample age was
47.8 years (SD ± 11.7), and had a mean of age of first migration of 14.7 years (inter-
quartile range, IQR: 10 – 17).
Sex differences in cardiovascular risk profile
Demographic, socioeconomic status (SES), acculturation, and behavioral variables
stratified by sex are shown in Table 2. Compared to women, men were more likely to
have higher socioeconomic status –completed secondary or higher education and
household assets–, to use Spanish as the language of preference at home and more likely
to be current smokers and binge drinkers. Women were more likely to be moderately
physically active, whereas men were more likely to reported heavy physical activity.
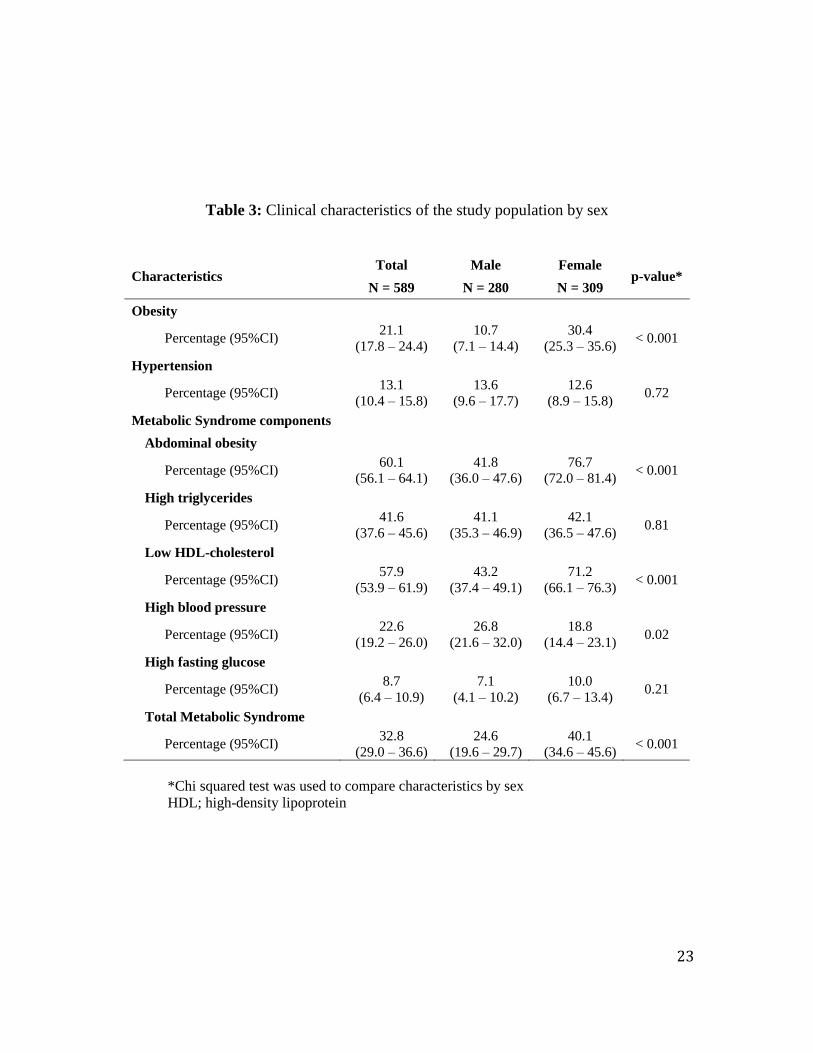
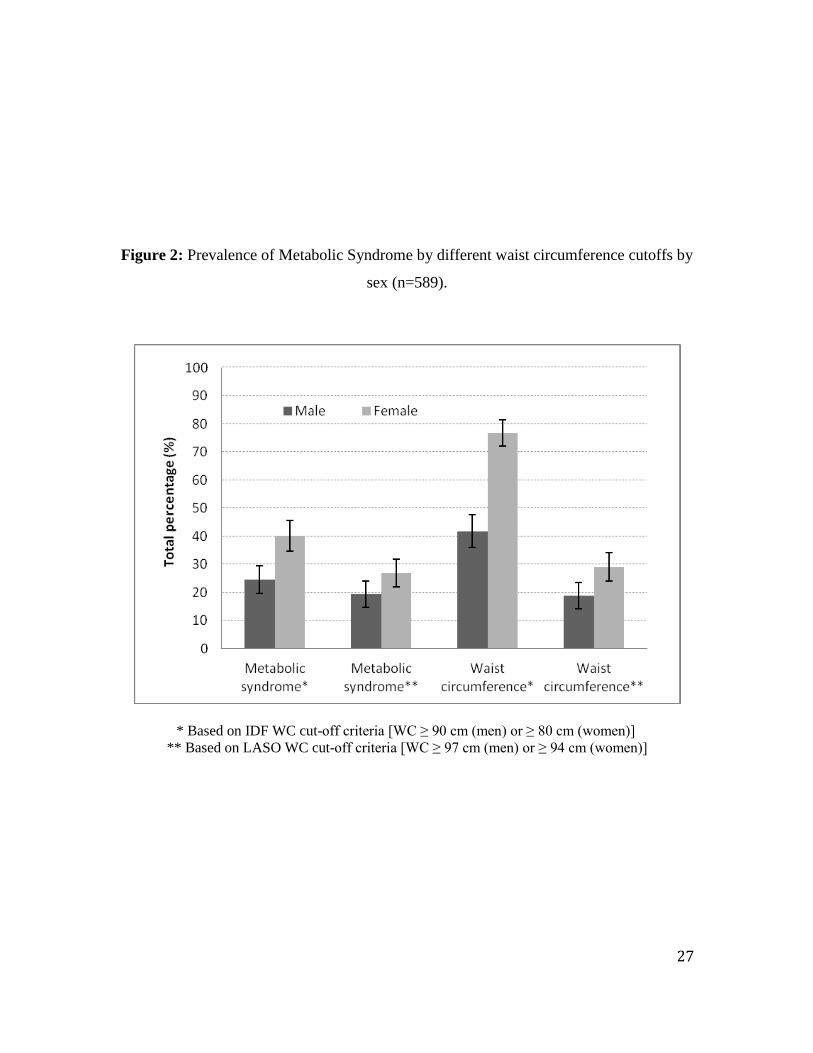
Regarding our outcomes of interest, women had greater prevalences of obesity, assessed
by BMI, and metabolic syndrome, whereas hypertension prevalences were similar
(Figure 1). Women were more likely to be obese by BMI and WC definitions (Figure 2).
According to metabolic syndrome components, abdominal obesity and low HDL were
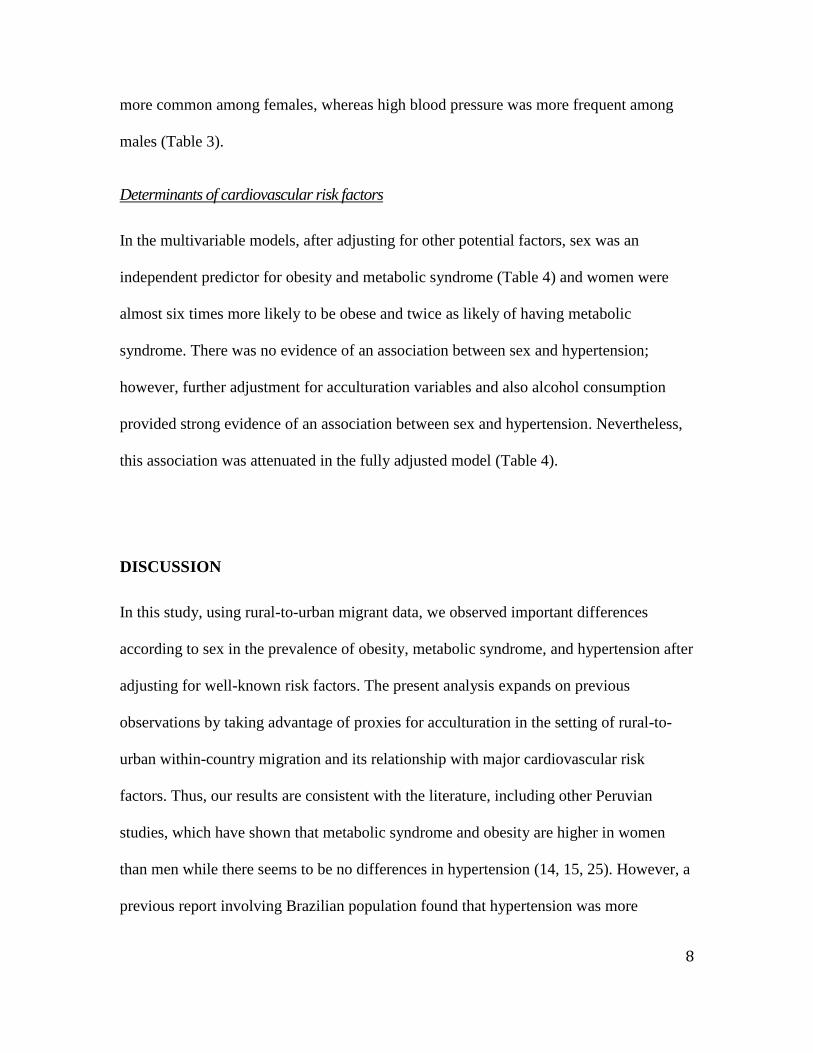
8
more common among females, whereas high blood pressure was more frequent among
males (Table 3).
Determinants of cardiovascular risk factors
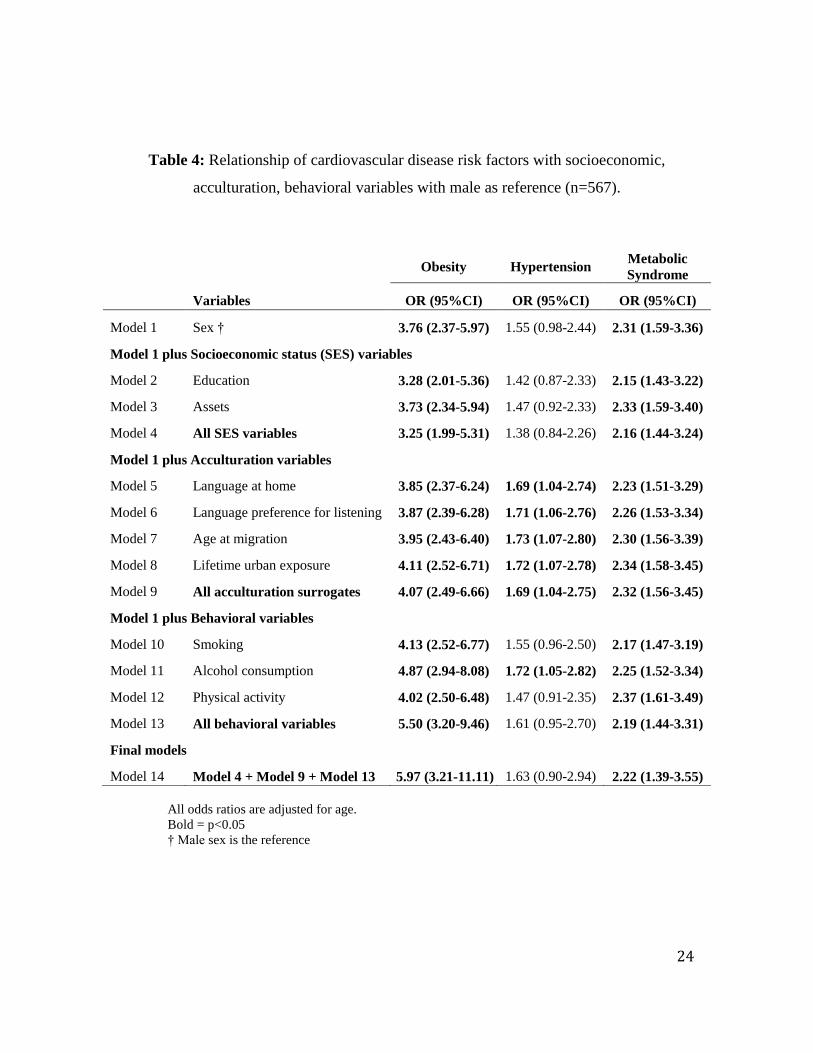
In the multivariable models, after adjusting for other potential factors, sex was an
independent predictor for obesity and metabolic syndrome (Table 4) and women were
almost six times more likely to be obese and twice as likely of having metabolic
syndrome. There was no evidence of an association between sex and hypertension;
however, further adjustment for acculturation variables and also alcohol consumption
provided strong evidence of an association between sex and hypertension. Nevertheless,
this association was attenuated in the fully adjusted model (Table 4).
DISCUSSION
In this study, using rural-to-urban migrant data, we observed important differences
according to sex in the prevalence of obesity, metabolic syndrome, and hypertension after
adjusting for well-known risk factors. The present analysis expands on previous
observations by taking advantage of proxies for acculturation in the setting of rural-to-
urban within-country migration and its relationship with major cardiovascular risk
factors. Thus, our results are consistent with the literature, including other Peruvian
studies, which have shown that metabolic syndrome and obesity are higher in women
than men while there seems to be no differences in hypertension (14, 15, 25). However, a
previous report involving Brazilian population found that hypertension was more
9
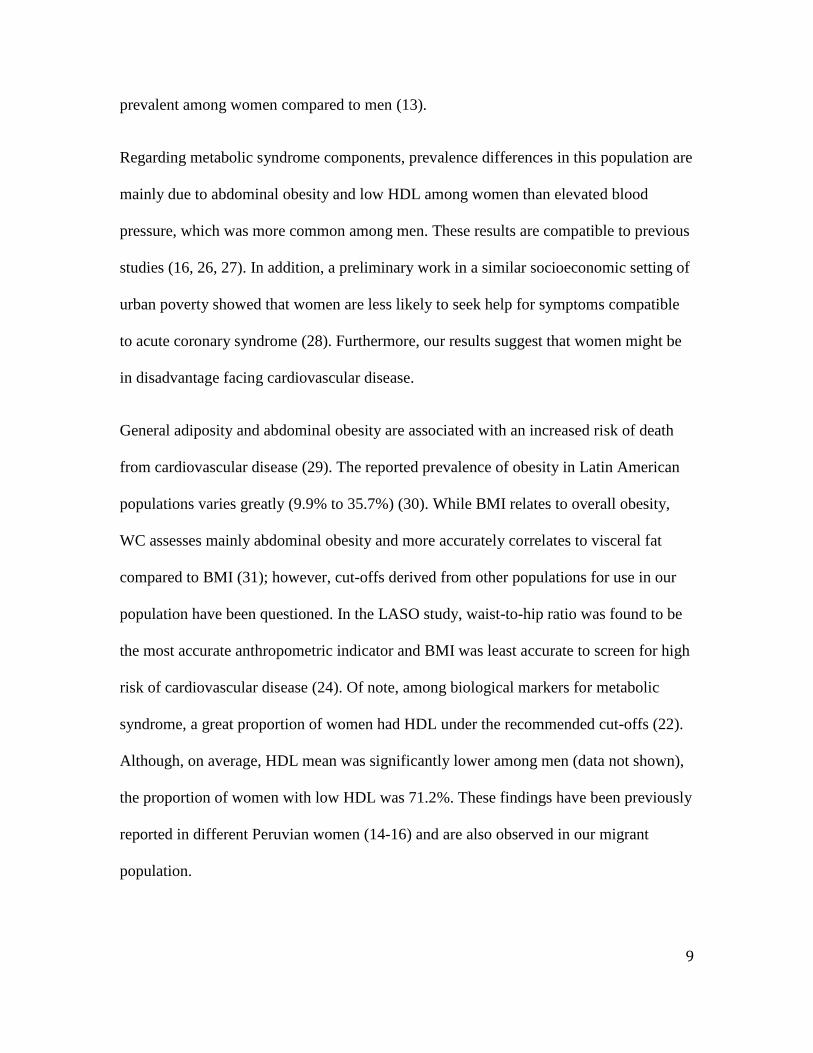
prevalent among women compared to men (13).
Regarding metabolic syndrome components, prevalence differences in this population are
mainly due to abdominal obesity and low HDL among women than elevated blood
pressure, which was more common among men. These results are compatible to previous
studies (16, 26, 27). In addition, a preliminary work in a similar socioeconomic setting of
urban poverty showed that women are less likely to seek help for symptoms compatible
to acute coronary syndrome (28). Furthermore, our results suggest that women might be
in disadvantage facing cardiovascular disease.
General adiposity and abdominal obesity are associated with an increased risk of death
from cardiovascular disease (29). The reported prevalence of obesity in Latin American
populations varies greatly (9.9% to 35.7%) (30). While BMI relates to overall obesity,
WC assesses mainly abdominal obesity and more accurately correlates to visceral fat
compared to BMI (31); however, cut-offs derived from other populations for use in our
population have been questioned. In the LASO study, waist-to-hip ratio was found to be
the most accurate anthropometric indicator and BMI was least accurate to screen for high
risk of cardiovascular disease (24). Of note, among biological markers for metabolic
syndrome, a great proportion of women had HDL under the recommended cut-offs (22).
Although, on average, HDL mean was significantly lower among men (data not shown),
the proportion of women with low HDL was 71.2%. These findings have been previously
reported in different Peruvian women (14-16) and are also observed in our migrant
population.
10
In the primary PERU MIGRANT analysis, which described the cardiovascular risk
factors in rural, urban and migrant groups, rural residents, despite being poorer and
having lower education levels, had lower prevalence of these risk factors compared to
urban residents and migrants (10). Obesity has been associated with older age at first
migration, language speaking proficiency, and language preferences in migrant
population (32). Thus, these variables were included in our models. After adjusting for
acculturation variables, we found female migrants were more likely to be obese, have
hypertension and have metabolic syndrome than men. These findings suggest that
urbanization and the migration process do indeed have an important influential effect on
cardiovascular disease profile, equal or more than socioeconomic factors per se, which
differs by sex. Traditionally, migrants tend to be a highly self-selected group, whereby
the healthier, wealthier residents of an area migrate to urban areas for better opportunities
(33). In this case, rural-to-urban migrants from Ayacucho (Peru) fled the area due to
strong political violence (34) rather than only a migration for economic reasons: the
migrants were not simply a small self-selected atypical group.
Appropriate assessment of fat distribution is important for identifying individuals at risk
of cardiovascular disease. The distribution of fat in the body is arguably more important
than overall obesity, especially in women, since women with greater central obesity are
more likely to have CVD (35). The LASO Consortium has suggested alternative BMI and
WC cut-offs for Latin Americans (23), of which both indicators have been independently
associated with CVD and mortality.
The study benefits from the use of a well-defined rural-to-urban within-country migrant
11
population, as well as objective measures of anthropometry, biochemical and metabolic
markers. However, the study is of limited generalizability because it was conducted in a
specific group of migrants from a socially deprived urban part of Lima, Peru. The group
of migrants was well established in the area, many having lived there for over 20 years.
Due to the cross-sectional nature of the study, we are unable to comment about the causal
relationship between sex and migration, and whether the differences are due to migration
per se, or the urban environment.
Previous work by our group with the same dataset, examined the differences between the
migrant group, and urban and rural dwellers but sex differences were not explored (10).
In addition, the PERU MIGRANT study did not address dietary patterns, contraceptives
and hormone therapy use, or menopause status in this population. After menopause, the
lipid profile changes in women, with increasing levels of LDL and decreasing levels of
HDL cholesterol (36). The role of sex hormones and how they affect CVD risk factors in
this population was not assessed. Finally, our study may have been underpowered to
detect some of the sex differences, for example between smoking and hypertension.
However, our study involved a great number of migrants and is the first to show
associations between sex and cardiovascular risk factors.
CONCLUSIONS
These findings suggest that sex is an important factor associated with established
cardiovascular risk factors. Thus, treatment and prevention programs should address sex
12
differences, as well as the unique health needs of migrant populations living in urban
shantytowns.
ACKNOWLEDGEMENTS
Our special gratitude to various colleagues at Universidad Peruana Cayetano Heredia and
A.B. PRISMA in Lima, Peru and several others in the United Kingdom, as well as to the
staff and the team of fieldworkers who contributed to different parts of this study.
COMPETING INTERESTS
The authors declare that they have no competing interests.
FUNDING
ABO, RHG, JJM and the CRONICAS Center of Excellence in Chronic Diseases at
UPCH is funded by the National Heart, Lung and Blood Institute (NHLBI), National
Institutes of Health, Department of Health and Human Services, under contract no.
HHSN268200900033C. CPB was supported by the National Institutes of Health and
Fogarty International Center through the International Clinical Research Fellows
Program at Vanderbilt University (R24 TW007988). The PERU MIGRANT Study was
funded by a Wellcome Trust Masters Research Training Fellowship and a Wellcome

13
Trust PhD Studentship to JJM (GR074833MA). LS is supported by a Wellcome Trust
Senior Research Fellowship in Clinical Science.
14
REFERENCES
1. World Health Organization. Global status report on noncommunicable diseases
2010. Geneva, Switzerland: WHO; 2011.
2. Patel RB, Burke TF. Urbanization--an emerging humanitarian disaster. N Engl J
Med. 2009 Aug 20;361(8):741-3.
3. United Nations Population Fund. The State of World Population 2007: Unleashing
the Potential of Urban Growth. New York, US: UNFPA; 2007.
4. van Ginkel H. Urban Future. Nature. 2008;456:32-3.
5. Cecchini M, Sassi F, Lauer JA, Lee YY, Guajardo-Barron V, Chisholm D. Tackling
of unhealthy diets, physical inactivity, and obesity: health effects and cost-
effectiveness. Lancet. 2011 Nov 20;376(9754):1775-84.
6. Epping-Jordan JE, Galea G, Tukuitonga C, Beaglehole R. Preventing chronic
diseases: taking stepwise action. Lancet. 2005 Nov 5;366(9497):1667-71.
7. Poulter NR, Khaw KT, Hopwood BE, Mugambi M, Peart WS, Rose G, et al. The
Kenyan Luo migration study: observations on the initiation of a rise in blood
pressure. BMJ. 1990 Apr 14;300(6730):967-72.
8. He J, Klag MJ, Whelton PK, Chen JY, Mo JP, Qian MC, et al. Migration, blood
pressure pattern, and hypertension: the Yi Migrant Study. Am J Epidemiol. 1991
Nov 15;134(10):1085-101.
9. Ebrahim S, Kinra S, Bowen L, Andersen E, Ben-Shlomo Y, Lyngdoh T, et al. The
effect of rural-to-urban migration on obesity and diabetes in India: a cross-sectional
15
study. PLoS Med. 2010 Apr;7(4):e1000268.
10. Miranda JJ, Gilman RH, Smeeth L. Differences in cardiovascular risk factors in
rural, urban and rural-to-urban migrants in Peru. Heart. 2011 May;97(10):787-96.
11. Hernandez AV, Pasupuleti V, Deshpande A, Bernabe-Ortiz A, Miranda JJ. Effect of
rural-to-urban within-country migration on cardiovascular risk factors in low- and
middle-income countries: a systematic review. Heart. 2011 Sep 13.
12. Wenger NK. Hypertension and other cardiovascular risk factors in women. Am J
Hypertens. 1995 Dec;8(12 Pt 2):94s-9s.
13. Castanho VS, Oliveira LS, Pinheiro HP, Oliveira HC, de Faria EC. Sex differences
in risk factors for coronary heart disease: a study in a Brazilian population. BMC
Public Health. 2001;1:3.
14. Medina-Lezama J, Zea-Diaz H, Morey-Vargas OL, Bolanos-Salazar JF, Munoz-
Atahualpa E, Postigo-MacDowall M, et al. Prevalence of the metabolic syndrome in
Peruvian Andean hispanics: the PREVENCION study. Diabetes Res Clin Pract. 2007
Nov;78(2):270-81.
15. Seclen S, Villena A, Larrad MT, Gamarra D, Herrera B, Perez CF, et al. Prevalence
of the metabolic syndrome in the mestizo population of peru. Metab Syndr Relat
Disord. 2006 Spring;4(1):1-6.
16. Malaga G, Zevallos-Palacios C, Lazo Mde L, Huayanay C. [High frequency of
dyslipidemia and impaired fasting glycemia in a high altitude Peruvian population].
Rev Peru Med Exp Salud Publica. 2010 Oct-Dec;27(4):557-61.

16
17. Miranda JJ, Gilman RH, Garcia HH, Smeeth L. The effect on cardiovascular risk
factors of migration from rural to urban areas in Peru: PERU MIGRANT Study.
BMC Cardiovasc Disord. 2009;9:23.
18. World Health Organization. Reducing risks, promoting healthy life. Geneva,
Switzerland: WHO; 2002.
19. Chobanian AV, Bakris GL, Black HR, Cushman WC, Green LA, Izzo JL, Jr., et al.
Seventh report of the Joint National Committee on Prevention, Detection,
Evaluation, and Treatment of High Blood Pressure. Hypertension. 2003
Dec;42(6):1206-52.
20. Mancia G, De Backer G, Dominiczak A, Cifkova R, Fagard R, Germano G, et al.
2007 Guidelines for the management of arterial hypertension: The Task Force for the
Management of Arterial Hypertension of the European Society of Hypertension
(ESH) and of the European Society of Cardiology (ESC). Eur Heart J. 2007
Jun;28(12):1462-536.
21. Alberti KG, Eckel RH, Grundy SM, Zimmet PZ, Cleeman JI, Donato KA, et al.
Harmonizing the metabolic syndrome: a joint interim statement of the International
Diabetes Federation Task Force on Epidemiology and Prevention; National Heart,
Lung, and Blood Institute; American Heart Association; World Heart Federation;
International Atherosclerosis Society; and International Association for the Study of
Obesity. Circulation. 2009 Oct 20;120(16):1640-5.
22. International Diabetes Federation. The IDF consensus worldwide definition of the
metabolic syndrome. Brussels, Belgium: IDF Communications; 2006.
17
23. Bautista LE, Casas JP, Herrera VM, Miranda JJ, Perel P, Pichardo R, et al. The Latin
American Consortium of Studies in Obesity (LASO). Obes Rev. 2009
May;10(3):364-70.
24. Herrera VM, Casas JP, Miranda JJ, Perel P, Pichardo R, Gonzalez A, et al.
Interethnic differences in the accuracy of anthropometric indicators of obesity in
screening for high risk of coronary heart disease. Int J Obes (Lond). 2009
May;33(5):568-76.
25. Baracco R, Mohanna S, Seclen S. A comparison of the prevalence of metabolic
syndrome and its components in high and low altitude populations in peru. Metab
Syndr Relat Disord. 2007 Spring;5(1):55-62.
26. Cardenas Quintana H, Sanchez Abanto J, Roldan Arbieto L, Mendoza Tasayco F.
[Prevalence of metabolic syndrome in people 20 years old and more. Peru, 2005].
Rev Esp Salud Publica. 2009 Mar-Apr;83(2):257-65.
27. Escobedo J, Schargrodsky H, Champagne B, Silva H, Boissonnet CP, Vinueza R, et
al. Prevalence of the metabolic syndrome in Latin America and its association with
sub-clinical carotid atherosclerosis: the CARMELA cross sectional study.
Cardiovasc Diabetol. 2009;8:52.
28. Benziger CP, Bernabe-Ortiz A, Miranda JJ, Bukhman G. Sex differences in Health
Care-Seeking Behavior for Acute Coronary Syndrome in a Low Income Country -
Peru. Crit Pathw Cardiol. 2011 Jun 1;10(2):99-103.
29. Pischon T, Boeing H, Hoffmann K, Bergmann M, Schulze MB, Overvad K, et al.
18
General and abdominal adiposity and risk of death in Europe. N Engl J Med. 2008
Nov 13;359(20):2105-20.
30. Filozof C, Gonzalez C, Sereday M, Mazza C, Braguinsky J. Obesity prevalence and
trends in Latin-American countries. Obes Rev. 2001 May;2(2):99-106.
31. Pischon T. Commentary: Use of the body mass index to assess the risk of health
outcomes: time to say goodbye? Int J Epidemiol. 2010 Apr;39(2):528-9.
32. Bernabe-Ortiz A, Gilman RH, Smeeth L, Miranda JJ. Migration surrogates and their
association with obesity among within-country migrants. Obesity (Silver Spring).
2010 Nov;18(11):2199-203.
33. Takenaka A, Pren KA. Leaving to get ahead: assessing the relationship between
mobility and inequality in Peruvian migration. Lat Am Perspect. 2010;37(5):29-49.
34. Pedersen D, Tremblay J, Errazuriz C, Gamarra J. The sequelae of political violence:
assessing trauma, suffering and dislocation in the Peruvian highlands. Soc Sci Med.
2008 Jul;67(2):205-17.
35. Canoy D, Boekholdt SM, Wareham N, Luben R, Welch A, Bingham S, et al. Body
fat distribution and risk of coronary heart disease in men and women in the European
Prospective Investigation Into Cancer and Nutrition in Norfolk cohort: a population-
based prospective study. Circulation. 2007 Dec 18;116(25):2933-43.
36. Schenck-Gustafsson K. Risk factors for cardiovascular disease in women:
assessment and management. Eur Heart J. 1996 Aug;17 Suppl D:2-8.
37. De Silva MJ, Harpham T, Tuan T, Bartolini R, Penny ME, Huttly SR. Psychometric

19
and cognitive validation of a social capital measurement tool in Peru and Vietnam.
Soc Sci Med. 2006 Feb;62(4):941-53.
38. Deyo RA, Diehl AK, Hazuda H, Stern MP. A simple language-based acculturation
scale for Mexican Americans: validation and application to health care research. Am
J Public Health. 1985 Jan;75(1):51-5.
39. World Health Organization. WHO STEPwise approach to Surveillance (STEPS).
Geneva, Switzerland: WHO; 2008.

20
Table 1: Definitions of socio-demographic and behavioral variables
Variables Definition
Socioeconomic status
Household assets Weighted-index constructed based on current ownership of household
assets (gas cooker, radio, color television, refrigerator, computer,
telephone, mobile phone, cable, internet, bicycle, motorcycle, and car)
divided into tertiles.
Acculturation
Language preferences A scale based on language spoken in the home and language preference
on the radio, previously described and validated (32, 37, 38), was used.
Age at first migration Self-ascertainment of age (years) when first migrated for a period of 6
months or more. The dichotomous variable was created at < or = 12
years or > 12 years as to evaluate the effects of migration before and
after puberty.
Lifetime exposure to urban
area
Number of years lived in an urban area divided over age and split into
tertiles.
Behavioral variables
Smoking Smoking status current (>100 cigarettes in lifetime and last cigarette <6
months) and nonsmoker [which includes former smokers (>100
cigarettes in lifetime and last cigarette >6 months) and never] by default
as they did not meet the requirements for current smoker, defined from
an adapted version of the WHO STEPS questionnaires (39).
Alcohol consumption Frequency of alcohol consumption in the last year, volume of alcohol
consumption, and frequency of hangover in the last month was defined
by an adapted version of the WHO STEPS questionnaires. Abstinent
alcohol consumption was defined as never consuming any volume of
alcohol and binge drinking was defined as 2 or more nights in the past
month and having ever drunk 6 or more drinks at a time.
Physical activity In accordance with the International Physical Activity Questionnaire
(IPAQ) protocol, the categorical physical activity levels were coded
based on both total days of physical activity and metabolic equivalents
(MET) minutes/week. Moderate physical activity was coded as 5 or
more days of any combination of walking, moderate-intensity or
vigorous-intensity activities achieving at least 600 MET minutes per
week. High physical activity was coded as 7 or more days of any
combination of walking, moderate-intensity or vigorous-intensity
activities achieving a minimum total physical activity of at least 3000
MET minutes/week. Those with low physical activity did not meet the
moderate or high physical activity criteria.

21
Table 2: Socio-economic, acculturation and behavioral characteristics of the study
population by sex
Characteristics Total Male Female
p-value* N (589) (280) (309)
Age groups 589 0.23
30-39 164 (27.8) 67 (23.9) 97 (31.4)
40-49 173 (29.4) 89 (31.8) 84 (27.2)
50-59 167 (28.4) 82 (29.3) 85 (27.5)
60+ 85 (14.4) 42 (15.0) 43 (13.9)
Socioeconomic Status variables:
Education (%) 588 < 0.001
None/ some primary 183 (31.1) 46 (16.5) 137 (44.3)
Primary completed 99 (16.8) 51 (18.3) 48 (15.5)
Secondary or higher 306 (52.0) 182 (65.2) 124 (40.1)
Household Assets (%) 589 0.002
Lowest tertile 119 (20.2) 47 (16.8) 72 (23.3)
Middle 253 (43.0) 110 (39.3) 143 (46.3)
Highest tertile 217 (36.8) 123 (43.9) 94 (30.4)
Acculturation variables:
Language spoken at home (%) 584 0.02
Spanish and Quechua 48 (8.2) 15 (5.4) 33 (10.8)
Spanish only 536 (91.8) 263 (94.6) 273 (89.2)
Language preference for listening (%) 578 0.85
Spanish and Quechua 407 (70.4) 194 (70.0) 213 (70.8)
Spanish only 171 (29.6) 83 (30.0) 88 (29.2)
Age at first migration (%) 585 0.93
≤ 12 years 225 (38.5) 106 (38.3) 119 (38.6)
> 12 years 360 (61.5) 171 (61.7) 189 (61.4)
Urban exposure (%) 559 0.77
Lowest tertile 188 (33.6) 86 (32.5) 102 (34.7)
Middle 186 (33.3) 92 (34.7) 94 (32.0)
Highest tertile 185 (33.1) 87 (32.8) 98 (33.3)

22
Behavioral variables:
Smoking (%) 589 < 0.001
Nonsmoker/former smoker 530 (90.0) 229 (81.8) 301 (97.4)
Current smoker 59 (10.0) 51 (18.2) 8 (2.6)
Alcohol consumption (%) 589 < 0.001
None 129 (21.9) 40 (14.3) 89 (28.8)
Regular drinker 412 (70.0) 197 (70.4) 215 (69.6)
Binge drinker 48 (8.1) 43 (15.4) 5 (1.6)
Physical activity (%) 582 < 0.001
Low 173 (20.7) 76 (27.4) 97 (31.8)
Moderate 211 (36.3) 78 (28.2) 133 (43.6)
Heavy 198 (34.0) 123 (44.4) 75 (24.6)
*Chi squared test was used to compare characteristics by sex
23
Table 3: Clinical characteristics of the study population by sex
Characteristics Total Male Female
p-value* N = 589 N = 280 N = 309
Obesity
Percentage (95%CI) 21.1
(17.8 – 24.4)
10.7
(7.1 – 14.4)
30.4
(25.3 – 35.6) < 0.001
Hypertension
Percentage (95%CI) 13.1
(10.4 – 15.8)
13.6
(9.6 – 17.7)
12.6
(8.9 – 15.8) 0.72
Metabolic Syndrome components
Abdominal obesity
Percentage (95%CI) 60.1
(56.1 – 64.1)
41.8
(36.0 – 47.6)
76.7
(72.0 – 81.4) < 0.001
High triglycerides
Percentage (95%CI) 41.6
(37.6 – 45.6)
41.1
(35.3 – 46.9)
42.1
(36.5 – 47.6) 0.81
Low HDL-cholesterol
Percentage (95%CI) 57.9
(53.9 – 61.9)
43.2
(37.4 – 49.1)
71.2
(66.1 – 76.3) < 0.001
High blood pressure
Percentage (95%CI) 22.6
(19.2 – 26.0)
26.8
(21.6 – 32.0)
18.8
(14.4 – 23.1) 0.02
High fasting glucose
Percentage (95%CI) 8.7
(6.4 – 10.9)
7.1
(4.1 – 10.2)
10.0
(6.7 – 13.4) 0.21
Total Metabolic Syndrome
Percentage (95%CI) 32.8
(29.0 – 36.6)
24.6
(19.6 – 29.7)
40.1
(34.6 – 45.6) < 0.001
*Chi squared test was used to compare characteristics by sex
HDL; high-density lipoprotein
24
Table 4: Relationship of cardiovascular disease risk factors with socioeconomic,
acculturation, behavioral variables with male as reference (n=567).
All odds ratios are adjusted for age.
Bold = p<0.05
† Male sex is the reference
Obesity Hypertension Metabolic
Syndrome
Variables OR (95%CI) OR (95%CI) OR (95%CI)
Model 1 Sex † 3.76 (2.37-5.97) 1.55 (0.98-2.44) 2.31 (1.59-3.36)
Model 1 plus Socioeconomic status (SES) variables
Model 2 Education 3.28 (2.01-5.36) 1.42 (0.87-2.33) 2.15 (1.43-3.22)
Model 3 Assets 3.73 (2.34-5.94) 1.47 (0.92-2.33) 2.33 (1.59-3.40)
Model 4 All SES variables 3.25 (1.99-5.31) 1.38 (0.84-2.26) 2.16 (1.44-3.24)
Model 1 plus Acculturation variables
Model 5 Language at home 3.85 (2.37-6.24) 1.69 (1.04-2.74) 2.23 (1.51-3.29)
Model 6 Language preference for listening 3.87 (2.39-6.28) 1.71 (1.06-2.76) 2.26 (1.53-3.34)
Model 7 Age at migration 3.95 (2.43-6.40) 1.73 (1.07-2.80) 2.30 (1.56-3.39)
Model 8 Lifetime urban exposure 4.11 (2.52-6.71) 1.72 (1.07-2.78) 2.34 (1.58-3.45)
Model 9 All acculturation surrogates 4.07 (2.49-6.66) 1.69 (1.04-2.75) 2.32 (1.56-3.45)
Model 1 plus Behavioral variables
Model 10 Smoking 4.13 (2.52-6.77) 1.55 (0.96-2.50) 2.17 (1.47-3.19)
Model 11 Alcohol consumption 4.87 (2.94-8.08) 1.72 (1.05-2.82) 2.25 (1.52-3.34)
Model 12 Physical activity 4.02 (2.50-6.48) 1.47 (0.91-2.35) 2.37 (1.61-3.49)
Model 13 All behavioral variables 5.50 (3.20-9.46) 1.61 (0.95-2.70) 2.19 (1.44-3.31)
Final models
Model 14 Model 4 + Model 9 + Model 13 5.97 (3.21-11.11) 1.63 (0.90-2.94) 2.22 (1.39-3.55)

25
FIGURE LEGENDS
Figure 1: Prevalence of obesity, hypertension and metabolic syndrome by sex (n=589).
Figure 2: Prevalence of Metabolic Syndrome by different waist circumference cutoffs by
sex (n=589)

26
Figure 1: Prevalence of obesity, hypertension and metabolic syndrome by sex (n=589).
BMI; body mass index
* Based on IDF waist circumference cut-off criteria ≥ 90 cm (men) or ≥ 80 cm (women)
27
Figure 2: Prevalence of Metabolic Syndrome by different waist circumference cutoffs by
sex (n=589).
* Based on IDF WC cut-off criteria [WC ≥ 90 cm (men) or ≥ 80 cm (women)]
** Based on LASO WC cut-off criteria [WC ≥ 97 cm (men) or ≥ 94 cm (women)]