A. Sex Determination Environmental Sex Determination Chromosomal Sex Determination
Upload
tangle-mediaCategory
view
223download
0description
Sex and Power 2013Who runs Britain?

Sex and Power was researched and written by the Centre for Women & Democracy on behalf of the Counting Women In coalition (CfWD, the Electoral Reform Society, the Fawcett Society, the Hansard Society and Unlock Democracy). It was generously funded by the Joseph Rowntree Charitable Trust.
Both the title and some historic data have been used by kind permission of the Equality and Human Rights Commission.
Copyright © 2013 Centre for Women and Democracy.
For more information about the Counting Women In coalition, visit our website at www.countingwomenin.org
All rights reserved. No part of this publication may be reproduced, stored in a retrieval system or transmitted in any form by any means, without the prior permission of the Centre for Women and Democracy.
3
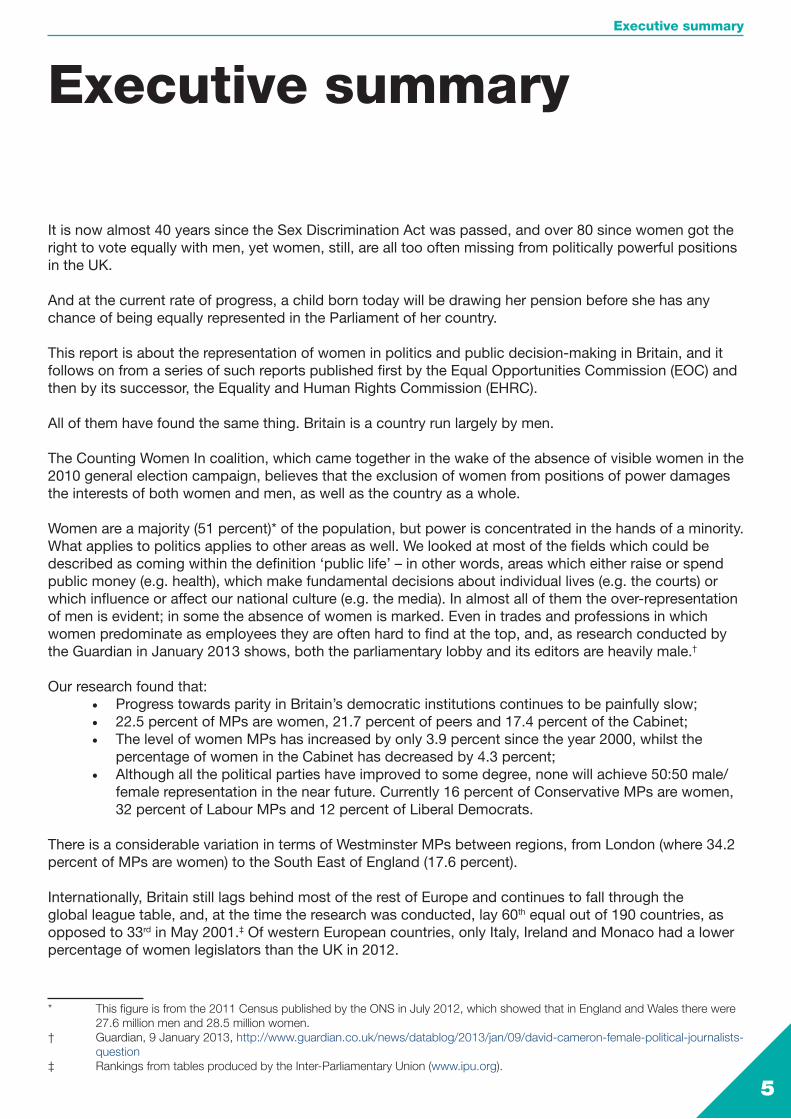
Contents
Executive summary 5
Acknowledgements 10
Methodology 11
Introduction 13
Who runs Britain? 171. Elected Office 2. Public Appointments3. The Civil Service4. Special Advisers5. The Wider Picture
Next steps: Recommendations 29
Appendix 1: Women decision-makers by sector 33a) Politics & Governmentb) Finance & the Economyc) Justice & the Lawd) Charities & Professional Bodiese) Educationf) Healthg) The Armed Forcesh) The Policei) News, Media & Current Affairsj) The Artsk) Sport
Appendix 2: Organisations 39a) Non-Ministerial Departmentsb) Executive Agencies & Other Public Bodiesc) Regulatory Bodiesd) Local Enterprise Partnerships (LEPS)e) Professional Bodiesf) Acute NHS Trustsg) Ambulance NHS Trustsh) Mental Health NHS Trustsi) Strategic Health Authority Trustsj) Health & Wellbeing Boardsk) National Daily Newspapersl) Regional Daily & Evening Newspapersm) Top 20 paid-for Magazinesn) Current Affairs & Political Magazineso) Museums & Art Galleriesp) Theatres & Theatre Companiesq) Sports Governing Bodies
Notes & sources 43
Contents

5
Executive summary
It is now almost 40 years since the Sex Discrimination Act was passed, and over 80 since women got the right to vote equally with men, yet women, still, are all too often missing from politically powerful positions in the UK.
And at the current rate of progress, a child born today will be drawing her pension before she has any chance of being equally represented in the Parliament of her country.
This report is about the representation of women in politics and public decision-making in Britain, and it follows on from a series of such reports published first by the Equal Opportunities Commission (EOC) and then by its successor, the Equality and Human Rights Commission (EHRC).
All of them have found the same thing. Britain is a country run largely by men.
The Counting Women In coalition, which came together in the wake of the absence of visible women in the 2010 general election campaign, believes that the exclusion of women from positions of power damages the interests of both women and men, as well as the country as a whole.
Women are a majority (51 percent)* of the population, but power is concentrated in the hands of a minority. What applies to politics applies to other areas as well. We looked at most of the fields which could be described as coming within the definition ‘public life’ – in other words, areas which either raise or spend public money (e.g. health), which make fundamental decisions about individual lives (e.g. the courts) or which influence or affect our national culture (e.g. the media). In almost all of them the over-representation of men is evident; in some the absence of women is marked. Even in trades and professions in which women predominate as employees they are often hard to find at the top, and, as research conducted by the Guardian in January 2013 shows, both the parliamentary lobby and its editors are heavily male.†
Our research found that:• Progress towards parity in Britain’s democratic institutions continues to be painfully slow;• 22.5 percent of MPs are women, 21.7 percent of peers and 17.4 percent of the Cabinet;• The level of women MPs has increased by only 3.9 percent since the year 2000, whilst the
percentage of women in the Cabinet has decreased by 4.3 percent;• Although all the political parties have improved to some degree, none will achieve 50:50 male/
female representation in the near future. Currently 16 percent of Conservative MPs are women, 32 percent of Labour MPs and 12 percent of Liberal Democrats.
There is a considerable variation in terms of Westminster MPs between regions, from London (where 34.2 percent of MPs are women) to the South East of England (17.6 percent).
Internationally, Britain still lags behind most of the rest of Europe and continues to fall through the global league table, and, at the time the research was conducted, lay 60th equal out of 190 countries, as opposed to 33rd in May 2001.‡ Of western European countries, only Italy, Ireland and Monaco had a lower percentage of women legislators than the UK in 2012.
* This figure is from the 2011 Census published by the ONS in July 2012, which showed that in England and Wales there were 27.6 million men and 28.5 million women.
† Guardian, 9 January 2013, http://www.guardian.co.uk/news/datablog/2013/jan/09/david-cameron-female-political-journalists- question
‡ Rankings from tables produced by the Inter-Parliamentary Union (www.ipu.org).
Executive summary
6
Sex and Power 2013
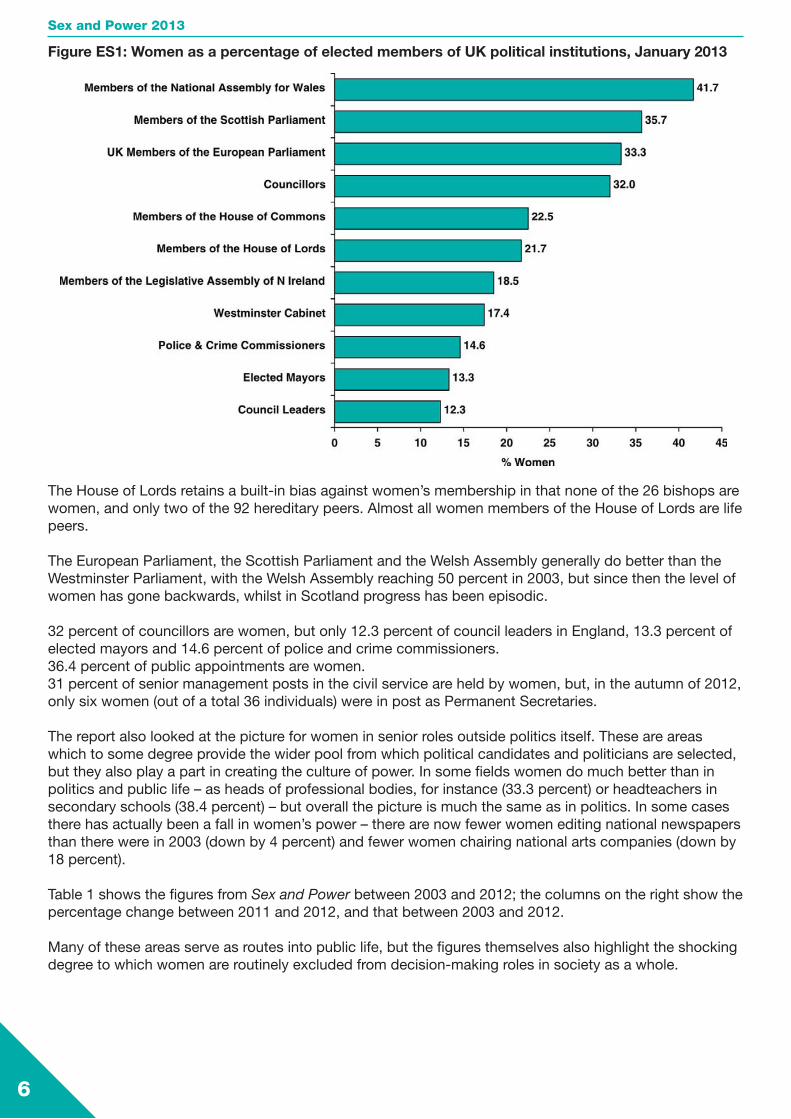
Figure ES1: Women as a percentage of elected members of UK political institutions, January 2013
The House of Lords retains a built-in bias against women’s membership in that none of the 26 bishops are women, and only two of the 92 hereditary peers. Almost all women members of the House of Lords are life peers.
The European Parliament, the Scottish Parliament and the Welsh Assembly generally do better than the Westminster Parliament, with the Welsh Assembly reaching 50 percent in 2003, but since then the level of women has gone backwards, whilst in Scotland progress has been episodic.
32 percent of councillors are women, but only 12.3 percent of council leaders in England, 13.3 percent of elected mayors and 14.6 percent of police and crime commissioners. 36.4 percent of public appointments are women.31 percent of senior management posts in the civil service are held by women, but, in the autumn of 2012, only six women (out of a total 36 individuals) were in post as Permanent Secretaries.
The report also looked at the picture for women in senior roles outside politics itself. These are areas which to some degree provide the wider pool from which political candidates and politicians are selected, but they also play a part in creating the culture of power. In some fields women do much better than in politics and public life – as heads of professional bodies, for instance (33.3 percent) or headteachers in secondary schools (38.4 percent) – but overall the picture is much the same as in politics. In some cases there has actually been a fall in women’s power – there are now fewer women editing national newspapers than there were in 2003 (down by 4 percent) and fewer women chairing national arts companies (down by 18 percent).
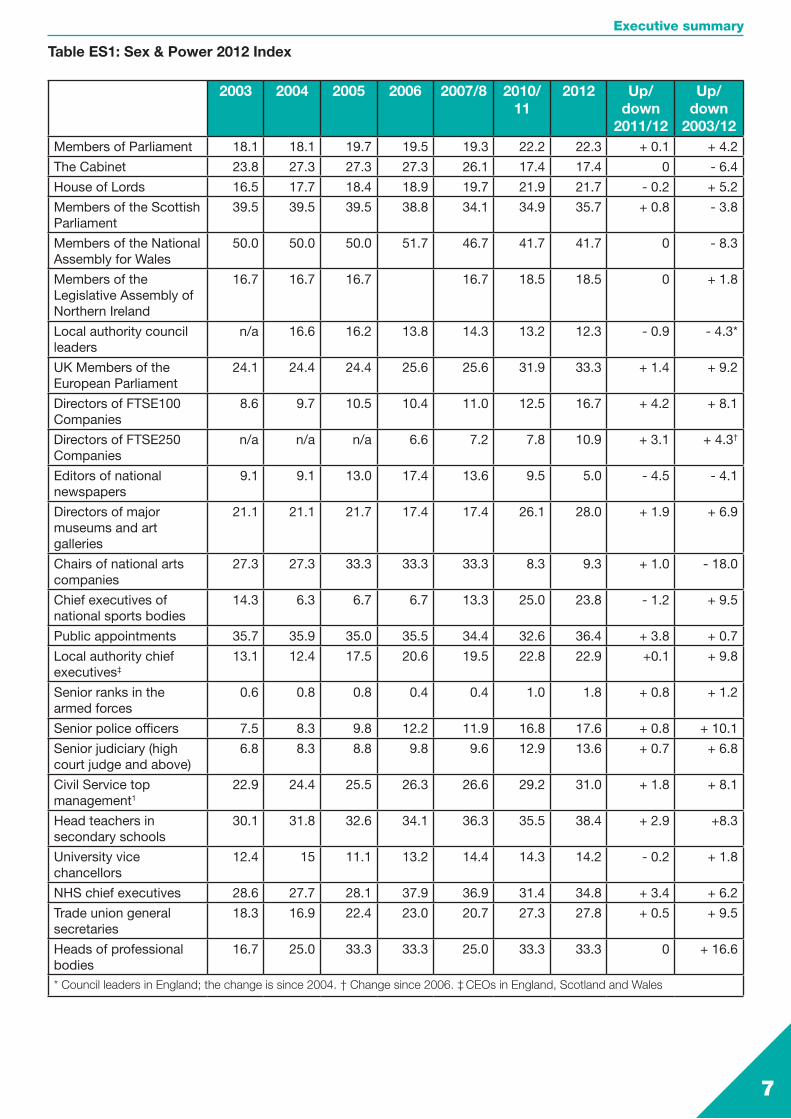
Table 1 shows the figures from Sex and Power between 2003 and 2012; the columns on the right show the percentage change between 2011 and 2012, and that between 2003 and 2012.
Many of these areas serve as routes into public life, but the figures themselves also highlight the shocking degree to which women are routinely excluded from decision-making roles in society as a whole.
7
Table ES1: Sex & Power 2012 Index
2003 2004 2005 2006 2007/8 2010/ 11
2012 Up/down
2011/12
Up/down
2003/12Members of Parliament 18.1 18.1 19.7 19.5 19.3 22.2 22.3 + 0.1 + 4.2
The Cabinet 23.8 27.3 27.3 27.3 26.1 17.4 17.4 0 - 6.4
House of Lords 16.5 17.7 18.4 18.9 19.7 21.9 21.7 - 0.2 + 5.2
Members of the Scottish Parliament
39.5 39.5 39.5 38.8 34.1 34.9 35.7 + 0.8 - 3.8
Members of the National Assembly for Wales
50.0 50.0 50.0 51.7 46.7 41.7 41.7 0 - 8.3
Members of the Legislative Assembly of Northern Ireland
16.7 16.7 16.7 16.7 18.5 18.5 0 + 1.8
Local authority council leaders
n/a 16.6 16.2 13.8 14.3 13.2 12.3 - 0.9 - 4.3*
UK Members of the European Parliament
24.1 24.4 24.4 25.6 25.6 31.9 33.3 + 1.4 + 9.2
Directors of FTSE100 Companies
8.6 9.7 10.5 10.4 11.0 12.5 16.7 + 4.2 + 8.1
Directors of FTSE250 Companies
n/a n/a n/a 6.6 7.2 7.8 10.9 + 3.1 + 4.3†
Editors of national newspapers
9.1 9.1 13.0 17.4 13.6 9.5 5.0 - 4.5 - 4.1
Directors of major museums and art galleries
21.1 21.1 21.7 17.4 17.4 26.1 28.0 + 1.9 + 6.9
Chairs of national arts companies
27.3 27.3 33.3 33.3 33.3 8.3 9.3 + 1.0 - 18.0
Chief executives of national sports bodies
14.3 6.3 6.7 6.7 13.3 25.0 23.8 - 1.2 + 9.5
Public appointments 35.7 35.9 35.0 35.5 34.4 32.6 36.4 + 3.8 + 0.7
Local authority chief executives‡
13.1 12.4 17.5 20.6 19.5 22.8 22.9 +0.1 + 9.8
Senior ranks in the armed forces
0.6 0.8 0.8 0.4 0.4 1.0 1.8 + 0.8 + 1.2
Senior police officers 7.5 8.3 9.8 12.2 11.9 16.8 17.6 + 0.8 + 10.1
Senior judiciary (high court judge and above)
6.8 8.3 8.8 9.8 9.6 12.9 13.6 + 0.7 + 6.8
Civil Service top management1
22.9 24.4 25.5 26.3 26.6 29.2 31.0 + 1.8 + 8.1
Head teachers in secondary schools
30.1 31.8 32.6 34.1 36.3 35.5 38.4 + 2.9 +8.3
University vice chancellors
12.4 15 11.1 13.2 14.4 14.3 14.2 - 0.2 + 1.8
NHS chief executives 28.6 27.7 28.1 37.9 36.9 31.4 34.8 + 3.4 + 6.2
Trade union general secretaries
18.3 16.9 22.4 23.0 20.7 27.3 27.8 + 0.5 + 9.5
Heads of professional bodies
16.7 25.0 33.3 33.3 25.0 33.3 33.3 0 + 16.6
* Council leaders in England; the change is since 2004. † Change since 2006. ‡ CEOs in England, Scotland and Wales
Executive summary
8
Sex and Power 2013
In terms of finance and the economy, not only are they a small minority of directors, but also only 15 percent of members of Local Economic Partnerships and 25 percent of general secretaries of trade unions with membership in excess of 200,000.* There are no women at all on the Bank of England Monetary Policy Committee.
Other areas we examined include justice and the law, charities and professional bodies, education, health, the armed forces, the police, news, media and current affairs, sport and the arts. Detailed figures for these areas as well as finance and the economy and politics and public life are contained in Appendix 1 of the full report.
We noted that there is considerable concern in some quarters about the ‘professionalisation’ of politics. According to government figures, 41.0 percent of Special Advisers (SpAds) were women in October 2012.†
We found that there currently appear to be no figures on the diversity of people working as lobbyists, for public affairs companies or think tanks, or as political advisers to the opposition, and we have therefore not been able to report on them.
However, we also noted that, according to the Equality and Human Rights Commission’s Pathways to Politics report on the 2010 general election, the previous employment of the majority of politicians is still outside the ‘political village’; for example, 10 percent came from financial services and at least 11 percent are qualified solicitors.
In recent years there has been much discussion of what needs to be done to widen access to political power not just in relation to gender, but also ethnicity, disability, class and sexual orientation (to name but four). Certainly the current narrow social band from which MPs are drawn needs to be broader, but it is also the case that, given that it is probable that many MPs and other public representatives will continue to come from many of the occupations examined in this report, access to them is broadened also.
Women access (or fail to access) public life in a number of ways, and the barriers to their participation have been well documented.‡ We have not rehearsed them again in this report, but it is appropriate to note that, given that people will always enter political life from some or all of the routes examined above, the absence of women matters not just in terms of the professions and activities themselves, but also for the future of our political institutions.
Recommendations
The report makes six recommendations for action, the first four of which can and should be implemented before the next general election in 2015.
Recommendation 1:Political parties should take immediate action to increase the number of women candidates at all levels of election with a view to fielding as many women candidates from as wide a variety of backgrounds and communities as possible in winnable seats in 2015. This should include active consideration of positive action measures in selection processes.
Recommendation 2:In order to enable everyone concerned to develop a much better understanding of the issues, a monitoring form similar to that used in recruitment for public appointments and applications for funding should be introduced. It would be completed and submitted to returning officers by all candidates together with nomination forms at all levels of election, and the results collated and published annually. This requirement should be implemented at the 2014 English local and European elections.
Recommendation 3:Government should pilot a new government-wide scheme in 2014 to increase women’s presence, profile
* The women are all general secretaries of teaching unions. Since January 2013 the TUC has had a female general secretary.† http://www.data.gov.uk/dataset/special-advisers, accessed January 2013.‡ These include the Councillors’ Commission in 2007 and the Speaker’s Conference report of 2010, both of which amply cover
the major barriers women face and propose solutions.

9
and participation in the 2015 general election and beyond. This could be done by drawing together experience from the UK and abroad which could be used to improve both the participation and the candidacy of women of all backgrounds in Britain.
Recommendation 4:Government, political parties and others should act to implement the recommendations of the Speaker’s Conference Report published in 2010.
Recommendation 5:In addition to adopting the proposals for cultural change in public life contained in reports such as the Speaker’s Conference, the Councillors’ Commission, and the Equality and Human Rights Commission’s Pathways to Politics, steps should be taken to develop a much wider set of proposals for improving the culture of both politics at all levels and the media coverage of them.
Recommendation 6:All organisations – public, private and third sector – should take steps to ensure that, at meetings and events, both women and men appear on platforms as speakers, and editors and broadcasters should also take responsibility for commissioning contributions from both women and men as commentators and experts. Individual citizens should be encouraged to object to men-only platforms, panels and programmes.
It is our intention to review progress towards the implementation of these recommendations in 2013/14 and to publish our findings.
Executive summary

10
Sex and Power 2013
We would like to thank the Joseph Rowntree Charitable Trust for making the funds available for the research and writing of this report, as well as for supporting the Counting Women In coalition in its early days; this support has been very much appreciated and without it this report would not have been possible.
We would also like to thank the Equality and Human Rights Commission for permission to use the title Sex and Power: Who runs Britain? as well as material and tables from previous editions published by both them and their predecessor the Equal Opportunities Commission.
The report has been researched and written by the Centre for Women & Democracy, with support from the Hansard Society, and in particular from Jess Smith who helped with the research, Ruth Fox who read the initial drafts, Virginia Gibbons and Helena Unwin-Golding who proof-read it and Matt Korris, who worked on the design.
Sex and Power has also benefited hugely from comments and suggestions provided by all the Counting Women In partners, in particular from Katie Ghose, Jessica Garland, Claudia Laidlaw, Ashley Dé and Stuart Thomas at the Electoral Reform Society, Ceri Goddard, Preethi Sundaram and Charlie Woodworth at the Fawcett Society and Alexandra Runswick at Unlock Democracy.
We are also grateful to Fiona Glen, Director of Research and Information at the Equality and Human Rights Commission, and Mark Hammond, the EHRC’s Chief Executive, for their assistance and support.
Nan SloaneDirector, Centre for Women & Democracy
Acknowledgements
11
The figures in Sex and Power 2013 represent a snapshot of the gender breakdown of people in senior decision-making roles in August and September 2012.
Any snapshot is by definition out-of-date almost immediately, and thus there are some figures which, if checked again at the time of publication (February 2013) will be found to have changed. We are confident, however, that in no case is the change very great.
The major exception to this is the figure for the House of Commons, which has been adjusted to take account of the by-elections held in November 2012. There are also one or two other areas where data has become available only since the snapshot was taken. Where this has happened it is made clear in either the text or in a footnote.
Unless otherwise stated, the terms ‘Britain’ or ‘Great Britain’ mean England, Scotland and Wales. In some cases separate figures for Northern Ireland have been included, but these are not always available. In some cases figures relate only to England and Wales, and, again, this is made clear in either the text or a footnote.
In many cases we have undertaken our own research in order to arrive at the relevant figures. Where this has happened we have indicated the sources we have used, and Appendix 2 consists of a list of specific organisations examined in stated categories.
It should be noted that the number of government agencies and advisory bodies is a moveable feast, and that ongoing restructuring means that any calculation can only provide a snapshot which may become very quickly out of date. However, we are confident that the picture which this snapshot shows remains broadly accurate even taking account of recent changes (for instance to Government executive agencies). Sources used for the whole project have been very varied, ranging from the websites of individual bodies (e.g. theatres, independent schools and sports governing bodies) to those of professional organisations (e.g. the police and the legal profession). However, in some cases we have used research already published elsewhere, and when this has happened we have made the sources clear in footnotes.
Every effort has been made to ensure that the picture presented in this report is fair and accurate, and that sources have been identified and acknowledged. The authors would be grateful if any errors or omissions could be brought to their notice as soon as possible.
MethodologyMethodology

13
It is now almost 40 years since the Sex Discrimination Act was passed, and over 80 since women got the right to vote equally with men, yet women, still, are all too often missing from politically powerful positions in the UK.
And at the current rate of progress, a child born today will be drawing her pension before she has any chance of being equally represented in the Parliament of her country.
This report is about the representation of women in politically powerful positions in Britain, and it follows on from a series of such reports published first by the Equal Opportunities Commission (EOC) and then by its successor, the Equality and Human Rights Commission (EHRC).
All of them have found the same thing. Britain is a country run largely by men.
The Counting Women In coalition, which came together in the wake of the absence of visible women in the 2010 general election campaign, believes that the exclusion of women from positions of power damages the interests of both women and men, as well as the country as a whole.
Women are a majority (51 percent)2 of the population, but power is concentrated in the hands of the minority. Only 22.5 percent of MPs are women, 21.7 percent of peers and, at the time of writing, 17.4 percent of the Cabinet. And of the nine other ministers who attend Cabinet but do not vote, just one is female. 41 of 338 English local authorities are led by women (12.3 percent), and there are two female elected mayors (13.3 percent). In the recent elections for Police and Crime Commissioners in England and Wales only six (14.6 percent) of the 41 people elected to these powerful new posts were female.
Internationally, the UK Parliament lies 60th (out of 190) in the global league table in terms of women legislators, and lags behind every western European neighbour except Ireland,* Italy and Monaco. Despite improvements at the 2010 general election British women continue to be excluded from power to a greater degree than most of their continental sisters.
Women have been told for years that they should be patient, that change is always slow, and that it’s just a matter of time before equality is achieved. But we have already waited a lifetime for fair access to power; asking us to wait another will do nothing to improve matters, either for women themselves or for the quality of our democracy and public life.
There is a growing body of evidence, largely drawn from business, that women make a positive difference to actual decision-making itself. For example, in a report in 2011 the accounting firm Deloitte found that ‘In Europe, of 89 publicly traded companies with a market capitalisation of over 150 million pounds, those with more women in senior management and on the board had, on average, more than 10 percent higher return on equity than those companies with the least percentage of women in
leadership’, and came to the conclusion that ‘In reality, the question is not women or men, it’s how to ensure women and men are working together in decision-making roles’.3
* Ireland will be introducing compulsory gender quotas for parliamentary candidates at the next general election in 2016.
IntroductionIntroduction
12.3% of council leaders in England are women
14.6% of Police and Crime Commissioners

14
Sex and Power 2013
If this is true for major companies, it is also true for government.
Moreover, there is some evidence to suggest that the presence of women changes what is debated in the public realm as well as what government actually does. Research carried out by the Hansard Society4 found that women can and do bring issues to the table which may not otherwise be debated, or which might wrongly be considered to be of less significance, Excluding women thus has the effect of making the legislature less relevant to the whole population, both male and female, than it has the potential to be.
Then there is the sheer waste of resources involved. There is huge investment in women and girls through the education system, and they go on to develop skills and expertise which, combined with their life experience, make them essential to good government. If they are largely excluded from national (and local) politics these skills are under-used in terms of public benefit in national leadership, and whilst it is true that in many respects the life experiences of men and women are the same, in many they are not. To be truly effective the country’s democratic
institutions need to attract the best possible people, regardless of who they are or what their background is.
What applies to politics applies to other areas as well. We looked at most of the fields which could be described as coming within the definition ‘public life’ – in other words, areas which either raise or spend public money (e.g. health), which make fundamental decisions about individual lives (e.g. the courts) or which influence or affect our national culture (e.g. the media). In almost all of them the over-representation of men is evident; in some the absence of women is marked. Even in trades and professions in which women predominate as employees they are often hard to find at the top.
Nor is the industry which comments on politics a balanced one. The parliamentary lobby, where most political journalists and their editors work, was found in research done by the Guardian newspaper to be heavily male, with only 23.1 percent of lobby journalists for national daily newspapers being female and none of the political editors.5 The picture is slightly better for the Sunday papers, and slightly better again for broadcasters, but the overall picture and culture are so male that, when David Cameron and Nick Clegg held their press conference on the coalition’s mid-term review on 7 January they seemed unable to find a single female journalist or commentator in the room from whom to take a question.
All this matters because it means that all aspects of public life in Britain are headed up by people drawn from a very narrow section of the population, not just in terms of gender but also, amongst other things, of race, class, disability, sexuality and age. Many of our legislators are drawn from the professions and industries included in this study, and in the section of the report entitled ‘The Wider Picture’ we look at them in more detail, but it is clear that, even allowing for the rise of the ‘professional’ politician, many Members of the UK Parliament, Members of the European Parliament, Welsh Assembly Members and Members of the Scottish Parliament and others come from backgrounds in the law, finance, education, business and the armed forces. If the decision-making levels of these are heavily male, it is hardly surprising if women find it equally difficult to break into elected office.
We believe that, despite all that has happened in recent years, politics still matters, and that who does it matters too. Politicians are our legislators and form our governments. They make decisions which have a direct effect on people’s lives on a huge range of issues, from who should receive child benefit to whether or not to go to war, from where high speed railways should be built to what the time limit for abortions should
be, from what tax levels we all pay to whether or not political parties should be allowed to use positive action in candidate selections. A more diverse body politic with a wider spread of expertise and reflecting the life experience of both halves of the human race would be better placed to lead us through the
23% of parliamentary lobby journalists
36.4% of public appointments are women
15.6%
of High Court Judges
14.2% of University Vice Chancellors

15
complex times that face us.
The lack of diversity in public life in itself weakens democracy and public confidence in it. When people look at Parliament they do not see the best of themselves reflected back at them. This report relates specifically to women, but the same is true of many minority groups as well. We recognise that simply putting more white, middle-aged, middle-class women into Parliament will not solve the whole problem (though we do think, given the imbalance, that more white, middle-aged, middle-class women would still be better than more white middle-aged, middle-class men), and we would have liked to include much more detail about the lack of diversity in public life other than in terms of gender alone. However, the sad fact is that most of that information is not available, and is not even collected or collated; that it is available for women is largely due to the efforts of women’s groups down the years to find it and get it published, and to the EOC and EHRC for having researched it since 2003.
Campaigns to increase women in politics (or at the top of professions or in boardrooms) are sometimes criticised on the grounds that we are only concerning ourselves with a small minority of privileged women. We wholeheartedly agree that there is much more to gender equality than just who occupies well-paid and influential jobs. But these are spheres in which great power is exercised, not only financially but in terms of culture, access to education and training and the maintenance of civil rights and the law. They are also areas which are relatively straightforward to monitor and assess – at least when it comes to gender.
However, as our recommendations reflect, there should be a much more concerted effort made to identify who the people in public life (especially politics) are in terms of a much wider range of indicators,* and we find it particularly surprising that no effort whatsoever is made to monitor the diversity of people standing for public office at the point at which nominations are made. We need to know who is standing and not being elected as well as who stands and succeeds, and at the moment finding this out in any meaningful detail for any indicator other than sex is next to impossible. In an ideal world we might have been able to drill down a little further, but both our mission and our resources mean that in this report we have only been able to make sustained and detailed analysis of gender.
We believe that unless there is significant and lasting improvement at all levels of society we will not achieve a culture in which women’s access to power – both personal and political – at every level is a given rather than something which has to be asked for and may or may not be granted. For instance, the lack of women in the Cabinet means that women are not generally perceived as powerful; this perception filters throughout society, reinforces gendered assumptions and stereotypes of what a leader looks like, and impacts directly on women’s power and agency.
We can and must change that.
We have often been told that we live in a meritocracy in which women could achieve high office if they wanted to, and that the failure of women to do so when they have equality of opportunity is more about them than it is about power, structures or prejudice. We agree that women more often want training, mentoring and support to take on senior roles, and indeed we regard this as a strength rather than a weakness, since it suggests that women want to prepare properly for responsibility. But we see no evidence to suggest that there actually is a meritocracy so far as women (or other under-represented groups) are concerned, and in fact the figures contained in this report seem to suggest the reverse.
Getting more women into public life requires more than just equality of opportunity; it also requires equality of commitment and a real understanding of why the strengths and attributes of both sexes are essential to our future joint success.
At the end of the report we have made six recommendations for what needs to be done, both now and in the longer term, to make faster progress towards parity in public life, and we call upon all those involved – including government, Parliament, political parties and the media – to implement them immediately. The monetary cost of doing so is very low, but the cost to democracy of failing will be high, and a small investment now will reap huge rewards in the future. We know that change is possible, but without real, committed and targeted action now we will continue to drift.
* The ‘protected strands’ identified by the EHRC are age, disability, gender, race, religion and belief, pregnancy and maternity, marriage and civil partnership, sexual orientation and gender reassignment.
Introduction

16
Sex and Power 2013
In a year’s time we will be coming back to see what progress has been made, especially as the 2014 English local and European elections and the 2015 general election will then be approaching. We hope that we will start to see real change, particularly in politics, and that we will be able to report much more positively about sex and power in 2014.
After all, one lifetime is more than long enough to wait.
Nan Sloane Katie Ghose Ceri Goddard Director Chief Executive Chief ExecutiveCentre for Women & Democracy Electoral Reform Society Fawcett Society
Ruth Fox Alexandra RunswickDirector & Head of Research Deputy DirectorHansard Society Unlock Democracy
17
Governments are generally thought to be composed of elected politicians, but in fact the activity of government – and therefore the exercise of its power – is carried on by a variety of officials and bodies. Elected office – particularly that held by the political party in power – is clearly the main element of this combination, but both individuals appointed through the public appointments system and civil servants have roles to play and powers to exercise.
Taken together, these are the people who rule Britain, and the under-representation of women in their ranks is striking.
1. Elected Office
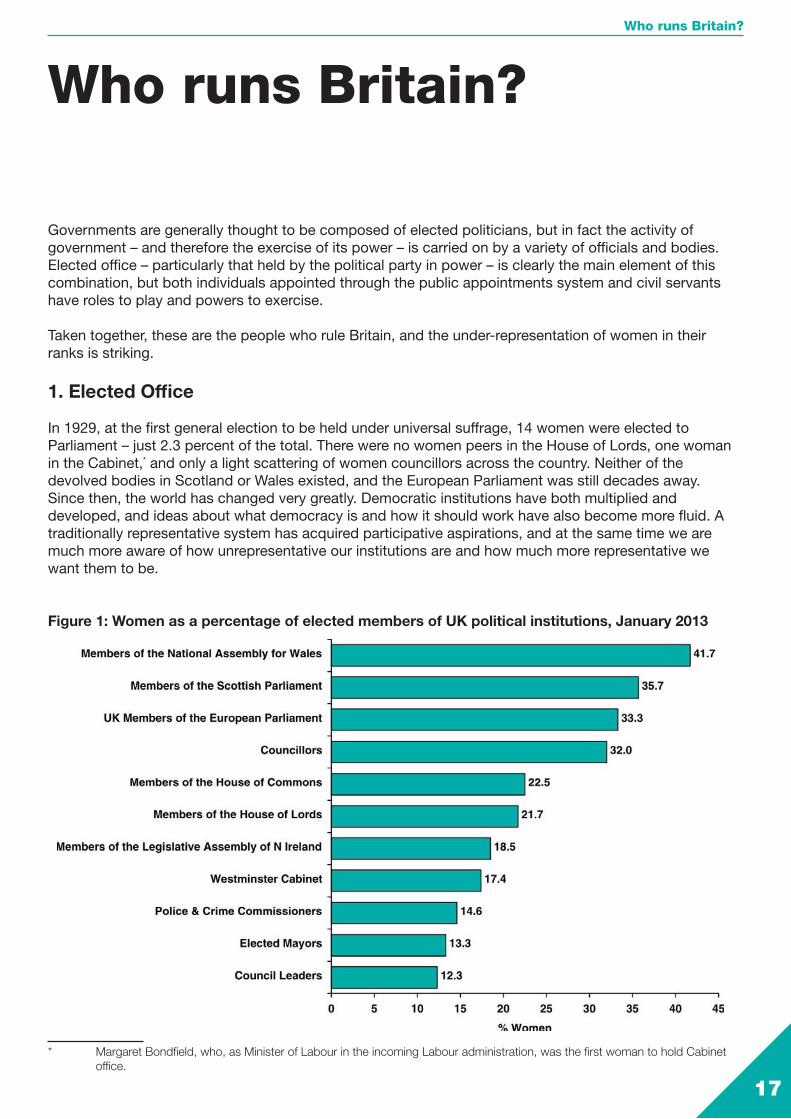
In 1929, at the first general election to be held under universal suffrage, 14 women were elected to Parliament – just 2.3 percent of the total. There were no women peers in the House of Lords, one woman in the Cabinet,* and only a light scattering of women councillors across the country. Neither of the devolved bodies in Scotland or Wales existed, and the European Parliament was still decades away. Since then, the world has changed very greatly. Democratic institutions have both multiplied and developed, and ideas about what democracy is and how it should work have also become more fluid. A traditionally representative system has acquired participative aspirations, and at the same time we are much more aware of how unrepresentative our institutions are and how much more representative we want them to be.
Figure 1: Women as a percentage of elected members of UK political institutions, January 2013
* Margaret Bondfield, who, as Minister of Labour in the incoming Labour administration, was the first woman to hold Cabinet office.
Who runs Britain?Who runs Britain?
18
Sex and Power 2013
The slow progress towards gender equality in our democratic structure is therefore both surprising and disappointing. At the 2010 general election, more than 80 years after electoral equality was achieved, just 142 women were elected – certainly much better than in 1929, but at 22 percent bringing us nowhere near parity. There have been women in the House of Lords since 1957, but again the percentage is low (21.7 percent) and given that there is a built-in quota for men in the form of Church of England bishops and only two women sitting as hereditary peers (and 90 men), the cards are stacked against any kind of equality prevailing in an unreformed House.
As the charts and tables in this report show, women have progressed in some areas (e.g. as local councillors) and are much better represented in the devolved institutions and the European Parliament, but there is no doubt that across the board there is still a long way to go and that progress is very slow. In the case of the House of Commons, for instance, it has been estimated that a child born today will be drawing her pension before there is parity of representation between women and men.
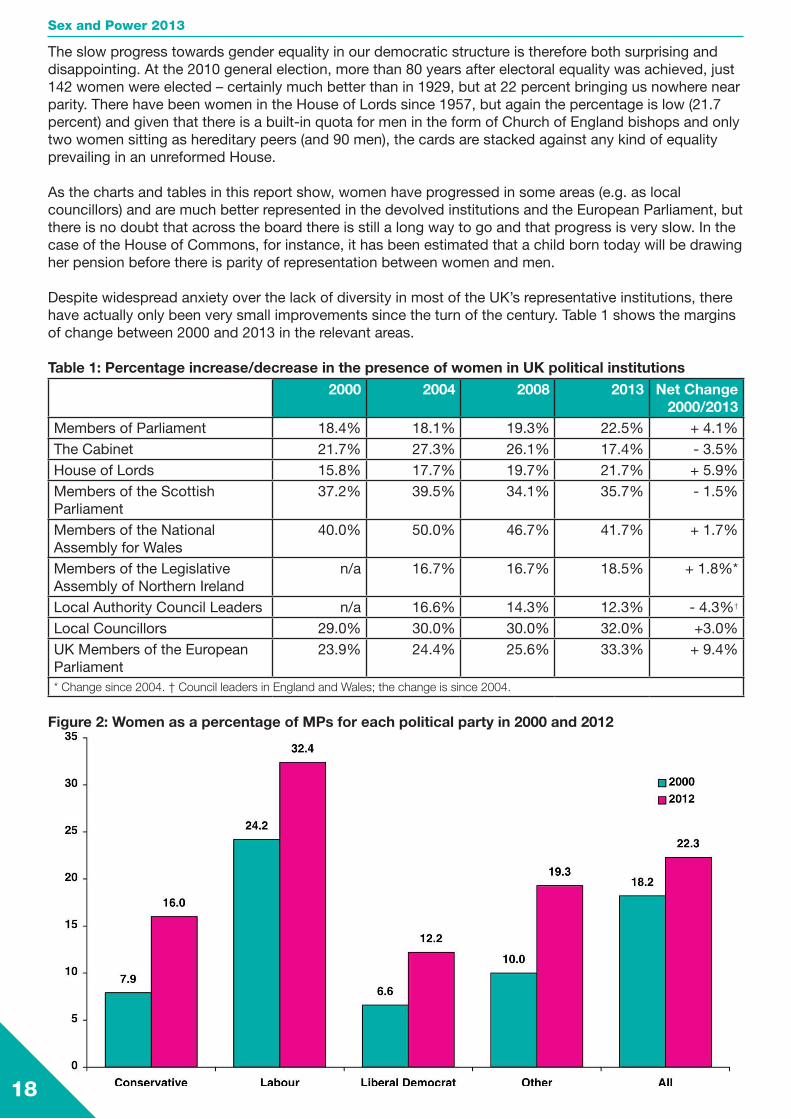
Despite widespread anxiety over the lack of diversity in most of the UK’s representative institutions, there have actually only been very small improvements since the turn of the century. Table 1 shows the margins of change between 2000 and 2013 in the relevant areas.
Table 1: Percentage increase/decrease in the presence of women in UK political institutions2000 2004 2008 2013 Net Change
2000/2013Members of Parliament 18.4% 18.1% 19.3% 22.5% + 4.1%The Cabinet 21.7% 27.3% 26.1% 17.4% - 3.5%House of Lords 15.8% 17.7% 19.7% 21.7% + 5.9%Members of the Scottish Parliament
37.2% 39.5% 34.1% 35.7% - 1.5%
Members of the National Assembly for Wales
40.0% 50.0% 46.7% 41.7% + 1.7%
Members of the Legislative Assembly of Northern Ireland
n/a 16.7% 16.7% 18.5% + 1.8%*
Local Authority Council Leaders n/a 16.6% 14.3% 12.3% - 4.3%† Local Councillors 29.0% 30.0% 30.0% 32.0% +3.0%UK Members of the European Parliament
23.9% 24.4% 25.6% 33.3% + 9.4%
* Change since 2004. † Council leaders in England and Wales; the change is since 2004.
Figure 2: Women as a percentage of MPs for each political party in 2000 and 2012

19
The most frequent area of concern is the House of Commons which, as the UK’s primary legislative body, is seen as having both a greater responsibility and a greater challenge in becoming and remaining reflective of the people it governs and serves.
Figure 3: Women as a percentage of Westminster MPs in the English regions and devolved nations
Prior to 1997, the percentage of women MPs never achieved double figures, the high point being 9.2 percent in 1992. In 1997 it doubled to 18.2 percent, but since then it has dawdled through three general elections in which, as Table 1 shows, the net change was negligible.
Individually, however, the political parties have all improved to one degree or another, although, as Figure 2 suggests, Labour’s use of positive action in 1997, 2005 and 2010 makes the overall improvement look better than it might otherwise have been. The increase in the Conservative position is largely due to the use of the (now abandoned) A-List system in 2010, whilst the percentage improvement shown by the Liberal Democrats represents a numerical advance over the period from three to seven women MPs.
Figure 4: Women as a percentage of MPs in eight western European countries 2000-2012
Who runs Britain?

20
Sex and Power 2013
There is, as Figure 3 illustrates, a considerable variation between regions, from London (where 34.2 percent of MPs are women) to the South East of England (17.6 percent).
Internationally, women are on the whole better represented than in much of the rest of the world, although that picture is a little less reassuring when comparisons are made (as in Figure 4) with western European (and therefore comparable) neighbours.
The UK also continues its slow fall through the global league table. Just before the 2010 general election the Westminster Parliament was ranked 62nd (out of 189 countries); immediately after it rose to 51st equal. However, the effect of other countries leapfrogging up the table as their own elections produce improvements has been to push the UK back down to 60th equal, and this pattern is likely to continue as we approach 2015. As Figure 5 shows, this represents a continuing underlying trend.
Figure 5: UK placing in Inter-Parliamentary Union World Rankings in terms of Women as a percentage of MPs 2001-2012
If the House of Commons is unrepresentative the House of Lords is no better, although excluding bishops, judicial peers and hereditary peers from the calculation improves matters a little on the surface. Appointments to the House of Lords are dealt with by the Lords Appointments Commission, three of the seven members of which are women (though the Chair is male).
Figure 6: Women as a percentage of members of the House of Lords by type

21
Figure 7: Women as a percentage of each political party’s peers
The failure of House of Lords reform means that new life peers are likely to continue to be made; the gender breakdown of these remains to be seen.
The UK sends 72 Members to the European Parliament, and here women do a little better. The European Parliament as a whole has usually out-performed the UK, though in recent elections the gap has been closing.
Figure 8: Women as a percentage of MEPs for the UK and the EU as a whole in 2000 and 2012
MEPs are elected using the de Hondt system of proportional representation which involves parties producing ranked lists of candidates. Electors vote for the party rather than the individual candidates, with candidates being elected in the order in which they appear on the list until all seats are filled. As a result it is much easier for parties to use positive action to balance the lists if they wish, and Labour, the Liberal Democrats and the Green Party take advantage of this.
The establishment in 1999 of the Scottish Parliament and the National Assembly for Wales raised considerable hopes of a ‘new kind of politics’, and indeed they have both consistently out-performed the Westminster Parliament in terms of women elected. However, progress has not been smooth and the high points of 2003 have proved elusive. Both bodies use proportional representation systems for their elections, and both the Labour Party and (in Wales) Plaid Cymru either use or have used positive action mechanisms at various points.
Who runs Britain?

22
Sex and Power 2013
Figure 9: Women as a percentage of MSPs and AMs elected in Scotland and Wales 1999-2011
When it comes to local government, the percentage of women councillors is now very slowly increasing, but the level of women in leadership roles is decreasing. Only 12.3 percent of councils are led by women, and research on local government leadership conducted by the Centre for Women & Democracy and published in 20116 found that women were much less likely than men to hold the key corporate (18 percent women), financial (7 percent) and economic development (12 percent) portfolios which form the main leadership pipeline.
Women are slightly better represented in percentage terms as elected mayors (13.3 percent), but this represents two out of a total of only 15 individuals. Six (14.6 percent) of the 41 newly-elected Police and Crime Commissioners are women.
2. Public Appointments
Public appointments are made to a wide variety of bodies and organisations, some of which are directly connected to government, whilst others are either arms-length or independent. They include organisations as diverse as the Driver and Vehicle Licensing Agency, the Care Quality Commission and the Office of Fair Trading, and collectively, they exercise considerable influence.
Table 2 gives the figure for women as a percentage of public appointments overall, but also looks at four specific types of organisation. Many, but by no means all, of these have their chairs and board members appointed by ministers on the recommendation of the Commissioner for Public Appointments. The process by which this is done has long been regarded as difficult to access and pass through, and has proved particularly unattractive to women.
In its 2010 Equality Strategy7 the government set an ‘aspirational target’ that, by 2015, 50% of new public appointments to public boards would be women. However, it does not seem to be monitoring this target, and its own progress review, published in May 2012, makes no mention of it.8
The specific areas included in the study (largely because of either their closeness to government or their significant role in the regulation or delivery of services) are:
• Departmental Boards, which were set up in each ministry by the Coalition Government in 2010 to ‘tap into the expertise of senior leaders with experience of managing complex organisations in the commercial private sector’.9 Boards are chaired by the relevant Secretary of State and include ministers, civil servants and non-executive members from outside government. The figures include this last group only, since ministers and senior civil servants are counted elsewhere;
• Non-Ministerial Departmental Public Bodies, which are established by law with a specific remit

23
exercised at arm’s length from government – the Crown Prosecution Service, for instance, or HM Revenue and Customs – but funded by the public purse to carry out functions which are part of the government’s remit. They have a chair and board as well as a chief executive;
• Executive Agencies and other Public Bodies such as the Identity and Passport Service, the Parole Board or the Royal Parks, exercise specific functions connected with the delivery of services or policy. These bodies have chief executives (or equivalent) but not chairs or boards, and they may be directly responsible to a minister (e.g. the UK Border Agency is responsible to the Home Secretary). For purposes of this study we have looked at a sample of 72 which include a range of purposes and responsibilities;
• Regulatory Bodies, such as the Human Tissue Authority or the Information Commissioner’s Office, which have legal duties either delegated to them by government or established in law. They function independently of government and usually have their own chair and chief executive working below the departmental level of responsibility with a range of activities. For purposes of this study we have looked at a sample of 58 which include a range of purposes and responsibilities.
In a small number of cases, Chairs of Boards also function as Chief Executive Officers (CEO); where this happens the individual has been counted as CEO only to avoid double-counting. The list of bodies included in the study can be found in Appendix 2.
Table 2: Public AppointmentsPercentage women
Public Appointments10 All 36.4%Departmental Boards11 Non-Executive Directors 32.1%Non-ministerial Departments12 Chairs 31.3%
Chief Executives or equivalent 27.3%Executive Agencies13 Chief Executives or equivalent 15.8%Regulatory Bodies14 Chairs 41.6%
Chief Executives or equivalent 25.4%
3. The Civil Service
The third element of public decision-making is the Civil Service. Here women are also very poorly represented, and although there are improvements from time to time, they are rarely sustained for any significant period of time.
Thus at the point (September 2012) at which this snapshot was taken, the higher echelons of the Civil Service were as lacking in diversity as their political masters (and mistresses); although 53 percent of all Civil Service staff are female,15 there were only six women in post as Permanent Secretaries or equivalent (16.7 percent)16 with women holding 31 percent of all top management posts.17
4. Special Advisers
There is considerable concern in some quarters about the ‘professionalisation’ of politics, with an increase in the level of public representatives, especially MPs, being drawn from the ranks of ministerial Special Advisers (SpAds), public affairs and lobbying companies and think tanks.
In October 2012, 41 percent of Special Advisers working for the government were women.18 There are currently no figures available for political advisers working for the opposition.
There are no figures either on the diversity of people working as lobbyists, for public affairs companies or in think tanks, and we have therefore not reported on them.
Who runs Britain?
24
Sex and Power 2013
5. The Wider Picture
Politics does not operate in a vacuum, nor are elected bodies the only repositories of power or public decision-making. Who holds senior office in other organisations, professions and spheres influences a wide variety of areas, including policy-making, funding, and the general culture of society as a whole as well as public life.
These posts are also important because they often form part of the routes taken to access public office, so that a lack of diversity in them can and does impact on the diversity of our democracy.
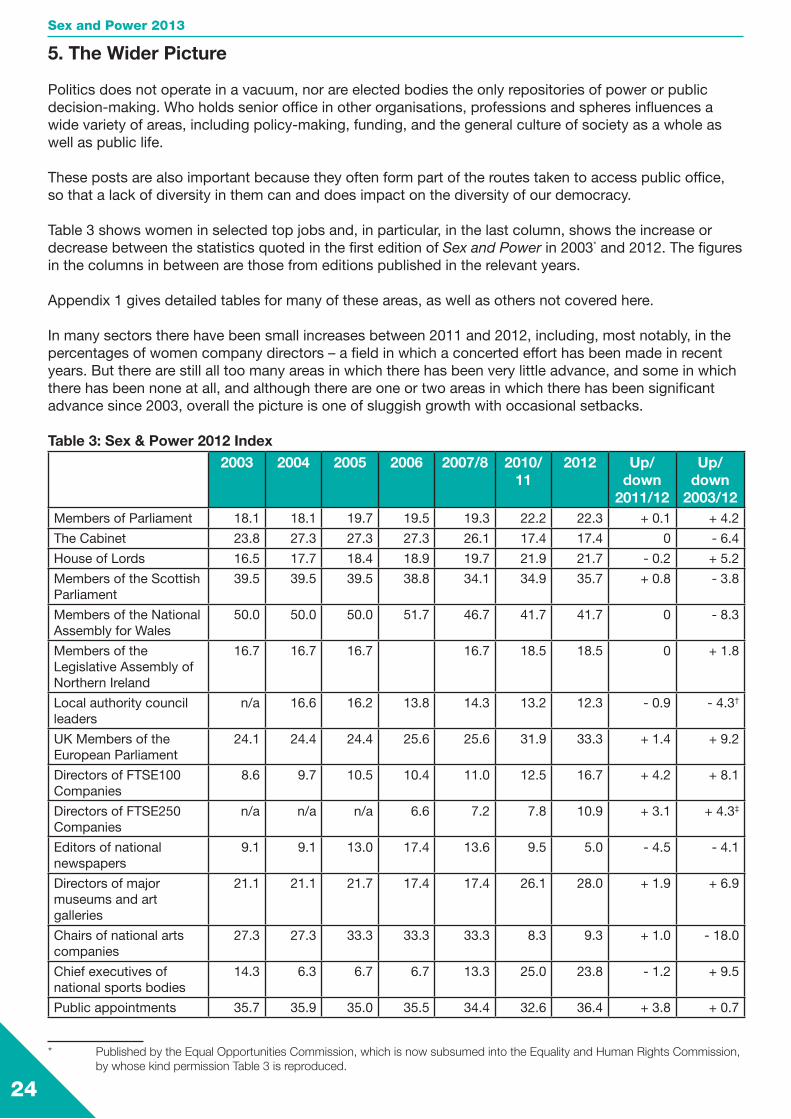
Table 3 shows women in selected top jobs and, in particular, in the last column, shows the increase or decrease between the statistics quoted in the first edition of Sex and Power in 2003* and 2012. The figures in the columns in between are those from editions published in the relevant years.
Appendix 1 gives detailed tables for many of these areas, as well as others not covered here.
In many sectors there have been small increases between 2011 and 2012, including, most notably, in the percentages of women company directors – a field in which a concerted effort has been made in recent years. But there are still all too many areas in which there has been very little advance, and some in which there has been none at all, and although there are one or two areas in which there has been significant advance since 2003, overall the picture is one of sluggish growth with occasional setbacks.
Table 3: Sex & Power 2012 Index2003 2004 2005 2006 2007/8 2010/
112012 Up/
down 2011/12
Up/down
2003/12Members of Parliament 18.1 18.1 19.7 19.5 19.3 22.2 22.3 + 0.1 + 4.2
The Cabinet 23.8 27.3 27.3 27.3 26.1 17.4 17.4 0 - 6.4
House of Lords 16.5 17.7 18.4 18.9 19.7 21.9 21.7 - 0.2 + 5.2
Members of the Scottish Parliament
39.5 39.5 39.5 38.8 34.1 34.9 35.7 + 0.8 - 3.8
Members of the National Assembly for Wales
50.0 50.0 50.0 51.7 46.7 41.7 41.7 0 - 8.3
Members of the Legislative Assembly of Northern Ireland
16.7 16.7 16.7 16.7 18.5 18.5 0 + 1.8
Local authority council leaders
n/a 16.6 16.2 13.8 14.3 13.2 12.3 - 0.9 - 4.3†
UK Members of the European Parliament
24.1 24.4 24.4 25.6 25.6 31.9 33.3 + 1.4 + 9.2
Directors of FTSE100 Companies
8.6 9.7 10.5 10.4 11.0 12.5 16.7 + 4.2 + 8.1
Directors of FTSE250 Companies
n/a n/a n/a 6.6 7.2 7.8 10.9 + 3.1 + 4.3‡
Editors of national newspapers
9.1 9.1 13.0 17.4 13.6 9.5 5.0 - 4.5 - 4.1
Directors of major museums and art galleries
21.1 21.1 21.7 17.4 17.4 26.1 28.0 + 1.9 + 6.9
Chairs of national arts companies
27.3 27.3 33.3 33.3 33.3 8.3 9.3 + 1.0 - 18.0
Chief executives of national sports bodies
14.3 6.3 6.7 6.7 13.3 25.0 23.8 - 1.2 + 9.5
Public appointments 35.7 35.9 35.0 35.5 34.4 32.6 36.4 + 3.8 + 0.7
* Published by the Equal Opportunities Commission, which is now subsumed into the Equality and Human Rights Commission, by whose kind permission Table 3 is reproduced.

25
2003 2004 2005 2006 2007/8 2010/ 11
2012 Up/down
2011/12
Up/down
2003/12Local authority chief executives§
13.1 12.4 17.5 20.6 19.5 22.8 22.9 +0.1 + 9.8
Senior ranks in the armed forces
0.6 0.8 0.8 0.4 0.4 1.0 1.8 + 0.8 + 1.2
Senior police officers 7.5 8.3 9.8 12.2 11.9 16.8 17.6 + 0.8 + 10.1
Senior judiciary (high court judge and above)
6.8 8.3 8.8 9.8 9.6 12.9 13.6 + 0.7 + 6.8
Civil Service top management19
22.9 24.4 25.5 26.3 26.6 29.2 31.0 + 1.8 + 8.1
Head teachers in secondary schools
30.1 31.8 32.6 34.1 36.3 35.5 38.4 + 2.9 +8.3
University vice chancellors
12.4 15 11.1 13.2 14.4 14.3 14.2 - 0.2 + 1.8
NHS chief executives 28.6 27.7 28.1 37.9 36.9 31.4 34.8 + 3.4 + 6.2
Trade union general secretaries
18.3 16.9 22.4 23.0 20.7 27.3 27.8 + 0.5 + 9.5
Heads of professional bodies
16.7 25.0 33.3 33.3 25.0 33.3 33.3 0 + 16.6
† Council leaders in England; the change is since 2004. ‡ Change since 2006. § CEOs in England, Scotland and Wales.Note: The statistics in this index have been selected to represent positions considered to have power or influence in Britain. As far as possible, these statistics relate to Great Britain or to the United Kingdom, with the obvious exceptions of the Scottish Parliament, the National Assembly for Wales and the Legislative Assembly of Northern Ireland, which relate only to those countries. For each statistic included, the percentage of women has either been taken directly from the source, or it has been calculated from the actual numbers of women and men.
As we have noted, many of these areas act as pipelines for both women and men entering politics, and their relative representation in them both directly and indirectly affects the gender balance of public representatives. For this report we looked specifically at how women’s presence in (or absence from) these pipelines might impact their access to political power.
The Pathways to Politics research carried out for the Equality and Human Rights Commission after the 2010 general election20 suggested that, whilst the pattern of access to politics was changing, it remained the case that both candidates and public representatives are still drawn largely from a small group of occupations, trades and professions. We have looked at this group in the light of how they serve as routes into public life, but the figures themselves also highlight the shocking degree to which women are routinely excluded from decision-making roles in society as a whole.
Pathways to Politics found that for members of the Westminster, European and Scottish Parliaments and the Welsh Assembly the most common prior involvement in politics across all parties was as a local councillor; 52 percent of politicians elected had at some point held office at this level.21 We have already noted that whilst women fare better in local government (at least on the back benches) than at other levels of political office, they still constitute only 32 percent of councillors. The 2007 Councillors’ Commission report examined in detail the barriers to women’s access to local government, and the Centre for Women & Democracy produces annual reports on women’s performance in local elections. To date, there are no signs that progress is accelerating, and the presence of women at the most senior levels is actually falling. If service as a local councillor continues to be a primary route into politics it will clearly not deliver significantly improved numbers of women in the short-term unless the numbers elected increase significantly.
The area which has caused most concern recently is the apparent rise of the ‘professional’ politician – that is, politicians whose whole lives have been spent in political activity of one kind or another, who have worked for MPs or political parties, and who usually have a university education. The EHRC study found that 17 percent of politicians reported previous employment by an MP and a further 7 percent had been employed by a political party.
Who runs Britain?
26
Sex and Power 2013
It also found that another 5 percent had worked either in public affairs or as lobbyists, whilst 3 percent had been employed by think tanks or policy groups.
There are currently no available figures for the gender breakdown of any of these areas, and it is not therefore possible at present to specify whether this kind of background helps women or militates against them.
For most politicians, however, previous employment was outside politics itself. 22 percent of new Conservative MPs elected in 2010, for instance, have a background in business, whilst 10 percent of all MPs had worked in financial services.22
Thus the under-representation of women in our economic and financial institutions affects more than just women themselves, or even the quality of decision-making at board level. As Table b) in Appendix 1 demonstrates, women are largely absent from the higher echelons of business, and although considerable efforts have recently been made to change this, they have yet to bear significant fruit. In addition, there are now only two women chief executives running UK FTSE 100 companies.*
When it comes to regional and local economic development, the new Local Enterprise Partnerships (LEPs) show an alarmingly low level of female participation. This is particularly disappointing since it is known that – apart from anything else – increasing women’s economic activity could significantly promote growth. According to the Federation of Small Businesses, 29 percent of entrepreneurs are women, yet only 14.9 percent of private sector members of LEPs are women.
Thus the relative absence of women from the business and financial sectors means that it is probable that fewer will come through into politics at a time when the numbers of MPs from that background are increasing.
The trade unions, which are key players in both the public and private sectors, are also heavily male-dominated, and this is particularly the case with the very large unions, all of which, with the exception of the two representing teachers, are led by men. In 2012 the TUC appointed its first female General Secretary, but it remains to be seen what impact this will have on the wider culture.
More than 55 percent of politicians in national and devolved bodies are members of trade unions.23 It is, of course, by no means the case that everyone who is a member of a trade union is active in it, and membership of a trade union does not indicate having had support from it, either. However, 8 percent of those surveyed for the Pathways to Politics report indicated that they had been employed by a trade union; since there is no gender breakdown available for trade union employees it is impossible to say whether or not this benefits women candidates.
Another key route into politics for both men and women is the legal profession and, in theory, it is one in which women should be well represented at all levels.
66 percent of all students studying law in 2010/11 were women,24 and, according to the Law Society, the number of women entering the legal profession has been steadily increasing. In 2011, 46.5 percent of solicitors were women; in 2010, 34.8 percent of barristers were women and 10.9 percent of Queen’s Counsels (QCs).
Yet, apart from at magistrate level, women feature relatively little at the higher levels of the judicial system; at almost all judicial levels women constitute less than 20 percent of office-holders (see Table c) in Appendix 1).
One of the issues which can have a direct effect in reducing the numbers of women in the pipeline is the rate at which women leave careers before reaching senior levels. The law is one of the very few professions for which drop-out rates seem to be available; according to the Association of Women Solicitors, the drop-out rate for women is twice that of men, and according to the Bar Council the drop-out rate for women barristers after 10 to 12 years of service is ‘high’. This means that in both professions
* In September 2012 there were four, but Marjorie Scardino at Pearson and Cynthia Carroll at Anglo American have since stood down.

27
women are significantly less likely to reach the levels from which they are likely to be considered for promotion to the most senior roles.
12 percent of politicians have been employed by a charity or campaigning organisation at senior level.25 There are a vast number of charities in the UK, ranging from large international aid organisations to very small groups raising money for specific local causes. According to the Charity Commissioner’s website there are just under 163,000 registered charities in the UK,26 and many of these have a significant impact on the lives of millions of individuals. This will only increase as more services formerly provided by government are moved to the third sector.
In September 2012, 24 percent of charities had women chief executives,* and 19.2% of professional bodies (i.e. bodies which have not been included in the section on public appointments because they are private bodies not under the auspices of either the government or the Commissioner for Public Appointments, e.g. the Law Society, the Royal College of Nursing or the Royal Institute of British Architects†).
The rise in the number of MPs coming from political, business or campaigning backgrounds has been matched by falls in other areas. In 1997, for instance, 17 percent of MPs were drawn from the education sector; by 2010 this had fallen to just 5 percent. Similarly, those from the medical professions had halved from 8 percent in 1997 to 4 percent in 2010.27
As Tables e) and f) in Appendix 1 show, women are under-represented at senior levels in both of these fields; the only exception to this is as primary school heads (71.3 percent) and it remains to be seen what effect on this figure the 50 percent increase in the numbers of men applying to train as primary school teachers will have.28
There are also a number of other areas in which important public decisions are made, whose leaders interact with politicians and may ultimately enter Parliament as either MPs or peers, or who are able to influence public thinking and activity through the way in which they use public or publicly raised funds. These include the police, the armed forces, sport and the arts, and figures for the representation of women in all of these are included in the tables in Appendix 1. Needless (and sadly) to say, women are under-represented at senior levels in almost all of them, even those where they might have been expected to do well.
Finally, the tone and much of the culture of public life is set by newspapers and the media, and here again there is a marked absence of women. Table i) in Appendix 1 gives figures in terms of both ownership and editors (women constitute 5 percent of editors of national daily papers), and research by Women in Journalism found that ‘in a typical month, 78 percent of newspaper articles are written by men, 72 percent of Question Time contributors are men and 84 percent of reporters and guests on Radio 4’s Today programme are men.’29 Given that 75 percent of people get their political news and views from television, 27 percent from tabloid newspapers and 26 percent from radio,30 this apparent silence from women has an effect on both the visibility of women as role models and the subject, nature and tenor of public debate.
In recent years there has been much discussion of what needs to be done to widen access to political power not just in relation to gender, but also ethnicity, disability, class and sexuality (to name but four). Certainly the current narrow social band from which MPs are drawn needs to be broader, but it is also the case that, given that it is probable that many MPs and other public representatives will continue to be drawn from many of the occupations looked at in this report, access to them is broadened also. It is not within the scope of this report to look at how that might be done, but it is clear that the whole question of access is about more than just the political structures and their pipelines, and is in effect about the nature of the society we have and the one to which we aspire.
Women access (or fail to access) public life in a number of ways, and the barriers to their doing so have been well rehearsed in other research and inquiries.‡ It is not proposed to go through them again here,
* Given the vast number of charities across the country, this study has concentrated on those with the highest incomes or assets as defined in Women Count’s Charity Leaders 2012 report.† For a full list of professional bodies included in this study see Appendix 2.‡ These include the Councillors’ Commission in 2007 and the Speaker’s Conference report of 2010, both of which amply cover
Who runs Britain?
28
Sex and Power 2013
but it is appropriate to note that, given that people will always enter political life from some or all of the routes looked at above, the absence of women matters not just in terms of the professions and activities themselves, but also for the future of our political institutions.
the major barriers women face and propose solutions.
29
This research sets out the problems, but if we are not to be reporting the same figures again in future years action needs to be taken as a matter of urgency.
We are therefore making six recommendations for things which could be done by various bodies and organisations to make a difference. We recognise that not all of them are simple, and some require both political and cultural will, but they are all known to work.
These recommendations relate specifically to women and political power, but several would also be appropriate in other arenas. As we have already said, politics does not function in isolation from the rest of society, and change needs to happen across the board.
1. Selecting candidates
Political parties are the gatekeepers to political power, and whilst some do better than others in terms of the diversity of candidates, all could do better. The face of politics in the UK will only change if political parties change; without action from them no actions elsewhere will be effective.
R1: Political parties should take immediate action to increase the numbers of women candidates at all levels of election with a view to fielding as many women candidates from as wide a variety of backgrounds and communities as possible in winnable seats in 2015. This should include active consideration of positive action measures in selection processes.
2. Measuring what matters
There is currently very little monitoring of the diversity of candidates for political office.* In particular, there is no monitoring of candidates at the point at which they hand in their nomination papers to returning officers, which would be the obvious stage at which meaningful information about gender, ethnicity, disability, sexual orientation and so on could be collected. At present some information is available on gender (or, more specifically male/female), but hardly any on any other aspect.
If such information was collected at the point of nomination and sent by returning officers to a central point for collation and eventual publication it would be possible to monitor, track and understand progress much more easily. Data about individual candidates would not be published, but the aggregate figures are critical if we are to see real change in who has and holds political power.
R2: In order to enable everyone concerned to develop a much better understanding of the issues, a monitoring form similar to that used in recruitment for public appointments and applications for funding should be introduced. It would be completed and submitted to returning officers by all candidates together with nomination forms at all levels of election, and the results collated and published annually. This requirement should be implemented at the 2014 English local and European elections.
* A figure for women as local election candidates is included in the annual Local Elections Handbook produced by Colin Rallings and Michael Thrasher at the University of Plymouth. The Centre for Women & Democracy produces an annual analysis of women in local elections. Political parties are now required to declare diversity figures for parliamentary candidates every six months.
Next steps: Recommendations
Next steps: Recommendations

30
Sex and Power 2013
3. Training and mentoring
Mentoring has become a recognised way, particularly in business, of encouraging and supporting talent, and ongoing training is key to identifying and developing potential candidates at all levels.
We recognise that the primary function of all political parties is to fight and win elections, and that, although they are almost all committed to diversity in theory, it is often difficult for them to find resources for training and developing thousands of local government candidates. However, given that they are the gatekeepers to political office they bear a large part of the responsibility for the structures that promote diverse representation.
We also recognise that, at least in the first instance, not all women come to politics through political parties, and there is currently no adequate provision for identifying and encouraging them.* In other countries NGOs exist which provide sustained and programmed political mentoring and training to women on a non-party basis,† but at present there is no such body in the UK.
R3: Government should pilot a new government-wide scheme in 2014 to increase women’s presence, profile and participation in the 2015 general election and beyond. This could be done by drawing together experience from the UK and abroad which could be used to improve both the participation and the candidacy of women of all backgrounds in Britain.
4. Using what we know
In recent years there have been several (expensive) inquiries into access to politics, including the Councillors’ Commission (which reported in 2007) and the Speaker’s Conference Report of 2010. These, together with most other investigations, highlight the same problems and propose similar solutions. Failure to take note of these findings or to implement more than the most marginal of the recommendations means that progress is slow and the wheel is continuously being reinvented.
If we are to make a difference to the access of women (and other under-represented groups) to power we need to make use of what we already know rather than looking over and over again for new solutions.
R4: Government, political parties and others should act to implement the recommendations of the Speaker’s Conference Report published in 2010.
5. Changing the culture
It is generally acknowledged that the culture of public life, exemplified by the schoolboy atmosphere of Prime Minister’s Questions in the House of Commons but common at all levels of politics, together with the tone of much of the media coverage of women in politics, is off-putting to many women (and men). We know that this is not something which can be changed overnight, and that it feeds into and from a variety of other issues which are outwith the remit of this report, but we believe that, unless steps are taken to make both political life and the coverage of it less aggressive and demeaning‡ it will remain difficult to change the face of democracy in the UK.
R5: In addition to adopting the proposals for cultural change in public life contained in reports such as the Speaker’s Conference, the Councillors’ Commission, and the Equality and Human Rights Commission’s Pathways to Politics, steps should be taken to develop a much wider set of proposals for improving the culture of both politics at all levels and the media coverage of them.
* There have from time to time been individual projects, such as the government Equalities Office’s BME Task Force and the Fawcett Society’s Femocracy project, but it is not currently possible to follow these up once their funding expires.
† For instance, Women for Election in Ireland, which, in 2012, trained over 200 women from across the country.‡ The Leveson Report on the Culture, Practice and Ethics of the Press noted that in some parts of the media ‘even the most
accomplished and professional women are reduced to the sum of their body parts’ and concedes that ‘There is credible evidence that is (such coverage) has a broader impact on the perception and role of women in society, and the sexualisation of society generally.’ (Leveson Report, Part 2, pp 240-242).
31
6. Making women visible
Women are absent not just from policy and decision-making; they are also often invisible in discussion and debate, even where the issues being considered relate directly to them. In October 2012 the presenter John Humphries, chairing an all-male discussion on breast cancer screening, had to ask the participants to imagine that they were women in order to answer a question.* This is an extreme example, but by no means an isolated one. It is not uncommon for speakers’ panels at conferences, workshops and seminars to be all-male, and current affairs programmes of all kinds fall into the same trap. Unless this changes, women will continue to be excluded from the public discourse, and the public will continue to view political authority as male.
R6: All organisations – public, private and third sector – should take steps to ensure that, at meetings and events, both women and men appear on platforms as speakers, and editors and broadcasters should also take responsibility for commissioning contributions from both women and men as commentators and experts. Individual citizens should be encouraged to object to men-only platforms, panels and programmes.
It is our intention to review progress towards the implementation of these recommendations in 2013/14 and to publish our findings.
* BBC Today Programme, Tuesday 30 October 2012.
Next steps: Recommendations

33
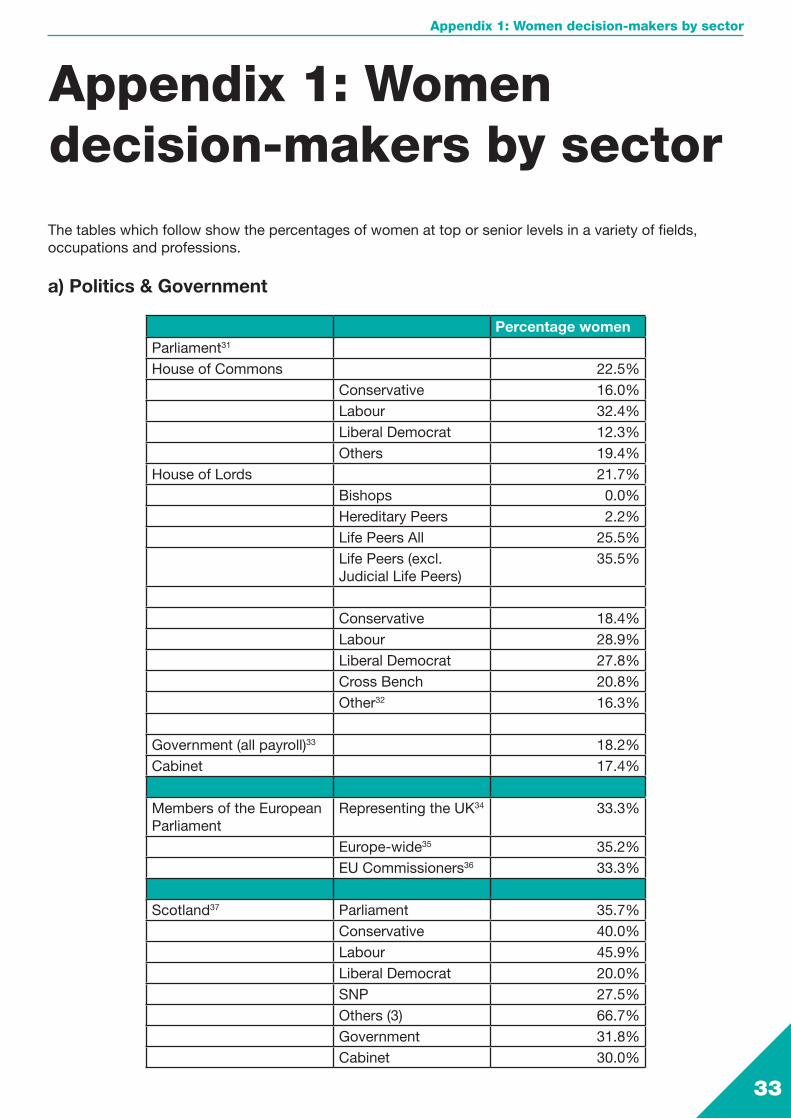
Appendix 1: Women decision-makers by sectorThe tables which follow show the percentages of women at top or senior levels in a variety of fields, occupations and professions.
a) Politics & Government
Percentage womenParliament31
House of Commons 22.5%Conservative 16.0%Labour 32.4%Liberal Democrat 12.3%Others 19.4%
House of Lords 21.7%Bishops 0.0%Hereditary Peers 2.2%Life Peers All 25.5%Life Peers (excl. Judicial Life Peers)
35.5%
Conservative 18.4%Labour 28.9%Liberal Democrat 27.8%Cross Bench 20.8%Other32 16.3%
Government (all payroll)33 18.2%Cabinet 17.4%
Members of the European Parliament
Representing the UK34 33.3%
Europe-wide35 35.2%EU Commissioners36 33.3%
Scotland37 Parliament 35.7%Conservative 40.0%Labour 45.9%Liberal Democrat 20.0%SNP 27.5%Others (3) 66.7%Government 31.8%Cabinet 30.0%
Appendix 1: Women decision-makers by sector
34
Sex and Power 2013
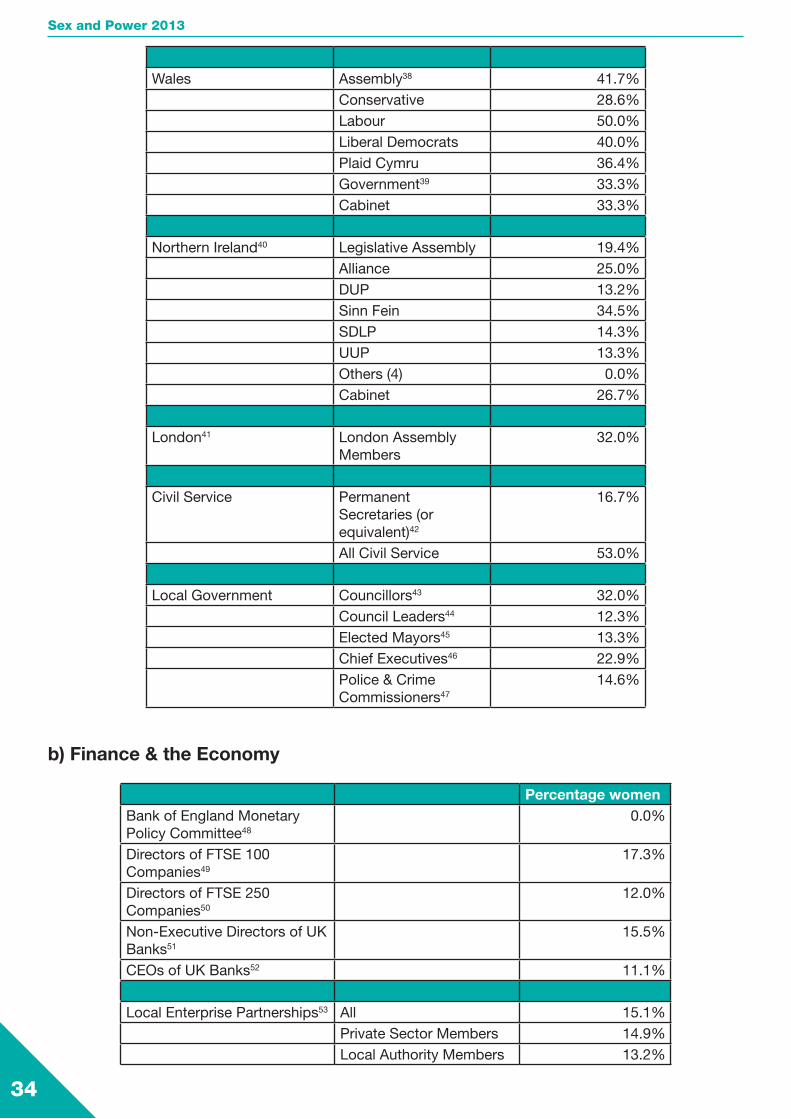
Wales Assembly38 41.7%Conservative 28.6%Labour 50.0%Liberal Democrats 40.0%Plaid Cymru 36.4%Government39 33.3%Cabinet 33.3%
Northern Ireland40 Legislative Assembly 19.4%Alliance 25.0%DUP 13.2%Sinn Fein 34.5%SDLP 14.3%UUP 13.3%Others (4) 0.0%Cabinet 26.7%
London41 London Assembly Members
32.0%
Civil Service Permanent Secretaries (or equivalent)42
16.7%
All Civil Service 53.0%
Local Government Councillors43 32.0%Council Leaders44 12.3%Elected Mayors45 13.3%Chief Executives46 22.9%Police & Crime Commissioners47
14.6%
b) Finance & the Economy
Percentage womenBank of England Monetary Policy Committee48
0.0%
Directors of FTSE 100 Companies49
17.3%
Directors of FTSE 250 Companies50
12.0%
Non-Executive Directors of UK Banks51
15.5%
CEOs of UK Banks52 11.1%
Local Enterprise Partnerships53 All 15.1%Private Sector Members 14.9%Local Authority Members 13.2%
35
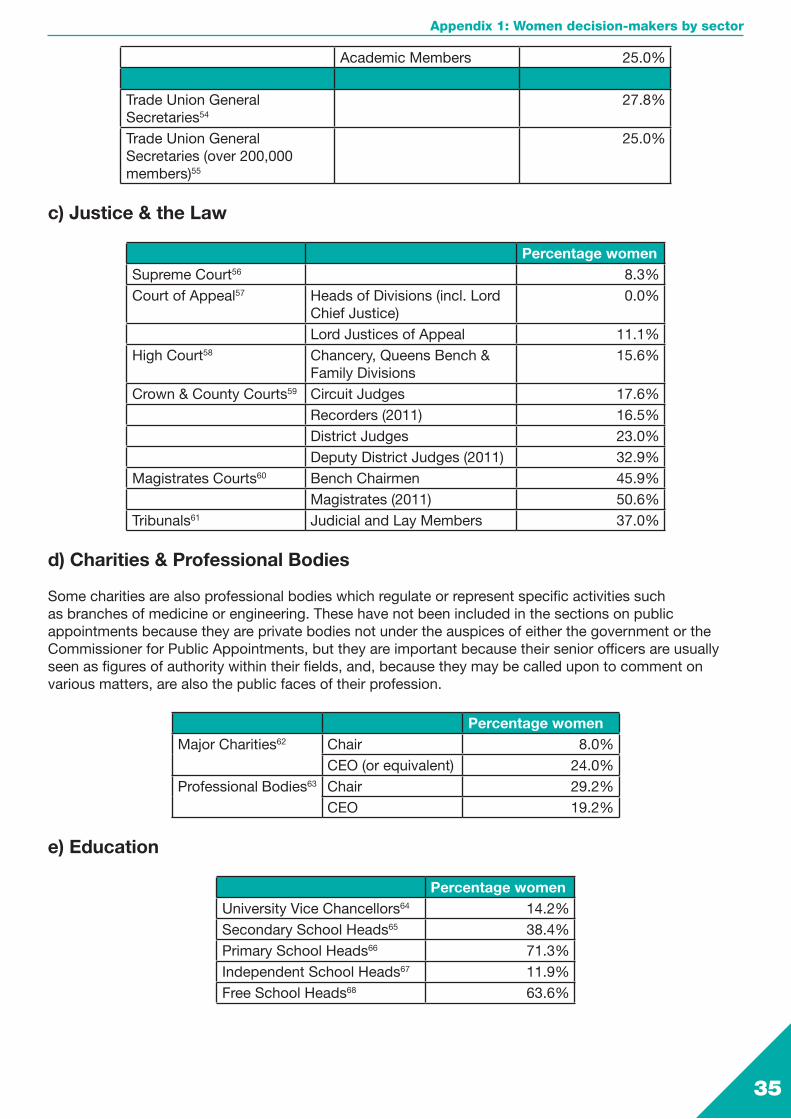
Academic Members 25.0%
Trade Union General Secretaries54
27.8%
Trade Union General Secretaries (over 200,000 members)55
25.0%
c) Justice & the Law
Percentage womenSupreme Court56 8.3%Court of Appeal57 Heads of Divisions (incl. Lord
Chief Justice)0.0%
Lord Justices of Appeal 11.1%High Court58 Chancery, Queens Bench &
Family Divisions15.6%
Crown & County Courts59 Circuit Judges 17.6%Recorders (2011) 16.5%District Judges 23.0%Deputy District Judges (2011) 32.9%
Magistrates Courts60 Bench Chairmen 45.9%Magistrates (2011) 50.6%
Tribunals61 Judicial and Lay Members 37.0%
d) Charities & Professional Bodies
Some charities are also professional bodies which regulate or represent specific activities such as branches of medicine or engineering. These have not been included in the sections on public appointments because they are private bodies not under the auspices of either the government or the Commissioner for Public Appointments, but they are important because their senior officers are usually seen as figures of authority within their fields, and, because they may be called upon to comment on various matters, are also the public faces of their profession.
Percentage womenMajor Charities62 Chair 8.0%
CEO (or equivalent) 24.0%Professional Bodies63 Chair 29.2%
CEO 19.2%
e) Education
Percentage womenUniversity Vice Chancellors64 14.2%Secondary School Heads65 38.4%Primary School Heads66 71.3%Independent School Heads67 11.9%Free School Heads68 63.6%
Appendix 1: Women decision-makers by sector
36
Sex and Power 2013
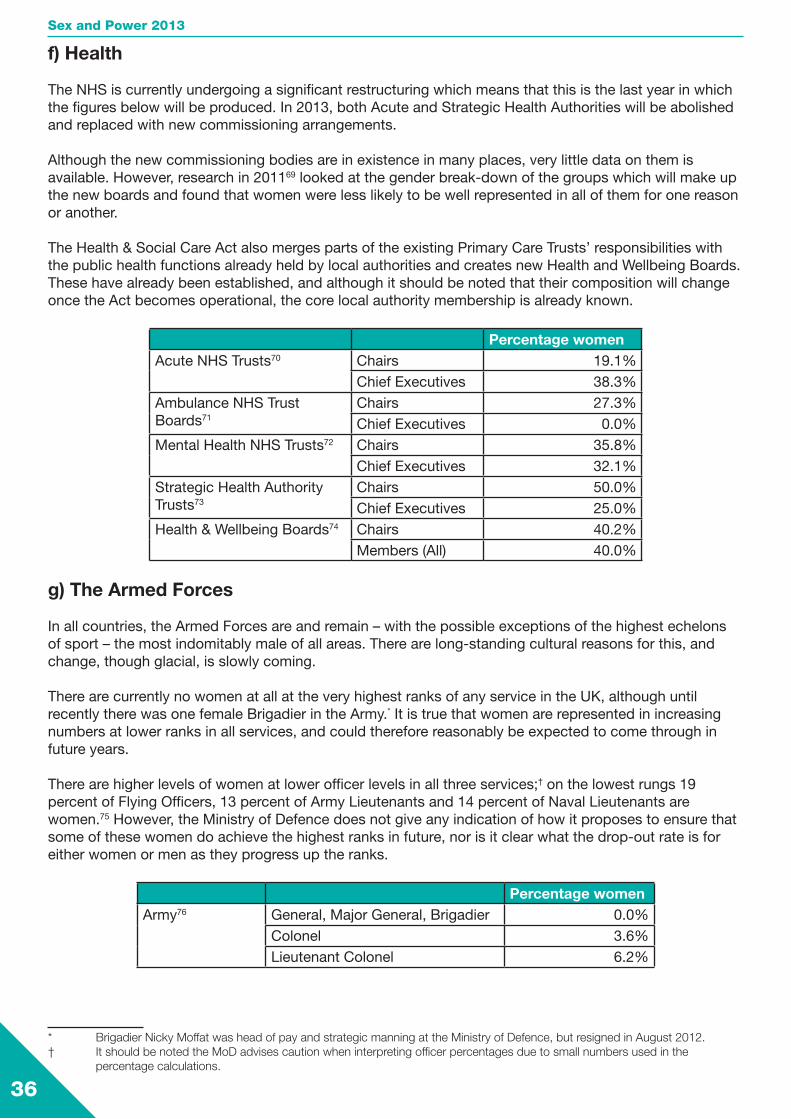
f) Health
The NHS is currently undergoing a significant restructuring which means that this is the last year in which the figures below will be produced. In 2013, both Acute and Strategic Health Authorities will be abolished and replaced with new commissioning arrangements.
Although the new commissioning bodies are in existence in many places, very little data on them is available. However, research in 201169 looked at the gender break-down of the groups which will make up the new boards and found that women were less likely to be well represented in all of them for one reason or another.
The Health & Social Care Act also merges parts of the existing Primary Care Trusts’ responsibilities with the public health functions already held by local authorities and creates new Health and Wellbeing Boards. These have already been established, and although it should be noted that their composition will change once the Act becomes operational, the core local authority membership is already known.
Percentage womenAcute NHS Trusts70 Chairs 19.1%
Chief Executives 38.3%Ambulance NHS Trust Boards71
Chairs 27.3%Chief Executives 0.0%
Mental Health NHS Trusts72 Chairs 35.8%Chief Executives 32.1%
Strategic Health Authority Trusts73
Chairs 50.0%Chief Executives 25.0%
Health & Wellbeing Boards74 Chairs 40.2%Members (All) 40.0%
g) The Armed Forces
In all countries, the Armed Forces are and remain – with the possible exceptions of the highest echelons of sport – the most indomitably male of all areas. There are long-standing cultural reasons for this, and change, though glacial, is slowly coming.
There are currently no women at all at the very highest ranks of any service in the UK, although until recently there was one female Brigadier in the Army.* It is true that women are represented in increasing numbers at lower ranks in all services, and could therefore reasonably be expected to come through in future years.
There are higher levels of women at lower officer levels in all three services;† on the lowest rungs 19 percent of Flying Officers, 13 percent of Army Lieutenants and 14 percent of Naval Lieutenants are women.75 However, the Ministry of Defence does not give any indication of how it proposes to ensure that some of these women do achieve the highest ranks in future, nor is it clear what the drop-out rate is for either women or men as they progress up the ranks.
Percentage womenArmy76 General, Major General, Brigadier 0.0%
Colonel 3.6%Lieutenant Colonel 6.2%
* Brigadier Nicky Moffat was head of pay and strategic manning at the Ministry of Defence, but resigned in August 2012.† It should be noted the MoD advises caution when interpreting officer percentages due to small numbers used in the
percentage calculations.
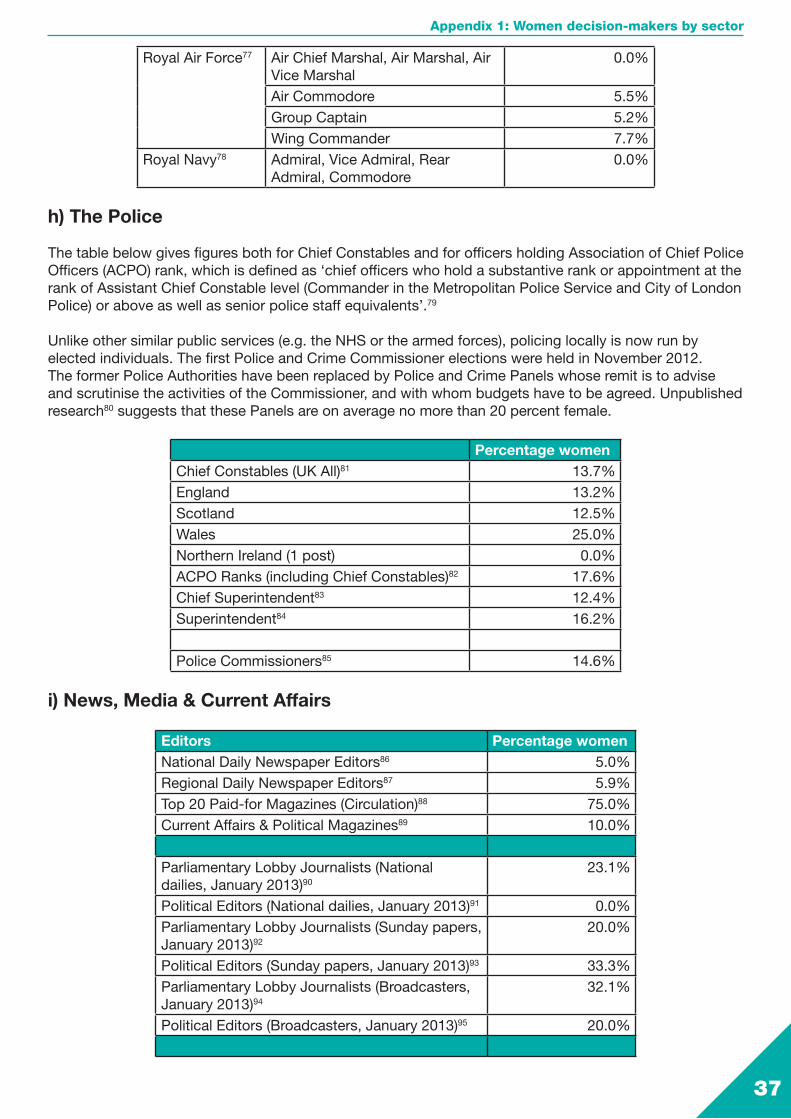
37
Royal Air Force77 Air Chief Marshal, Air Marshal, Air Vice Marshal
0.0%
Air Commodore 5.5%Group Captain 5.2%Wing Commander 7.7%
Royal Navy78 Admiral, Vice Admiral, Rear Admiral, Commodore
0.0%
h) The Police
The table below gives figures both for Chief Constables and for officers holding Association of Chief Police Officers (ACPO) rank, which is defined as ‘chief officers who hold a substantive rank or appointment at the rank of Assistant Chief Constable level (Commander in the Metropolitan Police Service and City of London Police) or above as well as senior police staff equivalents’.79
Unlike other similar public services (e.g. the NHS or the armed forces), policing locally is now run by elected individuals. The first Police and Crime Commissioner elections were held in November 2012.The former Police Authorities have been replaced by Police and Crime Panels whose remit is to advise and scrutinise the activities of the Commissioner, and with whom budgets have to be agreed. Unpublished research80 suggests that these Panels are on average no more than 20 percent female.
Percentage womenChief Constables (UK All)81 13.7%England 13.2%Scotland 12.5%Wales 25.0%Northern Ireland (1 post) 0.0%ACPO Ranks (including Chief Constables)82 17.6%Chief Superintendent83 12.4%Superintendent84 16.2%
Police Commissioners85 14.6%
i) News, Media & Current Affairs
Editors Percentage womenNational Daily Newspaper Editors86 5.0%Regional Daily Newspaper Editors87 5.9%Top 20 Paid-for Magazines (Circulation)88 75.0%Current Affairs & Political Magazines89 10.0%
Parliamentary Lobby Journalists (National dailies, January 2013)90
23.1%
Political Editors (National dailies, January 2013)91 0.0%Parliamentary Lobby Journalists (Sunday papers, January 2013)92
20.0%
Political Editors (Sunday papers, January 2013)93 33.3%Parliamentary Lobby Journalists (Broadcasters, January 2013)94
32.1%
Political Editors (Broadcasters, January 2013)95 20.0%
Appendix 1: Women decision-makers by sector
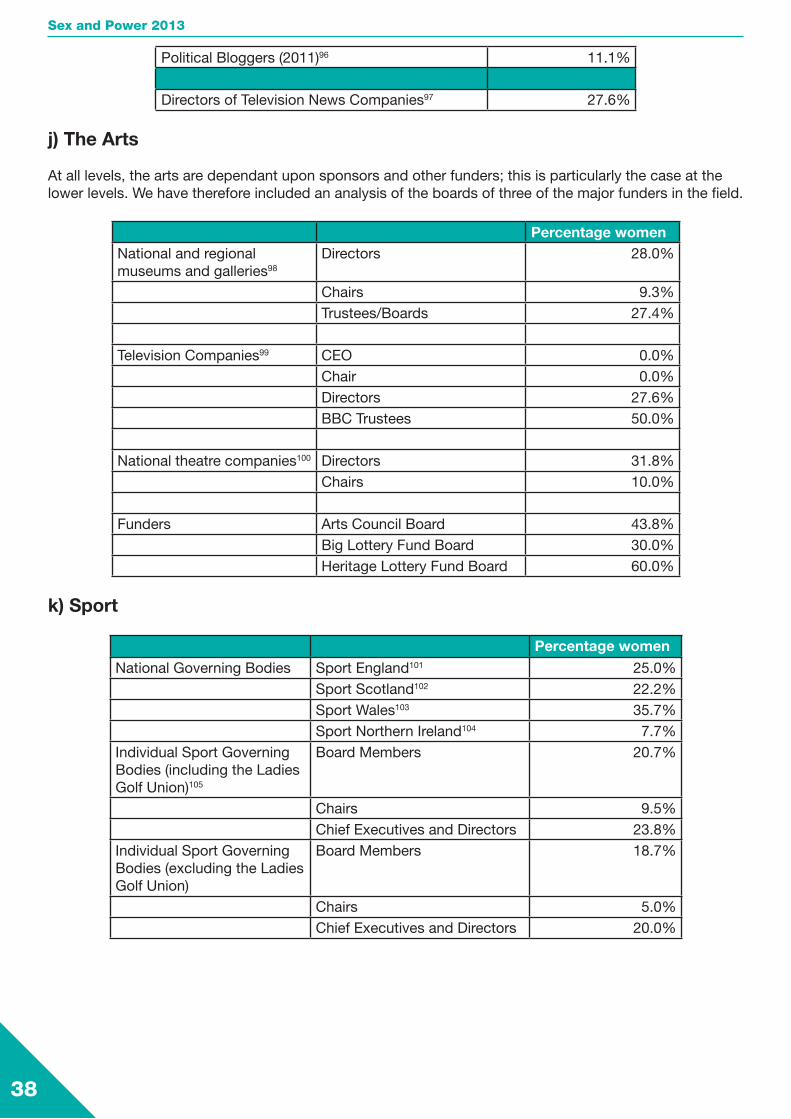
38
Sex and Power 2013
Political Bloggers (2011)96 11.1%
Directors of Television News Companies97 27.6%
j) The Arts
At all levels, the arts are dependant upon sponsors and other funders; this is particularly the case at the lower levels. We have therefore included an analysis of the boards of three of the major funders in the field.
Percentage womenNational and regional museums and galleries98
Directors 28.0%
Chairs 9.3%Trustees/Boards 27.4%
Television Companies99 CEO 0.0%Chair 0.0%Directors 27.6%BBC Trustees 50.0%
National theatre companies100 Directors 31.8%Chairs 10.0%
Funders Arts Council Board 43.8%Big Lottery Fund Board 30.0%Heritage Lottery Fund Board 60.0%
k) Sport
Percentage women
National Governing Bodies Sport England101 25.0%Sport Scotland102 22.2%Sport Wales103 35.7%Sport Northern Ireland104 7.7%
Individual Sport Governing Bodies (including the Ladies Golf Union)105
Board Members 20.7%
Chairs 9.5%Chief Executives and Directors 23.8%
Individual Sport Governing Bodies (excluding the Ladies Golf Union)
Board Members 18.7%
Chairs 5.0%Chief Executives and Directors 20.0%

39
In this section are listed all the groups and organisations whose websites were individually accessed as part of this research. These are grouped into various categories referenced in the text and data from them have been used to arrive at the figures used in the report and in Appendix 1.
It should be noted that, particularly with government bodies, there has been considerable (and ongoing) change since 2010, which means that there may be small variations between the samples listed here and those used in previous editions of Sex & Power.
a) Non-Ministerial Departments* Charity Commission for England and Wales, Crown Estate, Crown Prosecution Service, Food Standards Agency, Forestry Commission, Government’s Actuary’s Department, HM Revenue and Customs, National Savings and Investments, Ofsted, Ofqual, Office of Fair Trading, Office of Gas and Electricity Markets, Office of Rail Regulation, Public Works Loan Board, Royal Mint, Serious Fraud Office, UK Statistics Authority, UK Supreme Court, UK Trade and Investment, Water Services Regulation Authority.
b) Executive Agencies & Other Public BodiesAcas, Animal Health & Veterinary Laboratories Agency, British Council, Centre for Environment, Fisheries and Aquaculture Science, Civil Nuclear Defence Authority, Civil Service Commission, Companies House, Competition Commission, Construction Industry Training Board, Defence Science & Technology Laboratory, Defence Support Group, Disclosure & Barring Service, Driver & Vehicle Licensing Agency, Driving Standards Agency, Economic & Social Research Council, English Heritage, English Heritage, Equality & Human Rights Commission, FCO Services, Fire Service College, Forest Enterprise England, Forest Research, Government Procurement Service, Highways Agency, HM Courts & Tribunal Service, HM Inspectorate of Prisons, HM Land Registry, Homes & Communities Agency, Human Fertilisation and Embryology Authority, Identity & Passport Service, Independent Living Fund, Insolvency Service, Maritime & Coastguard Agency, Medical Research Council, Medicines & Healthcare Products Regulatory Agency, MET Office, Ministry of Defence Police & Guarding Agency, National Archives, National Fraud Authority, National Offender Management Service, National Measurement Office, Natural England, Office for Budget Responsibility, Office for National Statistics, Office of the Public Guardian, Ordnance Survey, Parole Board, Pensions Ombudsman, Planning Inspectorate, Public Lending Right, Queen Elizabeth II Conference Centre, The Royal Parks, Rural Payments Agency, Serious Organised Crime Agency, Service Children’s Education, Skills Funding Agency, Student Loans Company, Teaching Agency, Tribunals Service, UK Border Agency, UK Debt Management Office, UK Hydrographic Office, UK Intellectual Property Office, UK Space Agency, Valuation Office, Vehicle & Operator Services Agency, Vehicle Certification Agency, Veterinary Medicines Directorate, Westminster Foundation for Democracy, Wilton Park.
c) Regulatory BodiesAdvertising Standards Authority, Architects Registration Board, Bar Standards Board, Care and Social Services Inspectorate Wales, Care Council for Wales, Care Inspectorate, Care Quality Commission, Civil Aviation Authority, Commissioner for Public Appointments, Commissioner for Public Appointments Northern Ireland, Committee of Advertising Practice, Costs Lawyers Standards Board, Council for Healthcare Regulatory Excellence, (to become the Professional Standards Authority for Health and Social Care during 2012), Council for Licensed Conveyancers, Council for Curriculum, Examinations and Assessment, Financial Reporting Council, Financial Services Authority, Gambling Commission, General Chiropractic Council, General Dental Council, General Medical Council, General Optical Council, General Osteopathic Council, General Pharmaceutical Council, Health and Care Professions Council, General
* As listed on the Government’s website, https://www.gov.uk/government/organisations#agencies-and-public-bodies
Appendix 2: Organisations
Appendix 2: Organisations

40
Sex and Power 2013
Teaching Council for Northern Ireland, General Teaching Council for Scotland, General Teaching Council for Wales, Health and Safety Executive, Healthcare Improvement Scotland, Healthcare Inspectorate Wales, Human Tissue Authority, ILEX Professional Standards, Information Commissioner’s Office, Intellectual Property Regulation Board, Legal Services Board, Medical Practitioners Tribunal Service, Medical and Healthcare Products Regulatory Agency, Monitor, National Lottery Commission, Northern Ireland Social Care Council, Nursing and Midwifery Council, Ofcom, Office of Fair Trading, Office of Rail Regulation, Office of the Scottish Charity Regulator, , The Pensions Regulator, Pharmaceutical Society of Northern Ireland, PhonePayPlus, Press Complaints Commission, Public Appointments Commissioner, The Regulation and Quality Improvement Authority, Royal College of Veterinary Surgeons, Scottish Information Commissioner, Scottish Social Services Council, Solicitors Regulation Authority, The Takeover Panel, Utility Regulator.
d) Local Enterprise Partnerships (LEPS)Greater Birmingham & Solihull; Black Country; Cheshire & Warrington; Coast to Capital; Cornwall & Isles of Scilly; Coventry & Warwickshire; Cumbria; Derby, Derbyshire, Nottingham and Nottinghamshire; Dorset; Enterprise M3; Greater Cambridge & Greater Peterborough; Greater Manchester; Heart of the South West; Hertfordshire; Humber; Kent, Greater Essex & East Sussex; Lancashire; Leeds City Region; Leicester & Leicestershire; Lincolnshire; Liverpool; The Marches, Shropshire & Herefordshire; New Anglia; North Eastern; Oxford City Region; Sheffield City Region; Solent; South East Midlands; Stoke & Staffordshire; West of England; Worcestershire; York, North Yorkshire & East Riding.
e) Professional BodiesAssociation of Chief Police Officers, Chartered Institute of Building, Chartered Institute of Environmental Health, Chartered Institute of Housing, Chartered Institute of Personnel and Development, Engineering Council, Faculty of Advocates, General Council of the Bar, General Dental Council, General Medical Council, General Optical Council, General Social Care Council, General Teaching Council for England, General Teaching Council for Scotland, General Teaching Council for Wales, Health and Care Professions Council, Institute of Actuaries, Institute of Chartered Accountants, Institute of Chemical Engineers, Law Society, Law Society of Scotland, Royal College of General Practitioners, Royal College of Nursing, Royal College of Physicians, Royal College of Psychiatrists, Royal College of Surgeons, Royal Institute of British Architects.
f) Acute NHS TrustsAintree University Hospital, Airedale, Alder Hey Children’s Hospital, Ashford & St Peter’s, Barking, Havering & Redbridge, Barnet & Chase Farm, Barnsley, Barts, Basildon & Thurrock, Bedford, Birmingham Children’s Hospital, Birmingham Women’s Hospital, Blackpool Fylde & Wyre, Bolton, Bradford, Brighton & Sussex, Buckinghamshire, Burton, Calderdale & Huddersfield, Cambridge, Central Manchester, Chelsea & Westminster, Chesterfield Royal, City Hospitals Sunderland, Colchester, Countess of Chester, County Durham & Darlington, Croydon, Dartford & Gravesham, Derby, Doncaster & Bassetlaw, Dorset, Ealing, East & North Hertfordshire, East Cheshire, East Kent, East Lancashire, East Sussex, Epsom & St Helier, Frimley Park, Gateshead, George Eliot, Gloucestershire, Great Ormond Street, Great Western, Guy’s & St Thomas, Hampshire, Harrogate & District, Heart of England, Heatherwood & Wrexham, Hinchingbroke, Homerton, Hull & East Yorkshire, Imperial College, Ipswich, Isle of Wight, James Paget, Kettering, King’s College, Kingston, Lancashire, Leeds, Lewisham, Liverpool Heart & Chest, Liverpool Women’s, Luton & Dunstable, Maidstone & Tunbridge Wells, Medway, Mid Cheshire, Mid Essex, Mid Staffordshire, Mid Yorkshire, Milton Keynes, Moorfield, Newcastle upon Tyne Hospitals, Norfolk & Norwich, North Bristol, North Cumbria, North Middlesex, North Tees & Hartlepool, North West London, Northampton, Northern Devon, Northern Lincolnshire & Goole, Northumbria, Nottingham, Oxford, Papworth, Pennine, Peterborough & Stamford, Plymouth, Poole, Portsmouth, Queen Victoria, Robert Jones & Agnes Hunt Orthopaedic, Rotherham, Royal Berkshire, Royal Brompton, Royal Cornwall, Royal Devon, Royal Free, Royal Liverpool & Broadgreen, Royal National Hospital for Rheumatic Diseases, Royal National Orthopaedic, Royal Surrey County, Royal United Hospital Bath, Salford Royal, Salisbury, Sandwell & West Birmingham, Scarborough & North East Yorkshire, Sheffield Children’s, Sheffield, Sherwood Forest, Shrewsbury & Telford, South Devon, South Tees, South Tyneside, South Warwickshire, Southend, Southport & Ormskirk, St George’s, St Helen’s & Knowsley, Stockport, Surrey & Sussex, Tameside, Taunton & Somerset, The Christie, The Clatterbridge Cancer Centre, The Dudley Group, The Hillingdon Hospitals, The Princess Alexandra, The Queen Elizabeth, The Royal Bournemouth & Christchurch, The Royal Marsden, The Royal Orthopaedic, The Royal Wolverhampton, The Walton Centre, The Whittington, Torbay & Southern Devon, United Lincolnshire,
41
University College London, University Hospital Birmingham, University Hospital of North Staffordshire, University Hospital of South Manchester, University Hospital Southampton, University Hospitals Bristol, University Hospitals Coventry & Warwickshire, University Hospitals of Leicester, University Hospitals of Morecambe Bay, Walsall, Warrington & Halton, West Hertfordshire, West Middlesex, West Suffolk, Western Sussex, Weston, Wirral, Worcestershire, Wrighton Wigan & Leigh, Wye Valley, Yeovil District, York.
g) Ambulance NHS Trust BoardsEast Midlands, East of England, Great Western, London, North East, North West, South Central, South East Coast, Welsh, West Midlands, Yorkshire.
h) Mental Health NHS TrustsAvon & Wiltshire, Barnet Enfield & Haringey, Berkshire, Birmingham & Solihull, Black Country, Bradford, Calderstones, Cambridgeshire & Peterborough, Camden & Islington, Central & North West London, Cheshire & Wirral, Cornwall, Coventry & Warwickshire, Cumbria, Derbyshire, Devon, Dorset, Dudley & Walsall, East London, Greater Manchester West, Hertfordshire, Humber, Kent & Medway, Leeds & York, Leicestershire, Lincolnshire, Manchester, Mersey, North East London, North Essex, North Staffordshire, Northamptonshire, Northumberland Tyne & Wear, Nottinghamshire, Oxford, Oxleas, Pennine, Rotherham Doncaster & South Humber, Sheffield, South Essex, South London & Maudsley, South Staffordshire & Shropshire, South West London & St George’s, South West Yorkshire, Southern, Surrey & Borders, Sussex, Tavistock & Portman, Tees Esk & Wear, West London, 2gether, 5 Boroughs.
i) Strategic Health Authority TrustsLondon, Midlands & East, North, South.
j) Health & Wellbeing BoardsBath & NE Somerset, Birmingham, Bristol, Buckinghamshire, Bury, Calderdale, Camden, Cornwall, Coventry, Devon, Dorset, Dover & Shepway, Dudley, East Riding, Hampshire, Harrow, Herefordshire, Islington, Kent, Kingston-upon-Thames, Kirklees, Lancashire, Leeds, Leicester, Lewisham, Luton, Middlesbrough, North Tyneside, Nottinghamshire, Oxfordshire, Plymouth, Portsmouth, Redbridge, Richmond upon Thames, Rotherham, Sefton, Sheffield, Southwark, St Albans, Staffordshire, Stoke-on-Trent, Sunderland, Swindon, Thurrock, Torbay, Trafford, Waltham Forest, Wandsworth, West Sussex, Worcestershire.
k) National Daily NewspapersDaily Express, Daily Mail, Daily Record, Daily Star, Financial Times, Independent on Sunday, Mail on Sunday, Sunday Express, Sunday Sun, The Guardian, The Independent, The Mirror & Sunday Mirror, The Observer, The People, The Sun, The Sunday Sport, The Sunday Telegraph, The Sunday Times, The Telegraph, The Times.
l) Regional Daily & Evening NewspapersAberdeen Evening Express, Belfast Telegraph, Birmingham Mail, Blackpool Gazette, Bolton Evening News, Bournemouth Daily Echo, Bradford Telegraph & Argus, Brighton Evening Argus, Bristol Evening Post, Bristol Western Daily Press, Burton Daily Mail, Cambridge Evening News, Carlisle News & Star, Colchester Evening Gazette, Coventry Evening Telegraph, Daily Post (Wales), Daily Record (Scotland), Derby Evening Telegraph, Dorset Echo, Dundee Courier & Advertiser, Dundee Evening Telegraph, East Anglian Daily Times, Edinburgh Evening News, Evening Leader (Wrexham & Chester), Glasgow Evening Times, Gloucestershire Echo, Greenock Telegraph, Grimsby Evening Telegraph, Hartlepool Mail, Herald Scotland, Huddersfield Daily Examiner, Hull Daily Mail, Irish News (Belfast), Lancashire Evening Post, Lancashire Evening Telegraph, Leicester Mercury, Liverpool Echo, Manchester Evening News, Newcastle Evening Chronicle, Newcastle Journal, North West Evening Mail (Barrow), Northern Echo, Norwich Evening News, Nottingham Evening Post, Oldham Chronicle, Oxford Mail, Paisley Daily Express, Plymouth Evening Herald, Portsmouth News, Sheffield Star, Shields Gazette, Shropshire Star, South Wales Argus, South Wales Echo, South Wales Evening Post, Southern Daily Echo, Stoke Sentinel, Sunderland Echo, Swindon Evening Advertiser, Teeside Evening Gazette, The Evening Standard, The Scotsman, West Midlands Express & Star, Western Mail, Western Morning News, Worcester Evening News, York Evening Press, Yorkshire Evening Post, Yorkshire Post.
m) Top 20 paid-for Magazines by circulation
Appendix 2: Organisations
42
Sex and Power 2013
TV Choice, What’s On TV, Radio Times, Take a Break, Saga Magazine, Glamour, New!, Closer, Slimming World, Good Housekeeping, Chat, OK!, Woman & Home, Cosmopolitan, Hello!, Woman’s Weekly, That’s Life, National Geographic, Heat, Star.
n) Current Affairs & Political MagazinesEconomist, New Scientist, New Statesman, Private Eye, Prospect, Spectator, Standpoint, Total Politics, Tribune, The Week
o) Museums & Art GalleriesAshmolean, Baltic (Gateshead), Beamish, Birmingham Museums, British Library, British Museum, Design Museum, Fitzwilliam (Cambridge), Geffrye Museum, Glasgow Museums, Hepworth Gallery, Wakefield, Horniman Museum & Gardens, Imperial War Museum, Ironbridge Gorge Museum, Leeds Museums & Galleries, London Transport Museum, Manchester Art Galleries, Museum of London, National Archives, National Army Museum, National Coal Mining Museum, England, National Football Museum, National Galleries Scotland, National Gallery, National Library of Scotland, National Maritime Museum, National Media Museum, National Museum of Science & Industry, National Museum of Wales, National Museums Liverpool, National Museums Northern Ireland, National Museums Scotland, National Portrait Gallery, National Railway Museum, National Trust, Natural History Museum, Norfolk Museums & Archaeology Service, People’s History Museum, Royal Air Force Museum, Royal Armouries, Royal Navy National Museum, Science Museum, Science Museum Group, Serpentine Gallery, Sir John Soane’s Museum, Tate, Tyne & Wear Archives & Museums, V & A, Wallace Collection, Whitworth Gallery, Manchester.
p) Theatres & Theatre CompaniesBath Theatre Royal, Belfast Grand Opera House, Belgrade Theatre, Coventry, Birmingham Rep, Birmingham Royal Ballet, Bristol Old Vic, Crucible (Sheffield), English National Ballet & Opera, Hull Truck Theatre Company, Rambert Dance, Royal Ballet, Royal Exchange Manchester, Royal National Theatre, Royal Opera House, Royal Shakespeare Company, Sadler’s Wells, Scottish Ballet, Scottish Opera, South Bank Centre, Welsh National Opera, West Yorkshire Playhouse.
q) Sports Governing BodiesAmateur Boxing Association, British Crown Green Bowling Association, British Cycling, British Equestrian Federation, British Gymnastics, British Horse Racing Authority, British Judo Association, British Rowing, British Swimming, British Volleyball Association, England Golf, England Hockey, English Association of Snooker and Billiards, Football Association, Golf Union of Wales, Ladies Golf Union, Lawn Tennis Association, Motor Sports Association, Premier League, Rugby League, Scottish Golf Union, UK Athletics.
43
1 Civil Service Monitoring Diversity, http://www.civilservice.gov.uk/about/resources/monitoring-diversity, figures for April 2012
2 This figure is from the 2011 Census published by the Office for National Statistics in July 2012. This showed that in England and Wales there were 27.6 million men and 28.5 million women.
3 The Gender Dividend: making the business case for investing in women, Greg Pellegrino, Sally d’Amato & Anne Weissman, for Deloitte, 2011
4 Women at the Top: Changing Numbers, Changing Politics?, Sarah Childs, Joni Lovenduski & Rosie Campbell, for the Hansard Society, 2005
5 Guardian, 9 January 2013, http://www.guardian.co.uk/news/datablog/2013/jan/09/david-cameron-female-political-journalists-question
6 Leadership in Local Government 2011, Centre for Women & Democracy, 2011
7 The Equality Strategy – Building a Fairer Britain, December 2010, p.15 http://www.homeoffice.gov.uk/publications/equalities/equality-strategy-publications/equality-strategy/equality-strategy?view=Binary
8 The Equality Strategy – Building a Fairer Britain: Progress Report, May 2012 http://www.homeoffice.gov.uk/publications/equalities/equality-strategy-publications/progress-report?view=Binary
9 http://www.cabinetoffice.gov.uk/content/enhanced-departmental-boards-protocol
10 http://publicappointmentscommissioner.independent.gov.uk/wp-content/uploads/2012/02/annualreport-10-11.pdf, accessed August 2012
11 Data taken from the websites of individual government departments and accessed August 2012
12 Data taken from the websites of 20 non-ministerial bodies listed in Appendix 2 and accessed August 2012
13 Data taken from the websites of 49 executive agencies listed in Appendix 2 and accessed August 2012
14 Data taken from the websites of 69 regulatory bodies listed in Appendix 2 and accessed August 2012
15 http://www.civilservice.gov.uk/about/facts/statistics, accessed August 2012
16 http://www.civilservice.gov.uk/about/leadership/permanent-secretaries
17 Civil Service Monitoring Diversity http://www.civilservice.gov.uk/about/resources/monitoring-diversity
18 http://www.data.gov.uk/dataset/special-advisers, accessed January 2013
19 Civil Service Monitoring Diversity http://www.civilservice.gov.uk/about/resources/monitoring-diversity, figures for April 2012
20 Pathways to Politics: EHRC Research Report 65, Catherine Durose, Francesca Gains, Liz Richardson, Ryan Combs, Karl Broome & Christine Eason, 2011
21 Ibid, p.30
22 Robert Booth, ‘Parliament’s 2010 intake shows swing towards private sector’, http://www.guardian.co.uk/politics/2010/may/10/mp-intake-private-sector
23 Pathways to Politics, p.128
24 http://www.hesa.ac.uk/index.php?option=com_content&task=view&id=2411&Itemid=278, accessed September 2012.
25 Pathways to Politics, p.129
26 http://www.charity-commission.gov.uk/About_us/About_charities/factfigures.aspx
27 Robert Booth, ‘Parliament’s 2010 intake shows swing towards private sector’, http://www.guardian.co.uk/politics/2010/may/10/mp-intake-private-sector
28 Teaching Agency press release, July 2012, http://www.education.gov.uk/inthenews/inthenews/a00211812/record-numbers-of-men-teaching-in-primary-schools
29 Seen But Not Heard, Women in Journalism, October 2012, http://womeninjournalism.co.uk/wp-content/uploads/2012/10/Seen_but_not_heard.pdf
30 Audit of Political Engagement 9, The 2012 Report Part Two: The media and politics, Hansard Society, p.13
Notes & sourcesNotes & sources
44
Sex and Power 2013
31 All figures for the Westminster Parliament are taken from http://www.parliament.uk/mps-lords-and-offices/, accessed August 2012
32 Peers listed as DUP, Plaid Cymru, UUP, UKIP, Independent, Conservative Independent, Independent Labour, Independent Liberal Democrat
33 A Broken Promise: The Gender Gap in Cameron’s government, Counting Women In, September 2012, http://www.electoral-reform.org.uk/images/dynamicImages/file/Campaigns/CWI/A%20Broken%20Promise.pdf
34 Inter-Parliamentary Union, http://www.ipu.org/wmn-e/regions.htm, accessed August 2012
35 Ibid
36 http://ec.europa.eu/commission_2010-2014/index_en.htm, accessed August 2012
37 http://www.scottish.parliament.uk/msps.aspx, accessed August 2012
38 http://www.assemblywales.org/memhome.htm, accessed August 2012
39 http://wales.gov.uk/about/?lang=en, accessed August 2012
40 http://www.niassembly.gov.uk/Your-MLAs/, accessed August 2012
41 http://www.london.gov.uk/who-runs-london/the-london-assembly/members, accessed August 2012
42 http://www.civilservice.gov.uk/about/leadership/permanent-secretaries, accessed August 2012
43 Local Government Association National Census of Local Authority Councillors 2010, adjusted to allow for results of elections in 2011 and 2012.
44 Local Government Leadership 2012, Centre for Women & Democracy, September 2012
45 Local Government Leadership 2012, Centre for Women & Democracy, September 2012
46 Data collated from the websites of 341 English local authorities, combined with figures from the Convention of Scottish Local Authorities and the Welsh Local Government Association
47 http://www.choosemypcc.org.uk/election-results, accessed November 2012
48 http://www.bankofengland.co.uk/about/Pages/people/court.aspx#photo, accessed August 2012
49 http://www.boardsforum.co.uk/boardwatch.html, accessed August 2012
50 http://www.boardsforum.co.uk/boardwatch.html, accessed August 2012
51 Data collated from the websites of the following banks: Bank of England, Barclays, Clydesdale/Yorkshire Bank, Co-Op Bank, HSBC, Lloyds TSB, Nationwide, RBS/Nat West, Santander, accessed August 2012
52 Ibid
53 Data collated from the websites of 32 Local Enterprise Partnerships in England listed in Appendix 2, accessed August 2012
54 http://www.tuc.org.uk/tuc/unions_main.cfm, accessed August 2012
55 Ibid. The 8 unions with in excess of 200,000 members are: CWU, GMB, NASUWT, NUT, PCS, Unison, Unite and USADW
56 Website of the Supreme Court, http://www.supremecourt.gov.uk/about/whos-who.html
57 http://www.judiciary.gov.uk/about-the-judiciary/judges-magistrates-and-tribunal-judges
58 Ibid
59 Ibid
60 Ibid
61 Ibid
62 All data taken from Women Count: Charity Leaders 2012, Norma Jarboe OBE, for Women Count, May 2012
63 Data collated from the websites listed in Appendix 2 and accessed September 2012
64 http://www.universitiesuk.ac.uk/AboutUs/WhoWeAre/Pages/Members.aspx, accessed August 2012
65 http://www.education.gov.uk/rsgateway/DB/SFR/s001062/index.shtml, accessed August 2012
66 Ibid
67 http://www.hmc.org.uk/schools/ and individual school websites, accessed August 2012
68 Data collated from the websites of individual schools as listed at http://www.education.gov.uk/schools/leadership/typesofschools/freeschools/b0066077/open-free-schools, accessed August 2012
69 Unintended Consequences: the impact of the government’s legislative programme on women in public roles, Centre for Women & Democracy, July 2011
70 Data collated from the websites of 162 Acute NHS Trusts, as listed in Appendix 2 and accessed September 2012
71 Data collated from the websites of 11 Ambulance Trusts, as listed in Appendix 2 and accessed September 2012
45
72 Data collated from the websites of 52 Mental Health Trusts, as listed in Appendix 2 and accessed September 2012
73 Data collated from the websites of Strategic Health Authorities as listed in Appendix 2 and accessed September 2012
74 Data collated from the websites of 50 (out of 130) Health & Wellbeing Boards as listed in Appendix 2 and accessed November 2012
75 Unintended Consequences: the impact of the government’s legislative programme on women in public roles, Centre for Women & Democracy, July 2011
76 http://www.dasa.mod.uk, accessed September 2012
77 Ibid
78 Ibid
79 Association of Chief Police Officers website, http://www.acpo.police.uk/
80 Research on Police Commissioners and Police and Crime Panels being carried out by the Centre for Women & Democracy to be published in early 2013
81 http://www.acpo.police.uk/About/CouncilMembership.aspx, accessed August 2012, together with information from individual police force websites
82 http://www.homeoffice.gov.uk/publications/science-research-statistics/research-statistics/police-research/hosb0912/, figures as at March 2012 and accessed September 2012
83 Ibid
84 Ibid
85 http://www.choosemypcc.org.uk/election-results, accessed November 2012
86 Data collated from the websites of 20 national daily newspapers as listed in Appendix 2 and accessed August 2012
87 Data collated from the websites of 68 regional daily and evening newspapers as listed in Appendix 2, and accessed September 2012
88 ABC Audit of circulation figures for the first half of 2012, http://www.pressgazette.co.uk/node/49860; top 20 magazines listed in Appendix 2
89 Data collated from the websites of 10 current affairs magazines listed in Appendix 2, and accessed September 2012
90 Research conducted by the Guardian newspaper article and data published 9 January 2013, http://www.guardian.co.uk/news/datablog/2013/jan/09/david-cameron-female-political-journalists-question
91 Ibid
92 Ibid
93 Ibid
94 Ibid
95 Ibid
96 http://www.totalpolitics.com/blog/259042/top-100-uk-political-bloggers.thtml
97 Data collated from the websites of the BBC, Channel 4, ITV, Sky and Viacom (MTV), accessed August 2012
98 Data collated from the websites of 50 museums and art galleries listed in Appendix 2 and accessed September 2012
99 Data collated from the websites of the BBC, Channel 4, ITV, Sky and Viacom (MTV), accessed August 2012
100 Data collated from the websites of 22 theatres and theatre companies listed in Appendix 2 and accessed August 2012
101 http://www.sportengland.org/about_us/how_we_are_structured/our_main_board.aspx, accessed August 2012
102 http://www.sportscotland.org.uk/About_us/Who_we_are/Our_board, accessed August 2012
103 http://www.sportwales.org.uk/about-us/about-sport-wales/our-team/board-members.aspx, accessed August 2012
104 http://www.sportni.net/about/board, accessed August 2012
105 Data collated from the websites of 22 sport governing bodies listed in Appendix 2 and accessed August 2012
Notes & sources

Unlock Democracy is the UK’s leading campaign for democracy, rights and freedoms.
We campaign for a vibrant inclusive democracy that puts power in the hands of people.
www.unlockdemocracy.org.uk
The Hansard Society is the UK’s leading independent, non-partisan, political research and education charity.
We aim to strengthen parliamentary democracy and encourage greater public involvement in politics.
www.hansardsociety.org.uk
Fawcett is the UK’s leading campaign for women’s rights – at home, at work and in public life. We trace our roots to 1866 and our founders’ parliamentary campaign for women’s suffrage.
Our vision is of society where women and our rights are equally valued and respected and where we have equal say in decisions that affect our lives.
www.fawcettsociety.org.uk
The Electoral Reform Society is campaigning for a better democracy.
We put voters first. We offer an independent voice, and work across Britain to shape the democratic debate at all levels. Our vision is a representative democracy fit for the 21st century.
www.electoral-reform.org.uk
The Centre for Women & Democracy campaigns to increase and promote women at all levels of public decision-making in the UK. Based in the north of England, we work with partners and supporters across the country to achieve equal representation and power for women in politics, democracy and public life.
www.cfwd.org.uk
The Counting Women In coalition has been funded by the Joseph Rowntree Charitable Trust.
Counting Women In coalitionwww.countingwomenin.org