
Sewer Ventilation as a VI Mitigation Alternative- Case Studies
25
www.jacobs.com | worldwide Innovation that provides sustainable solutions to complex challenges worldwide Sewer Ventilation as a VI Mitigation Alternative- Case Studies April 10, 2018 CH2M is now Jacobs Keri Hallberg, PE, Jacobs Loren Lund, PhD, Jacobs Jessica High, PE, Jacobs Quinten Bingham, Jacobs David Cleland, PG, NAVFAC Mid-Atlantic Mark Roginske, Air Force Civil Engineer Center
Transcript of Sewer Ventilation as a VI Mitigation Alternative- Case Studies

www.jacobs.com | worldwide
Innovation that provides sustainable solutions to
complex challenges worldwide
Sewer Ventilation as a VI Mitigation Alternative- Case StudiesApril 10, 2018
CH2M is now Jacobs
Keri Hallberg, PE, JacobsLoren Lund, PhD, JacobsJessica High, PE, JacobsQuinten Bingham, JacobsDavid Cleland, PG, NAVFAC Mid-AtlanticMark Roginske, Air Force Civil Engineer Center
Presentation Outline
• Introduction
• Overview of the Sewer Preferential Pathway
• Ventilation Objectives
• Case Study – Site A
• Case Study – Site B
• Conclusions
2

Atypical Preferential Pathways (APPs)
Definition: A conduit into building (e.g., sewer line) that intercepts VOC source area and provides little resistance to vapor flow
Modified from Johnson 2015
Example APP

Frequency and Type of APPs (Literature Review*)
1
4
11
2 Faulty wax seal and ordamaged sewer pipes
Utility conduits
Gravity sanitary sewer
Gravity storm sewer
(all industrial)
*Mix of residential and commercial

Sewer Atypical Preferential Pathways
• Gravity sewers – large headspaces (facilitates vapor flow)
• Most sewers leak both in and out
• Sewers receive flow from smaller pipe networks
• Larger receiving pipes can be over 20-ft below ground
www.kingcounty.gov/services/environment/wastewater/ii/what.aspx)
5

VOCs in Sewer Gas
• VOCs enter sewer gas through 2 primary mechanisms⎯ Contaminated groundwater (may include
NAPL) and/or soil gas enters sewer
⎯ Direct discharge of water containing VOCs to sewer system
Adapted from McHugh and Beckley AEHS 2017
https://www.fvrobertson.com/sewer‐video‐inspection/6
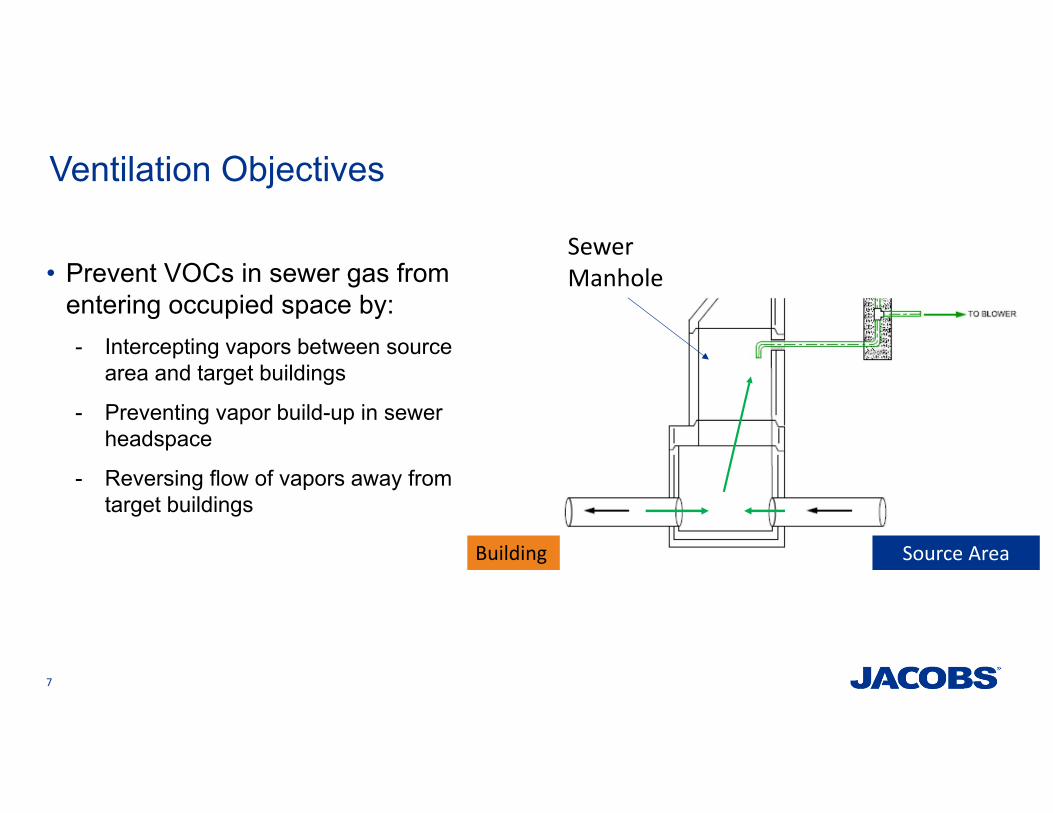
Ventilation Objectives
• Prevent VOCs in sewer gas from entering occupied space by:- Intercepting vapors between source
area and target buildings
- Preventing vapor build-up in sewer headspace
- Reversing flow of vapors away from target buildings
Source AreaBuilding
Sewer Manhole
7

Click to edit Master title style
Innovation that provides sustainable solutions to
complex challenges worldwide
Site A

Site A Background
• Upgradient of source area• Source area
⎯ PCE ~600 µg/L and TCE ~300 µg/L⎯ Residual soil NAPL
• Sewer connects source area to building• TCE periodically detected in indoor air
⎯ Above regulatory targets⎯ IA concentrations did not correlate
with SG concentrations• Additional investigation to determine source
⎯ Uncapped pipe in mechanical room⎯ Dry or damaged p-traps⎯ HAPSITE confirmed PCE and TCE
inside plumbing
Source Area
Building
Sanitary Sewer
Sewer gas
Sewer gas blocked by water (or seal)
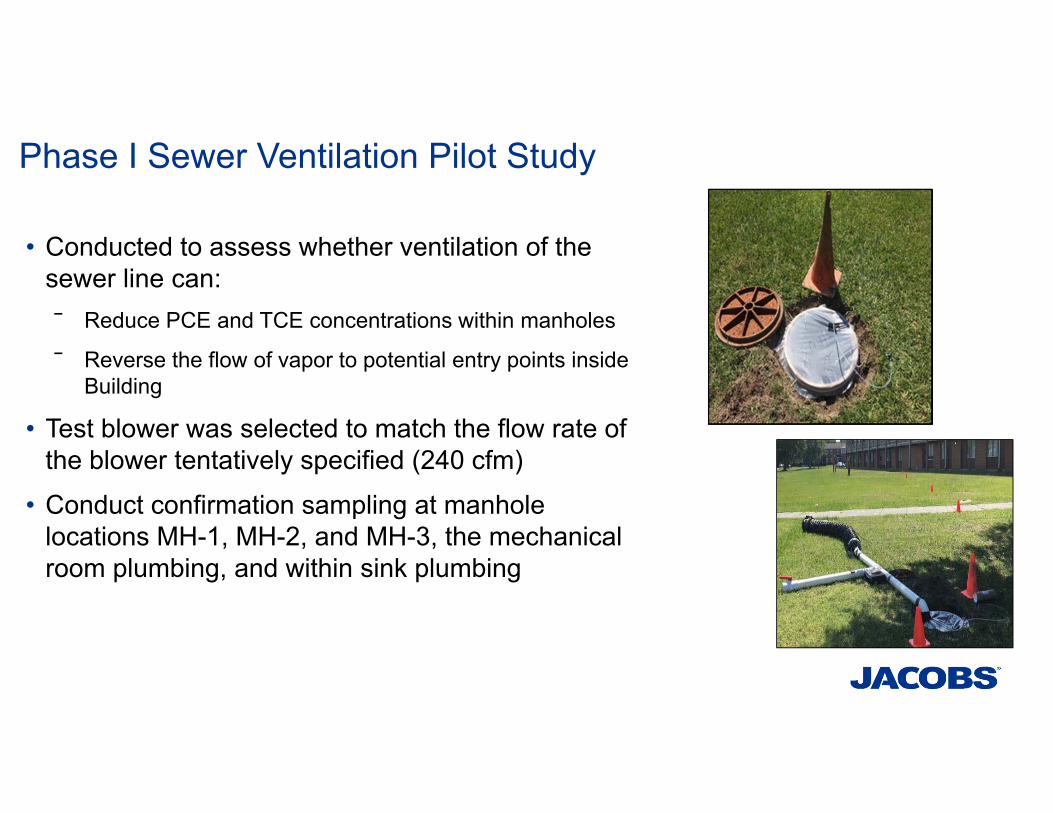
Phase I Sewer Ventilation Pilot Study
• Conducted to assess whether ventilation of the sewer line can:⎯ Reduce PCE and TCE concentrations within manholes
⎯ Reverse the flow of vapor to potential entry points inside Building
• Test blower was selected to match the flow rate of the blower tentatively specified (240 cfm)
• Conduct confirmation sampling at manhole locations MH-1, MH-2, and MH-3, the mechanical room plumbing, and within sink plumbing
MH-3MH‐1
MH‐2
MH‐3
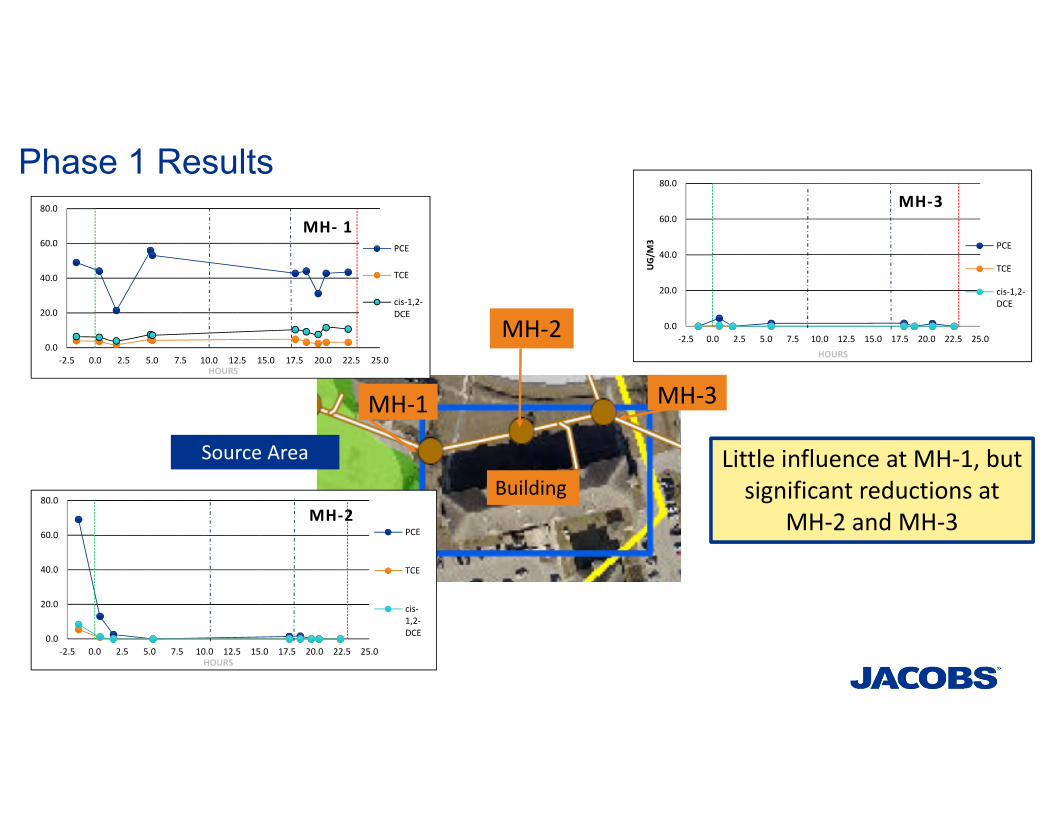
Phase 1 Results
370.0
20.0
40.0
60.0
80.0
‐2.5 0.0 2.5 5.0 7.5 10.0 12.5 15.0 17.5 20.0 22.5 25.0HOURS
MH‐ 1PCE
TCE
cis‐1,2‐DCE
0.0
20.0
40.0
60.0
80.0
‐2.5 0.0 2.5 5.0 7.5 10.0 12.5 15.0 17.5 20.0 22.5 25.0HOURS
MH‐2PCE
TCE
cis‐1,2‐DCE
0.0
20.0
40.0
60.0
80.0
‐2.5 0.0 2.5 5.0 7.5 10.0 12.5 15.0 17.5 20.0 22.5 25.0
UG/M
3
HOURS
MH‐3
PCE
TCE
cis‐1,2‐DCE
Building
Source Area Little influence at MH‐1, but significant reductions at
MH‐2 and MH‐3

Phase 1 Results
37
0.0
5.0
10.0
15.0
‐2.5 0.0 2.5 5.0 7.5 10.0 12.5 15.0 17.5 20.0 22.5 25.0HOURS
Wall Plumbing
PCE
TCE
0.0
20.0
40.0
60.0
‐2.5 0.0 2.5 5.0 7.5 10.0 12.5 15.0 17.5 20.0 22.5 25.0HOURS
Restroom Sink Plumbing
PCE
TCE
cis‐1,2‐DCE
Significant reductions in
building plumbing

Sewer Venting System Design
• 4” ventilation pipe from the sewer
• Connected to skid mounted blower• 240 cfm, 25” H2O
• Blower exhaust vented above roofline
• Vapor monitoring port installed (MH-1)
Ventilation Pipe
MH‐1 Sample Port

Phase 2 Field Activities
• Ventilation system and sample port installation
Blower Enclosure and Stack
Blower System
Manhole Sample Port
Blower Connection to Manhole
System Connection
System Connection
Piping into manhole

Phase 2 Field Activities• Baseline sampling, startup, and post-startup
performance monitoring ⎯ Highest sewer line concentrations observed at MH-1
(located closest to source area)
⎯ COCs not detected in indoor air above screening levels during baseline or after startup
⎯ Post-startup monitoring conducted 36 hours after startup
MH‐1
Office Plumbing
Wall PlumbingWall Plumbing
Blower Exhaust
IA SamplingIA Sampling

Phase 2 Performance Monitoring- PCE
0
1
10
100
1,000
PCE Co
ncen
tration (µg/m
3 )
Manhole 1 Blower ExhaustManhole 2 Office Restroom ‐ Indoor AirManhole 3 PCE VI IASL (8.34 µg/m3)
System Startup
PCE VI IASL ‐ 8.34 µg/m3
Unfilled symbols indicate non‐detect values
PCEconcentrations below IASL by
MH‐2
VI = Vapor IntrusionIASL = Indoor Air Screening Level

Phase 2 Performance Monitoring – TCE
0.0
0.1
1.0
10.0
100.0
TCE Co
ncen
tration (µg/m
3 )
Manhole 1 Blower ExhaustManhole 2 Office Restroom ‐ Indoor AirManhole 3 TCE VI IASL (0.42 µg/m3)System Startup
*TCE not detected above detection limits in Indoor Air:‐ HAPSITE = 0.54 µg/m3; analytical laboratory = 0.11 µg/m3
System Startup
TCE VI IASL ‐ 0.42 µg/m3
Unfilled symbols indicate non‐detect values VI = Vapor IntrusionIASL = Indoor Air Screening Level
TCEconcentrations below detection limits by MH‐2

Click to edit Master title style
Innovation that provides sustainable solutions to
complex challenges worldwide
Site B

Site B Background
Manhole D‐7
Manhole 1
Manhole 2Effluent Discharge Location
Manhole E1‐2
Residence 2
• TCE in sewer gas related to remediation system effluents discharging to Manhole 2, and flowing toward Manhole 1⎯ Effluent water
concentrations 10-50 µg/L
• TCE detected in the indoor air of nearby residences above mitigation action level
Residence 1
19

Pre-Design Testing Activities
• Baseline sewer gas samples collected (3 manholes)
• FanTech® FKD 8XL inline-duct fan connected to existing manhole passive vent pipe
• Post-Startup Sampling⎯ 25 to 55 minutes
⎯ 67 to 87 minutes
⎯ 98 to 122 minutes
20
Manhole 1 Sampling
Inline –Duct Fan

Pre-Design Testing Results
• 50% reduction in TCEconcentration within 25 to 55 minutes
• Up to 95% reduction after 98 minutes at manholes nearer residences
• Reduction maintained over 2-hour period
21
5.3
2.42.0
1.1
62.724.5
16.2 21.9
244.1
23.0
13.5 13.1
1.0
10.0
100.0
1000.0
0 25 67 98
TCECo
ncentration (ppb
v)
Minutes
Manhole E1‐2
Manhole 1
Manhole D‐7

Ventilation System Design
• Vent fan installed on concrete pad within tamper-resistant enclosure
• Plastec PLAS25XS4P blower⎯ Initial Flowrate 770 cfm
22

Performance Monitoring
0
0.1
0.2
0.3
0.4
0.5
0.6
0.7
0.8
0.9
2002 2004 2006 2008 2010 2012 2014 2016 2018 2020
TCECo
ncentration (ppb
v)
Date
Indoor Air Concentration ‐ Residences
Residence 2
Residence 1
TCE Mitigation Action Level‐ 0.39 ppbv
Vent Fan Installed at Manhole 2
Vent Fan Installed at Manhole 1
23

Conclusions
24
• Sewer ventilation is effective in mitigating VI through sewers by:⎯ Intercepting vapors between the source area and the building:
• Site A: concentrations of PCE and TCE in sewer manholes and in building plumbing reduced up to 99-percent
• IA concentrations < IASLs
⎯ Preventing accumulation of vapors:• Site B: TCE concentrations in the sewer line were reduced by 79-percent to
95-percent
• IA concentrations reduced to concentrations < mitigation action level