SEWER STUDY FOR IN THE CITY OF SAN DIEGO
33
SEWER STUDY FOR IN THE CITY OF SAN DIEGO June 14, 2006 Revised January 22, 2007 Revised December 4, 2008 Revised June 7, 2010 Revised October 3, 2011 Revised December 21, 2012 Revised January 31, 2014 Approved August 18, 2014 Amendment #1: January 21, 2016 (Sewer Deviations & Sewer Exhibits Only) Prepared By: BDS Engineering, Inc. 6859 Federal Boulevard Lemon Grove, CA 91945 Thomas A. Jones, P.E.
Transcript of SEWER STUDY FOR IN THE CITY OF SAN DIEGO

SEWER STUDY FOR
IN THE CITY OF SAN DIEGO
June 14, 2006 Revised January 22, 2007 Revised December 4, 2008
Revised June 7, 2010 Revised October 3, 2011
Revised December 21, 2012 Revised January 31, 2014 Approved August 18, 2014
Amendment #1: January 21, 2016 (Sewer Deviations & Sewer Exhibits Only)
Prepared By: BDS Engineering, Inc. 6859 Federal Boulevard Lemon Grove, CA 91945
Thomas A. Jones, P.E.

Stone Creek
BDS Engineering, Inc. 2 Sewer Study August 18, 2014
INTRODUCTION BDS Engineering, Inc. has been authorized by CalMat Co. dba Vulcan Materials Co. to prepare this sewer study for the Stone Creek Development (Project). The purpose of this study is to determine the on-site sewer facilities required for the Project and to review potential impacts to the existing off-site Carroll Canyon Trunk Sewer. The study identifies recommended pipe sizes and alignments, and provides calculated peak depth of flow (dn), dn/D ratio, and pipe velocities. BACKGROUND The project is located in the City of San Diego in the Mira Mesa Community. The project is generally located west of Black Mountain Road, north of Activity Road, east of Kibler Drive and south of Jade Coast Drive, as shown in Figure-1. Access to the project will be from Camino Ruiz and Black Mountain Road. The development plan for the Stone Creek project includes 64 multi-family residential lots, 21 light industrial and high technology lots, 4 business park lots, 22 mixed-use lots and 40 park and open space areas. Total project acreage is 288.52 acres. The proposed developed lots, not including park, open space lots and streets, encompass 123.14 net acres. Building pads within the project range in elevation from a low of approximately 329 feet to a high of 427 feet.
Figure-1: Vicinity Map

Stone Creek
BDS Engineering, Inc. 3 Sewer Study August 18, 2014
EXISTING SEWER FACILITIES The Stone Creek development lies within the tributary area for the Carroll Canyon Trunk Sewer #49. The trunk sewer runs adjacent to the Vulcan Materials Co. property on the southerly side. The Carroll Canyon Trunk Sewer was built in 1970. The pipe material is Vitrified Clay (VC) and Polyvinyl Chloride (PVC) and diameter ranges from 18-inch to 21-inch. The City of San Diego Metropolitan Wastewater Department has televised and modeled the Carroll Canyon trunk sewer and has published the condition and capacity results in a Memorandum dated March 23, 2004. The study includes dry and wet weather analysis for the year 2000, 2010, and 2030 (build out). The study did include several new development projects in the area, however did not include the Stone Creek Development. For the purpose of the Stone Creek Sewer Study, the 2030 dry weather flows (DWF), found in Table C-1 of the City’s study, were used for the analysis. The DWF downstream of manholes H05S126, H05S154, G052169 are 3.332 mgd, 4.085 mgd, and 4.518 mgd, respectively. LAND USE The proposed land use for the development is summarized in Table-1. In addition, each lot is labeled on the Sewer Study Exhibit, Map Pocket A. As indicated in Table-1, development of the project includes multi-family residential, industrial, business park mixed-use construction and parks.
LAND USE NET AREA
(acres) DWELLING UNITS
Multi-Family Residential (RM-1-2, RM-2-5, RM-3-9, RM-4-10, RM-4-11)
56.49 3,502
Industrial 37.12
Business Park 7.02
Mixed-use 22.51 943
TOTAL 123.14 4,445
Table-1: Land Use

Stone Creek
BDS Engineering, Inc. 4 Sewer Study August 18, 2014
SEWAGE DESIGN CRITERIA The 2004 City of San Diego Sewer Design Guide provides criteria to estimate sewage flows from different land uses. These criteria are summarized in Table-2. Table-3 presents the sewage generation factors.
DESCRIPTION DESIGN CRITERIA
Sewage Generation 80 gallons per day per capita
Persons per Dwelling Unit Table 1-1, 2004 City of San Diego Sewer Design Guide
Dwelling Units per Acre Stone Creek Master Plan
Peaking Factor Figure 1-1, 2004 City of San Diego Sewer Design Guide
Manning’s ‘n’ 0.013
Minimum Velocity 2 feet per second (fps)
Maximum Velocity 10 feet per second (fps)
Maximum dn/D ratio 0.50 (mains ≤ 15” Ø)
0.75 (mains > 15” Ø)
Table-2: Design Criteria

Stone Creek
BDS Engineering, Inc. 5 Sewer Study August 18, 2014
LAND USE SEWAGE GENERATION FACTOR
Multi-Family Residential1:
15.33 du/net-ac 3,820 gpd/acre
26.04 du/net-ac 6,250 gpd/acre
37.19 du/net-ac 6.545 gpd/acre
56.66 du/net-ac 9,972 gpd/acre
63.69 du/net-ac 11,209 gpd/acre
71.35 du/net-ac 12,558 gpd/acre
124.06 du/net-ac 14,887 gpd/acre
Industrial / Business Park 5,012 gpd/acre
Commercial: 3,500 gpd/acre
Park 1,000 gpd/acre
1 Multi-Family densities based on the Stone Creek Master Plan
Table-3: Sewage Generation Factors
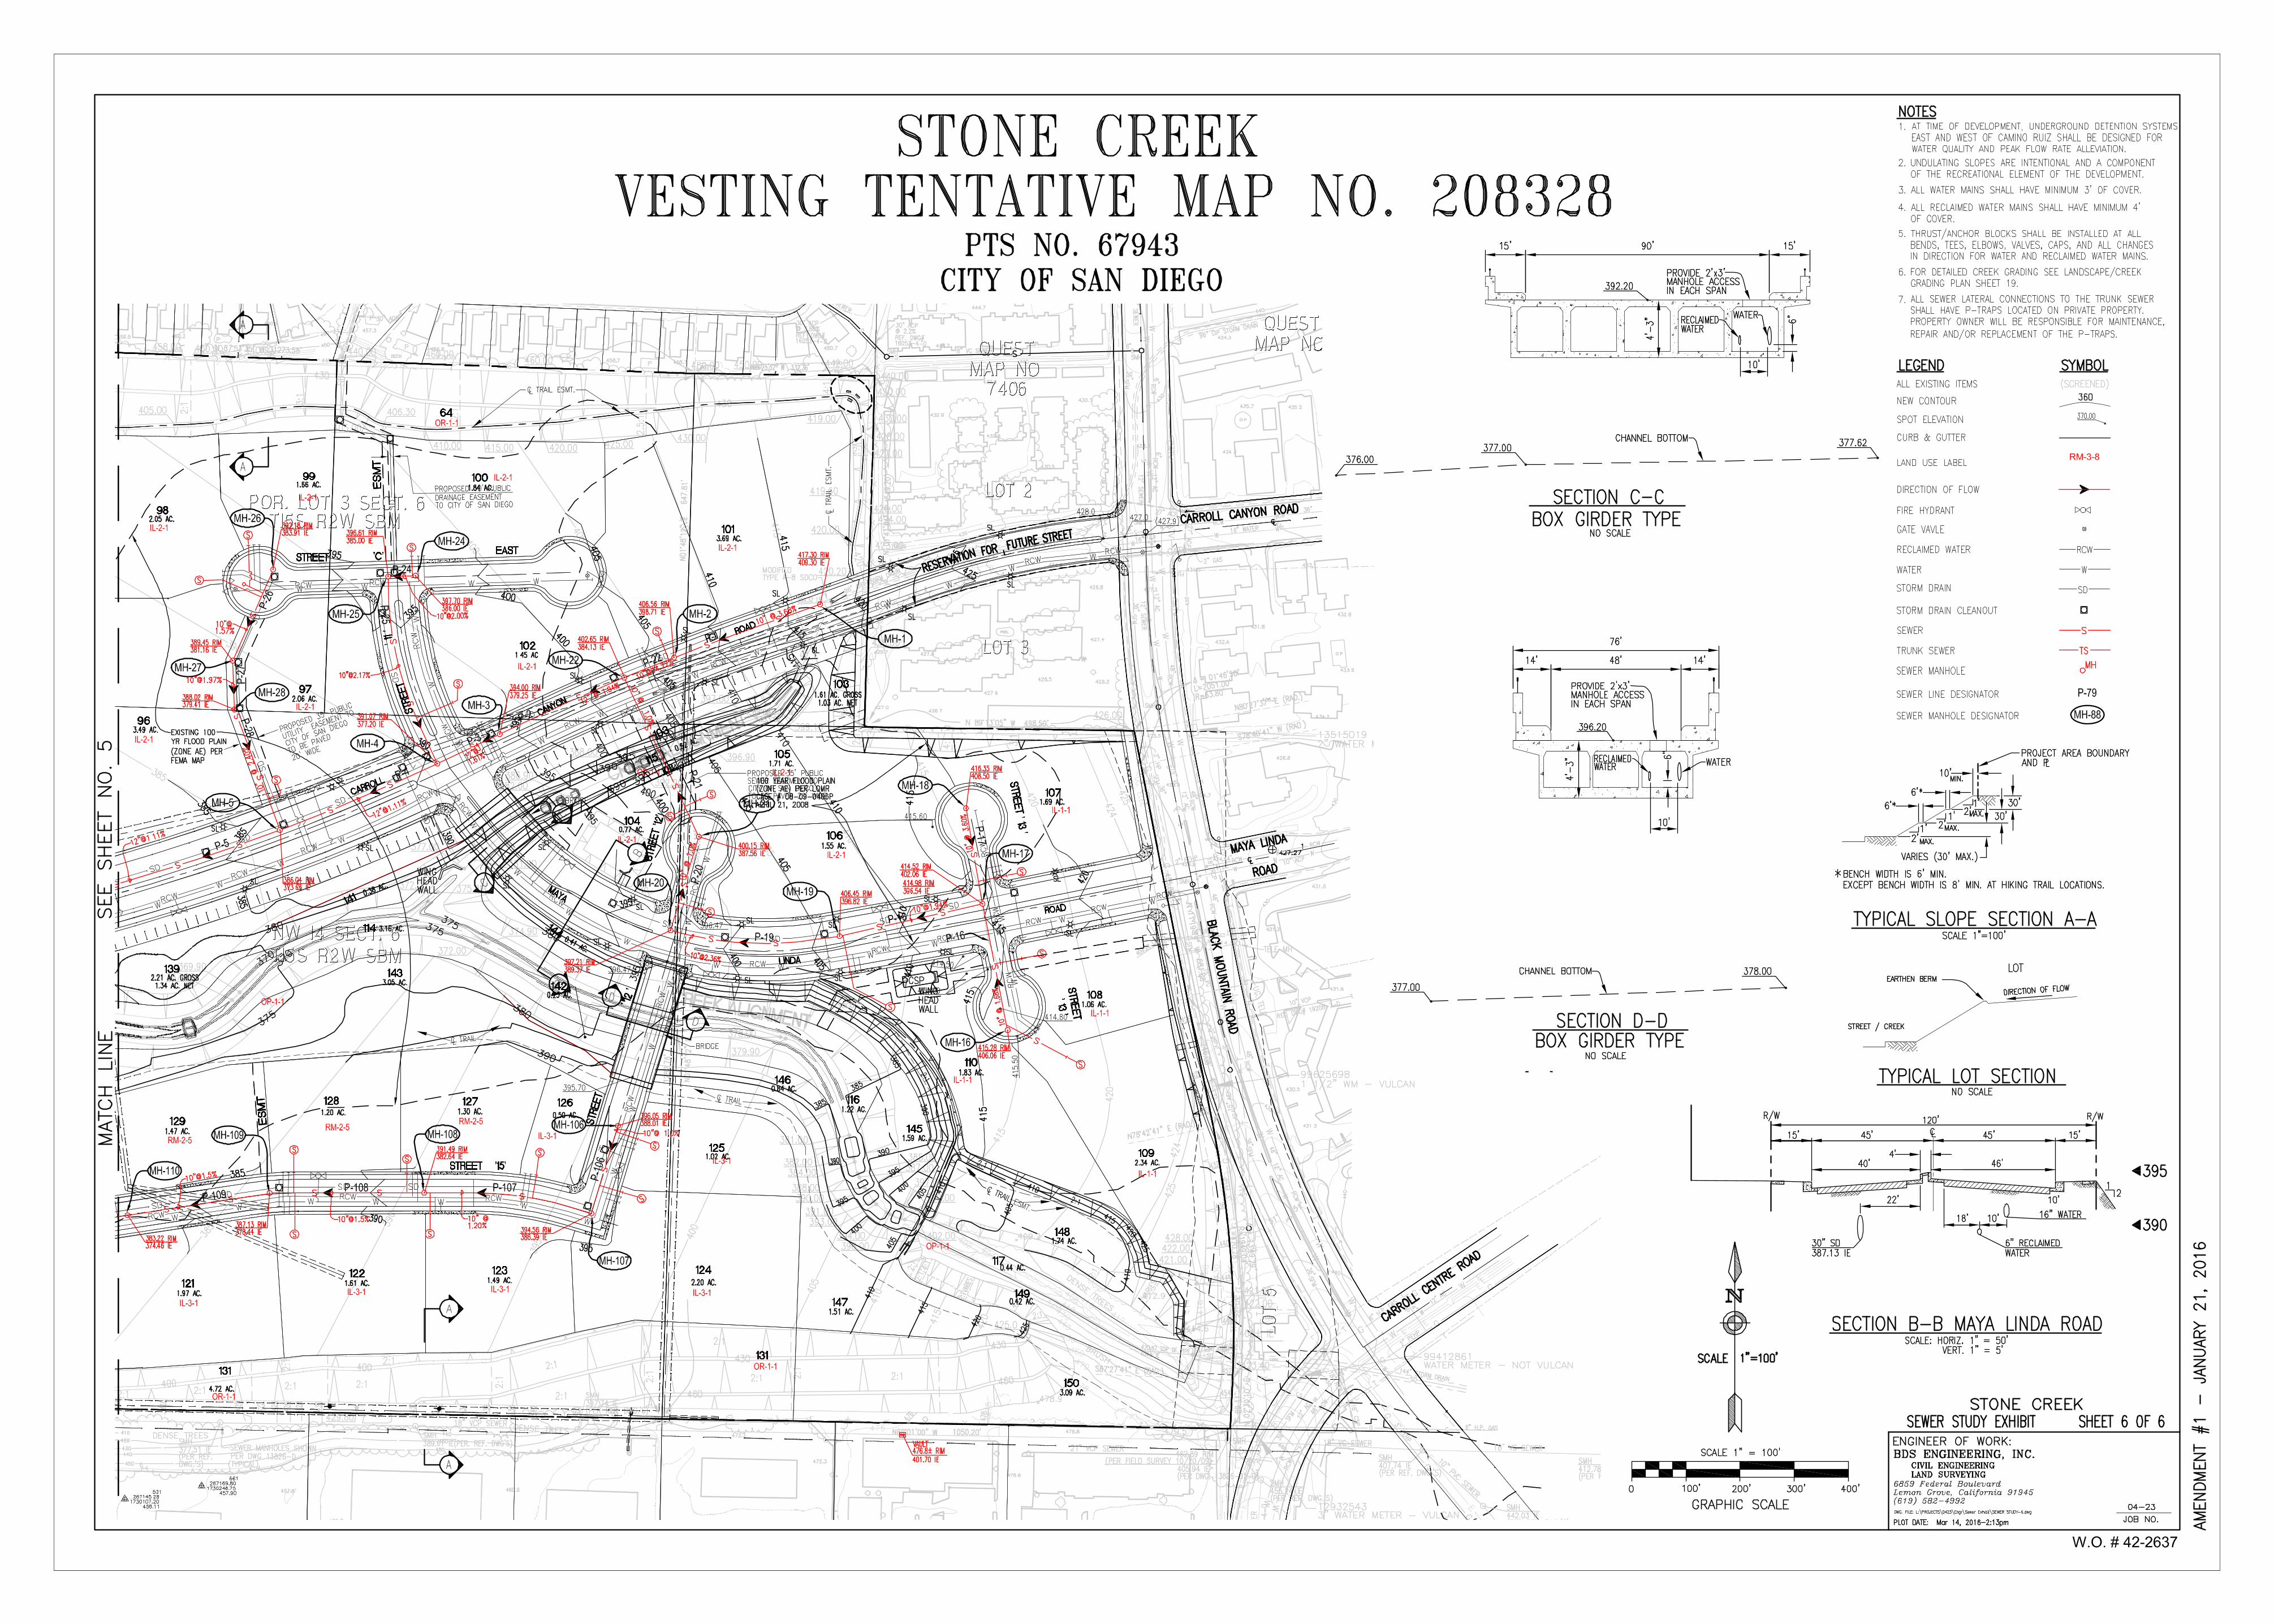
SEWAGE GENERATION Sewage generation projections for the Project area are based on the proposed Tentative Map for the Stone Creek development area and the 2004 City of San Diego Sewer Design Guide. The output of the sewer study is shown in the Sewer Study Summary Table in Appendix A. There will be three connections to the existing trunk sewer as outlined below. First, a new connection to the 18” Carroll Canyon Trunk Sewer will be made between manholes H05S126 and H04S125 (at a point along the southerly boundary east of Camino Ruiz). This new connection will be generating a peak dry weather flow (PDWF) of 0.297 mgd. The total flow in the trunk sewer, including the 0.297 mgd from the development, will be 5.409 mgd. The ratio of depth of low to pipe diameter, dn/D, is calculated to be 0.57, which is less than the maximum allowed ratio of 0.75 in a trunk sewer. Second, a new connection to the 21” Carroll Canyon Trunk Sewer will be made between manholes H05S228 and H05S226 (intersection of Carroll Canyon Rd and Camino Ruiz). This new connection will be generating a PDWF of 0.887 mgd. The total flow in the trunk sewer, including the additional flows of 0.297 and 0.887 mgd, at this point will be 5.269 mgd. The ratio of depth of flow to pipe diameter, dn/D, is

Stone Creek
BDS Engineering, Inc. 6 Sewer Study August 18, 2014
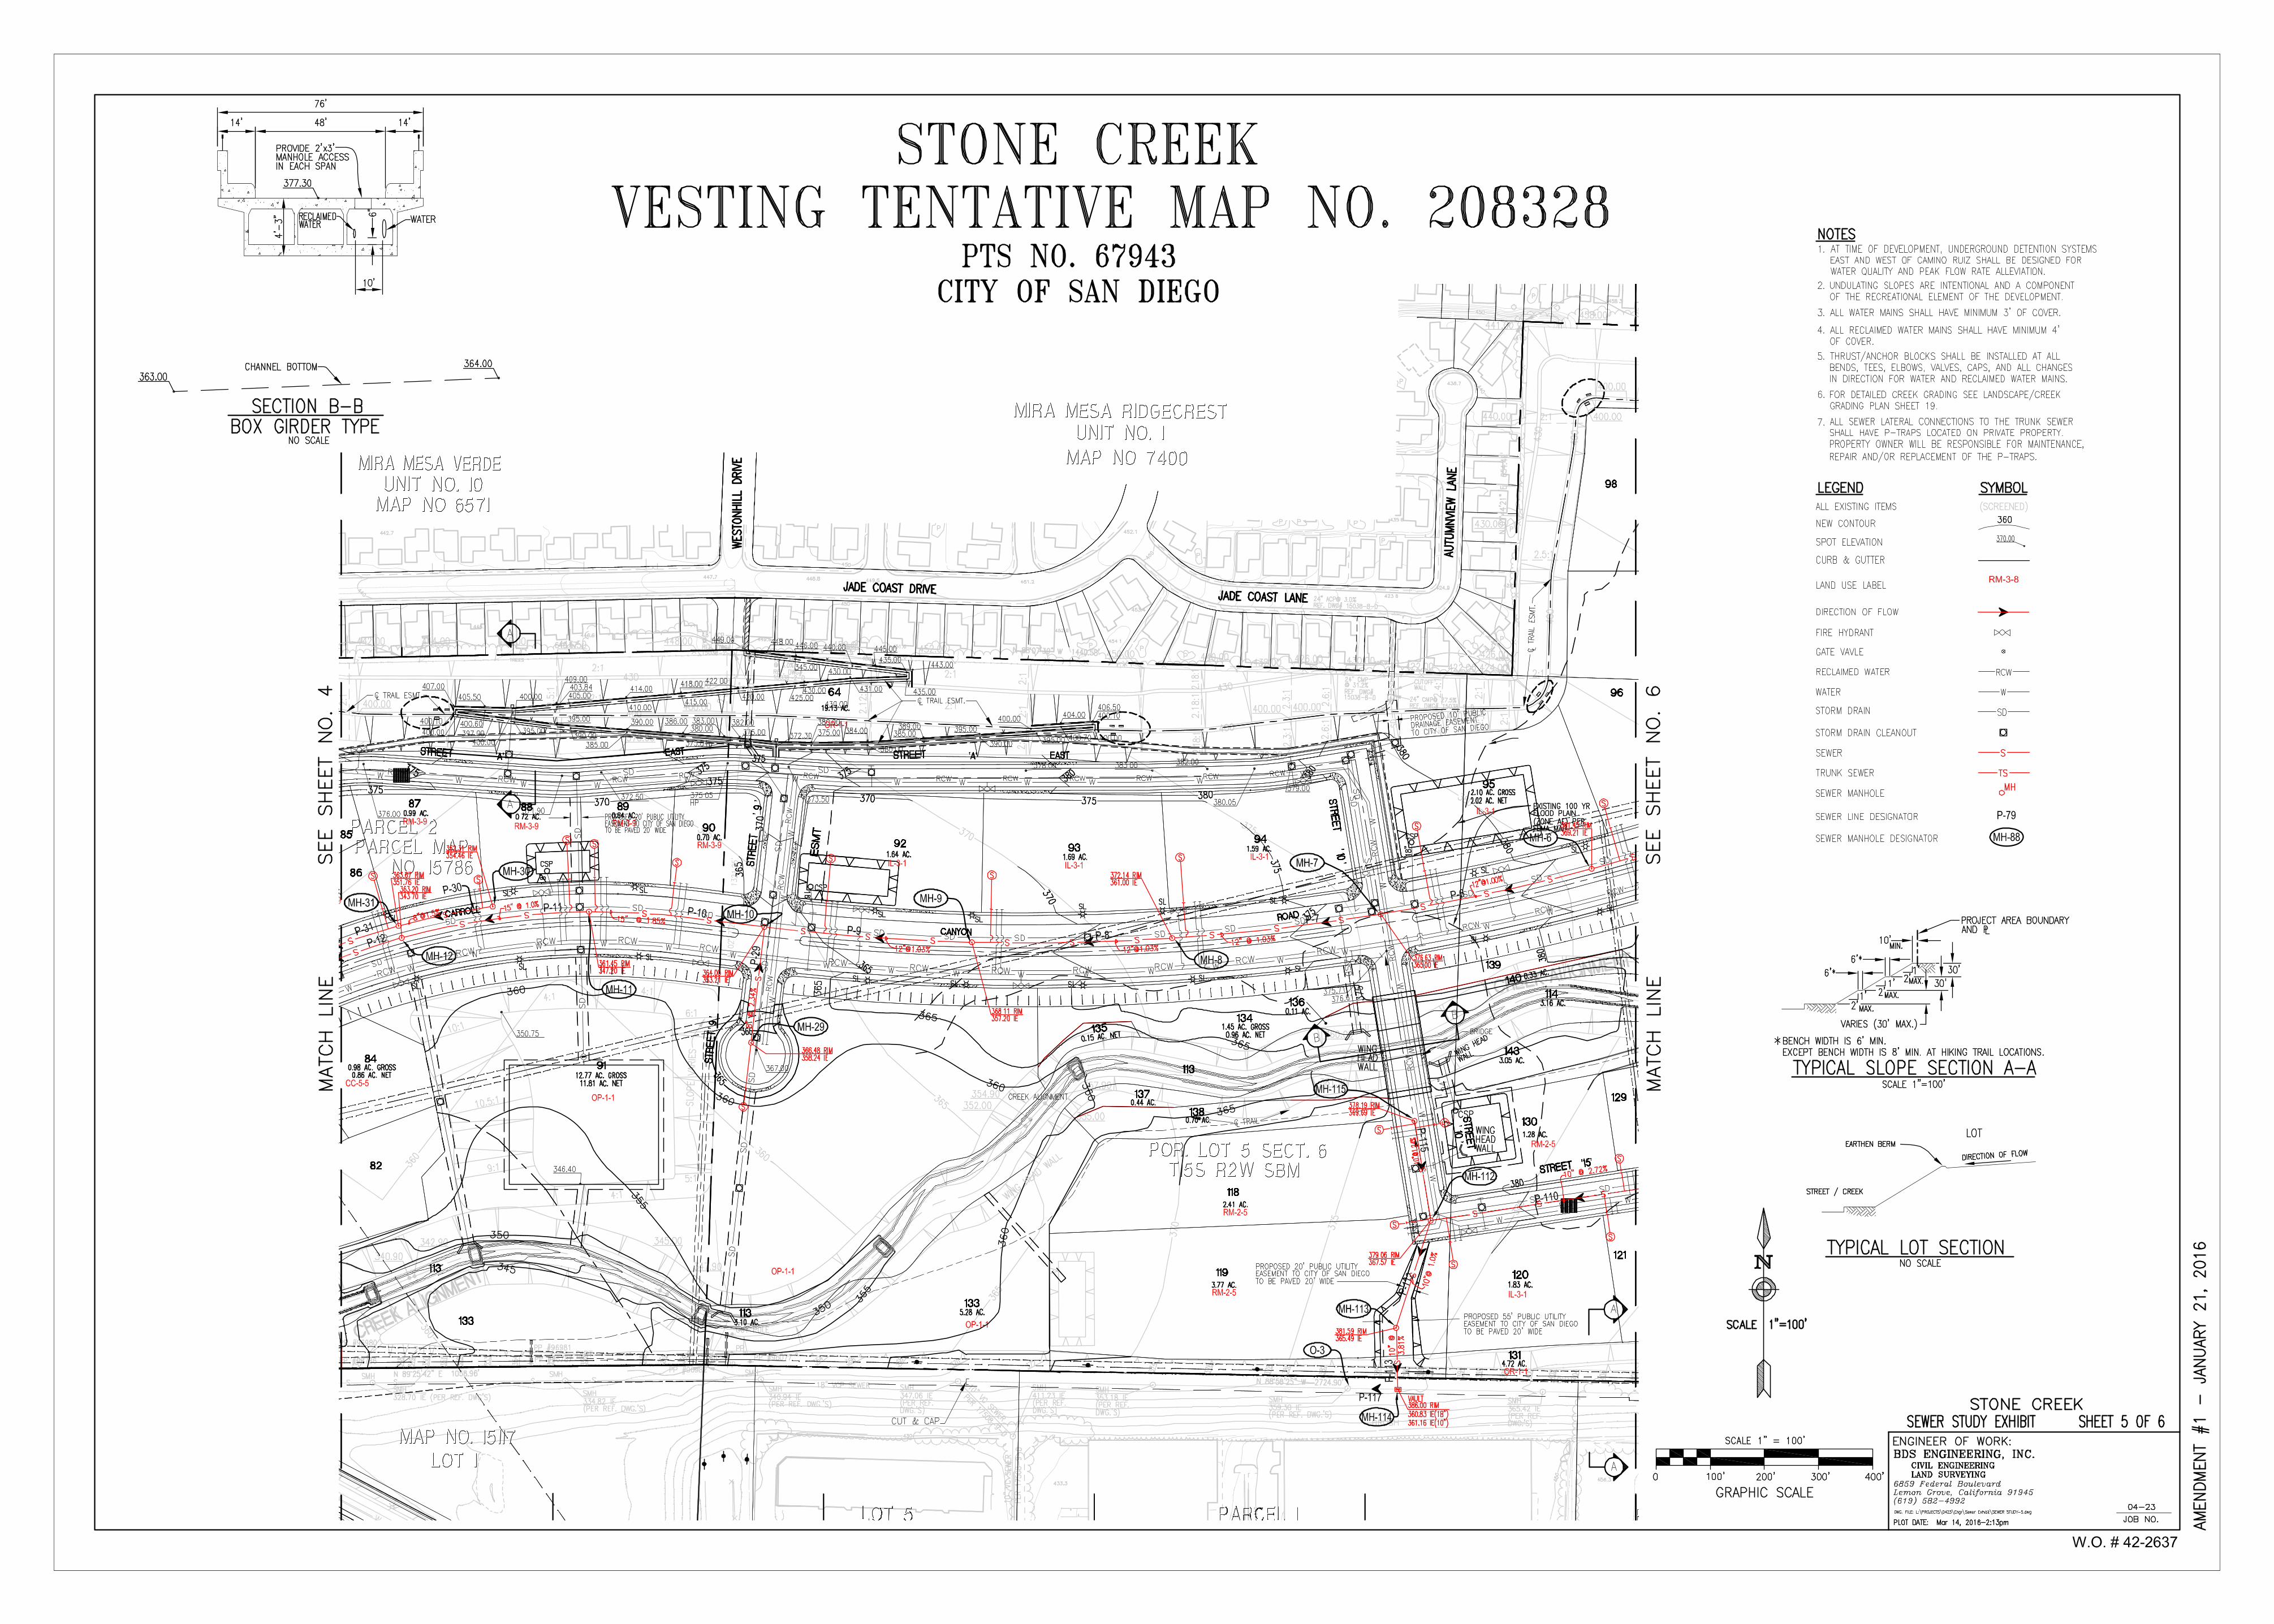
calculated to be 0.47, which is less than the maximum allowed ratio of 0.75 in a trunk sewer. Third, a new connection to the 21” Carroll Canyon Trunk Sewer will be made between manholes G05S169 and G05S168 (at a point along the southerly boundary west of Camino Ruiz). This new connection will be generating a PDWF flow of 0.933 mgd. The total flow in the trunk sewer at this point, including the additional flow of 1.184 mgd flow from the Stone Creek development upstream and the existing flow of 4.518 mgd, will be a total of 6.636 mgd. The ratio of depth of flow to pipe diameter, dn/D, is calculated to be 0.67, which is less than the maximum allowed ratio of 0.75 in a trunk sewer. HYDRAULIC ANALYSIS A hydraulic model was created of the proposed gravity collection system for Stone Creek development. The hydraulic model used Manning’s equation and the 2004 Sewer Design Guide dry weather peaking factor to determine the minimum size, slope required to meet the City of San Diego’s velocity and dn/D criteria. The hydraulic model identifies pipe sizes based on minimum slopes; consequently, some of the recommended sizes may be reduced if the design slope is greater than the minimum slope given. Additional analysis shall be performed to verify the depth criteria if pipe sizes are modified. The pipe sizes, slopes, rim elevations, invert elevations, manhole designations, and pipe designations can be seen on the Sewer Study Exhibit, Map Pocket A. The hydraulic analysis has been summarized in Appendix A. In addition, a manhole report, has been included as part of Appendix B. This report shows the rim elevation, invert elevation and depths of all the manholes. CONCLUSIONS AND RECOMMENDATIONS This report presents land use information, City of San Diego design criteria as well as hydraulic analysis of the proposed sewer network for the Stone Creek Project. The hydraulic model was used to determine pipe sizes and slopes to meet the projected Peak Dry Weather Flow and meeting the City’s design criteria. We recommend that the pipe sizes and diameters in this study be used in final design of the gravity sewer system for the Stone Creek Project.

APPENDIX A
SEWER STUDY SUMMARY TABLE
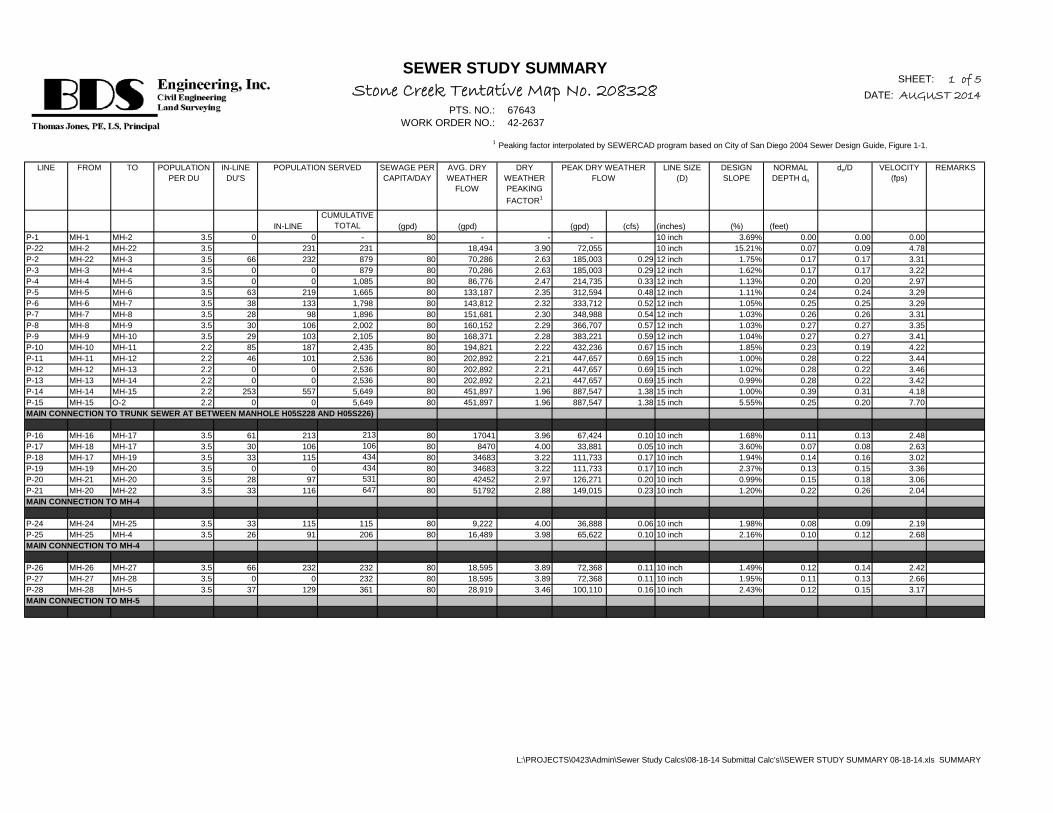
SHEET: 1 of 5DATE: AUGUST 2014
PTS. NO.: 67643WORK ORDER NO.: 42-2637
1 Peaking factor interpolated by SEWERCAD program based on City of San Diego 2004 Sewer Design Guide, Figure 1-1.
LINE FROM TO POPULATION PER DU
IN-LINE DU'S
SEWAGE PER CAPITA/DAY
AVG. DRY WEATHER
FLOW
DRY WEATHER PEAKING FACTOR1
LINE SIZE (D)
DESIGN SLOPE
NORMAL DEPTH dn
dn/D VELOCITY (fps)
REMARKS
IN-LINECUMULATIVE
TOTAL (gpd) (gpd) (gpd) (cfs) (inches) (%) (feet)P-1 MH-1 MH-2 3.5 0 0 - 80 - - - 10 inch 3.69% 0.00 0.00 0.00P-22 MH-2 MH-22 3.5 231 231 18,494 3.90 72,055 10 inch 15.21% 0.07 0.09 4.78P-2 MH-22 MH-3 3.5 66 232 879 80 70,286 2.63 185,003 0.29 12 inch 1.75% 0.17 0.17 3.31P-3 MH-3 MH-4 3.5 0 0 879 80 70,286 2.63 185,003 0.29 12 inch 1.62% 0.17 0.17 3.22P-4 MH-4 MH-5 3.5 0 0 1,085 80 86,776 2.47 214,735 0.33 12 inch 1.13% 0.20 0.20 2.97P-5 MH-5 MH-6 3.5 63 219 1,665 80 133,187 2.35 312,594 0.48 12 inch 1.11% 0.24 0.24 3.29P-6 MH-6 MH-7 3.5 38 133 1,798 80 143,812 2.32 333,712 0.52 12 inch 1.05% 0.25 0.25 3.29P-7 MH-7 MH-8 3.5 28 98 1,896 80 151,681 2.30 348,988 0.54 12 inch 1.03% 0.26 0.26 3.31P-8 MH-8 MH-9 3.5 30 106 2,002 80 160,152 2.29 366,707 0.57 12 inch 1.03% 0.27 0.27 3.35P-9 MH-9 MH-10 3.5 29 103 2,105 80 168,371 2.28 383,221 0.59 12 inch 1.04% 0.27 0.27 3.41P-10 MH-10 MH-11 2.2 85 187 2,435 80 194,821 2.22 432,236 0.67 15 inch 1.85% 0.23 0.19 4.22P-11 MH-11 MH-12 2.2 46 101 2,536 80 202,892 2.21 447,657 0.69 15 inch 1.00% 0.28 0.22 3.44P-12 MH-12 MH-13 2.2 0 0 2,536 80 202,892 2.21 447,657 0.69 15 inch 1.02% 0.28 0.22 3.46P-13 MH-13 MH-14 2.2 0 0 2,536 80 202,892 2.21 447,657 0.69 15 inch 0.99% 0.28 0.22 3.42P-14 MH-14 MH-15 2.2 253 557 5,649 80 451,897 1.96 887,547 1.38 15 inch 1.00% 0.39 0.31 4.18P-15 MH-15 O-2 2.2 0 0 5,649 80 451,897 1.96 887,547 1.38 15 inch 5.55% 0.25 0.20 7.70MAIN CONNECTION TO TRUNK SEWER AT BETWEEN MANHOLE H05S228 AND H05S226)
P-16 MH-16 MH-17 3.5 61 213 213 80 17041 3.96 67,424 0.10 10 inch 1.68% 0.11 0.13 2.48P-17 MH-18 MH-17 3.5 30 106 106 80 8470 4.00 33,881 0.05 10 inch 3.60% 0.07 0.08 2.63P-18 MH-17 MH-19 3.5 33 115 434 80 34683 3.22 111,733 0.17 10 inch 1.94% 0.14 0.16 3.02P-19 MH-19 MH-20 3.5 0 0 434 80 34683 3.22 111,733 0.17 10 inch 2.37% 0.13 0.15 3.36P-20 MH-21 MH-20 3.5 28 97 531 80 42452 2.97 126,271 0.20 10 inch 0.99% 0.15 0.18 3.06P-21 MH-20 MH-22 3.5 33 116 647 80 51792 2.88 149,015 0.23 10 inch 1.20% 0.22 0.26 2.04MAIN CONNECTION TO MH-4
P-24 MH-24 MH-25 3.5 33 115 115 80 9,222 4.00 36,888 0.06 10 inch 1.98% 0.08 0.09 2.19P-25 MH-25 MH-4 3.5 26 91 206 80 16,489 3.98 65,622 0.10 10 inch 2.16% 0.10 0.12 2.68MAIN CONNECTION TO MH-4
P-26 MH-26 MH-27 3.5 66 232 232 80 18,595 3.89 72,368 0.11 10 inch 1.49% 0.12 0.14 2.42P-27 MH-27 MH-28 3.5 0 0 232 80 18,595 3.89 72,368 0.11 10 inch 1.95% 0.11 0.13 2.66P-28 MH-28 MH-5 3.5 37 129 361 80 28,919 3.46 100,110 0.16 10 inch 2.43% 0.12 0.15 3.17MAIN CONNECTION TO MH-5
POPULATION SERVED
SEWER STUDY SUMMARYStone Creek Tentative Map No. 208328
PEAK DRY WEATHER FLOW
L:\PROJECTS\0423\Admin\Sewer Study Calcs\08-18-14 Submittal Calc's\\SEWER STUDY SUMMARY 08-18-14.xls SUMMARY

SHEET: 2 of 5DATE: AUGUST 2014
PTS. NO.: 67643WORK ORDER NO.: 42-2637
1 Peaking factor interpolated by SEWERCAD program based on City of San Diego 2004 Sewer Design Guide, Figure 1-1.
LINE FROM TO POPULATION PER DU
IN-LINE DU'S
SEWAGE PER CAPITA/DAY
AVG. DRY WEATHER
FLOW
DRY WEATHER PEAKING FACTOR1
LINE SIZE (D)
DESIGN SLOPE
NORMAL DEPTH dn
dn/D VELOCITY (fps)
REMARKS
IN-LINECUMULATIVE
TOTAL (gpd) (gpd) (gpd) (cfs) (inches) (%) (feet)
POPULATION SERVED
SEWER STUDY SUMMARYStone Creek Tentative Map No. 208328
PEAK DRY WEATHER FLOW
P-29 MH-29 MH-10 3.5 41 143 143 80 11,430 4.00 45,720 0.07 8 inch 2.34% 0.09 0.13 2.55MAIN CONNECTION TO MH-10
P-30 MH-30 MH-31 2.2 63 139 139 80 11,097 4.00 44,388 0.07 8 inch 1.52% 0.10 0.15 2.17P-31 MH-31 MH-32 2.2 96 211 350 80 28,030 3.50 98,069 0.15 10 inch 1.28% 0.14 0.17 2.52P-32 MH-32 MH-33 2.2 139 306 2,556 80 204,506 2.20 450,805 0.70 12 inch 1.79% 0.26 0.26 4.33P-33 MH-33 MH-14 2.2 0 0 2,556 80 204,506 2.20 450,805 0.70 12 inch 16.86% 0.15 0.15 9.57COLLECTOR MAIN CONNECTION TO MH-14
P-34 MH-34 MH-35 2.2 137 301 301 80 24,109 3.66 88,290 0.14 10 inch 2.87% 0.11 0.13 3.24P-35 MH-35 MH-36 2.2 0 0 301 80 24,109 3.66 88,290 0.14 10 inch 2.00% 0.12 0.14 2.85P-36 MH-36 MH-37 2.2 90 198 499 80 39,955 3.00 119,939 0.19 10 inch 2.62% 0.13 0.16 3.43P-37 MH-37 MH-38 2.2 60 131 630 80 50,426 2.89 145,801 0.23 10 inch 5.22% 0.12 0.15 4.64P-38 MH-38 MH-39 2.2 30 66 696 80 55,681 2.84 157,948 0.24 10 inch 7.20% 0.12 0.14 5.32P-39 MH-39 MH-32 2.2 146 322 1,900 80 151,966 2.30 349,533 0.54 12 inch 3.34% 0.20 0.20 5.02MAIN CONNECTION TO MH-32
P-40 MH-40 MH-41 2.2 160 353 353 80 28,226 3.49 98,524 0.15 10 inch 1.00% 0.15 0.18 2.31P-41 MH-41 MH-42 2.2 0 0 353 80 28,226 3.49 98,524 0.15 10 inch 1.42% 0.14 0.16 2.61P-42 MH-42 MH-43 2.2 40 89 442 80 35,358 3.19 112,910 0.18 10 inch 1.72% 0.14 0.17 2.91P-43 MH-43 MH-44 2.2 159 349 791 80 63,284 2.76 174,499 0.27 10 inch 1.73% 0.17 0.21 3.31P-44 MH-44 MH-45 2.2 0 0 791 80 63,284 2.76 174,499 0.27 10 inch 1.73% 0.17 0.21 3.31P-45 MH-45 MH-39 2.2 41 91 882 80 70,516 2.63 185,298 0.29 10 inch 3.62% 0.15 0.18 4.38MAIN CONNECTION TO MH-39
P-46 MH-46 MH-39 2.2 88 193 193 80 15,457 4.00 61,826 0.10 10 inch 4.02% 0.09 0.10 3.27MAIN CONNECTION TO MH-39
P-105 MH-105 MH-106 3.0 21 64 64 80 5,112 4.00 20,449 0.03 10 inch 1.94% 0.06 0.07 1.82P-106 MH-106 MH-107 3.0 48 145 209 80 16,690 3.97 66,280 0.10 10 inch 1.06% 0.12 0.15 2.09P-107 MH-107 MH-108 3.0 41 123 332 80 26,564 3.56 94,562 0.15 10 inch 1.20% 0.14 0.17 2.43P-108 MH-108 MH-109 3.0 99 296 628 80 50,258 2.89 145,404 0.23 10 inch 1.47% 0.16 0.20 2.97P-109 MH-109 MH-110 3.0 0 0 628 80 50,258 2.89 145,404 0.23 10 inch 1.50% 0.16 0.20 2.99P-110 MH-110 MH-111 3.0 79 238 866 80 69,319 2.65 183,716 0.28 10 inch 1.40% 0.19 0.22 3.12P-111 MH-111 MH-112 3.0 38 114 980 80 78,391 2.52 197,555 0.31 10 inch 4.34% 0.15 0.18 4.76P-112 MH-112 MH-113 3.0 0 0 1,570 80 125,578 2.37 297,126 0.46 10 inch 0.93% 0.26 0.32 3.10P-113 MH-113 MH-114 3.0 0 0 1,570 80 125,578 2.37 297,126 0.46 10 inch 3.82% 0.18 0.22 5.12P-117 MH-114 O-3 3.0 0 0 1,570 80 3,457,578 1.05 3,629,126 5.63 18 inch 1.64% 0.68 0.45 7.27MAIN CONNECTION TO TRUNK SEWER BETWEEN MANHOLE S H05S125 AND H05S126
L:\PROJECTS\0423\Admin\Sewer Study Calcs\08-18-14 Submittal Calc's\\SEWER STUDY SUMMARY 08-18-14.xls SUMMARY
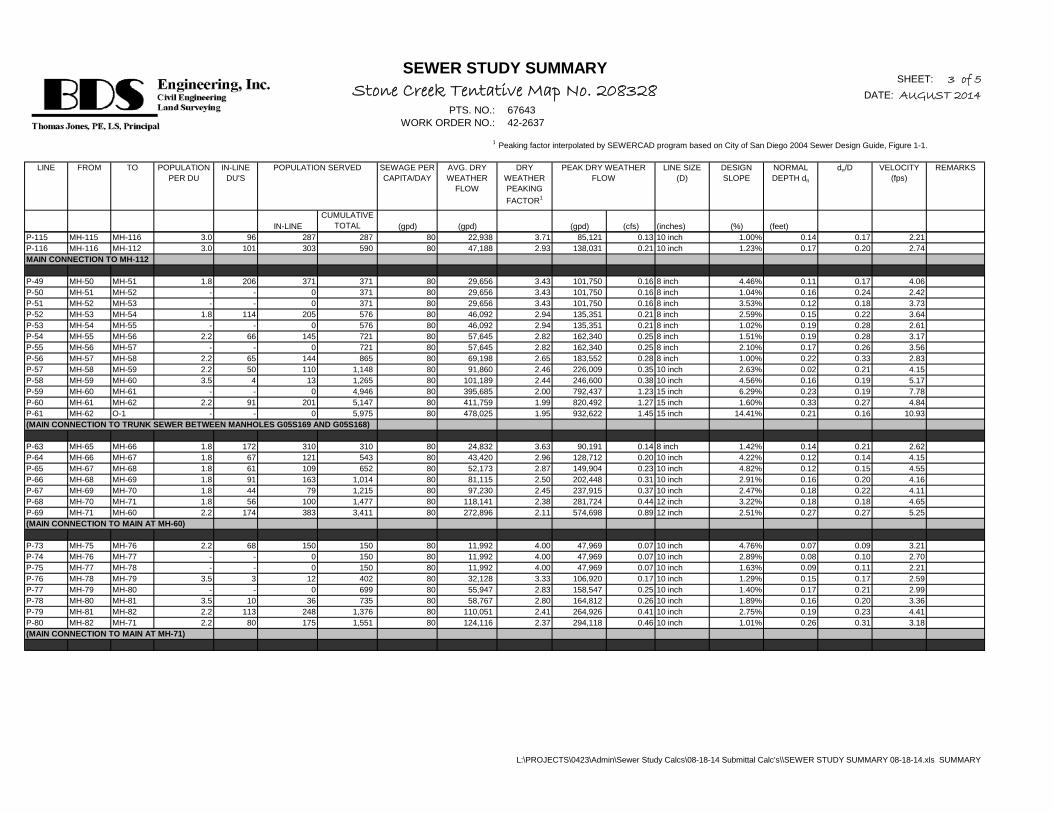
SHEET: 3 of 5DATE: AUGUST 2014
PTS. NO.: 67643WORK ORDER NO.: 42-2637
1 Peaking factor interpolated by SEWERCAD program based on City of San Diego 2004 Sewer Design Guide, Figure 1-1.
LINE FROM TO POPULATION PER DU
IN-LINE DU'S
SEWAGE PER CAPITA/DAY
AVG. DRY WEATHER
FLOW
DRY WEATHER PEAKING FACTOR1
LINE SIZE (D)
DESIGN SLOPE
NORMAL DEPTH dn
dn/D VELOCITY (fps)
REMARKS
IN-LINECUMULATIVE
TOTAL (gpd) (gpd) (gpd) (cfs) (inches) (%) (feet)
POPULATION SERVED
SEWER STUDY SUMMARYStone Creek Tentative Map No. 208328
PEAK DRY WEATHER FLOW
P-115 MH-115 MH-116 3.0 96 287 287 80 22,938 3.71 85,121 0.13 10 inch 1.00% 0.14 0.17 2.21P-116 MH-116 MH-112 3.0 101 303 590 80 47,188 2.93 138,031 0.21 10 inch 1.23% 0.17 0.20 2.74MAIN CONNECTION TO MH-112
P-49 MH-50 MH-51 1.8 206 371 371 80 29,656 3.43 101,750 0.16 8 inch 4.46% 0.11 0.17 4.06P-50 MH-51 MH-52 - - 0 371 80 29,656 3.43 101,750 0.16 8 inch 1.04% 0.16 0.24 2.42P-51 MH-52 MH-53 - - 0 371 80 29,656 3.43 101,750 0.16 8 inch 3.53% 0.12 0.18 3.73P-52 MH-53 MH-54 1.8 114 205 576 80 46,092 2.94 135,351 0.21 8 inch 2.59% 0.15 0.22 3.64P-53 MH-54 MH-55 - - 0 576 80 46,092 2.94 135,351 0.21 8 inch 1.02% 0.19 0.28 2.61P-54 MH-55 MH-56 2.2 66 145 721 80 57,645 2.82 162,340 0.25 8 inch 1.51% 0.19 0.28 3.17P-55 MH-56 MH-57 - - 0 721 80 57,645 2.82 162,340 0.25 8 inch 2.10% 0.17 0.26 3.56P-56 MH-57 MH-58 2.2 65 144 865 80 69,198 2.65 183,552 0.28 8 inch 1.00% 0.22 0.33 2.83P-57 MH-58 MH-59 2.2 50 110 1,148 80 91,860 2.46 226,009 0.35 10 inch 2.63% 0.02 0.21 4.15P-58 MH-59 MH-60 3.5 4 13 1,265 80 101,189 2.44 246,600 0.38 10 inch 4.56% 0.16 0.19 5.17P-59 MH-60 MH-61 - - 0 4,946 80 395,685 2.00 792,437 1.23 15 inch 6.29% 0.23 0.19 7.78P-60 MH-61 MH-62 2.2 91 201 5,147 80 411,759 1.99 820,492 1.27 15 inch 1.60% 0.33 0.27 4.84P-61 MH-62 O-1 - - 0 5,975 80 478,025 1.95 932,622 1.45 15 inch 14.41% 0.21 0.16 10.93(MAIN CONNECTION TO TRUNK SEWER BETWEEN MANHOLES G05S169 AND G05S168)
P-63 MH-65 MH-66 1.8 172 310 310 80 24,832 3.63 90,191 0.14 8 inch 1.42% 0.14 0.21 2.62P-64 MH-66 MH-67 1.8 67 121 543 80 43,420 2.96 128,712 0.20 10 inch 4.22% 0.12 0.14 4.15P-65 MH-67 MH-68 1.8 61 109 652 80 52,173 2.87 149,904 0.23 10 inch 4.82% 0.12 0.15 4.55P-66 MH-68 MH-69 1.8 91 163 1,014 80 81,115 2.50 202,448 0.31 10 inch 2.91% 0.16 0.20 4.16P-67 MH-69 MH-70 1.8 44 79 1,215 80 97,230 2.45 237,915 0.37 10 inch 2.47% 0.18 0.22 4.11P-68 MH-70 MH-71 1.8 56 100 1,477 80 118,141 2.38 281,724 0.44 12 inch 3.22% 0.18 0.18 4.65P-69 MH-71 MH-60 2.2 174 383 3,411 80 272,896 2.11 574,698 0.89 12 inch 2.51% 0.27 0.27 5.25(MAIN CONNECTION TO MAIN AT MH-60)
P-73 MH-75 MH-76 2.2 68 150 150 80 11,992 4.00 47,969 0.07 10 inch 4.76% 0.07 0.09 3.21P-74 MH-76 MH-77 - - 0 150 80 11,992 4.00 47,969 0.07 10 inch 2.89% 0.08 0.10 2.70P-75 MH-77 MH-78 - - 0 150 80 11,992 4.00 47,969 0.07 10 inch 1.63% 0.09 0.11 2.21P-76 MH-78 MH-79 3.5 3 12 402 80 32,128 3.33 106,920 0.17 10 inch 1.29% 0.15 0.17 2.59P-77 MH-79 MH-80 - - 0 699 80 55,947 2.83 158,547 0.25 10 inch 1.40% 0.17 0.21 2.99P-78 MH-80 MH-81 3.5 10 36 735 80 58,767 2.80 164,812 0.26 10 inch 1.89% 0.16 0.20 3.36P-79 MH-81 MH-82 2.2 113 248 1,376 80 110,051 2.41 264,926 0.41 10 inch 2.75% 0.19 0.23 4.41P-80 MH-82 MH-71 2.2 80 175 1,551 80 124,116 2.37 294,118 0.46 10 inch 1.01% 0.26 0.31 3.18(MAIN CONNECTION TO MAIN AT MH-71)
L:\PROJECTS\0423\Admin\Sewer Study Calcs\08-18-14 Submittal Calc's\\SEWER STUDY SUMMARY 08-18-14.xls SUMMARY

SHEET: 4 of 5DATE: AUGUST 2014
PTS. NO.: 67643WORK ORDER NO.: 42-2637
1 Peaking factor interpolated by SEWERCAD program based on City of San Diego 2004 Sewer Design Guide, Figure 1-1.
LINE FROM TO POPULATION PER DU
IN-LINE DU'S
SEWAGE PER CAPITA/DAY
AVG. DRY WEATHER
FLOW
DRY WEATHER PEAKING FACTOR1
LINE SIZE (D)
DESIGN SLOPE
NORMAL DEPTH dn
dn/D VELOCITY (fps)
REMARKS
IN-LINECUMULATIVE
TOTAL (gpd) (gpd) (gpd) (cfs) (inches) (%) (feet)
POPULATION SERVED
SEWER STUDY SUMMARYStone Creek Tentative Map No. 208328
PEAK DRY WEATHER FLOW
P-88 MH-90 MH-91 - - 0 - 80 - - - 0.00 8 inch 2.91% 0.00 0.00 0P-89 MH-91 MH-92 3.1 15 46 46 80 3,650 4.00 14,600 0.02 8 inch 1.99% 0.05 0.08 1.71P-90 MH-92 MH-93 3.1 22 69 115 80 9,239 4.00 36,955 0.06 8 inch 2.50% 0.08 0.12 2.45P-91 MH-93 MH-94 3.1 12 37 152 80 12,166 4.00 48,666 0.08 8 inch 1.63% 0.10 0.15 2.29P-92 MH-94 MH-95 - - 0 152 80 12,166 4.00 48,666 0.08 12 inch 2.55% 0.08 0.08 2.53P-93 MH-95 MH-96 3.1 37 116 268 80 21,443 3.77 80,912 0.13 12 inch 2.83% 0.10 0.10 3.06P-94 MH-96 MH-62 2.2 168 370 828 80 66,266 2.71 179,421 0.28 15 inch 3.97% 0.13 0.10 4.25(MAIN CONNECTION TO MAIN AT MH-62)
P-86 MH-88 MH-89 3.1 13 39 39 80 3,156 4.00 12,623 0.02 8 inch 2.13% 0.05 0.07 1.67P-87 MH-89 MH-58 2.2 61 134 173 80 13,830 4.00 55,320 0.09 8 inch 1.00% 0.12 0.18 2.00(MAIN CONNECTION TO MAIN AT MH-58)
P-95 MH-97 MH-98 3.1 8 24 24 80 1,939 4.00 7,756 0.01 8 inch 5.89% 0.03 0.05 2.05P-96 MH-98 MH-99 3.1 10 31 183 80 14,676 4.00 58,703 0.09 8 inch 2.10% 0.10 0.15 2.64P-97 MH-99 MH-96 3.5 2 7 190 80 15,186 4.00 60,743 0.09 10 inch 4.06% 0.08 0.10 3.27(MAIN CONNECTION TO MAIN AT MH-96)
P-200 MH-200 MH-98 3.1 8 25 25 80 1,977 4.00 7,908 0.01 8 inch 2.87% 0.04 0.06 1.61(MAIN CONNECTION TO MAIN AT MH-98)
P-98 MH-100 MH-98 2.2 47 104 104 80 8,288 4.00 33,153 0.05 8 inch 3.40% 0.07 0.10 2.64(MAIN CONNECTION TO MAIN AT MH-98)
P-99 MH-101 MH-60 2.2 123 270 270 80 21,600 3.77 81,360 0.13 8 inch 3.59% 0.11 0.16 3.52(MAIN CONNECTION TO MAIN AT MH-60)
P-62 MH-64 MH-59 2.2 47 104 104 80 8,288 4.00 33,153 0.05 8 inch 4.00% 0.07 0.10 2.79(MAIN CONNECTION TO MAIN AT MH-59)
P-72 MH-74 MH-70 1.8 90 162 162 80 12,999 4.00 51,997 0.08 10 inch 3.03% 0.08 0.10 2.81(MAIN CONNECTION TO MAIN AT MH-70)
P-71 MH-73 MH-69 1.8 68 122 122 80 9,746 4.00 38,984 0.06 8 inch 2.79% 0.08 0.12 2.58(MAIN CONNECTION TO MAIN AT MH-69)
L:\PROJECTS\0423\Admin\Sewer Study Calcs\08-18-14 Submittal Calc's\\SEWER STUDY SUMMARY 08-18-14.xls SUMMARY

SHEET: 5 of 5DATE: AUGUST 2014
PTS. NO.: 67643WORK ORDER NO.: 42-2637
1 Peaking factor interpolated by SEWERCAD program based on City of San Diego 2004 Sewer Design Guide, Figure 1-1.
LINE FROM TO POPULATION PER DU
IN-LINE DU'S
SEWAGE PER CAPITA/DAY
AVG. DRY WEATHER
FLOW
DRY WEATHER PEAKING FACTOR1
LINE SIZE (D)
DESIGN SLOPE
NORMAL DEPTH dn
dn/D VELOCITY (fps)
REMARKS
IN-LINECUMULATIVE
TOTAL (gpd) (gpd) (gpd) (cfs) (inches) (%) (feet)
POPULATION SERVED
SEWER STUDY SUMMARYStone Creek Tentative Map No. 208328
PEAK DRY WEATHER FLOW
P-70 MH-72 MH-68 1.8 111 199 199 80 15,900 4.00 63,599 0.10 8 inch 2.85% 0.10 0.15 3.01(MAIN CONNECTION TO MAIN AT MH-68)
P-201 MH-201 MH-66 2.2 51 112 112 80 8,940 4.00 35,760 0.06 10 inch 5.58% 0.06 0.07 3.11(MAIN CONNECTION TO MAIN AT MH-66)
P-81 MH-83 MH-84 2.2 109 240 240 80 19,186 3.87 74,196 0.12 10 inch 7.87% 0.08 0.09 4.37P-82 MH-84 MH-78 2.2 0 0 240 80 19,186 3.87 74,196 0.12 10 inch 12.00% 0.07 0.09 5.06(MAIN CONNECTION TO MAIN AT MH-78)
P-83 MH-85 MH-86 1.5 99 149 149 80 11,910 4.00 47,638 0.07 8 inch 7.60% 0.07 0.10 3.90P-84 MH-86 MH-79 1.5 99 149 298 80 23,819 3.67 87,516 0.14 8 inch 10.74% 0.08 0.13 5.28(MAIN CONNECTION TO MAIN AT MH-79)
P-85 MH-87 MH-81 1.8 218 393 393 80 31,442 3.36 105,539 0.16 8 inch 5.22% 0.11 0.17 4.33(MAIN CONNECTION TO MAIN AT MH-81)
L:\PROJECTS\0423\Admin\Sewer Study Calcs\08-18-14 Submittal Calc's\\SEWER STUDY SUMMARY 08-18-14.xls SUMMARY

APPENDIX B
MANHOLE REPORT

SHEET: 1 of 3DATE: AUGUST 2014
PTS. NO.: 67643WORK ORDER NO.: 42-2637
Label Rim Elevation (ft) Sump Elevation (ft) Depth (ft)Invert In Elevation 1
(ft)Invert In Elevation 2
(ft)Invert In Elevation 3
(ft)Invert Out Elevation
(ft) RemarksMH-1 417.30 409.30 8.00 N/A N/A N/A 409.30MH-2 406.56 398.71 7.85 398.71 N/A N/A 398.71MH-3 394.00 379.25 14.75 379.25 N/A N/A 379.25MH-4 391.07 377.20 13.87 377.20 377.20 N/A 377.20MH-5 386.04 373.63 12.41 373.63 373.63 N/A 373.63MH-6 381.45 369.21 12.24 369.21 N/A N/A 369.21MH-7 376.63 365.00 11.63 365.00 N/A N/A 365.00MH-8 372.14 361.00 11.14 361.00 N/A N/A 361.00MH-9 368.11 357.20 10.91 357.20 N/A N/A 357.20MH-10 364.00 353.21 10.79 353.21 353.21 N/A 353.21MH-11 361.45 347.20 14.25 347.20 N/A N/A 347.20MH-12 363.20 343.70 19.50 343.70 N/A N/A 343.70MH-13 361.66 340.72 20.94 340.72 N/A N/A 340.72MH-14 353.27 336.77 16.50 336.77 336.77 N/A 336.77MH-15 345.37 333.67 11.70 333.67 N/A N/A 333.67MH-16 415.28 406.06 9.22 N/A N/A N/A 406.06MH-17 414.52 402.06 12.46 402.06 402.06 N/A 402.06MH-18 416.35 408.50 7.85 N/A N/A N/A 408.50MH-19 406.45 396.82 9.63 396.82 N/A N/A 396.82MH-20 397.21 389.36 7.85 389.36 N/A N/A 389.36MH-21 400.15 387.56 12.59 387.56 N/A N/A 387.56MH-22 402.65 383.67 18.98 383.67 383.67 N/A 383.67MH-24 397.70 386.00 11.70 N/A N/A N/A 386.00MH-25 396.61 385.00 11.61 385.00 N/A N/A 385.00MH-26 392.18 383.91 8.27 N/A N/A N/A 383.91MH-27 389.45 381.16 8.29 381.16 N/A N/A 381.16MH-28 388.02 379.41 8.61 379.41 N/A N/A 379.41MH-29 366.48 358.24 8.24 N/A N/A N/A 358.24MH-30 362.31 354.46 7.85 N/A N/A N/A 354.46MH-31 363.67 351.76 11.91 351.76 N/A N/A 351.76MH-32 361.12 347.83 13.29 347.83 347.83 N/A 347.83MH-33 353.78 340.63 13.15 340.63 N/A N/A 340.63MH-34 410.91 402.48 8.43 N/A N/A N/A 402.48MH-35 407.17 398.14 9.03 398.14 N/A N/A 398.14MH-36 401.49 392.84 8.65 392.84 N/A N/A 392.84MH-37 393.77 383.32 10.45 383.32 N/A N/A 383.32MH-38 379.92 369.00 10.92 369.00 N/A N/A 369.00MH-39 373.42 357.40 16.02 357.40 357.40 357.40 357.40MH-40 385.58 377.70 7.88 N/A N/A N/A 377.70MH-41 391.56 375.65 15.91 375.65 N/A N/A 375.65MH-42 387.04 373.48 13.56 373.48 N/A N/A 373.48MH-43 382.24 371.13 11.11 371.13 N/A N/A 371.13
MANHOLE REPORTStone Creek Tentative Map No. 208328
L:\Projects\04-23\Admin\Sewer Study Calcs\08-18-14 Submittal Calc's\SEWER STUDY SUMMARY 08-18-14.xls MANHOLE REPORT

SHEET: 2 of 3DATE: AUGUST 2014
PTS. NO.: 67643WORK ORDER NO.: 42-2637
Label Rim Elevation (ft) Sump Elevation (ft) Depth (ft)Invert In Elevation 1
(ft)Invert In Elevation 2
(ft)Invert In Elevation 3
(ft)Invert Out Elevation
(ft) Remarks
MANHOLE REPORTStone Creek Tentative Map No. 208328
MH-44 377.86 368.57 9.29 368.57 N/A N/A 368.57MH-45 374.62 365.50 9.12 365.50 N/A N/A 365.50MH-46 374.11 360.30 13.81 N/A N/A N/A 360.30MH-105 396.05 388.21 7.84 N/A N/A N/A 388.21MH-106 395.96 386.85 9.11 386.85 N/A N/A 386.85MH-107 395.46 386.00 9.46 386.00 N/A N/A 386.00MH-108 391.49 382.64 8.85 382.64 N/A N/A 382.64MH-109 387.13 378.44 8.69 378.44 N/A N/A 378.44MH-110 383.22 374.46 8.76 374.46 N/A N/A 374.46MH-111 379.49 370.07 9.42 370.07 N/A N/A 370.07MH-112 379.64 367.77 11.87 367.77 367.77 N/A 367.77MH-113 381.59 365.49 16.10 365.49 N/A N/A 365.49MH-114 386.00 360.83 25.17 361.16 N/A N/A 360.83MH-115 378.19 369.69 8.50 N/A N/A N/A 369.69MH-116 378.81 368.60 10.21 368.60 N/A N/A 368.60
MH-50 392.50 384.50 8.00 N/A N/A N/A 384.50MH-51 381.36 370.04 11.32 370.04 N/A N/A 370.04MH-52 378.26 369.00 9.26 369.00 N/A N/A 369.00MH-53 370.39 361.28 9.11 361.28 N/A N/A 361.28MH-54 368.60 358.48 10.12 358.48 N/A N/A 358.48MH-55 365.12 356.75 8.37 356.75 N/A N/A 356.75MH-56 364.09 354.17 9.92 354.17 N/A N/A 354.17MH-57 363.07 350.45 12.62 350.45 N/A N/A 350.45MH-58 361.90 348.60 13.30 348.60 348.60 N/A 348.60MH-59 353.41 342.00 11.41 342.00 342.00 N/A 342.00MH-60 340.09 328.00 12.09 328.00 328.00 328.00 328.00MH-61 329.66 315.17 14.49 315.17 N/A N/A 315.17MH-62 329.80 314.00 15.80 314.00 314.00 N/A 314.00MH-64 354.75 346.00 8.75 N/A N/A N/A 346.00MH-65 397.58 389.88 7.70 N/A N/A N/A 389.88MH-66 401.61 386.68 14.93 386.68 386.68 N/A 386.68MH-67 386.39 376.08 10.31 376.08 N/A N/A 376.08MH-68 378.14 367.50 10.64 367.50 367.50 N/A 367.50MH-69 366.80 356.50 10.30 356.50 356.50 N/A 356.50MH-70 357.86 347.20 10.66 347.20 347.20 N/A 347.20MH-71 349.85 336.95 12.90 336.95 336.95 N/A 336.95MH-72 379.87 372.20 7.67 N/A N/A N/A 372.20MH-73 368.10 360.40 7.70 N/A N/A N/A 360.40MH-74 361.27 351.26 10.01 N/A N/A N/A 351.26MH-75 382.06 371.50 10.56 N/A N/A N/A 371.50MH-76 377.81 366.50 11.31 366.50 N/A N/A 366.50
L:\Projects\04-23\Admin\Sewer Study Calcs\08-18-14 Submittal Calc's\SEWER STUDY SUMMARY 08-18-14.xls MANHOLE REPORT

SHEET: 3 of 3DATE: AUGUST 2014
PTS. NO.: 67643WORK ORDER NO.: 42-2637
Label Rim Elevation (ft) Sump Elevation (ft) Depth (ft)Invert In Elevation 1
(ft)Invert In Elevation 2
(ft)Invert In Elevation 3
(ft)Invert Out Elevation
(ft) Remarks
MANHOLE REPORTStone Creek Tentative Map No. 208328
MH-77 369.79 359.47 10.32 359.47 N/A N/A 359.47MH-78 370.71 357.42 13.29 357.42 357.42 N/A 357.42MH-79 368.62 351.80 16.82 351.80 351.80 N/A 351.80MH-80 363.41 348.06 15.35 348.06 N/A N/A 348.06MH-81 361.05 346.19 14.86 346.19 346.19 N/A 346.19MH-82 350.83 337.80 13.03 337.80 N/A N/A 337.80MH-83 393.00 380.80 12.20 N/A N/A N/A 380.80MH-84 372.68 364.98 7.70 364.98 N/A N/A 364.98MH-85 373.50 365.50 8.00 N/A N/A N/A 365.50MH-86 370.80 358.89 11.91 358.89 N/A N/A 358.89MH-87 363.40 354.60 8.80 N/A N/A N/A 354.60MH-88 364.78 357.11 7.67 N/A N/A N/A 357.11MH-89 362.90 352.18 10.72 352.18 N/A N/A 352.18MH-90 364.58 356.13 8.45 N/A N/A N/A 356.13MH-91 360.47 351.00 9.47 351.00 N/A N/A 351.00MH-92 356.00 346.20 9.80 346.20 N/A N/A 346.20MH-93 351.30 340.25 11.05 340.25 N/A N/A 340.25MH-94 349.70 338.90 10.80 338.90 N/A N/A 338.90MH-95 348.72 337.60 11.12 337.60 N/A N/A 337.60MH-96 339.28 328.50 10.78 328.50 328.50 N/A 328.50MH-97 356.00 348.15 7.85 N/A N/A N/A 348.15MH-98 356.07 345.50 10.57 345.50 345.50 345.50 345.50MH-99 347.06 339.06 8.00 339.06 N/A N/A 339.06MH-100 357.00 348.90 8.10 N/A N/A N/A 348.90MH-101 343.35 335.65 7.70 N/A N/A N/A 335.65MH-200 358.00 350.30 7.70 N/A N/A N/A 350.30MH-201 411.74 397.00 14.74 N/A N/A N/A 397.00
L:\Projects\04-23\Admin\Sewer Study Calcs\08-18-14 Submittal Calc's\SEWER STUDY SUMMARY 08-18-14.xls MANHOLE REPORT

APPENDIX C
SEWER DEVIATIONS AMENDMENT #1

City of San DiegoDevelopment Services1222 First Ave., MS-302San Diego, CA 92101(619) 446-5000
Printed on recycled paper. Visit our web site at www.sandiego.gov/development-services.
Upon request, this information is available in alternative formats for persons with disabilities.DS-266 (05-10)
Deviation From Standards
FORM
DS-266May 2010
Drawing Number: ____________________ Project Number: _________________
Project Description/Location:
Engineer of Work: ____________________________ RCE No. _______________ (Print Name)
____________________________________ _____________________ (Signature) (Date)
I.O. No: _____________________
Place Rce StamP HeRe
Description of Deviation:
Reason for Deviation:
Mitigation Measures for Deviation:
Reviewed By: ________________________________ Date: _________________
Approved By:Deputy City Engineer: ________________________ Date: _________________
Deputy Director: _____________________________ Date: _________________
Place Rce StamP HeRe
tmugane
Typewritten Text
tmugane
Highlight
tmugane
Tom's Signature
rbaker
Tom RCE


APPENDIX D
SEWER EXHIBITS AMENDMENT #1