SEWAGE SYSTEM SOLUTIONS Current Issues in Ontario & Case Studies of Innovative Approaches to Remedy...
49
SEWAGE SYSTEM SOLUTIONS Current Issues in Ontario & Case Studies of Innovative Approaches to Remedy Failing Systems Marie-Christine Bélanger Rick Esselment Director Vice-President Ontario Onsite Wastewater Association Ontario Onsite Wastewater Association October 7 th 2013 Hamilton, Ontario
-
Upload
lee-merritt -
Category
Documents
-
view
213 -
download
0
Transcript of SEWAGE SYSTEM SOLUTIONS Current Issues in Ontario & Case Studies of Innovative Approaches to Remedy...

SEWAGE SYSTEM SOLUTIONS Current Issues in Ontario & Case Studies of Innovative Approachesto Remedy Failing Systems
Marie-Christine Bélanger Rick EsselmentDirector Vice-PresidentOntario Onsite Wastewater Association Ontario Onsite Wastewater Association
October 7th 2013Hamilton, Ontario

Content
Introduction Onsite sewage treatment Some statistics Problems encountered in the field Solutions Other jurisdiction – Case studies

Introduction
The idea of this presentation came after a tour of MMHA and MOE in the province of Qc to meet Qc MOE and the BNQ relative to the adoption of the CAN/BNQ in the OBC Part 8.
To protect and promote the benefits and value of onsite and decentralized wastewater
management through education, improved standards of practice and advocacy
for sound policies across the province

Onsite Sewage Disposal Systems?

Onsite Wastewater Treatment Systems

Some Statistics
0-1 1-22-7
7-15>15
5% 6%5%
70%67%
Failure rate of conventional systems
Ref: USEPA

55% of failures are related to poor maintenance
Conventional systems are not permanent infrastructures, but technologies can be!
Some Statistics
Poor design6%
Poor construction
9%Inaccurate
soil/site assessment
19%
Insufficient maintenance
21%
age > 10 years45%
Causes of Failure
Ref: USEPA

It is time for a change of context

We have an opportunity to do better

Distribution Boxes

If something doesn’t seem quite right…it usually isn’t, so keep looking

What are we waiting for?

What are we waiting for?
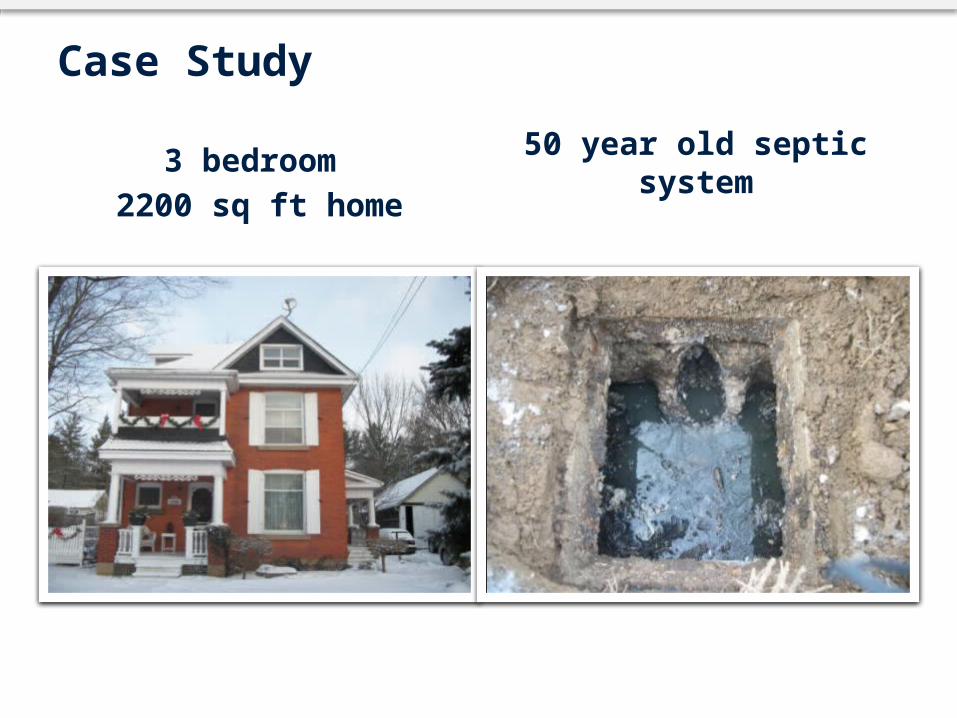
Case Study
3 bedroom
2200 sq ft home50 year old septic system

Challenge
No signs of bed failure
6 m from house to property line
Leaching field in this area
OBC requires 5 m to dwelling and 3 m to property line

Case Study
3 bedroom
1100 sq ft home50 year old septic system

Case Study
Outside of tank no connection to leaching field Septic tank has failed

Challenge
Leaching field is failed
10 m from house to property line
Leaching field in this area
No room for leaching field or mantle

Case Study
3 bedroom
1100 sq ft home 50 year old septic system
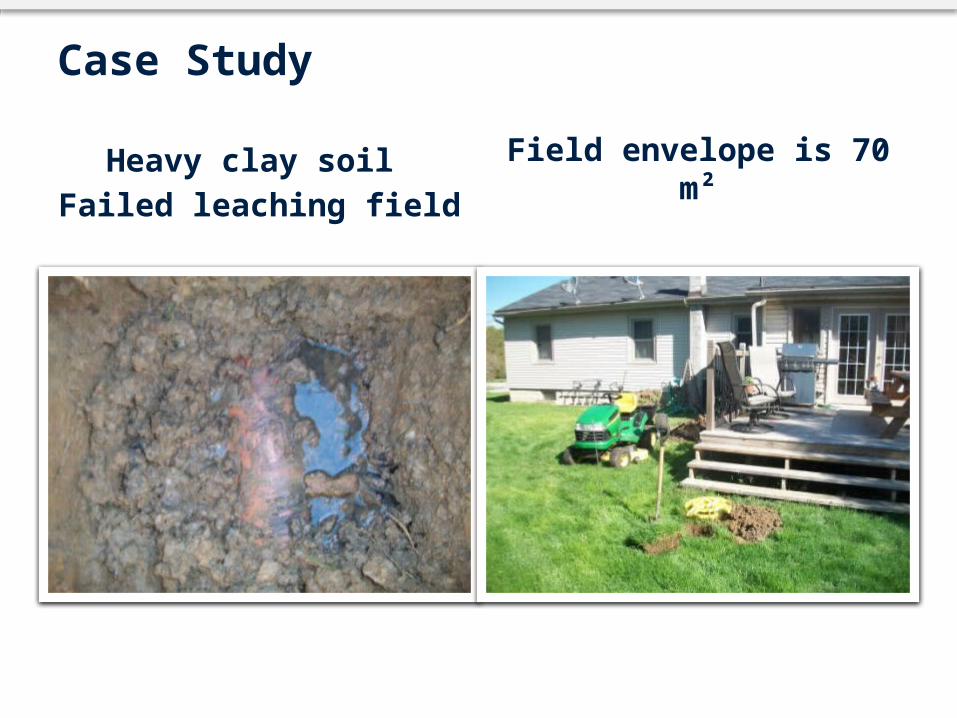
Case Study
Heavy clay soil
Failed leaching field Field envelope is 70 m²

Possible solutions under the current OBC
Holding tanks
Compliance alternatives (OBC 11.5) Same system w/o compliance with horizontal
setbacks Treatment unit with a reduced vertical clearance
and smaller footprint (area bed and shallow buried trenches)

Offering value-added solutions designed to perform and last
Protecting shared water resources
Ensuring a cleaner environment for communities
and families
What should we be seeking?

Case Studies from different jurisdictions
Cluster installation (St-Joseph-de-Kamouraska)
Small lots and sensitive zone (Lac-Beauport)

Case Study #1St-Joseph-de-Kamouraska
Alternative to Conventional Sewer and
Decentralized WWT Cluster Installation

St-Joseph-de-Kamouraska Municipality
Rural municipality in the Lower St-Lawrence region Population: 428 Territory: 86,5 km² Density: 5,1 inhabitants/km2
Case Study #1

Context
80 residences and businesses
(260 inhabitants serviced)
Daily flow: 76 m3
Contaminated individual drinking
water wells (too small lots, failing septic installations)
Shallow bedrock and floodplain
Limited available space near the urbanized perimeter to implement a conventional approach

Cost of a conventional solution consisting of aerated lagoons connected to the municipal sewer system? 2 M$
Rivère-du-Loup river
St-Joseph-de-Kamouraska

Solution
Advanced treatment Biofilter
technology with effluent
discharge into the
Rivière-du-Loup river
15 mg/L in TSS and in BOD5
50 000 CFU/100 ml in FC
Complete installation
1 septic tank with effluent filter per residence small diameter collection system (2,500 linear meters) 5 treatment sites spread out in the municipality for a total of
80 Biofilter units (↓ the costs of the collection system)

Rivère-du-Loup river
St-Joseph-de-Kamouraska
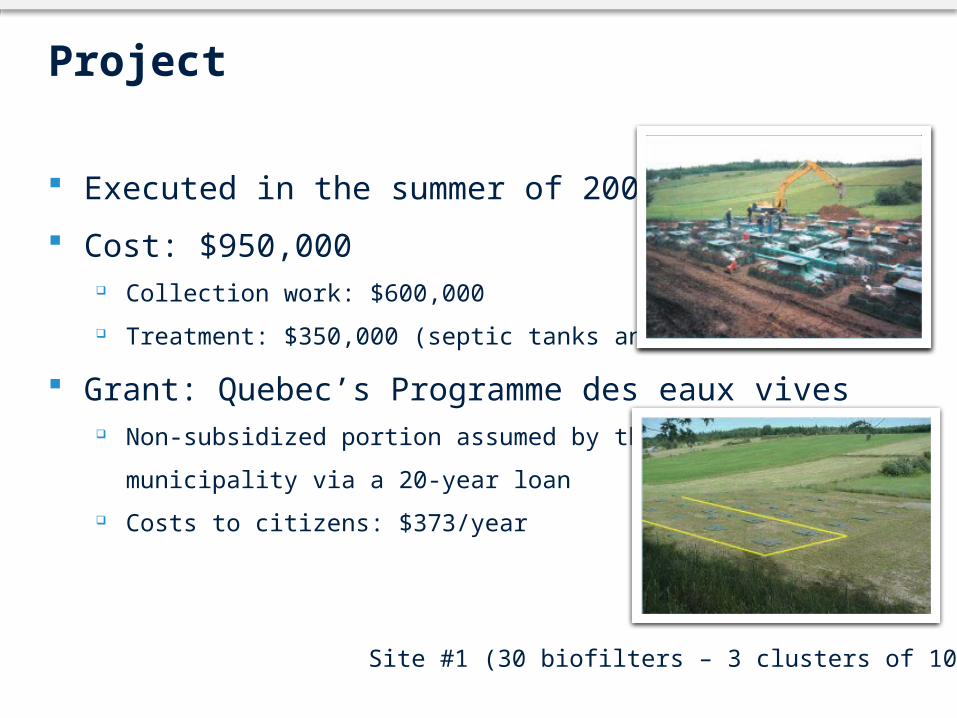
Project
Executed in the summer of 2001
Cost: $950,000 Collection work: $600,000
Treatment: $350,000 (septic tanks and Ecoflos)
Grant: Quebec’s Programme des eaux vives Non-subsidized portion assumed by the
municipality via a 20-year loan
Costs to citizens: $373/year
Site #1 (30 biofilters – 3 clusters of 10 units)

Operations
Operational cost: $300/residence per year
(including filtering media replacement)
Low energy: 450 kWh/month ($30-35/month)
No intervention needed on the network
No water infiltration
Performance
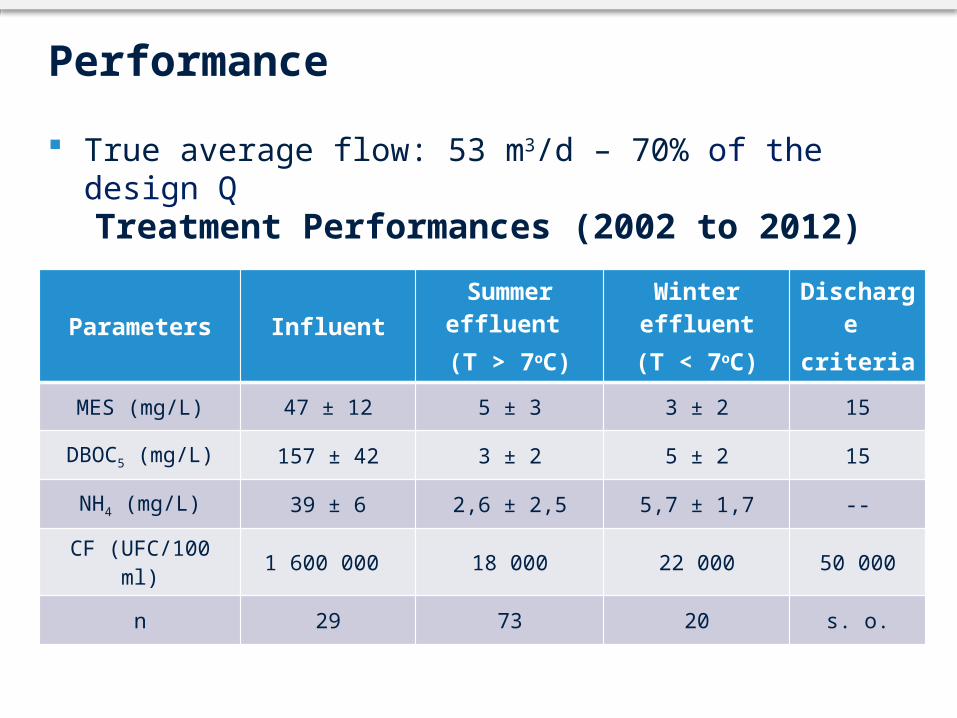
True average flow: 53 m3/d – 70% of the design Q
Parameters InfluentSummer effluent (T > 7oC)
Winter effluent(T < 7oC)
Discharge criteria
MES (mg/L) 47 ± 12 5 ± 3 3 ± 2 15
DBOC5 (mg/L) 157 ± 42 3 ± 2 5 ± 2 15
NH4 (mg/L) 39 ± 6 2,6 ± 2,5 5,7 ± 1,7 --
CF (UFC/100 ml) 1 600 000 18 000 22 000 50 000
n 29 73 20 s. o.
Treatment Performances (2002 to 2012)

Case Study #2Lac-Beauport
Highly Treated Effluent to Allow Direct Surface Discharge

Lac-Beauport
Regional municipality located 20 kilometers from downtown Quebec City
Population: 6145 Territory: 64 km² Density: 98 habitants/km2
Case Study #2

Context
Currently 9 high-value properties, some lakefront, with failing conventional septic systems
Runoff waters to Beauport Lake No possibility of installing a new leaching field on any
of the properties (small lots and shallow rock) – only option was holding tanks
Limited space between residences Older residences with extensive existing landscaping
Context
Quebec regulation only allows holding tanks as a last recourse
Municipality desperate for a different solution –
concerned about impact of holding tanks on property value and the complexity of their maintenance
Quebec regulation allows for direct discharge for septic system conditional to disinfection and/or P removal depending on the sensitivity of the receiving environment
Project started in the Fall of 2012


Solution Phosphorus Removal Unit
with direct surface discharge
to ditch ending in Beauport
Lake
<10 mg/L in TSS and in BOD5
<0.3 mg/L P
<200 CFU/100 ml in FC
Complete installation per residence
1 primary reactor + 1 DpEC Unit + Biofilter + DiUV Bypassed the existing disposal field Modularity allowed for greater flexibility regarding distances
to respect

System Installed
Ptot: 0,4 mg/L Ptot: 0,1 mg/L
Ptot: 0,1 mg/L
Tertiary treatment level BIV, DII, PII

Average Performance
Parameters Septic tank effluent DpEC effluent Ecoflo effluent DiUV effluentTSS (mg/L) 50-90 17 2 2
CBOD5 (mg/L) 120-200 62 2 2P tot (mg/L) 5-14 0.3 0.03 <0.03
FC (UFC/100 mL) 500k-2M 18254 224 <0.3pH 6-9 8.2 7.5 7.5
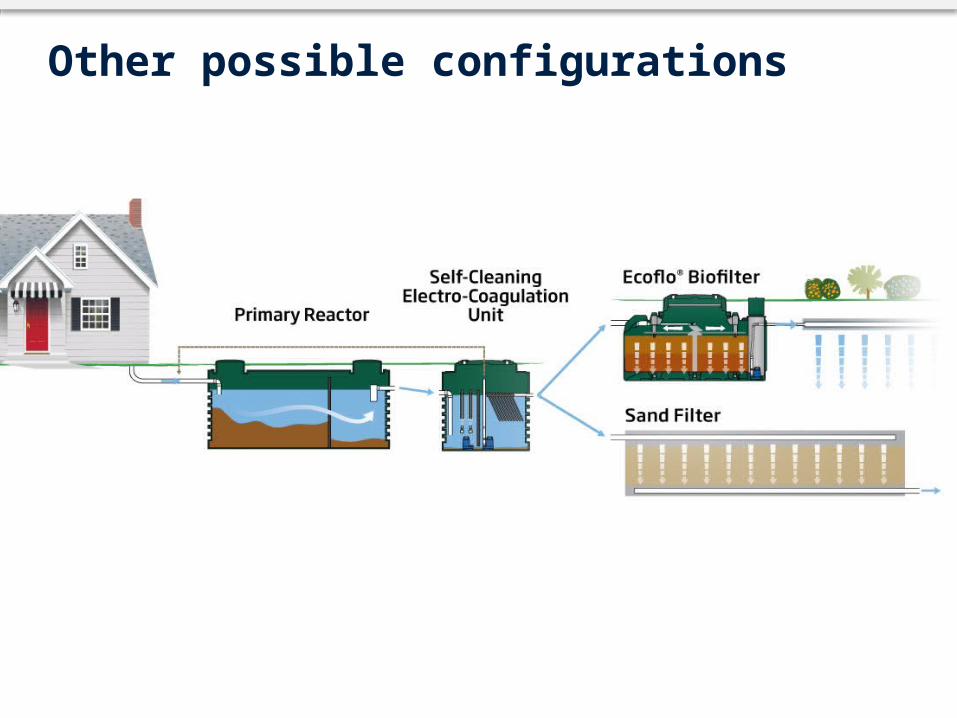
Other possible configurations

System costs
Cost for phosphorus removal unit: $8,995 (Primary reactor and
EC unit)
Excavation work: Average of $10,000
Complete treatment chain: $15,000 (including Biofilter,
phosphorus removal unit and all systems components)

System installed
Light system requiring regular machinery
Single-day installation for each treatment plant

Remediation Costs – Holding Tank
Average cost of septic tank: $3,000
Average cost of excavation work: $2,500
Average cost of pump-outs: $500 to 800 per
pump out/month (to treatment plant)
Holding tank should be a last resource and temporary solution – not a long-term sustainable solution

Electricity and replacement of the aluminum plates
Operation & Maintenance Costs
20$ / month
12$ / month
<10$ / month

Conclusion
Highlight of existing problems and applicable solutions
Need to start talking about how to bring them (problems and solutions) together
Come to OOWA conference to continue the discussion on how to implement these solutions

Thank you!Questions?

Treatment classes
Basic level (B)*
TSS CBOD5
B-I 100 150
B-II 30 25
B-III 15 15
B-IV 10 10
* In mg/L
Treatment Classes
Treatment classes
Disinfection (D)UFC/100 mL
Phosphore (P)
mg/L
Nitrogen (N)
FC ou E. Coli* P total N total
D-I 50 000
D-II 200
D-III ND (median < 10)
P-I 1,0
P-II 0,3
N-I 50%
N-II 75%
Summary of CAN/BNQ Standard