Severe Thunderstorm Forecasting An Overview Jeffry S. Evans Where America’s Weather and Climate...
59
Severe Thunderstorm Forecasting An Overview Jeffry S. Evans Where America’s Weather and Climate Services Begin
-
date post
20-Dec-2015 -
Category
Documents
-
view
223 -
download
5
Transcript of Severe Thunderstorm Forecasting An Overview Jeffry S. Evans Where America’s Weather and Climate...

Severe Thunderstorm ForecastingAn Overview
Jeffry S. Evans
Where America’s Weather and Climate Services Begin

Presentation Goals•Provide overview of convective forecasting.
Philosophy
Physical Processes
Pattern Recognition
Climatology
Parameter Evaluation
SPC perspective
Raise/address questions
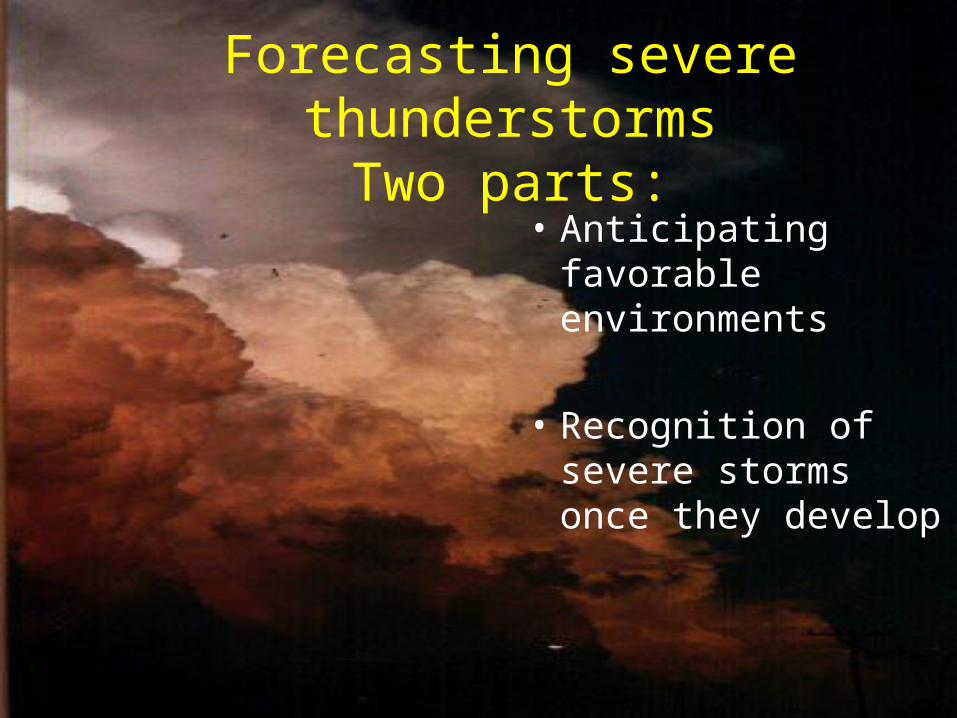
Forecasting severe thunderstormsTwo parts:
• Anticipating favorable environments
• Recognition of severe storms once they develop

Basic Methodologies in Convective Forecasting
1. Physical/Theoretical Understanding of Convective Processesand Forecaster Experience
Change/updated continually
2. Synoptic Pattern Recognition
Conceptual models
3. Climatology
4. Parameter Evaluation (Basic and Derived)
Temperature, dew point, wind, etc Instability, shear, etc.

I. Physical/Theoretical Understanding of Convective Processes
Ingredients for deep moist convection (Doswell, 1987):
1) Moisture 2) Instability 3) Lift

I. Physical/Theoretical Understanding of Convective Processes
• Moisture
• Typically we think about low level moisture (dew point or mixing ratio) residing in boundary layer
• But sources of moisture above the PBL can be associated with elevated convection, and can “mix-down”/moisten PBL with diurnal heating
• Instability
• Temperature lapse rates, boundary layer moisture are major contributors (juxtaposition of steeper lapse rates above moist layer)
• Lift
• A physical mechanism that allows lifted parcel to reach LFC and become positively buoyant (upward vertical motion often on the mesoscale)

Essential issue is whether or not LFC can be reached.
• Moisture, instability and lift all necessary, but each affect convective potential differently.
• This determines “sufficiency” of moisture, instability, lift for any given day.
LFC
LCL


I. Physical/Theoretical Understanding of Convective Processes
• Moisture
• Different mechanisms for changing BL moisture:
• Advection
• Evapotranspiration
• Vertical Mixing
• Measure? – METAR, raobs, satellite sounder PW, GPS PW
• Dew point, Mixing Ratio, RH, etc…
• Observing system does not sample / resolve what is needed to properly “initialize” forecasters, researchers, and NWP
• Model data – reflects strengths /weaknesses of each model as well as observational limitations

I. Physical/Theoretical Understanding of Convective Processes
• Instability
• Observational data – use basic temp/moisture data to compute instability thus incorporates strengths and weaknesses of observing network
• Magnitude of potential instability is related to updraft strength – more is better! (Warm / moist in low levels and cool aloft)
• Lapse rate
• Model data – heavily utilized in forecast process, but physics in models have large impact on accuracy of instability forecasts
• CAPE as an integrated quantity is preferred over LI
• But not all CAPE are created equal (“tall/skinny” vs “short/fat”)
• Choice of lifted parcel can make big difference on magnitude

All CAPE Not Created EqualSame CAPE for both soundings

All CAPE Not Created EqualSame CAPE for both soundings
CAPE alone may not give complete picture!

CAPE definitions(http://www.spc.noaa.gov/misc/acronyms.html)
• MUCAPE: Most unstable CAPE– Lifts most unstable parcel in
lowest 300 mb.– Useful in non-surface based
(elevated) CAPE.
• SBCAPE: Surface-based CAPE– Lift surface parcel.– Usually identical to MUCAPE in
the afternoon.
• MLCAPE: Mean-mixed CAPE– Parcel lifted using mean
temp/moisture (lowest 100mb).
– Most representative for diurnal development when boundary layer is well mixed.

Importance of parcel choice

Importance of parcel choice (cont.)
Choice of parcel depends on time ofday or expectation of lifted parcel.-MUCAPE overnight/early morning.
-MLCAPE afternoon/early evening.

CAPE terminology
MLCAPE
0-1000 J/kg: Weakly/marginally unstable
1000-2500 J/kg: Moderately unstable
2500-4000 J/kg: Very unstable
4000+ J/kg: Extremely unstable

SPC Mesoanalysis page

I. Physical/Theoretical Understanding of Convective Processes
• Lift
• Observational data – unable to directly “observe” lift as mathematical quantity (but clouds reflect sufficient combo of moisture/lift)
• Therefore, the assessment of vertical motion on the synoptic and mesoscale has long been a focused activity for forecasters
• Synoptic scale
• Continuity equation – upper divergence / lower convergence
• Jet streaks, short wave troughs/PVA, thermal advection, CFA
• Mesoscale
• Convergence along fronts and other low level boundaries
• Differential heating, terrain features, convective outflow, etc.
Big Question – Where, when, and how much lift is needed to release instability?

Can we overcome?

Basic Methodologies in Convective Forecasting
1. Physical/Theoretical Understanding of Convective Processesand Forecaster Experience
Change/updated continually
2. Synoptic Pattern Recognition
Conceptual models

II. Pattern Recognition/Forecaster Experience
Classical synoptic-dynamic setting for some severe weather outbreaks (but other patterns are regionally / event dependent)
• Southwest monsoon, northeast U.S., pulse severe, hurricane-tornado, etc.

Pattern Recognition (cont.)
Northwest Flow (Johns 1977) High Plains Upslope (Doswell 1980)
Some atypical severe weather patterns tended to “surprise” many forecasters until specific research studies were conducted

Pattern Recognition (cont.)
• Enables forecaster to focus on areas where favorable “ingredients” come together.– Increasing low level moisture, drying at mid
levels = Increasing cond. instability.– Favorable lift (plus likelihood of initiating
mechanism. Dry line, trough, upslope, etc…)– CAD erosion, coastal low development, etc…Here are a pair of CAD erosion patterns most
common with severe tstm outbreaks:

Cold-Frontal Passage T-00
HL
Cold-Frontal Passage T-24
HL
CAD erosion (Cold-Frontal Passage)
(Borrowed from Wendy Stanton, www.meas.ncsu.edu/nw )
• CAA above cold dome weakens inversion
• PBL Mixing/WAA ahead of front encourages erosion
• Model performance adequate
– provided accurate depiction of cold front passage
– may scour cold dome before forecast FROPA

For instance, the Raleigh tornado of 11/28/88:

00z

06z

Longest track tornado of 1988killed 4 and injured 154.

T-00Coastal Low
L
H
T-24Coastal Low
H
Cyclogenesis near/along wedge front
• Cold advection aloft and increasing WAA near/below inversion level enhances erosion
• Enhanced baroclinicity encourages sfc low development
• Can be prolific severe weather pattern
•Carolina Tornado outbreak ‘84

00z March 27th, 1984
300 mb 500 mb

00z March 28th, 1984
300 mb 500 mb

60 dead, 1268 inj

Basic Methodologies in Convective Forecasting
1. Physical/Theoretical Understanding of Convective Processesand Forecaster Experience
Change/updated continually
2. Synoptic Pattern Recognition
Conceptual models
3. Climatology

III. Climatology
http://www.nssl.noaa.gov/hazard/

Climatology (cont.)
• Can be combined with pattern recognition to increase severe thunderstorm awareness.– Closed off upper low in warm season = funnel
clouds and hail.– Closed off upper low in winter ≠ severe wx.
• Gives confidence to a forecast– Or increases doubt!

Probability of F2 or greater tornado within 25 miles of a point
Week of May 6thWeek of Feb 19th
EXAMPLES:http://www.nssl.noaa.gov/hazard/

Central NCFor example, a y value of 2 would indicate a two percent chance of receiving the chosen type of severe weather on the date indicated by the x-axis value.
Apr. 1st Sept. 21st
May 19th

Apr. 1st Sept. 21st
May 19th
Nov. 10th

Apr. 1st
Nov. 29th

Apr. 1st
July 14th
Sep. 6th

Apr. 1st Sept. 21st
May 19th

Brief summary of climatology for central NC
• Threat of a tornado increases in early Spring and diminishes some late Summer/Fall.
• Threat of sig. tornado more distinct with two maxima: Spring and Fall.– Violent tornado much more likely in early Spring with
second ‘max’ in the late Fall.• Distinct max in wind damage threat during mid
Summer with sharp drop off by late Summer.• Distinct max in large hail during late Spring with
slow decrease in threat through the Summer.

Basic Methodologies in Convective Forecasting
1. Physical/Theoretical Understanding of Convective Processesand Forecaster Experience
Change/updated continually
2. Synoptic Pattern Recognition
Conceptual models
3. Climatology
4. Parameter Evaluation (Basic and Derived)
Temperature, dew point, wind, etc Instability, shear, etc.

IV. Parameter Evaluation‘Old school’ parameters versus their ‘contemporary’ counterparts
OLD:
LI, SI, SWEAT, TT, etc.
NEW:
CAPE, SRH, Effective shear,
0-1km shear, etc.
* Technology and increased understanding allows more meaningful/robust parameters.* These link observable scales to storm- scale (cloud-scale models)

“Keys to the Game”
1)1) Parameters should always Parameters should always relate back to the relate back to the ingredients-based approach ingredients-based approach
(not a magic number game!)(not a magic number game!)
2)2) Need to understand their Need to understand their strengths / limitationsstrengths / limitations
3)3) Atmosphere is not static - Atmosphere is not static - otherwise persistence is all otherwise persistence is all we needwe need

Parameters (cont.)
• Parameters (Ingredients) used to not only assess convective potential, but can aid in severe type.
• Instability, shear and combination of two.
• Will cover a more detailed parameter assessment in a later sessions.

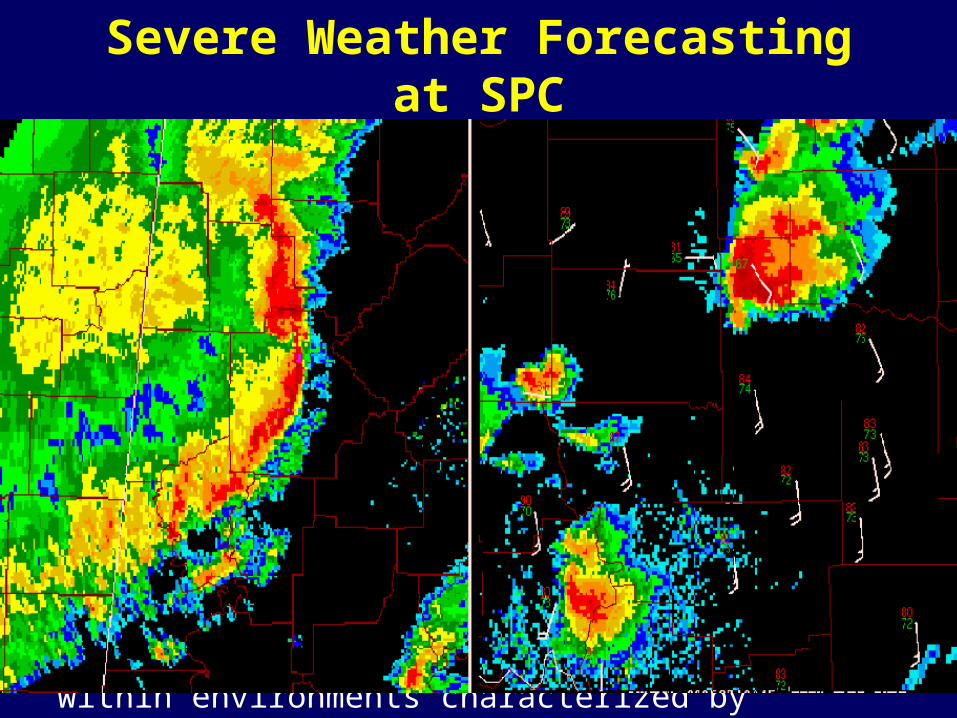
Severe Weather Forecasting at SPC

Severe Weather Forecasting at SPC
• The weather phenomena of interest (thunderstorms and tornadoes) typically occur on scales below those of the standard observational network and operational NWP
• We are most interested in forecasting the development of these phenomena ahead of time
• a difference between “detection” & “prediction”
• we must explore environmental characteristics and determine the association between the stormscale environment and the larger scales we more readily observe

The Link Between Observable Scales and Stormscale is not Necessarily Clear

Manual Chart Analysis• Subjective analysis facilitates our ability to synthesize data from a variety of observational sources
• We are actively engaged with the real atmosphere
• We gain a better perspective of actual environmental conditions
• Our human brain is better than computer algorithms at combining different data sets and forming logical patterns

Map Analysis
• Why do surface analysis?
• Allows hourly updates using highest-density standard observational data available => air mass character, boundaries, short-term continuity
• Permits us to accurately incorporate smaller scale features (convective outflow, sea breeze, etc.) that play a big role in thunderstorm forecasting
• Why do upper air analysis?
• Allows identification of atmospheric patterns, features, and trends that may impact ingredient-based forecasting regimen
• Although model data assimilation systems also incorporate a variety of other data, their primary goal is to produce the best possible NWP forecast
• The “best” initial conditions for a model are usually not the “best” analysis for diagnostic purposes

Example of Eta 00h Analysis

Severe Weather Forecasting at SPC
• In its most basic sense, we ask the following questions:
• Can thunderstorms develop?
• Moisture, instability, lift
• If yes, can the storms become severe?
• Instability, vertical shear
• If yes, what types of threat are possible?
• Tornadoes, damaging winds, large hail
• 3 W’s:
•Where and when are these events possible?
• What is the likelihood of occurrence (quantify uncertainty)
Severe Weather Forecasting at SPC• The most significant severe storms are usually associated with organized storms or convective systems
• Mesoscale Convective Systems (MCS)
• Supercell Thunderstorms
• Significant tornadoes, very large hail, and extreme wind events most often associated with supercells
• Widespread damaging wind events (derechos) most often associated with linear MCSs (embedded bow echoes)
• These types of events usually occur within environments characterized by stronger vertical shear
• But, reports of severe storms are becoming more frequent in weakly sheared environments

Annual Number of Severe Events1970-2000

Factors Contributing to Rapid Increase in Severe Storm Reports
•Implementation of national warning verification program in 1980 (increased accountability and incentive to find reports)
•Development of trained spotter networks (increased likelihood of
correctly observing severe storms)
•Deployment of nationwide NEXRAD network (improved detection
of potentially severe storms)
•Effects of urban growth (more people/structures impacted)
•Increased “weather awareness” (media and government efforts)
•Advances in personal communication (cell phones)

More to Come• Forecast Supercells and Tornadoes (~1 hr)
• Forecasting Severe Hail (~1/2 hr)
• Forecasting Damaging Winds (~1 hr)
• Lunch
• SPC overview/Open discussion

Questions/Comments before we move on?

The End