
Sevenoaks District Transport Study · Sevenoaks Transport Study Evidence base report Appendices ....
104
Sevenoaks Transport Study Evidence base report Appendices
Transcript of Sevenoaks District Transport Study · Sevenoaks Transport Study Evidence base report Appendices ....

Sevenoaks Transport Study Evidence base report Appendices
Appendices
Appendix A Study brief
Appendix B Meeting Notes
Appendix C PESTLE analysis
Appendix D Air Quality Mapping
Appendix E Policy background
Appendix F Community Plan Public Consultation
Appendix G Transport data bank
Appendix H Data review and analysis
Appendix I Literature review of relevant research
Appendix J Smarter Choices
Appendix K Evidence of the benefits of Smarter Choice

A appendix
Appendix A Study brief


B appendix
Appendix B Meeting Notes

JMP CONSULTING TRANSPORT PLANNERS & ENGINEERS AUDREY HOUSE, 16-20 ELY PLACE, LONDON EC1N 6SN T 020 7405 2800 F 020 7430 9049 E [email protected] W www.jmp.co.uk
Minutes of Meeting
JMP Consultants Ltd, Registered Office: Centrum House, 38 Queen Street, Glasgow G1 3DX. Registered in Scotland No. 88006 Birmingham Brighton Bristol Edinburgh Glasgow Leeds Lichfield Liverpool London Manchester Newcastle upon Tyne
B
Job Title Sevenoaks Transport Study
Job Number H070130
Venue Sevenoaks DC Offices
Date 30 January 2007
Present Chair: Cllr Gary Williamson (GW), Councillor for Halstead, Knockholt & Badgers Mount wards Sevenoaks DC: Maggie Williams (MW); Richard Wilson (RW); Matthew Hogben (MH) Transport Planning Kent CC: David Joyner (DJ), Sustainable Transport; Steven Noad (SN), PT; Anne Marie Hannam (AMH) and Bryan Fitzgerald (BF), West Kent Highway Services; Nicky Biddall (NB) and Colin Finch (CF), Countryside Access Improvement/ Public Rights of Way Tandridge DC: John Phillips (JP), Planning Policy Action with Communities in Rural Kent: Trevor Skelton (TS) Arriva Southern Countries: Malcolm Spalding (MS) and Peter Elliot (PE) South Eastern Trains: Mike Gibson (MG), Public Affairs Rail Travellers Associations: Peter Benford (PB) and Dr Roger Johnston (RG), Sevenoaks District; Geoff Meekums (GM), Edenbridge British Horse Society: Alan Tuckwell (AT) JMP Consulting: Lynn Basford (LEB), Project Director; Derek Palmer (DJP), Project Manager; Thomas Derstroff (TD), Transport Planning
Apologies Richard Parry, Kent CC; Cllr Roger Walshe; Sevenoaks Volunteer Bureaux
Distribution JMP internal
Item Action
1 Introduction GW welcomed the stakeholder group and outlined the study background
2 Study purpose JMP (LEB & DJP) introduced the study methodology, purpose and the actions points developed by Sevenoaks DC. RJ requested Air Quality and Quality of Life related issues to be added as action points. It was agreed that the presented list was a draft list which would be extended through the input of the stakeholder meeting and the course of the data research for the transport strategy. Further, more specific points raised were the lack of a vision statement, the importance of parking restrictions and disability access and transport related issues. With regard to a vision statement, it is anticipated that this would be developed as part of the Transport Strategy. In addition the need for motivation to reduce car use and changing transport pricing were mentioned. DJ highlighted the importance of the following Kent CC documents for the study: Kent Vision, Kent Local Transport Plan and Towards 2010. It was suggested that other LAs and London Boroughs be involved.

Meeting Notes Page 2 of 9 31st January 2007
Belfast Brighton Glasgow Leeds Lichfield Liverpool London Manchester Newcastle upon Tyne 2
B
3 Stakeholder statements South Eastern Railway (MG) • Capacity growth is key issue in the area (+ 20% over past years and rising); a
rail travel demand paper is available and will be supplied by RJ • Continuing London economic growth is likely to affect passenger demand in
the future and major developments e.g. Dunton green, would add to demand • Requirement for 12-car service and higher frequency to relief congestion and
cater for demand; also to take further pressure off motorway network (M20, M25); Thameslink 2000 will only have minor relief impact on congestion in Sevenoaks area; as will CTRL
• Further bottlenecks are London termini and the 8 level crossings between Maidstone and London which require speed restrictions. Infrastructure improvements will enable a new Dec 2009 timetable to shorten travel time and attract more passengers from Sevenoaks line.
• Higher passenger demand is also necessary to make line profitable as subsidies decrease towards end of contract (currents subsidies are 140-150m pa)
• Sevenoaks is perceived an attractive P&R station, through high off-street parking pressure and no dedicated P&R facility available.
• Partnership working with Kent CC and Districts is highlighted as requirement for future development. Network Rail was requested as a partner in the stakeholder group to discuss future infrastructure development.
• Southern Trains was highlighted as another rail operator in the Sevenoaks district to be consulted.
Arriva (MS) • Arriva operates 5 routes in the area, 3 of which are economically viable. • Frequency and punctuality emerged as key issues from a passenger survey:
Frequencies of 12min would be preferable; Punctuality in urban areas can only be assured through bus priority measures (Riverhead to Sevenoaks would benefit from bus lane)
• Section 106 contributions are highlighted as measure to kick-start a PT service, but need to be in place with first occupancy, not upon half or full occupancy as often agreed to.
• Financial implications of free 60+ fares and free child fare trials impacting on peak period occupancy are highlighted
• The introduction of low-floor bus design throughout the fleet are further improvements scheduled (Route 215 currently not low-floor)
• Partnership working and synchronisation of bus and rail operator timetables is also highlighted as a potential for improvement
• PlusBus should be introduced as a fare add-on to the rail ticket to allow for unlimited bus travel. Tonbridge and Tunbridge Wells already offer this ticket; Sevenoaks will require an improved route network to justify this ticket.
• 90% reliability is achieved but punctuality is lower, especially later in day Kent CC Highways (AMH & BF) • AMH is responsible for the Thamesside area and has input into their
transport strategy , BF is responsible for the Sevenoaks area; there is a good data base on transport issues: “Contact Centre”; surveys are undertaken by Jacobs Consultancy
Public Rights of Way (CF & NB) • Sevenoaks is considered very accessible and attractive with tourists and
walking groups for a wide network of public rights of way, in particular in the town centre.
PT (SN) • A sparse population outside the main centres requires high subsidies on PT;
RJ

Meeting Notes Page 3 of 9 31st January 2007
Belfast Brighton Glasgow Leeds Lichfield Liverpool London Manchester Newcastle upon Tyne 3
B
Dial-A-Ride is considered a viable alternative, as trialled in Swanley; should be considered for Sevenoaks
• Real-time travel information would be useful, but requires a high capital investment; 14 sets of infrastructure were already financed through LTP funding, but the radio signals necessary could not be introduced due to lack of funding
• On a simpler level, useful signs, or real-time bus information at the station could improve the situation
Sustainable Travel (DJ) • Free age 16-17 trial in Canterbury and Tunbridge Wells have proved
successful in attracting patronage • Quality Bus Partnerships are useful instrument to encourage investment from
all parties, but have not been introduced in Sevenoaks yet; “Punctuality Improvement Partnerships” trials should be tried; High number of travel plan in place already (targets of 40% school TPs have been met in Kent – 50% of secondary & 25% primary schools in SDC, Sevenoaks DC TP in development); 50 schools signed up to Walking Buses; Car Sharing (200 members, 15 employers) and Car Clubs (pilots) have been initiated; cycling is of high priority in Kent due to the Tour de France arrival in summer 2007. ; Park&Ride is considered for a number of rail stations
Sevenoaks DC Highways (RW) • There are 900 registered users of the DRT service (using 9 minibuses); taxis
are also highlight as a key contributor to the PT service. Air Quality (RW) • 10 AQMA introduced already, with 4 to be added this summer; 4 falls within a
motorway section, the remaining 6 are problematic with regard to congestion on KCC roads
Following the stakeholder statements, the group were split into two to discuss individual issues related to transport in the Sevenoaks District:
4 Group Discussion A (Derek Palmer) David Joyner (DJ); Anne Marie Hannam (AMH); Colin Finch (CF); Trevor Skelton (TS); Peter Elliot (PE); Mike Gibson (MG); Alan Tuckwell (AT); Peter Benford (PB) Issues identified Rail • Overcrowding on Sevenoaks-London rail services/ Rail capacity does not
meet demand • Lack of appropriate road link Sevenoaks-London • High costs of PT • Poor links to Gatwick Bus • Lack of bus services due to rural nature/ Poor bus services to rural areas/
Poor bus links to station • Lack of a car is a problem especially for the elderly • Poor east-west links by PT Cycling • Lack of cycle tracks along roads/ No cycling routes in Sevenoaks Road infrastructure/ car use • Poor access off motorway network to Sevenoaks • Increase car use = congestion and reduced air quality • Gridlock & parking for residents & commuters • Car use for J2W is low due to rail use to London

Meeting Notes Page 4 of 9 31st January 2007
Belfast Brighton Glasgow Leeds Lichfield Liverpool London Manchester Newcastle upon Tyne 4
B
• Too much commuter parking in Sevenoaks; sticks vs carrots; currently only car-restrictive measures in place, but improvements to PT are necessary/ high dependence of private car – no incentive to discourage use of private car/ lack of ‘punitive’ measures’ to discourage car use; ‘stick’ needed as well as ‘carrot’
Land use • Lack of high density population centres to enable viable bus services • Access to services for rural residents, particularly young people • Rural accessibility to main town Other • Shortage of labour; no willingness for shift work or work facing the public;
marginal costs of evening and weekend bus services is bound to rise over next 20 years
• Understanding Awareness Action • Pollution & global warming pressures • New developments in line with sustainable transport principles & funding • Cost of PT exceeds that of car use in real terms Opportunities identified • Home working to decrease demand for travel • Free PT/ bus travel • PT funding • Need to link P&R to station • AONB – constraints on development opportunities • High density development to enable PT • New ticketing procedures • Housing pressure and 2 major developments in Dunton Green & Fort
Halstead are opportunities • Higher development and density may reduce subsidies • Alternative PT provision • New RTI unlikely to increase PT use Priorities defined • Non-car barriers; reducing travel demand through development location;
travel awareness (all 6 votes) • Traffic congestion (2) • Rural access (1) • Alternatives to car use; road safety (0) Synergies identified: travel awareness & non-car barriers; alternatives to car use & traffic congestion; alternatives to car-use & road safety Conflicts identified: alternatives to car use & rural access Actions suggested • Wider matters should be considered • Political will needed • Rural economy is important • Demand management • Parking restrictions to raise money, not transport policy (& road safety), e.g.
RPG2 • Recreational demands • Access for all • Ageing population will result in increased PT demand • Carrots & sticks must synergise • Cycling data from SUSTRANS should be used

Meeting Notes Page 5 of 9 31st January 2007
Belfast Brighton Glasgow Leeds Lichfield Liverpool London Manchester Newcastle upon Tyne 5
B
5 Group Discussion B (Lynn Basford) Steven Noad (SN); Bryan Fitzgerald (BF); Nicky Biddall (NB); John Phillips (JP); Malcolm Spalding (MS); Dr Roger Johnston (RG); Geoff Meekums (GM) Issues identified PT general • Sustainable rural transport • Need to meet needs of users for non-car based travel • Intermodal interchange at Sevenoaks Rail • Improve service on Redhill-Tonbridge railway line (benefits for Kent & Surrey
residents); also to improve services to and from Gatwick airport • Edenbridge service is now overcrowded due to rapidly increased demand
and a lack of rolling stock (TOC Southern Railways “plays the near to the end of Franchise card”)/ Much improved service but Southern Railways does not respond to local needs/ Good(ish) train service to Edenbridge
• Poor rail services to/ from Maidstone (County town & Crown Court) Bus • Riverhead congestion leading to un-reliable bus services • General low levels of PT/ high population needed for profitable operation of
local buses • Poor Edenbridge area local services/ Poor buses in Edenbridge • Express bus services Guildford Maidstone (Sevenoaks, Oxted, Redhill,
Dorking) to relieve M25 congestion Cycling • Lack of cycle tracks Walking/ accessibility • Pedestrian movements without conflict with vehicles (urban areas:
Sevenoaks, Swanley, Edenbridge) • Mobility impaired access (urban areas: Sevenoaks, Swanley, Edenbridge) Road infrastructure/ car use • M25/ A210 road link – 20 year horizon • Lack of M25 junction • Lack of rail car park spaces • On-street parking Sevenoaks town centre & Knockholt station • Road congestion & on-street parking around stations • Riverhead corridor traffic congestion • M25 junction congestion Land use • Dunton Green Cold Store (500 units) have adverse impact on local transport
& congestion • Better interconnectivity between PT & leisure facilities Other • Lack of integrated information/ promotion of PT services to access leisure
facilities/ improvement & promotion of information on walks/ rides • Perception of traffic speeds/ road safety/ injury crashes (in Sevenoaks,
Swanley and district-wide inc village) • Riverhead corridor air quality Opportunities/ Pressures Development/ Economics • Dunton Cold Store (500 residential/ mixed dwellings) • The Fort (1,500 dwellings) • Swanley town centre (transport links, parking) • Edenbridge secondary school development • ‘Piecemeal’ development Edenbridge (old industrial) • Green Belt? – South East Plan housing allocation

Meeting Notes Page 6 of 9 31st January 2007
Belfast Brighton Glasgow Leeds Lichfield Liverpool London Manchester Newcastle upon Tyne 6
B
• Sevenoaks not necessarily defined as a growth area itself, but sandwiched between growth areas
Technology • Working from home (Broadband coverage) • Need a change in work patterns Social • 60+ drivers – need to provide transport • Health care access (hospitals, health care centres of excellence) • East-west aspects • Property market is limiting factor – rail is primary enabler on TMS • Longetivity of life • There are service variations between Sevenoaks and other villages in to the
district Priorities defined • Alternatives to car use (6 votes) • Reducing travel demand through development location; travel awareness
(both 4) • Environmental aspects (2) • Non-car barrier; traffic congestion, road safety, rural accessibility, disability
issues (all 1) • Quality of life (0)
6 Summaries The outcomes from the individual discussions were summarised as follows: Group A (Derek Palmer) • A high number of comments shared with group B. • Social aspects and health aspects • Barrier to non-car modes, travel demand management through development
location and travel awareness were the most prioritised actions Group B (Lynn Basford) • A high number of shared comments with group A. Non-location specific
comments were given • Cycling is a neglected mode • London economy and the dependence on it is a key driver that should be
recognised • Public funding, demand management and parking are highlighted as an
important issue • Home working is an opportunity to reduce need to travel • The use of a ‘carrot-and-stick’ policy is recommended • Actions mostly selected are alternatives to the car, development locations
and travel awareness All stakeholder group members were provided with a data proforma to inform the study team of relevant data held. Forms should be returned to MH.
7 Next Meeting and closure of meeting The second Stakeholder Group meeting was agreed for 26 March 2007, 10:30 – 13:00. There were no further comments and the meeting closed.

JMP CONSULTING TRANSPORT PLANNERS & ENGINEERS AUDREY HOUSE, 16-20 ELY PLACE, LONDON EC1N 6SN T 020 7405 2800 F 020 7430 9049 E [email protected] W www.jmp.co.uk
Minutes of Meeting
JMP Consultants Ltd, Registered Office: Centrum House, 38 Queen Street, Glasgow G1 3DX. Registered in Scotland No. 88006 Birmingham Brighton Bristol Edinburgh Glasgow Leeds Lichfield Liverpool London Manchester Newcastle upon Tyne
B
Job Title Sevenoaks Transport Study
Job Number H070130
Venue Sevenoaks DC Offices
Date 26 March 2007
Present Chair: Cllr Gary Williamson (GW) Sevenoaks DC: Matthew Hogben (MH) Transport Planning Kent CC: Anne Marie Hannam (AMH) Bryan Fitzgerald (BF), West Kent Highway Services; Richard Parry (RP); Colin Finch (CF), Countryside Access Improvement/ Public Rights of Way Tandridge DC: John Phillips (JP), Planning Policy Action with Communities in Rural Kent: Trevor Skelton (TS) South Eastern Trains: Mike Gibson (MG), Public Affairs Rail Travellers Associations: Dr Roger Johnston (RG), Sevenoaks District; Geoff Meekums (GM), Edenbridge British Horse Society: Alan Tuckwell (AT) JMP Consulting: Derek Palmer (DJP), Project Manager; Thomas Derstroff (TD), Transport Planning
Apologies David Joyner (DJ), Nicky Biddall (NB), Richard Wilson (RW), Maggie Williams (MW), Malcolm Spalding (MS)
Distribution As above
Item Action
8 Introductions • GW welcomes the attendees and following the introductions, the meeting is
handed to DJP to report on the initial findings of the Sevenoaks Transport Study
9 Presentation by JMP • DJP presented the study findings which led into a PESTLE analysis exercise
with the stakeholders • The initial comparison of the study team’s PESTLE with that by the
stakeholders revealed very similar rankings of the eight action points discussed, in particular the most important issues: Action Point 6; travel awareness, and Action Point 3: reducing congestion through traffic management. A detailed analysis will be carried out and feed into the production of the final report.
• The differences in a higher ranking given to the environment by the delegates and a lower ranking for safety was explained by local knowledge and the subjectiveness of safety, which cannot be demonstrated by the availability of statistics
JMP

Meeting Notes Page 8 of 9 31st January 2007
Belfast Brighton Glasgow Leeds Lichfield Liverpool London Manchester Newcastle upon Tyne 8
B
10 Discussion PT funding • The importance of involvement of SUSTRANS due to extensive available
funds and need for improvement was highlighted; measures for other modes are expected to be funded largely from other public sources
• The opportunity of S106 funding was discussed and it was agreed that a plan needs to be in place about which streams S106 contributions should be channelled into
• There is a need to discuss with existing, potentially large employers, the possibilities of co-funding sustainable transport schemes and point out the financial benefits to employers
• Large estates and accessibility to and from the town centres is a key theme to be covered by an increasing number of Area Travel Plans
• Commuting to Sevenoaks needs to be assessed separately in three groups:
• P&R commuters using Sevenoaks as a train station to London during peak hours with good but crowded train services, but no bus connections
• Commuters/ pupils (school travel contracts are very attractive to bus operators) with destination within Sevenoaks during peak hours
• Shopping during off-peak hours • Quality Bus Partnerships (Kent CC/ bus operators) were identified as of great
potential • Cycle parking at Sevenoaks rail station is growing and needs coordination
with rail operators (JP); parking has increased with the abolishment of cycle transport on peak hour trains (MG)
Barriers to Smarter Choices • Political resistance to Smarter Choices which are often considered anti-car
(AMH) • Funding was identified a key issue as Council Tax increases are politically
difficult • An information gap on Public Transport was identified in order to increase
demand - more partnership working was needed, technical requirements to be solved, self-promotion of bus operators needs improvement (RJ)
• Mode integration was raised as an opportunity for improvement; morning and evening bus services need improvement, linking into the rail timetable; more flexible work patterns require more flexible timetables (RJ)
• DRT was raised as an opportunity Stakeholder consultation • Stakeholders suggested:
• PT operators & users • Adjoining Councils • Parish Councils • Kent CC Highway, PROW, transport • Schools • SDC and Kent CC planners
• Research into best practise on LDF development from other Councils was
suggested • Current DRT and voluntary services run by Kent CC should be better
marketed and expanded (RP); however the difficulty of making a initially publicly subsidised service commercially viable over time was pointed out (RJ)
JMP SDC SDC SDC SDC SDC SDC

Meeting Notes Page 9 of 9 31st January 2007
Belfast Brighton Glasgow Leeds Lichfield Liverpool London Manchester Newcastle upon Tyne 9
B
Strategy vision • 80% housing on windfall sites require estimate of housing development,
especially for known larger sites • West Kent Cold Store development needs to be addressed as part of the
Strategy development process to ensure public transport is built in - planning timetabling is a long term process
• Existing development need addressing (residential, education, health access) • Run times of rail franchises need to be taken into consideration
11 AOB/ next meeting • Further dates to be notified were
• Next Transport Forum on 4 July • SDC Annual Transport Conference on 23 October
• There was no other business and the meeting closed.

H070130: Sevenoaks Transport Study Ref : Appendix B
B
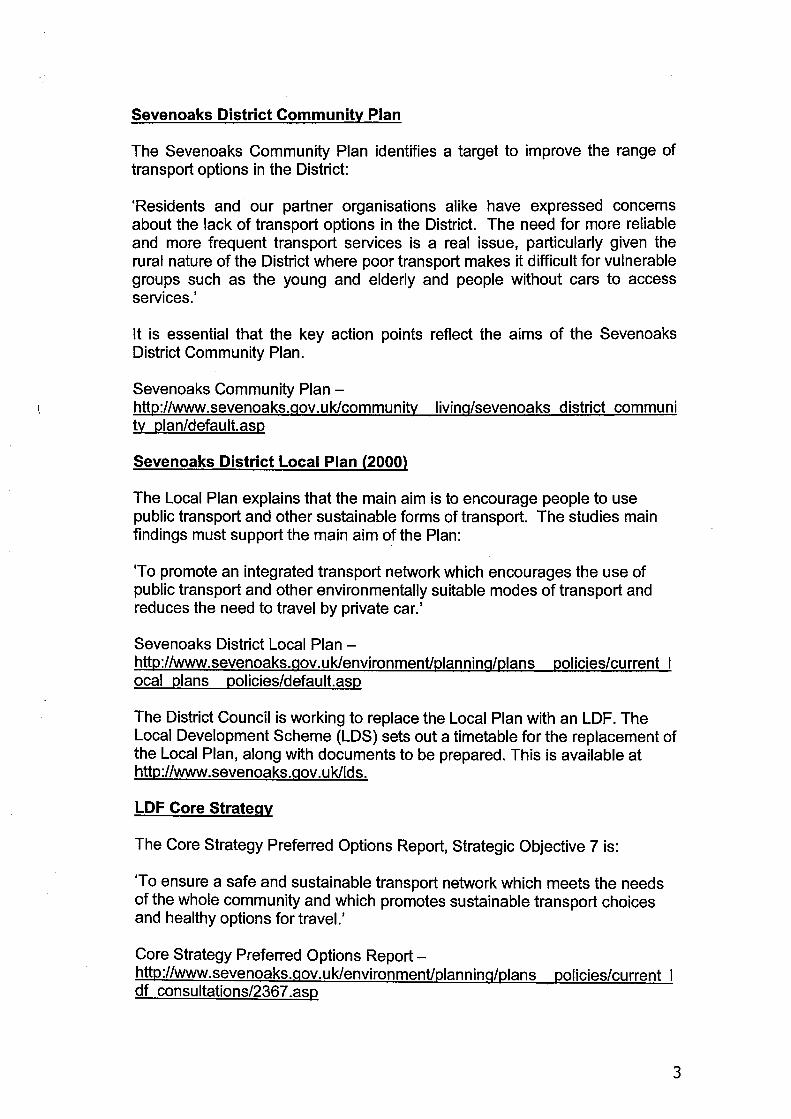
Summary of stakeholders’ views B.1 The importance of social and health aspects of travel behaviour was highlighted. Cycling
was perceived to be a neglected mode in the Sevenoaks District area. The strong London economy and the dependence of the district upon was thought to be a key driver that should be recognised in the study. Public funding, demand management and parking were also highlighted as important issues. Home working was considered to be an opportunity to reduce the need to travel.
B.2 Of the SDC suggested actions those considered to be most popular were:
• Investigating viable alternatives to the car, such as encouraging more journeys by bus, train, cycling and walking, that will improve travel choice;
• Identifying barriers to the take up of alternative forms of transport and recommend actions to address this issue;
• Reducing travel demand by reducing and controlling the number of car journeys made into town centres and locating new development close to good transport links and local facilities to reduce car journeys; and
• Improving travel awareness by encouraging travel plans and partnership working with internal and external stakeholders and transport providers.
B.3 The use of a ‘carrot-and-stick’ policy was recommended by delegates. Carrot-and-stick is
an idiom describing the combination of rewarding desired behaviour and punishing unwanted behaviour. In the sustainable transport context, the sticks are selected from parking restrictions, higher fuel prices, vehicle taxation, car parking charges, road pricing, congestion charging and (more recently) area wide car free zones etc. The carrots are selected from much improved public transport services (in price, frequency, directness, cleanliness, safety, security and reliability), a range of incentives to encourage cycling (bicycles loans and grants, high quality segregated routes, showers and lockers and convenient parking) and car share incentives (computer matching, the ‘best’ car parking places, financial rewards) etc. The forthcoming Sevenoaks Transport Strategy needs to combine an appropriate mix of such interventions.
B.4 The importance of the following Kent CC documents for the study was highlighted: Kent Vision, Kent Local Transport Plan and Towards 2010. It was also suggested that other neighbouring local authorities and London Boroughs be involved.

C appendix
Appendix C PESTLE analysis

H07
0130
: Sev
enoa
ks T
rans
port
Stu
dy
Ref
: A
ppen
dix
C
C
PE
STL
E a
naly
sis
C.1
Th
e st
rate
gy e
nviro
nmen
t –
the
cont
ext
with
in w
hich
the
Sev
enoa
ks T
rans
port
Stra
tegy
is
form
ulat
ed,
asse
ssed
and
rea
lised
– i
nclu
des
all
exte
rnal
fact
ors
that
may
hav
e an
impa
ct o
n th
e st
rate
gy d
evel
opm
ent.
A P
EST
LE a
naly
sis
is d
esig
ned
to h
elp
esta
blis
h th
e po
ssib
le in
fluen
ces
and
impa
cts
com
preh
ensi
vely
and
sys
tem
atic
ally
upo
n th
e st
rate
gy d
urin
g th
e de
velo
pmen
t ph
ase.
Th
is in
itial
PE
STL
E a
naly
sis
shou
ld h
elp
iden
tify
pote
ntia
l ris
ks fa
ced
by th
e fo
rthco
min
g S
TS.
C.2
Th
is P
ES
TLE
impa
ct a
ims
to id
entif
y an
y po
tent
ial i
ssue
s an
d po
ssib
le n
eeds
for f
urth
er e
vide
nce/
dat
a ac
ross
six
mai
n ar
eas
of in
tere
sts:
• Po
litic
al (e
.g. t
o as
sess
the
polit
ical
and
pub
lic a
ccep
tabi
lity)
; •
Econ
omic
/ fin
anci
al (
e.g.
to
asse
ss t
he im
pact
on
the
loca
l eco
nom
y an
d in
clud
ing
the
iden
tific
atio
n of
pos
sibl
e fu
ndin
g st
ream
s an
d S
106
agre
emen
ts);
• So
cial
(e.g
. to
asce
rtain
the
impa
ct o
n so
cial
exc
lusi
on);
• Te
chno
logi
cal (
e.g.
to c
onsi
der t
he im
pact
of a
ny e
xpec
ted
tech
nica
l dev
elop
men
ts);
• Le
gal/
regu
lato
ry (e
.g. t
o en
sure
that
inte
rven
tions
are
lega
l); a
nd
• En
viro
nmen
tal/
ecol
ogic
al (e
.g. t
o as
sess
the
likel
y en
viro
nmen
tal i
mpa
ct).
(In
add
ition
, som
e P
ES
TLE
ana
lyse
s co
nsid
er th
ree
othe
r iss
ues:
man
agem
ent,
qual
ity, s
afet
y –
it is
not
pro
pose
d th
at th
is a
ppra
isal
cov
ers
thes
e is
sues
but
this
may
be
requ
ired
whe
n th
e S
TS is
nea
r fin
alis
atio
n.)
C.3
Th
is a
ppra
isal
fra
mew
ork
take
s in
to c
onsi
dera
tion
the
scal
e of
the
impa
ct a
nd d
istin
guis
hes
betw
een
evid
ence
of
shor
t te
rm im
pact
s (u
p to
5
year
s i.e
. the
com
plet
ion
of im
plem
enta
tion
of th
e se
cond
Ken
t Loc
al T
rans
port
Pla
n) a
nd im
pact
s th
at la
st in
to th
e lo
ng te
rm (
up to
202
6 –
the
perio
d co
vere
d by
the
Loca
l Dev
elop
men
t Fra
mew
ork)
. The
fram
ewor
k is
bas
ed o
n a
scor
ing
scal
e of
bet
wee
n -5
and
+5
to r
efle
ct e
vide
nce
of
the
scal
e of
impa
cts
and
long
evity
of t
hat i
mpa
ct. T
he le
vel o
f sco
res
repo
rted
are
base
d on
tech
nica
l exp
erie
nce
and
prof
essi
onal
judg
emen
t but
ar
e cl
early
ope
n to
inte
rrog
atio
n an
d so
sho
uld
only
be
used
as
a gu
ide.
A b
lank
cel
l mea
ns th
at th
e im
pact
is e
xpec
ted
to b
e ne
utra
l. S
epar
ate
anal
yses
wer
e un
derta
ken
by th
e st
udy
team
and
the
stak
ehol
ders
whi
ch le
d to
diff
eren
t sco
re fo
r som
e el
emen
ts.
Sco
res
from
bot
h ar
e re
porte
d he
re in
ord
er to
hig
hlig
ht d
iffer
ence
s in
opi
nion
ove
r th
e sc
ale
of th
e im
pact
s an
d th
eir
times
cale
. Th
e co
mm
ents
from
the
stud
y te
am a
nd th
e st
akeh
olde
rs h
ave
been
mer
ged.
C.4
E
xam
ples
of
inte
rven
tions
that
wou
ld s
uppo
rt th
e ac
tion
poin
ts a
re a
lso
iden
tifie
d.
Thes
e ar
e m
eant
to
be il
lust
rativ
e an
d ar
e no
t ne
cess
arily
co
mpr
ehen
sive
. N
ever
thel
ess
they
are
all
actio
ns th
at S
DC
itse
lf, o
r in
conj
unct
ion
with
its
partn
ers,
cou
ld im
plem
ent.

H07
0130
: Sev
enoa
ks T
rans
port
Stu
dy
Ref
: A
ppen
dix
C
C
Act
ion
Poi
nt 1
: Inv
estig
atin
g vi
able
alte
rnat
ives
to th
e ca
r, su
ch a
s en
cour
agin
g m
ore
jour
neys
by
bus,
tra
in, c
yclin
g an
d w
alki
ng, t
hat w
ill im
prov
e tra
vel c
hoic
e C
.5
Exa
mpl
es o
f pos
sibl
e al
tern
ativ
es to
the
car:
• w
ider
and
con
tinuo
us fo
otw
ays;
•
rem
ove
guar
d ra
iling
; •
bette
r mai
ntai
ned
foot
way
s;
• pe
dest
rian
cros
sing
s;
• C
CTV
in p
edes
trian
are
as;
• dr
oppe
d ke
rbs
and
tact
ile p
avin
g;
• im
prov
ed ri
ghts
of w
ay;
• im
prov
e ro
utes
on
desi
re li
nes
to g
ener
ator
s;
• se
greg
ated
cyc
le la
nes;
•
adva
nced
sto
p lin
es fo
r cyc
lists
at j
unct
ions
; •
secu
re c
ycle
par
king
; •
offic
e sh
ower
s fo
r cyc
lists
; •
mor
e re
gula
r and
relia
ble
bus
serv
ices
; •
prov
idin
g bu
s la
nes/
bus
prio
rity;
•
real
-tim
e bu
s in
form
atio
n at
bus
sto
ps;
• se
cure
bus
sto
ps a
nd b
uses
(e.g
. CC
TV);
• in
tegr
ated
bus
(or b
us &
rail)
tick
etin
g;
• co
nces
sion
ary
fare
s; s
ubsi
dise
d bu
ses;
•
mor
e re
gula
r and
relia
ble
rail
serv
ices
; •
bette
r rai
l int
erch
ange
s (s
tatio
ns),
park
& ri
de/ k
iss
& ri
de fa
cilit
ies;
etc
. C
.6
Key
sta
keho
lder
s in
clud
e:
• P
ublic
tran
spor
t ope
rato
rs;
• Tr
ansp
ort u
sers
; •
Hig
hway
s A
genc
y; a
nd
• N
eigh
bour
ing
Loca
l Aut
horit
ies.
C
.7
Sev
enoa
ks D
istri
ct C
ounc
il (S
DC
) alre
ady
has
good
wor
king
rela
tions
with
thes
e bu
t will
need
to m
aint
ain
them
ove
r tim
e.

H07
0130
: Sev
enoa
ks T
rans
port
Stu
dy
Ref
: A
ppen
dix
C
C
T C
1 PE
STLE
– in
vest
igat
ing
alte
rnat
ives
to th
e ca
r
S
tudy
team
sco
res
Sta
keho
lder
team
sco
res
Com
men
ts
Impa
ct ty
pe
Sho
rt te
rm im
pact
Lo
ng te
rm im
pact
S
hort
term
impa
ct
Long
term
impa
ct
Neg
ativ
e P
ositi
ve
Neg
ativ
eP
ositi
ve
Neg
ativ
eP
ositi
ve
Neg
ativ
eP
ositi
ve
Pol
itica
l
+1
+2
+1
+2
Li
kely
to b
e po
litic
ally
& p
ublic
ly a
ccep
tabl
e, d
epen
ding
on
the
pack
age
of
mea
sure
s ad
opte
d, e
spec
ially
any
car
rest
rain
t. P
rovi
ding
alte
rnat
ives
to
the
car w
ill b
ecom
e m
ore
polit
ical
ly a
ccep
tabl
e du
e to
the
pres
sure
s of
the
clim
ate
chan
ge a
gend
a.
Eco
nom
ic
+1
-2
Impr
oved
acc
ess
by a
ll m
odes
wou
ld p
rom
ote
the
econ
omy
e.g.
acc
ess
to
jobs
, edu
catio
n, le
isur
e. P
ossi
ble
adve
rse
impa
ct o
n re
taili
ng if
poo
rly
impl
emen
ted.
Bot
h ca
pita
l and
reve
nue
expe
nditu
re c
ould
be
very
hig
h e.
g. b
us la
nes
and
conc
essi
onar
y fa
res.
The
cos
ts c
ould
be
proh
ibiti
ve in
S
even
oaks
Dis
trict
hen
ce th
e ne
gativ
e sc
ore.
S
ocia
l
+1
+2
+2
+2
B
enef
icia
l by
wid
enin
g op
portu
nitie
s fo
r tho
se c
urre
ntly
soc
ially
exc
lude
d es
peci
ally
non
-car
ow
ning
fam
ilies
in ru
ral a
reas
. Te
chno
logi
cal
+2
+4
+3
Te
chno
logy
is ra
pidl
y de
velo
ping
to im
prov
e P
T in
form
atio
n bu
t pro
blem
s of
con
gest
ion
will
not
be
addr
esse
d. T
here
is m
uch
scop
e fo
r int
rodu
cing
im
prov
ed P
T in
form
atio
n us
ing
new
tech
nolo
gy in
Sev
enoa
ks D
istri
ct b
ut
this
is u
nlik
ely
to b
e ac
hiev
ed in
und
er 5
yea
rs.
Lega
l
-2
Mul
tiple
con
tract
s m
ay h
ave
conf
lictin
g im
pact
s, e
.g. t
he re
new
al o
f rai
l fra
nchi
ses.
E
nviro
nmen
tal
+1
+5
+2
+4
Red
ucin
g ca
r dep
ende
ncy
and
prom
otin
g us
e of
oth
er m
odes
will
ben
efit
air q
ualit
y, re
duce
noi
se, r
educ
e em
issi
ons
and
cont
ribut
e to
redu
cing
cl
imat
e ch
ange
risk
s.
SCO
RES
+3
+1
2 -4
+9
+11
C
.8
The
stak
ehol
ders
are
mor
e op
timis
tic o
ver t
he li
kely
impa
ct o
f act
ions
that
cou
ld b
e un
derta
ken
with
in th
e sh
ort t
erm
(fiv
e ye
ars)
.

H07
0130
: Sev
enoa
ks T
rans
port
Stu
dy
Ref
: A
ppen
dix
C
C
Act
ion
Poi
nt 2
: Ide
ntify
bar
riers
to th
e ta
ke u
p of
alte
rnat
ive
form
s of
tran
spor
t and
reco
mm
end
actio
ns
to a
ddre
ss th
is is
sue
C.9
E
xam
ples
of p
ossi
ble
barr
iers
:
• na
rrow
and
dis
cont
inuo
us fo
otw
ays;
•
guar
d ra
iling;
poo
rly m
aint
aine
d fo
otw
ays;
•
wro
ngly
loca
ted
pede
stria
n cr
ossi
ngs;
•
intim
idat
ing
unde
rpas
ses;
•
lack
of C
CTV
in p
edes
trian
are
as;
• po
orly
mai
ntai
ned
impr
oved
righ
ts o
f way
; •
unsa
fe c
ycle
lane
s;
• la
ck o
f adv
ance
d st
op li
nes
for c
yclis
ts a
t jun
ctio
ns;
• la
ck o
f sec
ure
cycl
e pa
rkin
g;
• la
ck o
f reg
ular
and
relia
ble
bus
serv
ices
; •
lack
of b
us la
nes/
bus
prio
rity;
•
poor
info
rmat
ion
at b
us s
tops
; ins
ecur
e bu
s st
ops
and
buse
s;
• la
ck o
f int
egra
ted
bus
(or b
us &
rail)
tick
etin
g;
• la
ck o
f reg
ular
and
relia
ble
rail
serv
ices
; •
poor
rail
inte
rcha
nges
(sta
tions
); et
c.
C.1
0 K
ey s
take
hold
ers
incl
ude:
• D
epar
tmen
t for
Tra
nspo
rt •
SD
C
• To
wn
and
Par
ish
Cou
ncils
. •
Net
wor
k R
ail;
• Tr
ain
and
bus
oper
ator
s (S
outh
east
ern
Rai
lway
, AR
RIV
A)
• S
US
TRAN
S
• N
atio
nal C
yclin
g C
ampa
ign
• R
ambl
ers
Ass
ocia
tion
• Li
ving
Stre
ets
C.1
1 Th
e C
ounc
il w
ill n
eed
to m
aint
ain
wor
king
rela
tions
with
a w
ide
rang
e of
rela
tivel
y sm
all o
rgan
isat
ions
whi
ch c
ould
pro
ve to
be
a st
rain
on
limite
d re
sour
ces.

H07
0130
: Sev
enoa
ks T
rans
port
Stu
dy
Ref
: A
ppen
dix
C
C
T C
2 PE
STLE
– id
entif
ying
bar
riers
to a
ltern
ativ
e m
odes
S
tudy
team
sco
res
Sta
keho
lder
team
sco
res
Com
men
ts
Impa
ct ty
pe
Sho
rt te
rm im
pact
Lo
ng te
rm im
pact
S
hort
term
impa
ct
Long
term
impa
ct
Neg
ativ
e P
ositi
ve
Neg
ativ
eP
ositi
ve
Neg
ativ
eP
ositi
ve
Neg
ativ
eP
ositi
ve
Pol
itica
l
+1
+3
-3
+4
B
arrie
rs to
alte
rnat
ive
form
s of
tran
spor
t are
com
mon
and
rem
oval
is
gene
rally
sup
porte
d. H
owev
er if
the
rem
oval
of b
arrie
rs c
onfli
cts
with
car
us
e, e
.g. v
ia th
e in
trodu
ctio
n of
bus
lane
s, th
en p
oliti
cal d
iffic
ultie
s co
uld
aris
e.
Eco
nom
ic
+1
+1
+2
+3
Impr
oved
acc
ess
by a
ll m
odes
wou
ld p
rom
ote
the
econ
omy
e.g.
acc
ess
to
jobs
, edu
catio
n, le
isur
e.
Soc
ial
+1
+5
+2
+3
Impr
oved
acc
ess
by a
ll m
odes
wou
ld p
rom
ote
soci
al in
tegr
atio
n e.
g.
acce
ss to
jobs
, edu
catio
n, le
isur
e, h
ealth
. Te
chno
logi
cal
-2
+1
Ther
e ar
e no
bar
riers
to te
chno
logi
cal d
evel
opm
ents
bei
ng a
pplie
d in
S
even
oaks
Dis
trict
. P
ossi
ble
prob
lem
s co
uld
aris
e w
ith re
al-ti
me
pass
enge
r tra
nspo
rt in
form
atio
n du
e to
the
capa
city
con
stra
ints
on
the
railw
ays.
Le
gal
Pos
sibl
e ris
k of
incr
ease
d ac
cide
nts
e.g.
if g
uard
raili
ng re
mov
ed le
adin
g to
litig
atio
n, b
ut re
sear
ch h
as s
how
n th
at re
mov
al o
f gua
rd ra
iling
can
im
prov
e sa
fety
I to
wn
cent
res
and
resi
dent
ial s
treet
s..
Env
ironm
enta
l
+1
+5
+4
+5
R
emov
ing
barr
iers
to a
ltern
ativ
e fo
rms
of tr
ansp
ort w
ill b
enef
it ai
r qua
lity,
re
duce
noi
se, r
educ
e em
issi
ons,
and
con
tribu
te to
redu
cing
clim
ate
chan
ge ri
sks.
SC
OR
ES
+4
+14
-5
+8
+1
6
C.1
2 Th
e sc
ores
of b
oth
grou
ps a
re v
ery
sim
ilar b
ut th
e st
akeh
olde
rs a
re m
ore
optim
istic
ove
r the
pos
sibl
e im
pact
s in
the
shor
t ter
m.

H07
0130
: Sev
enoa
ks T
rans
port
Stu
dy
Ref
: A
ppen
dix
C
C
Act
ion
Poi
nt 3
: Red
ucin
g tra
ffic
cong
estio
n by
impr
ovin
g tra
ffic
man
agem
ent t
o re
duce
con
gest
ed
area
s, im
prov
ing
air q
ualit
y an
d as
sess
ing
the
viab
ility
of o
ther
opt
ions
suc
h as
car
sha
ring
and
iden
tifyi
ng p
ossi
ble
solu
tions
suc
h as
new
road
s C
.13
Exa
mpl
es o
f pos
sibl
e tr
affic
man
agem
ent m
easu
res:
• in
trodu
cing
infra
stru
ctur
e fo
r non
-car
mod
es (e
.g. s
afe
cycl
e la
nes,
sec
ure
cycl
e pa
rkin
g, b
us la
nes/
bus
prio
rity)
; •
inte
grat
ed tr
affic
con
trol s
yste
ms
(e.g
. UTM
C);
• V
MS
sig
ns; l
egib
le s
tatic
sig
ns; w
iden
ing
high
way
s;
• by
-pas
ses
of v
illag
es;
• pr
omot
e su
stai
nabl
e tra
vel (
e.g.
car
sha
ring
by tr
avel
pla
ns);
• in
trodu
ctio
n of
hom
ezon
es a
nd lo
w-e
mis
sion
zon
es, s
hare
d su
rface
s; e
tc.
C.1
4 K
ey s
take
hold
ers
incl
ude:
• K
ent C
ount
y C
ounc
il;
• S
DC
; •
Tow
n an
d P
aris
h C
ounc
ils;
• N
atio
nal R
ail;
and
• Tr
ain
oper
ator
s.
C.1
5 In
the
mai
n th
ese
orga
nisa
tions
are
pub
lic s
ecto
r w
ith w
hom
the
Dis
trict
Cou
ncil
alre
ady
has
good
lin
ks f
or p
rovi
ding
inf
rast
ruct
ure,
but
for
m
axim
um e
ffect
the
priv
ate
sect
or o
pera
tors
mus
t sup
port
with
enh
ance
d tra
nspo
rt se
rvic
es.

H07
0130
: Sev
enoa
ks T
rans
port
Stu
dy
Ref
: A
ppen
dix
C
C
T C
3 PE
STLE
– re
duci
ng tr
affic
con
gest
ion
thro
ugh
traf
fic m
anag
emen
t
S
tudy
team
sco
res
Sta
keho
lder
team
sco
res
Com
men
ts
Impa
ct ty
pe
Sho
rt te
rm im
pact
Lo
ng te
rm im
pact
S
hort
term
impa
ct
Long
term
impa
ct
Neg
ativ
e P
ositi
ve
Neg
ativ
eP
ositi
ve
Neg
ativ
eP
ositi
ve
Neg
ativ
eP
ositi
ve
Pol
itica
l -1
-2
+4
+2
C
ould
be
polit
ical
ly &
pub
licly
una
ccep
tabl
e, d
epen
ding
on
the
pack
age
of
mea
sure
s ad
opte
d. C
ar p
arki
ng is
an
issu
e at
railw
ay s
tatio
ns w
ithin
S
even
oaks
Dis
trict
. E
cono
mic
+1
+3
-4
-2
R
educ
ing
cong
estio
n w
ould
ben
efit
econ
omy
if it
coul
d be
mai
ntai
ned
over
tim
e. U
TMC
is e
xpen
sive
as
are
som
e in
frast
ruct
ure
inve
stm
ents
but
not
st
atic
sig
ns.
But
relie
f roa
ds c
ould
dam
age
loca
l eco
nom
ies.
S
ocia
l
+1
+3
+4
+2
C
onge
stio
n de
lays
bus
es a
nd d
isco
urag
es th
eir u
se.
Red
uced
con
gest
ion
enab
les
easi
er a
cces
s fo
r soc
ially
exc
lude
d on
bus
es.
Car
sha
ring
need
s ca
r par
ks fo
r ope
ratio
ns to
be
effe
ctiv
e.
Tech
nolo
gica
l
+1
+1
+4
+2
Le
ss-p
ollu
ting
vehi
cles
and
new
fuel
s (e
.g. b
io-fu
els)
in fu
ture
may
mea
n em
issi
ons
are
not a
pro
blem
(but
con
gest
ion
will
rem
ain
so).
Traf
fic c
ontro
l an
d ro
ute
guid
ance
sys
tem
s ar
e be
com
ing
mor
e so
phis
ticat
ed.
Lega
l
-1
+4
+4
No
lega
l req
uire
men
ts to
use
less
-pol
lutin
g ve
hicl
es.
Few
er a
ccid
ents
m
ight
aris
e le
adin
g to
low
er in
sura
nce
clai
ms.
E
nviro
nmen
tal
+2
+5
+1
+4
Hig
hly
bene
ficia
l in
term
s of
impr
ovin
g ai
r qua
lity,
redu
cing
noi
se a
nd
emis
sion
s th
at g
ener
ate
clim
ate
chan
ge.
The
adve
rse
impa
ct o
f H
GV
s co
uld
be re
duce
d.
SCO
RES
+5
-1
+12
-4
+17
-2
+14
C
.16
The
stak
ehol
der g
roup
are
muc
h m
ore
optim
istic
abo
ut w
hat c
ould
be
achi
eved
in th
e sh
ort t
erm
but
als
o re
cogn
ise
the
pote
ntia
l adv
erse
impa
ct
of b
y-pa
sses
on
the
loca
l eco
nom
y.

H07
0130
: Sev
enoa
ks T
rans
port
Stu
dy
Ref
: A
ppen
dix
C
C
Act
ion
Poi
nt 4
: Ide
ntify
ing
sche
mes
whi
ch ta
rget
cas
ualty
redu
ctio
n an
d re
duci
ng in
appr
opria
te s
peed
s to
impr
ove
road
saf
ety.
Thi
s w
ill lo
ok a
t im
prov
ing
safe
ty o
n ru
ral l
anes
and
als
o m
akin
g pe
dest
rians
an
d cy
clis
ts fe
el s
afer
whe
n us
ing
the
road
C
.17
Exa
mpl
es o
f pos
sibl
e sa
fety
sch
emes
:
• tra
ffic
calm
ing
in re
side
ntia
l are
as;
• lo
wer
spe
ed li
mits
on
rura
l roa
ds;
• sp
eed
enfo
rcem
ent o
n m
ain
high
way
s an
d ru
ral r
oads
(e.g
. fix
ed o
r mob
ile s
afet
y ca
mer
as);
• re
d-lig
ht c
amer
as; w
ider
enf
orce
men
t of r
oad
traffi
c la
w;
• ro
ad s
afet
y ed
ucat
ion
for s
choo
l/ co
llege
stu
dent
s;
• dr
iver
retra
inin
g (e
.g. f
or b
anne
d dr
iver
s);
• in
trodu
cing
infra
stru
ctur
e fo
r non
-car
mod
es (e
.g. w
ider
foot
way
s, c
ycle
lane
s, b
us la
nes)
; etc
. C
.18
Key
sta
keho
lder
s in
clud
e:
• K
ent C
ount
y C
ounc
il (K
ent H
ighw
ays,
Rig
hts
of W
ay Im
prov
emen
t Pla
n);
• To
wn
and
Par
ish
Cou
ncils
; and
•
SD
C.
C.1
9 Th
ese
inte
rven
tions
are
ver
y m
uch
an is
sue
for l
ocal
org
anis
atio
ns.

H07
0130
: Sev
enoa
ks T
rans
port
Stu
dy
Ref
: A
ppen
dix
C
C
T C
4 PE
STLE
– im
prov
ing
safe
ty
S
tudy
team
sco
res
Sta
keho
lder
team
sco
res
Com
men
ts
Impa
ct ty
pe
Sho
rt te
rm im
pact
Lo
ng te
rm im
pact
S
hort
term
impa
ct
Long
term
impa
ct
Neg
ativ
e P
ositi
ve
Neg
ativ
eP
ositi
ve
Neg
ativ
eP
ositi
ve
Neg
ativ
eP
ositi
ve
Pol
itica
l
+1
+2
+3
+3
P
oliti
cal a
nd p
ublic
sup
port
for r
oad
safe
ty im
prov
emen
ts is
stro
ng b
ut
som
e m
easu
res,
e.g
. tra
ffic
calm
ing
and
safe
ty c
amer
as c
an g
ener
ate
oppo
sitio
n.
Eco
nom
ic
+1
+3
Acc
iden
ts a
re a
sig
nific
ant b
urde
n on
hea
lthca
re fa
cilit
ies
and
an
econ
omic
cos
t to
busi
ness
. E
nfor
cem
ent b
y po
lice
offic
ers
is e
xpen
sive
w
hile
aut
omat
ic e
nfor
cem
ent e
.g. v
ia c
amer
as c
an g
ener
ate
inco
me.
S
ocia
l
+2
+4
+1
+3
A
ccid
ents
are
pre
vale
nt a
mon
gst t
hose
in p
oore
r com
mun
ities
and
on
rura
l ro
ads
so s
ocia
l ben
efits
from
redu
cing
acc
iden
ts w
ould
be
sign
ifica
nt.
Tech
nolo
gica
l
+3
+5
N
ew te
chno
logy
, e.g
. ada
ptiv
e cr
uise
con
trol,
lane
-dep
artu
re p
reve
ntio
n,
omni
-dire
ctio
nal c
ollis
ion
syst
ems,
will
hav
e a
posi
tive
bene
fit in
the
long
er
term
whi
le m
ore
safe
ty c
amer
as c
ould
hav
e an
imm
edia
te im
pact
. Le
gal
-5
-2
+1
+1
Lega
l iss
ues
exis
t ove
r lia
bilit
y re
latin
g to
acc
iden
ts in
volv
ing
vehi
cles
with
in
telli
gent
spe
ed a
dapt
atio
n sy
stem
s th
at c
ould
del
ay th
eir i
mpl
emen
tatio
n.
Hig
hway
adj
ustm
ents
mig
ht b
e su
bjec
t to
lega
l cha
lleng
e. N
o le
gal
barr
iers
exi
st to
cur
rent
met
hods
e.g
. spe
ed c
amer
as, b
ut fo
r oth
er
emer
ging
tech
nolo
gies
, e.g
. cru
ise
cont
rol,
they
do.
E
nviro
nmen
tal
+1
+1
+1
B
enef
its e
xist
e.g
. air
qual
ity a
nd n
oise
impr
ovem
ents
, but
are
min
or.
Som
e sc
hem
es c
an d
etra
ct fr
om th
e ap
pear
ance
of h
isto
ric v
illag
es.
SCO
RES
-5
+7
-2
+1
5
+6
+8
C.2
0 Th
e st
udy
team
bel
ieve
s th
at ro
ad s
afet
y in
terv
entio
ns c
ould
hav
e a
sign
ifica
nt im
pact
ove
r the
long
er te
m, i
.e. t
he 2
0 ye
ar p
erio
d of
the
LDF.

H07
0130
: Sev
enoa
ks T
rans
port
Stu
dy
Ref
: A
ppen
dix
C
C
Act
ion
poin
t 5: R
educ
ing
trave
l dem
and
by re
duci
ng a
nd c
ontro
lling
the
num
ber o
f car
jour
neys
mad
e in
to to
wn
cent
res
and
loca
ting
new
dev
elop
men
t clo
se to
goo
d tra
nspo
rt lin
ks a
nd lo
cal f
acilit
ies
to
redu
ce c
ar jo
urne
ys.
It w
ill a
lso
iden
tify
key
park
ing
issu
es a
nd id
entif
y po
ssib
le s
olut
ions
to a
llevi
ate
prob
lem
s su
ch a
s co
mm
uter
par
king
in th
e di
stric
t. C
.21
Exa
mpl
es o
f tra
vel d
eman
d re
duci
ng m
easu
res:
• lo
catin
g ne
w d
evel
opm
ents
at l
ocat
ions
whe
re a
cces
s by
non
-car
mod
es is
eas
y (e
.g. r
ail s
tatio
ns a
nd b
us s
tops
); •
high
er d
ensi
ty h
ousi
ng; l
ess
gene
rous
par
king
sta
ndar
ds;
• w
orkp
lace
par
king
cha
rges
; hig
her o
n-st
reet
par
king
cha
rges
; •
prov
idin
g a
wid
er ra
nge
of lo
cal s
ervi
ces
(e.g
. ban
ks, h
aird
ress
ers,
food
sho
ps);
• lim
it ca
r par
king
ava
ilabi
lity
in to
wns
by
ratio
ning
spa
ce o
r pric
ing;
•
intro
duci
ng d
eman
d m
anag
emen
t mea
sure
s (e
.g. r
oad-
user
or c
onge
stio
n ch
argi
ng);
• bu
s ga
tes
to e
nabl
e bu
s (b
ut n
ot c
ar) a
cces
s;
• rin
g-ro
ads/
byp
asse
s; H
OV
lane
s;
• bu
s &
lorr
y la
nes;
new
car
par
ks; t
raffi
c ce
lls in
tow
ns; e
tc.
C.2
2 K
ey s
take
hold
ers
incl
ude:
• K
ent C
ount
y C
ounc
il (R
ight
s of
Way
Impr
ovem
ent P
lan)
; and
•
Paris
h C
ounc
ils.
C.2
3 S
DC
cou
ld e
asily
liai
se w
ith th
ese
orga
nisa
tions
.

H07
0130
: Sev
enoa
ks T
rans
port
Stu
dy
Ref
: A
ppen
dix
C
C
T C
5 PE
STLE
– re
duci
ng tr
avel
dem
and
S
tudy
team
sco
res
Sta
keho
lder
team
sco
res
Com
men
ts
Impa
ct ty
pe
Sho
rt te
rm im
pact
Lo
ng te
rm im
pact
S
hort
term
impa
ct
Long
term
impa
ct
Neg
ativ
e P
ositi
ve
Neg
ativ
eP
ositi
ve
Neg
ativ
eP
ositi
ve
Neg
ativ
eP
ositi
ve
Pol
itica
l -2
-1
+1
+4
In
the
shor
t ter
m o
ppos
ition
to c
ar u
se in
tow
ns w
ould
be
sign
ifica
nt u
ntil
exce
llent
acc
ess
by o
ther
mod
es is
pro
vide
d. H
igh
dens
ity h
ousi
ng m
ight
al
so b
e cr
itici
sed
as w
ould
incr
ease
d pa
rkin
g ch
arge
s or
mor
e re
stric
tive
park
ing.
Nev
erth
eles
s th
e is
sue
is g
row
ing
in im
porta
nce
polit
ical
ly, a
nd
will
con
tinue
to d
o so
. E
cono
mic
-3
-1
+2
+4
C
ar re
stra
int c
ould
impa
ct o
n re
taili
ng u
nles
s ex
celle
nt a
cces
s by
oth
er
mod
es is
pro
vide
d. B
ut s
ome
dem
and
man
agem
ent m
easu
res
wou
ld
gene
rate
inco
me
for p
ublic
bod
ies
e.g.
hig
her p
arki
ng c
harg
es, r
oad-
use
char
ging
. S
106
agre
emen
ts w
ould
gen
erat
e fu
nds
for S
DC
. S
ome
mea
sure
s w
ould
be
expe
nsiv
e e.
g. H
OV
lane
s.
Soc
ial
+1
+2
+1
+3
If ac
cess
for a
ltern
ativ
es to
car
s is
impr
oved
this
wou
ld b
enef
it th
ose
from
po
orer
com
mun
ities
. Im
pact
on
rura
l eco
nom
y co
uld
be a
pro
blem
if
acce
ss to
tow
n ce
ntre
s lim
ited.
Te
chno
logi
cal
+2
+3
New
tech
nolo
gy, e
.g. a
utom
atic
num
ber p
late
reco
gniti
on a
nd C
CTV
, m
onito
ring
coul
d en
forc
e ca
r res
train
t mea
sure
s. N
ew p
arki
ng te
chno
logy
e.
g. p
aym
ent v
ia m
obile
pho
nes
coul
d m
ake
park
ing
man
agem
ent e
asie
r.
Hom
e w
orki
ng u
sing
bro
adba
nd te
chno
logy
wou
ld re
duce
trav
el d
eman
d.
Lega
l -1
Som
e te
chno
logi
es a
re n
ot y
et a
ppro
ved
for u
se b
y D
fT.
Env
ironm
enta
l
+1
+4
+1
+3
B
enef
its to
air
qual
ity a
nd n
oise
wou
ld a
ccru
e du
e to
redu
ced
car u
se, a
s w
ell a
s re
duci
ng e
mis
sion
s th
at c
ause
clim
ate
chan
ge, s
o lo
ng a
s co
nges
tion
was
not
mer
ely
disp
lace
d.
SCO
RES
-5
+4
-2
+9
+5
+1
4
C.2
4 Th
e st
udy
grou
p id
entif
ied
som
e po
tent
ial d
iffic
ultie
s w
ith th
ese
inte
rven
tions
that
cou
ld re
duce
thei
r im
pact
, whi
le th
e st
akeh
olde
rs d
id n
ot.

H07
0130
: Sev
enoa
ks T
rans
port
Stu
dy
Ref
: A
ppen
dix
C
C
Act
ion
Poi
nt 6
: Im
prov
ing
trave
l aw
aren
ess
by e
ncou
ragi
ng tr
avel
pla
ns a
nd p
artn
ersh
ip w
orki
ng w
ith
inte
rnal
and
ext
erna
l sta
keho
lder
s an
d tra
nspo
rt pr
ovid
ers.
Thi
s w
ill in
clud
e lo
okin
g at
inno
vativ
e ap
proa
ches
to p
ublic
tran
spor
t in
rura
l are
as
C.2
5 E
xam
ples
of t
rave
l aw
aren
ess
mea
sure
s:
• co
mpa
ny a
nd s
choo
l tra
vel p
lans
to e
ncou
rage
beh
avio
ural
cha
nge
whe
re in
frast
ruct
ure
and
serv
ices
for a
ltern
ativ
es to
car
-us
e ex
ist;
• pr
omot
e fle
xibl
e w
orki
ng h
ours
; •
wal
king
bus
es a
nd c
yclin
g tra
ins;
•
pers
onal
ised
trip
pla
nner
s;
• tra
vel b
uddi
es fo
r tho
se w
ith le
arni
ng d
iffic
ultie
s;
• in
tegr
ated
tick
etin
g m
easu
res
(e.g
. bus
/bus
, bus
/ rai
l, ra
il/pa
rkin
g);
• ca
r-sha
ring;
car
clu
bs;
• jo
int p
lann
ing
by p
ublic
tran
spor
t ope
rato
rs; e
tc.
C.2
6 K
ey s
take
hold
ers
incl
ude:
• C
entra
l Gov
ernm
ent;
• Lo
cal A
utho
ritie
s;
• P
aris
h C
ounc
il P
lann
ing
grou
ps;
• C
ham
ber o
f Com
mer
ce;
• S
choo
ls;
• Bu
sine
sses
; •
Bus
ope
rato
rs; a
nd
• W
alki
ng a
nd c
yclin
g gr
oups
. C
.27
A la
rge
num
ber o
f par
tner
s co
uld
need
to b
e in
volv
ed if
the
wid
e ra
nge
of s
mar
ter c
hoic
es w
ere
to b
e in
trodu
ced.

H07
0130
: Sev
enoa
ks T
rans
port
Stu
dy
Ref
: A
ppen
dix
C
C
T C
6 PE
STLE
– im
prov
ing
trav
el a
war
enes
s
S
tudy
team
sco
res
Sta
keho
lder
team
sco
res
Com
men
ts
Impa
ct ty
pe
Sho
rt te
rm im
pact
Lo
ng te
rm im
pact
S
hort
term
impa
ct
Long
term
impa
ct
Neg
ativ
e P
ositi
ve
Neg
ativ
eP
ositi
ve
Neg
ativ
eP
ositi
ve
Neg
ativ
eP
ositi
ve
Pol
itica
l
+2
+4
-1
+2
S
uppo
rt ex
ists
for s
uch
mea
sure
s by
the
publ
ic, a
nd m
ost b
usin
esse
s.
Roa
d pr
icin
g w
ould
be
cont
rove
rsia
l. E
cono
mic
+1
+1
+2
+5
B
y m
aint
aini
ng a
cces
s to
act
iviti
es, b
ut b
y no
n-ca
r mod
es, n
o ad
vers
e im
pact
s sh
ould
be
obse
rved
. Rev
enue
cos
ts o
f som
e ac
tions
can
be
high
e.
g. c
ar c
lubs
, how
ever
. Te
le-w
orki
ng u
sing
bro
adba
nd c
ould
sup
port
loca
l eco
nom
ic d
evel
opm
ent.
But
if d
evel
opm
ent p
ress
ure
ease
s th
e ab
ility
of S
DC
to m
aint
ain
requ
irem
ents
for d
evel
oper
con
tribu
tions
und
er
S10
6 co
uld
dim
inis
h.
Soc
ial
+1
+3
+3
+4
Ben
efits
thos
e w
ithou
t acc
ess
to p
rivat
e ca
rs. F
lexi
ble
wor
king
hou
rs m
ight
be
nefit
a ra
nge
of p
eopl
e.
Tech
nolo
gica
l
+1
+3
+1
+4
N
ew te
chno
logy
ena
bles
car
sha
ring
to b
e m
ore
effe
ctiv
e. In
tegr
ated
tic
ketin
g is
bec
omin
g co
mm
on v
ia s
mar
t car
ds.
Mob
ile p
hone
s ca
n be
us
ed to
info
rm o
f rea
l-tim
e pa
ssen
ger t
rans
port
info
rmat
ion.
New
te
chno
logy
cou
ld re
duce
the
over
all d
eman
d fo
r tra
vel.
Lega
l -1
-1
-1
+3
Tr
avel
Pla
ns, e
ven
for n
ew d
evel
opm
ents
, are
diff
icul
t to
enfo
rce.
Li
tigat
ion
risks
mig
ht a
rise
from
thos
e in
jure
d w
alki
ng/c
yclin
g to
p sc
hool
/wor
k. C
hang
es in
the
1985
Tra
nspo
rt A
ct c
ould
ben
efit
the
use
of
taxi
s, h
ire v
ehic
les
and
com
mun
ity tr
ansp
ort.
Env
ironm
enta
l
+1
+2
+3
+5
B
enef
its b
y re
duci
ng c
ar d
epen
denc
y an
d us
e.
SCO
RES
-1
+6
-1
+1
3 -2
+9
+23
C.2
8 S
take
hold
ers
are
very
opt
imis
tic c
once
rnin
g th
e lik
ely
impa
ct o
f suc
h m
easu
res
over
the
long
er te
rm.

H07
0130
: Sev
enoa
ks T
rans
port
Stu
dy
Ref
: A
ppen
dix
C
C
Act
ion
Poi
nt 7
: Im
prov
ing
acce
ss fo
r all
incl
udin
g ru
ral a
cces
sibi
lity
and
acce
ss to
hea
lthca
re,
parti
cula
rly in
thos
e ar
eas
suffe
ring
from
rela
tivel
y hi
gh le
vels
of d
epriv
atio
n C
.29
Exa
mpl
es o
f acc
essi
bilit
y m
easu
res:
• dr
oppe
d ke
rbs
and
tact
ile p
avin
g;
• w
ider
and
con
tinuo
us fo
otw
ays;
•
mor
e pe
dest
rian
cros
sing
s;
• re
gula
r rur
al b
uses
; •
spec
ial h
ospi
tal b
uses
/ vol
unta
ry tr
ansp
ort;
trave
l bud
dies
for t
hose
with
lear
ning
diff
icul
ties;
•
prov
idin
g m
obile
ser
vice
s e.
g. h
ealth
care
, lib
rarie
s, s
hops
; etc
. C
.30
Key
sta
keho
lder
s in
clud
e:
• K
ent C
ount
y C
ounc
il;
• C
omm
unity
Tra
nspo
rt pr
ovis
ion;
•
Bus
ope
rato
rs; a
nd
• H
ealth
Tru
st.
C.3
1 Th
e D
istri
ct C
ounc
il al
read
y pa
rtner
s w
ith th
ese
bodi
es.

H07
0130
: Sev
enoa
ks T
rans
port
Stu
dy
Ref
: A
ppen
dix
C
C
T C
7 PE
STLE
– im
prov
ing
acce
ss fo
r all
S
tudy
team
sco
res
Sta
keho
lder
team
sco
res
Com
men
ts
Impa
ct ty
pe
Sho
rt te
rm im
pact
Lo
ng te
rm im
pact
S
hort
term
impa
ct
Long
term
impa
ct
Neg
ativ
e P
ositi
ve
Neg
ativ
eP
ositi
ve
Neg
ativ
eP
ositi
ve
Neg
ativ
eP
ositi
ve
Pol
itica
l
+1
+2
+1
Pol
itica
l sup
port
exis
ts b
ut s
uppo
rt fo
r sub
sidi
ng ru
ral b
uses
may
not
be
high
. E
cono
mic
-1
-3
+1
+2
M
ight
mar
gina
lly b
enef
it ec
onom
y bu
t iss
ue w
ould
be
fund
ing.
S
ocia
l
+2
+4
+1
+2
B
enef
icia
l to
rura
l res
iden
ts, e
lder
ly a
nd s
ocia
lly e
xclu
ded
as a
mea
ns o
f in
tegr
atin
g th
em in
to s
ocie
ty. L
onge
r life
exp
ecta
ncy
mea
ns th
at a
cces
s to
he
alth
care
will
gro
w in
impo
rtanc
e.
Tech
nolo
gica
l
+1
+1
+2
Mob
ile h
ealth
care
can
ben
efit
from
new
tech
nolo
gy.
Rea
l-tim
e pa
ssen
ger
trans
port
info
rmat
ion
wou
ld b
enef
it ru
ral b
us s
tops
. Le
gal
E
nviro
nmen
tal
+1
+1
Pos
sibl
e m
inor
ben
efits
if m
obile
ser
vice
s pr
ovid
ed.
SCO
RES
-1
+3
-3
+8
+3
+8
C.3
2 B
oth
the
stud
y te
am a
nd th
e st
akeh
olde
rs e
stim
ated
the
sam
e im
pact
alth
ough
the
latte
r als
o id
entif
ied
som
e ad
vers
e im
pact
s.

H07
0130
: Sev
enoa
ks T
rans
port
Stu
dy
Ref
: A
ppen
dix
C
C
Act
ion
Poi
nt 8
: Im
prov
ing
the
envi
ronm
ent,
air q
ualit
y an
d th
e qu
ality
of l
ife
C.3
3 E
xam
ples
of e
nviro
nmen
tal m
easu
res:
• m
ore
strin
gent
pla
nnin
g re
gula
tions
con
cern
ing
loca
tion;
•
expa
nd A
ir Q
ualit
y M
anag
emen
t Are
as;
• lo
w-e
mis
sion
zon
es;
• en
cour
age
the
prov
isio
n of
mor
e se
rvic
es (e
mpl
oym
ent,
educ
atio
n, h
ealth
care
, lei
sure
) loc
ally
; etc
. C
.34
Key
sta
keho
lder
s in
clud
e:
• G
over
nmen
t; •
SD
C (L
ocal
Tra
nspo
rt P
olic
y, E
nviro
nmen
t);
• R
egul
atio
n au
thor
ities
; •
Loca
l for
ums
C.3
5 P
oten
tially
thes
e is
sues
cou
ld in
volv
e in
puts
from
a v
ery
wid
e ra
nge
of b
odie
s.

H07
0130
: Sev
enoa
ks T
rans
port
Stu
dy
Ref
: A
ppen
dix
C
C
T C
8 PE
STLE
– im
prov
ing
the
envi
ronm
ent,
air q
ualit
y an
d th
e qu
ality
of l
ife
S
tudy
team
sco
res
Sta
keho
lder
team
sco
res
Com
men
ts
Impa
ct ty
pe
Sho
rt te
rm im
pact
Lo
ng te
rm im
pact
S
hort
term
impa
ct
Long
term
impa
ct
Neg
ativ
e P
ositi
ve
Neg
ativ
eP
ositi
ve
Neg
ativ
eP
ositi
ve
Neg
ativ
eP
ositi
ve
Pol
itica
l
-1
+1
+3
Pos
sibl
y be
nefic
ial d
epen
ding
on
mea
sure
s ad
opte
d. L
EZ
unlik
ely
to b
e po
pula
r at p
rese
nt a
nd p
ossi
ble
obje
ctio
ns to
pla
nnin
g th
at c
once
ntra
tes
deve
lopm
ent.
But
ther
e is
cro
ss-p
arty
sup
port
in S
DC
to s
uppo
rt th
e en
viro
nmen
t due
to g
row
ing
publ
ic a
war
enes
s an
d co
ncer
n.
Eco
nom
ic
-2
+1
Cre
atio
n of
mor
e pl
easa
nt e
nviro
nmen
t mig
ht b
enef
it ec
onom
y. C
ost o
f so
me
mea
sure
s w
ould
be
high
. H
ome-
wor
king
cou
ld b
enef
it lo
cal
econ
omie
s.
Soc
ial
+1
+5
+2
+4
Ben
efits
all
grou
ps in
soc
iety
. N
ew te
chno
logy
, e.g
. the
Inte
rnet
, allo
ws
hom
e-w
orki
ng a
nd im
prov
es a
cces
s to
ser
vice
s.
Tech
nolo
gica
l -1
-3
+2
+5
N
ew fu
els
may
obv
iate
nee
d fo
r AQ
MA
s or
LE
Z in
tim
e.
Lega
l
+3
+3
E
U le
gisl
atio
n is
driv
ing
the
agen
da a
nd S
DC
mus
t be
awar
e of
this
. E
nviro
nmen
tal
+1
+5
Stro
ng b
enef
its.
Env
ironm
enta
l im
prov
emen
ts w
ill b
enef
it th
e qu
ality
of
life.
SC
OR
ES
-1
+2
-4
+10
-2
+8
+1
6
C.3
6 Th
e st
akeh
olde
r gro
up a
re m
uch
mor
e op
timis
tic a
bout
wha
t cou
ld b
e ac
hiev
ed in
the
shor
t ter
m a
nd lo
ng te
rm a
nd ra
nk th
e va
lue
of th
is a
ctio
n po
int m
uch
high
er. H
owev
er th
e be
nefit
s of
env
ironm
enta
l im
prov
emen
ts o
n th
e en
viro
nmen
t its
elf h
ave
not b
een
reco
gnis
ed.

D appendix
Appendix D Air Quality Mapping

I
Date:Scale:
May 2007
Produced by the GIS Team, Sevenoaks District CouncilAQMA's in the District of Sevenoaks
This map is based upon the Ordnance Survey material with the permission of Ordnance Surveyon behalf of the Controller of Her Majesty's Stationery Office © Crown Copyright. Unauthorised
reproduction infringes Crown copyright and may lead to prosecution or civil proceedings.Sevenoaks District Council, 100019428, 2007.
Not to Scale
LegendSevenoaks BoundaryAQMA's (Not to Scale)

551000
551000
551500
551500
1560
00
1560
00
1565
00
1565
00
551000
551000
551500
551500
1560
00
1560
00
1565
00
1565
00
MAP 7
The Environment Act 1995 - Local Air Quality Management
Scale:Date: May 2005
This map is based upon the Ordnance Survey material with the permission of Ordnance Surveyon behalf of the Controller of Her Majesty's Stationery Office © Crown Copyright. Unauthorised
reproduction infringes Crown copyright and may lead to prosecution or civil proceedings.Sevenoaks District Council, LA079308, 2005.
Air Quality Management Areas - Amended May 2005.Designated for Nitrogen Dioxide (Annual Mean)
AQMA5/NO2/2005
1:5,000Data Source: Kings College London

551100
551100
551200
551200
551300
551300
551400
551400
551500
551500
551600
551600
551700
551700
551800
551800
551900
551900
552000
552000
552100
552100
552200
552200
552300
552300
552400
552400
1678
00
1678
00
1679
00
1679
00
1680
00
1680
00
1681
00
1681
00
1682
00
1682
00
1683
00
1683
00
1684
00
1684
00
1685
00
1685
00
1686
00
1686
00
1687
00
1687
00
1688
00
1688
00
1689
00
1689
00
1690
00
1690
00
1691
00
1691
00
Produced by t he GIS Te am, Sevenoaks District Cou ncil
This map is based upon the Ordnance Survey material with the permission of Ordnance Surveyon behalf of the Controller of Her Majesty's Stationery Office © Crown Copyright. Unauthorised
reproduction infringes Crown copyright and may lead to prosecution or civil proceedings.Sevenoaks District Council, LA079308, 2003.
Sevenoaks District CouncilAir Quality Management Area - AQMA8/NO2/2006
Swanley
Air Quality Management Area - AQMA8/NO2/2006Swanley.Designated for Nitrogen dioxide (annual mean) September 2006
Scale 1:8000

Seal
Allotment Gardens
El Sub Sta
Path (um)Bungalow
Recreation Ground
LB
LANDWAY
Works
Farm
Allotment
Church of St Peter
5 to 8
7
35
554600
554600
554700
554700
554800
554800
554900
554900
555000
555000
555100
555100
555200
555200
1564
00
1564
00
1565
00
1565
00
1566
00
1566
00
1567
00
1567
00
1568
00
1568
00
1569
00
1569
00
1570
00
1570
00
1571
00
Produced by t he GIS Te am, Sevenoaks District Cou ncil
This map is based upon the Ordnance Survey material with the permission of Ordnance Surveyon behalf of the Controller of Her Majesty's Stationery Office © Crown Copyright. Unauthorised
reproduction infringes Crown copyright and may lead to prosecution or civil proceedings.Sevenoaks District Council, LA079308, 2003.
Sevenoaks District Council Air Quality Management Area - AQMA9/NO2/2006
Seal
Air Quality Management Area - AQMA9/NO2/2006.High Street, Seal. A25.Designated for Nitrogen dioxide (annual mean) September 2006.
Scale 1:4000

552800
552800
552900
552900
553000
553000
553100
553100
553200
553200
553300
553300
553400
553400
553500
553500
1542
00
1542
00
1543
00
1543
00
1544
00
1544
00
1545
00
1545
00
1546
00
1546
00
1547
00
1547
00
1548
00
1548
00
1549
00
1549
00
1550
00
1550
00
Produced by t he GIS Te am, Sevenoaks District Cou ncil
This map is based upon the Ordnance Survey material with the permission of Ordnance Surveyon behalf of the Controller of Her Majesty's Stationery Office © Crown Copyright. Unauthorised
reproduction infringes Crown copyright and may lead to prosecution or civil proceedings.Sevenoaks District Council, LA079308, 2003.
Sevenoaks District CouncilAir Quality Management Area - AQMA10/NO2/2006
Sevenoaks
Air Quality Management Area - AQMA10/NO2/2006High Street, Sevenoaks. A225Designated for Nitrogen dioxide (annual mean) September 2006
Scale 1:5000

Westerham
St Mary's
A 25
Grange
A 233
Church
The
B 2
024
Cottages
Riv
er
Darent
B 2026Hotel
Car Park
WELLS CLOSE
El Sub Sta
Library
Berry's
Cotts
Fire
Wat
er L
ane
House
Littl
e
Path (u
m)
WorksVicarage
Stratton
Fir Cottage
Yard
Wagtail Cott
Surgery
Cou
rt
Carter
's Cro
ss
Churchill Court
Croft H
all
Cott
PH
Valley View
Wolfe
Cedarcroft
Ryecroft
Heather M
ist
Sta
Sub Sta
Austin Court
Place
Leat
Colltherst's
PO
CollettsWaterside
Bk
Borde Hill
Bank Cottage
Winterton Statue
Northcote
Four Oaks
Stakes
Bryher
Russetts
Cottage
Northridge
Cray
The Cedar
FB
The Maltings
Hall
War Meml
Squerryes
Forge
VICARAGE HILLMonks Way
LB
Orchard
ATTERBURY CLOSEHORTONS WAY
Breaches
Moreton
TCB
Pond
THE
Cow
GR
AN
GE
CLO
SE
Owl
NE
W S
TRE
ET
Cobbeck
MAR
KET W
AY
South
ST
RYSTED LANE
BM
118
.00m
FSBARTLETT ROAD
HIG
H S
TR
EE
T
Mill
Sunnyside
Lindau
SOUTH BANK
Newman
Kimlee
SLIP
THE PADDOCK
WELLERS
GP
HOLLINGWORTH WAY
108.2m
104.4m
MIL
L
DELAGARDE ROAD
DARENTH
22 to 25
to
13 to 24
l
25a
5
27
8
3
43
4
23
30
6
20
5422
33
55
FB
to
2
PH
FB
7El Sub Sta
3
PH
House
6
FB
FB
2
FB
Path
(um
)
5
43
TCB
A 25
5
FB
Car Park
The
7
Car Park
5
5
544400
544400
544500
544500
544600
544600
544700
544700
544800
544800
544900
5449001537
00
1537
00
1538
00
1538
00
1539
00
1539
00
1540
00
1540
00
1541
00
1541
00
1542
00
1542
00
1543
00
1543
00
1544
00
1544
00
Produced by t he GIS Te am, Sevenoaks District Cou ncil
This map is based upon the Ordnance Survey material with the permission of Ordnance Surveyon behalf of the Controller of Her Majesty's Stationery Office © Crown Copyright. Unauthorised
reproduction infringes Crown copyright and may lead to prosecution or civil proceedings.Sevenoaks District Council, LA079308, 2003.
Sevenoaks District CouncilAir Quality Management Area - AQMA11/NO2/2006
Westerham
Air Quality Management Area - AQMA11/NO2/2006Westerham.Designated for Nitrogen dioxide (annual mean) September 2006
Scale 1:4000

ST JOHN'S
Car Park
Builder's Yard
Bradbourne Court
Bat and Ball
Factory
OTFORD ROAD
Car Park
Car Park
552800
552800
552900
552900
553000
553000
553100
553100
553200
553200
553300
553300
1562
00
1562
00
1563
00
1563
00
1564
00
1564
00
1565
00
1565
00
1566
00
1566
00
1567
00
1567
00
1568
00
1568
00
1569
00
1569
00
Produced by t he GIS Te am, Sevenoaks District Cou ncil
This map is based upon the Ordnance Survey material with the permission of Ordnance Surveyon behalf of the Controller of Her Majesty's Stationery Office © Crown Copyright. Unauthorised
reproduction infringes Crown copyright and may lead to prosecution or civil proceedings.Sevenoaks District Council, LA079308, 2003.
Sevenoaks District CouncilAir Quality Management Area - AQMA12/NO2/2006
Bat & Ball
Air Quality Management Area - AQMA12/NO2/2006Bat & Ball Sevenoaks. A225 / A25Designated for Nitrogen dioxide (annual mean) September 2006
Scale 1:4000

E appendix
Appendix E Policy background

H070130: Sevenoaks Transport Study Ref : Appendix E
E
EU and National Policy European Union Directive 2001/42/EC of the European Parliament and the Council on the assessment of the effects of certain plans and programmes on the environment (Strategic Environmental Assessment directive)
E.1 The main EU policy of relevance to this document is the EU Directive on Strategic Environmental Assessment that requires the environmental consequences of all plans, including the Sevenoaks Transport Strategy (STS), to be consistently and comprehensively assessed, prior to implementation. The aim is to minimise any potential adverse consequences of proposed interventions and to ensure that mitigation measures are undertaken as appropriate.
E.2 The purpose of the SEA-Directive is to ensure that environmental consequences of certain plans and programmes are identified and assessed during their preparation and before their adoption. The public and environmental authorities can give their opinion and all results are integrated and taken into account in the course of the planning procedure. After the adoption of the plan or programme the public is informed about the decision and the way in which it was made.
E.3 SEA is designed to contribute to more transparent planning by involving the public and by integrating environmental considerations and help to achieve the goal of sustainable development.
White Paper: European transport policy for 2010: time to decide
E.4 Published in 2001 the European Transport Policy for 2010: Time to Decide, sets out policy guidelines that aim, over the next 30 years, to a sustainable transport system we might hope to achieve. The measures advocated in the White Paper are the first stages of a longer-term strategy.
E.5 The EU argues for:
• adequate funding of the infrastructure to eliminate bottlenecks and to link the Community’s outlying regions to its central regions. Creation of the trans-European network remains one of the preconditions for the rebalancing of transport modes. That is why it is fundamentally important that external costs, and in particular environmental costs, be internalised into the infrastructure charges that all users will have to pay;
• political determination to get the measures proposed in the White Paper adopted;
• a new approach to urban transport by local authorities which reconciles the modernisation of public services with rationalisation of private car use; this is needed to comply with the international commitments to reduce CO2 emissions;
• satisfying the needs of users who, in return for the increasingly high cost of mobility, are entitled to expect a quality service and full respect for their rights; this will make it possible to place the user at the heart of transport organisation.
E.6 However, the common transport policy alone is not expected to provide all the answers. It
must be part of an overall strategy integrating sustainable development, to include:
• economic policy and changes in the production process that influence the demand for transport;

H070130: Sevenoaks Transport Study Ref : Appendix E
E
• land-use planning policy and in particular town planning – to avoid any unnecessary increase in mobility needs caused by unbalanced urban planning;
• social and education policy, through the organisation of working patterns and school hours;
• urban transport policy at the local level and especially in large cities; and
• budgetary and fiscal policy, to link the internalisation of external, and especially environmental, costs with completion of the trans-European network.
E.7 The proposals put forward in the White Paper focus on sixty-odd measures to be taken at
Community level.
National (DfT, DCLG) Transport policy
E.8 National transport policy is set out in several documents, of which the foloowing are the most important:
• Transport White Paper, A New Deal for Transport (DfT, 1998) • Transport White Paper, The Future of Transport (DfT, 2004) • Smarter Choices – Changing the way we travel (DfT, 2004) • Tomorrow’s Roads – Safer for Everyone (DfT, 2000) • Social Exclusion Unit report, Making the Connections, • The Future of Rail White Paper (DfT 2004) • White Paper, The Future of Air Transport (DfT, 2003) • National Cycling Strategy (1996) • Motorcycle Strategy • The Ten-Year Transport Plan – Transport 2010 (DfT, 2000) • Transport Act 2000 • Stern report – The Economics of Climate Change (The Teasury,
2006) • The Eddington Transport Study: the Case for Action (DfT, 2006)
E.9 In the UK transport policy derives from the 1998 White Paper, A New Deal for Transport
(DfT, 1998) which set out the approach to transport planning, including introducing five-year Local Transport Plans (LTPs). The aim is to shift travel behaviour away from private car use towards greater use of more sustainable transport: public transport, walking and cycling.
E.10 The Ten-Year Transport Plan - Transport 2010 (DfT, 2000), allocated substantial funding to take initiatives forward. For example, it encourages innovative schemes to expand rural public transport as well as investment to provide safer roads with less impact on the environment.
E.11 A later Transport White Paper, The Future of Transport (DfT, 2004), set out three central themes of a strategy covering the next 30 years of transport policy and delivery in the UK:
• Sustained investment over the long term; • Improvements in transport management; and • Planning ahead.
E.12 The 2004 White Paper asserts the need to make “better trade-offs across different modes
of transport, and across the parallel agendas of regeneration and housing”, with better decision-making potentially being effected at the regional and local level.

H070130: Sevenoaks Transport Study Ref : Appendix E
E
E.13 Local authority actions should also be influenced by three other objectives from The Future of Transport. These aim to ensue that:
• The road network provides a more reliable and freer-flowing service for both personal travel and freight, with people able to make informed choices about how and when they travel;
• Bus services that are reliable, flexible, convenient and tailored to local needs; and
• Walking and cycling are real alternatives for local trips. E.14 Given the government’s desire to reduce car dependency and encourage other modes of
travel, it is promoting Smarter Choices – Changing the way we travel (DfT, 2004). Measures to be encouraged include workplace and school travel plans; personalised travel planning; travel awareness campaigns; public transport information and marketing; car clubs and car sharing schemes; teleworking, teleconferencing and home shopping. Such measures can be combined with traffic restraint measures to ensure that the road space freed up by smarter choices measures is not filled up with more cars by reallocating road space for more sustainable modes of transport, traffic light phasing, parking controls, congestion measures, traffic calming, pedestrian measures, speed enforcement etc. The government believes that a much more widespread implementation of present good practice could generate:
• A reduction in peak period urban traffic of about 21% (off-peak 13%); • A reduction of peak period non-urban traffic of about 14% (off-peak
7%); and • A nationwide reduction in all traffic of about 11%.
E.15 The DfT set out its ambitions for improving road safety in Tomorrow’s Roads – Safer for
Everyone (DfT, 2000). A new 10-year target was set and a new road safety strategy launched. The new targets aim to help everyone to focus on achieving a further substantial improvement in road safety over the next 10 years. By 2010 the DfT wants to achieve, compared with the average for 1994-98:
• A 40% reduction in the number of people killed or seriously injured in road accidents;
• A 50% reduction in the number of children killed or seriously injured; and
• A 10% reduction in the slight casualty rate, expressed as the number of people slightly injured per 100 million vehicle kilometres.
E.16 Although the nation’s overall record for child safety is relatively good, the child pedestrian
record is poor compared with some European countries. The government is particularly concerned about child safety and there is therefore a special focus in the strategy on reducing the number of children who are killed or injured in road accidents.
E.17 In 2003 the Social Exclusion Unit report, Making the Connections, identified the problems of social exclusion caused by poor access to the main services: healthcare; education; training and employment; and fresh food shopping. Responsibility was given to the DfT to take forward the government’s accessibility planning agenda to help those who are socially excluded to overcome the barriers to accessing services. Local authorities, with their partners, must now implement their accessibility strategy (part of the LTP) designed to improve access to local services and activities.

H070130: Sevenoaks Transport Study Ref : Appendix E
E
E.18 Railway policy is summarised in The Future of Rail White Paper, published by the DfT in 2004. This White Paper identified six key changes to build the right structure for the railway. These changes aim to drive up standards, improve overall performance and underline who is best placed to deliver:
• Government (through the DfT) has taken charge of setting the strategic direction of the railways;
• Network Rail has been given responsibility for operating the network, and crucially for its performance, timetabling and route utilisation;
• Train and track companies are expected to work more closely together e.g. via the introduction of joint control rooms;
• The role of the London Mayor is increasing, and more local decision making being introduced;
• The Office of the Rail Regulator covers safety, performance and economic regulation; and
• A better deal for freight is intended enabling the industry and its customers to invest for the long-term.
E.19 The White Paper's central assumption is that rail is a service specified by the public
sector and delivered by the private sector. That means:
• The Government setting the framework and the budget; • the Office of Rail Regulation bringing independent economic and
safety regulation; • Network Rail delivering an efficient network and taking the lead on
performance; and • Train companies delivering services for passengers.
E.20 The development of Thameslink and Crossrail in London, are seen as providing the
backbone of the network in the future. But significant growth in demand is expected - perhaps 30% or more over the next 20 years. Much of that growth will need to be accommodated within the present infrastructure.
E.21 1.14 The White Paper, The Future of Air Transport (DfT, 2003), sets out a strategic framework for the development of airport capacity in the United Kingdom over the next 30 years, against the wider context of the air transport sector. The government’s first priority is to make best use of the existing runways at the major South East airports. Beyond that, it supports the building of two new runways in the region in the period to 2030.
E.22 The National Cycling Strategy (1996) provides a framework for increasing the number of journeys made by bicycle. Originally it contained a headline target of quadrupling cycling trips between 1996 and 2012. Although this target has been dropped, in favour of more robust local targets set by local authorities, the government remains “strongly committed to the overall goals of the strategy.”
E.23 The key strategic objectives of the National Cycling Strategy are summarised as follows:
• Key destinations being more accessible by bicycle, including integration with public transport;
• Improved safety; • Road space and priority given to cyclists; • Cycle parking facilities at all major destinations; • Reduced levels of cycle theft (through better security devices and
registration schemes); • The dissemination of best practice and promotional programmes; • Adequate resources for cycling for local authorities, both staff and
funding; and • Monitoring of progress.

H070130: Sevenoaks Transport Study Ref : Appendix E
E
E.24 The Government’s Motorcycle Strategy requires authorities to take account of the needs
of motorcyclists, promoting safety measures and mainstreaming motorcycling, so that its needs are considered as fully as any other transport mode, in the development of transport policy.
E.25 Legislation enabling local authorities to enter into Quality Bus Partnerships and Contracts with operators was introduced by the Transport Act 2000. The Act also provides for the introduction of workplace parking charges and congestion charging, which, although of primary concern for urban areas, could significantly influence travel into towns from the countryside.
E.26 The Transport Act 2000 also introduced the requirement of local highway authorities to prepare Local Transport Plans (LTPs) through which local transport planning is carried out. Devised at local level in partnership with the community, LTPs set out 5-year comprehensive integrated transport strategies for their area, linked to local development and regeneration proposals. They also contain costed programmes to improve local transport, used as the basis for making capital allocations to local highway authorities. Sevenoaks District is covered by the Kent LTP, prepared by Kent County Council (KCC).
E.27 In UK transport policy terms, LTP2 is intended to take account of, and help deliver, the Government’s vision for transport set out in The Future of Transport: 2030, and in the Ten-Year Plan. The shared priorities for transport agreed between central and local Government are also central.
E.28 The recent publication of the Stern report, The Economics of Climate Change, will shift investment priorities towards sustainable transport modes and away from providing for higher traffic levels. Stern argues that there is still time to avoid the worst impacts of climate change, if we take strong action now. The scientific evidence is now overwhelming: climate change is a serious global threat, and it demands an urgent global response. This Review has assessed a wide range of evidence on the impacts of climate change and on the economic costs, and used a number of different techniques to assess costs and risks. From all of these perspectives, the evidence gathered by the Review leads to a simple conclusion: that the benefits of strong and early action far outweigh the economic costs of not acting. Climate change will affect the basic elements of life for people around the world – access to water, food production, health, and the environment. Using the results from formal economic models, the Review estimates that if we don’t act, the overall costs and risks of climate change will be equivalent to losing at least 5% of global GDP each year. If a wider range of risks and impacts is taken into account, the estimates of damage could rise to 20% of GDP or more. By contrast, the costs of action – reducing greenhouse gas emissions to avoid the worst impacts of climate change – can be limited to around 1% of global GDP each year.
E.29 Meanwhile, The Eddington Transport Study: the Case for Action (DfT, 2006) argues for Government to continue to deliver sustained investment, targeted in those places with significant congestion including improving access to the ports and airports. This Study demonstrates that the performance of the UK’s transport networks will be a crucial enabler of sustained productivity and competitiveness: a 5 per cent reduction in travel time for all business travel on the roads could generate around £2.5 billion of cost savings – some 0.2 per cent of GDP. Good transport systems support the productivity of urban areas, supporting productive labour markets, and allowing businesses to reap the benefits of agglomeration. Transport corridors are the arteries of domestic and international trade, boosting the competitiveness of the UK economy.
E.30 Correspondingly, transport policies offer some remarkable economic returns with many schemes offering benefits several times their costs, even once environmental costs have been factored in. To sustain future productivity, transport policy must reflect the economic and structural changes that are shaping the UK’s transport needs, according to Eddington. The significance of cities and large urban areas, as highly productive centres

H070130: Sevenoaks Transport Study Ref : Appendix E
E
of the service-based economy, is growing: 55 per cent of commuter journeys are to large urban areas and 89 per cent of delay caused by congestion is in urban areas.
E.31 Whilst much of the system works well, it is clear that some parts of the system are under severe strain, and looking ahead, significant transport challenges are looming. Continued economic success is forecast to lead to rising demands – if left unchecked 13 per cent of traffic will be subject to stop-start travel conditions by 2025. The study shows that the strategic economic priorities for long term transport policy should be growing and congested urban areas and their catchments; the key inter-urban corridors; and the key international gateways.
Land-use planning
E.32 A key driver of UK Government land-use policy is the Sustainable Communities Plan (2003) which sets out a long-term programme of action for delivering sustainable communities in both urban and rural areas. It aims to tackle housing supply issues in the South East and the quality of public spaces. It has formalised approaches to planning and redevelopment which hold social objectives as equally important as the physical elements of growth.
E.33 The Planning and Compulsory Purchase Act (2004) introduced a number of changes to the land-use planning system at the regional level. Regional Spatial Strategies (RSSs) will replace the Regional Planning Guidance (RPG) and the Regional Transport Strategy (RTS). For Sevenoaks District the RSS is being prepared by the Regional Planning Body, the South East of England Regional Assembly (SEERA) – see below. RSSs are more specific than RPG: strategy rather than guidance. They provide the spatial framework within which LTPs can be prepared, as well as Local Development Documents (LDDs). RSSs provide regional priorities for the environment, housing, economic development land development and re-development, as well as transport investment, over a 15 to 20 year period. LTPs must be consistent with these.
E.34 Local Development Documents (LDDs) contain a Local Development Framework (LDF). LDDs will replace local plans and the countywide Structure Plan. LDDs should be consistent with the Community Strategy for the area, and set out the spatial aspects for the delivery of the local authority’s vision for the area, as defined in the Community Strategy. An LDF will comprise development plan documents, supplementary planning documents, a statement of community involvement, a local development scheme and annual monitoring reports. For the majority of planning applications, the Local Planning Authority (LPA) is the District or Borough Council, such as Sevenoaks District Council (SDC).
E.35 In general the introduction of RSSs and the development of LDFs has brought about a shift in the focus of planning principles, whereby ‘spatial planning’ takes place rather than land use planning. This emphasis on the spatial dimension a whole town approach that deals with both the physical environment and the full range of activities within it to provide integrated technical, social, economic and design solutions.
E.36 The spatial approach is particularly suited to the current planning and development conditions in Sevenoaks District. Sites will come forward for development providing an opportunity to resolve some of the problems created by the piecemeal approach to development planning in the past.
E.37 National Planning Policy Guidance (PPG), which is currently being replaced with Planning Policy Statements (PPSs), supports national land-use policy. Of particular relevance are PPG 3 (Housing), PPS 6 (Planning for Town Centres), PPS 7 (Sustainable Development in Rural Areas), PPS 11 (Regional Spatial Strategies), PPS 12 (Local Development Frameworks) and PPG 13 (Transport). Local Planning Authorities must follow the principles of land-use planning set out in the PPGs and PPSs which are designed to influence the broad patterns of settlement and when they respond to individual development proposals.

H070130: Sevenoaks Transport Study Ref : Appendix E
E
E.38 Local Planning Authorities respond to proposals for development by determining planning applications. They are likely to consider the accessibility of a proposed development, as well as discussing with the developer the promotion of accessibility. SDC has a significant role to play in ensuring that key services are sited in the most accessible possible areas, and mixed land use in a central location accessible by several modes of transport.
PPG 13
E.39 The key aims of PPG13 (Transport) are to:
1. Promote sustainable transport choices for both people and for moving freight
2. Promote accessibility to jobs, shopping, leisure facilities and services by public transport, walking and cycling
3. Reduce the need to travel, especially by car E.40 This guidance sets out the circumstances where it is appropriate to change the emphasis
and priorities in provision between different transport modes, in pursuit of wider Government objectives. The car will continue to have an important part to play and for some journeys, particularly in rural areas, PPG13 acknowledges that it will remain the only real option for travel.
E.41 In order to deliver the objectives of PPG13, when preparing development plans and considering planning applications, local authorities should:
• actively manage the pattern of urban growth to make the fullest use of public transport, and focus major generators of travel demand in city, town and district centres and near to major public transport interchanges;
• locate day to day facilities which need to be near their clients in local centres so that they are accessible by walking and cycling;
• accommodate housing principally within existing urban areas, planning for increased intensity of development for both housing and other uses at locations which are highly accessible by public transport, walking and cycling;
• ensure that development comprising jobs, shopping, leisure and services offers a realistic choice of access by public transport, walking, and cycling, recognising that this may be less achievable in some rural areas;
• in rural areas, locate most development for housing, jobs, shopping, leisure and services in local service centres which are designated in the development plan to act as focal points for housing, transport and other services, and encourage better transport provision in the countryside;
• ensure that strategies in the development and local transport plan complement each other and that consideration of development plan allocations and local transport investment and priorities are closely linked;
• use parking policies, alongside other planning and transport measures, to promote sustainable transport choices and reduce reliance on the car for work and other journeys;
• give priority to people over ease of traffic movement and plan to provide more road space to pedestrians, cyclists and public transport in town centres, local neighbourhoods and other areas with a mixture of land uses;
• ensure that the needs of disabled people as pedestrians, public transport users and motorists - are taken into account in the implementation of planning policies and traffic management

H070130: Sevenoaks Transport Study Ref : Appendix E
E
schemes, and in the design of individual developments; consider how best to reduce crime and the fear of crime, and seek by the design and layout of developments and areas, to secure community safety and road safety; and
• protect sites and routes which could be critical in developing infrastructure to widen transport choices for both passenger and freight movements.
Regional Policy (SEERA, SEEDA) RPG6
E.42 In terms of regional policy, Regional Planning Guidance (RPG) 9 is the currently adopted guidance, covering the period to 2016 and providing a regional framework advocating economic success and environmental improvement through a more sustainable pattern of development. The South East England Regional Assembly (SEERA) has produced a draft South East Plan, the Regional Spatial Strategy (RSS), which will replace RPG9 when adopted by the Government.
South East Plan
E.43 The South East Plan is expected to be adopted in 2007 or 2008. It sets out the required housing provision for the area: the distribution of the 122,000 new dwellings in Kent concentrates provision in the growth areas of Ashford, Medway and Dartford. This growth has the potential to generate significant demand for travel across the County and so there needs to be commensurate improvements to the major road network, rail and bus services, and funding for maintenance and integrated transport measures. Demand management is expected in the RSS to be key to enabling the residents and businesses of Kent to function effectively in the future.
RTS
E.44 The Regional Transport Strategy (RTS) provides the regional framework to ensure that the investment by local transport authorities and other transport organisations support the wider regional objectives. In the RTS policies on transport are focussed on a set of core principles – managing and investing in the network, the rural dimension, regional hubs and spokes, communication technology, mobility management, road pricing and charging, gateways and freight. The RTS also contains policies and priorities for investment in transport, and identifies the LTP as one of the delivery mechanisms for this investment.
E.45 The RTS stresses the need for local authorities to give priority to improving accessibility by public transport, walking and cycling at transport hubs as well as encouraging higher density development and giving priority to high quality interchange facilities.
RES
E.46 Regional Development Agencies (RDAs) are “strategic drivers of regional economic development in their region”, and produce Regional Economic Strategies (RESs), identifying the economic priorities for the region and their land-use and transport implications with a 5 to 10 year Action Plan. Under the Regional Development Agencies Act 1988, each RDA has five statutory purposes, as follows:
• To further economic development and regeneration; • To promote business efficiency, investment and competitiveness; • To promote employment; • To enhance development and application of skill relevant to
employment; and • To contribute to sustainable development.

H070130: Sevenoaks Transport Study Ref : Appendix E
E
E.47 The Regional Economic Strategy (RES) for South East England, published by the South East England Development Agency (SEEDA), is built on six drivers of regional prosperity, one of which is the recognition of the need to develop better infrastructure, including a more effective transport system. The draft RES identifies key actions in Kent which are required to improve the connectivity of the transport network and reflect regional economic priorities. These include improved surface access to Dover, maximising traffic on the Channel Tunnel Rail Link (CTRL), transport projects in the Thames Gateway and Ashford, and completion of the Thameslink project.
The London Plan 2004
E.48 London has a significant impact on the Sevenoaks District. Around 40% of the working population commutes into the capital for work. The county has good radial routes (both road and rail) from London, but these are often operating at (or near) capacity. Published in 2004, the London Plan (The Spatial Development Strategy) sets out the vision of the Mayor to address the issues arising from planned growth. The aim is to develop London as a sustainable world city, based on three interwoven themes:
• Strong, diverse long term economic growth; • Social inclusivity to give all Londoners the opportunity to share in
London’s future success; and • Fundamental improvements in London’s environment and use of
resources.

F appendix
Appendix F Community Plan
Public Consultation

H070130: Sevenoaks Transport Study Ref : Appendix F
F
Community Plan Public Consultation F.1 Among the priorities set out by residents of Sevenoaks District the following relate to
land-use planning and transport:
• Design safe public areas; • Make roads and footways safer for pedestrians; • Make public transport safer; • Provide good support that is local and accessible; • Give better access to services for people in rural areas; • Increase opportunities for older people; • Work to reduce social exclusion in identified areas; • Protect the natural beauty of the District; • Protect the historic character of towns and villages; • Deal with the tension between the need for affordable housing and
employment land and the need to protect the landscape; • Protect open spaces; • Promote fuel economy measures and conserve natural resources; • Improve air quality; • Promote green transport; walking, buses, cycling; • More services should be delivered locally; • Support and maintain community hospitals; • Provide more outreach services; • Promote use of leisure facilities and open spaces; • Ensure access to local services and facilities for people with
disabilities; • Reuse buildings for employment uses; • Enable people to work where they live; • New housing developments should provide better parking; • Enable people with disabilities to access transport; • Promote existing transport links; • Deal with congestions, potholes and poor pavements; • Provide a more flexible transport system e.g. dedicated bus services;
and • Cycling and other green transport is important.

G appendix
Appendix G Transport data bank

H07
0130
: Sev
enoa
ks T
rans
port
Stu
dy
Ref
: A
ppen
dix
G
G
T G
1 Se
veno
aks
data
ban
k
Cod
eW
hat i
s th
e na
me
of th
e da
ta s
et?
Can
you
br
iefly
de
scrib
e th
e da
ta s
et?
Wha
t ge
ogra
phic
al
area
is
cove
red?
• S
peci
fic
loca
tion
• War
d • T
own
• Dis
trict
• C
ount
y • R
egio
n
Wha
t tim
e pe
riod
does
th
e da
ta
cove
r?
Wha
t lev
el o
f di
s-ag
greg
atio
n do
es th
e da
ta
set g
o to
: • T
rans
port
mod
e • G
ende
r • A
ge g
roup
• D
isab
ility
How
was
the
data
ga
ther
ed?:
• A
utom
atic
co
unts
• V
isua
l su
rvey
• I
nter
view
su
rvey
• P
osta
l su
rvey
• D
iary
re
cord
s • F
ocus
gro
up
disc
ussi
on
In w
hat f
orm
at
is th
e da
ta s
et
held
: • P
aper
• E
lect
roni
c
Who
is th
e ho
lder
of t
he
data
set
?
Wha
t are
thei
r con
tact
det
ails
: • O
rgan
isat
ion
• Add
ress
• T
el n
umbe
r • E
mai
l
Qua
lity
of d
ata:
• f
or in
form
atio
n on
ly
• qua
ntita
tive
data
use
d as
in
dica
tor o
nly
• rob
ust
quan
titat
ive
data
01
Driv
ers
reco
rds
BS
OG
dat
a,
mile
age
per
day
to d
ay
cent
res,
lunc
h cl
ubs,
sh
oppi
ng tr
ips
Sev
enoa
ks
area
A
ggre
gate
da
ta fo
r 7
year
s, b
ut n
o in
divi
dual
da
ta
Con
fiden
tial,
mile
age
per
day,
de
stin
atio
ns/
clie
nts,
hi
stor
ic
agge
gate
da
ta w
ould
re
quire
re
sear
ch
Driv
er re
cord
s P
aper
G
ill
She
pher
d-C
oate
s
Age
Con
cern
Sev
enoa
ks
The
Cob
dden
Cen
tre
Cob
den
Roa
d S
even
oaks
TN
13 3
UB
01
732
4541
08
offic
e@ag
econ
cern
7oak
s.co
.uk
Qua
ntita
tive
data
use
d as
in
dica
tor o
nly
02
Dar
tford
/ S
even
oaks
M
inib
us
Eld
erly
peo
ple
usin
g m
inib
us
to tr
avel
to
city
cen
tre
Wou
ld n
eed
to e
xtra
ct d
ata
man
ually
(S
even
oaks
m
inib
us a
nd
one
12
seat
er)
N/A
G
ende
r; A
ge
Sch
edul
es fo
r dr
iver
s P
aper
and
el
ectro
nic,
but
di
fficu
lt to
ex
tract
John
Arn
old
Age
Con
cern
Sw
anle
y S
wan
ley
Hig
h S
treet
S
wan
ley
BR
8 8A
E
0132
2 66
6118
ag
econ
cern
@ic
24.n
et
For i
nfor
mat
ion
only
03
Pas
seng
er
Boa
rdin
gs
S
even
oaks
D
istri
ct
Cou
ncil
Ann
ual
Tran
spor
t M
ode
i.e
AR
RIV
A B
us
Ser
vice
s
From
el
ectro
nic
ticke
t m
achi
ne d
ata
Ele
ctro
nic
Mal
colm
S
pald
ing
(als
o su
pplie
d to
K
CC
)
AR
RIV
A S
outh
ern
Cou
ntie
s In
vict
a H
ouse
A
rmst
rong
Roa
d M
aids
tone
01
622
6970
00
spal
ding
sm.s
c@ar
riva.
co.u
k
Rob
ust
quan
tata
tive
data

H07
0130
: Sev
enoa
ks T
rans
port
Stu
dy
Ref
: A
ppen
dix
G
G
04
S
ched
ule
Dat
a Tr
avel
to d
ay
cent
res/
sh
oppi
ng b
y m
obili
ty-
impa
ired
(usi
ng 8
ve
hicl
es in
cl 6
m
inib
uses
w
ith li
fts)
Ken
t (in
clud
ing
Sev
enoa
ks),
Surre
y
7 ye
ars
No
pers
onal
da
ta k
ept;
mile
ages
and
or
igin
al-
dest
inat
ion
data
ava
ilabl
e
Sch
edul
es o
f ov
er 1
00
jour
neys
per
da
y (5
day
s a
wee
k)
Pap
er &
E
lect
roni
c B
etty
How
ell
(CE
xec)
C
ompa
id T
rust
29
Her
ons
Way
P
embu
ry
Tunb
ridge
Wel
ls
TN2
4DW
01
892
8240
60
For i
nfor
mat
ion
only
05
CE
NS
US
20
01
UK
-wid
e tra
vel
beha
viou
s in
form
atio
n
Var
ious
le
vels
: E
ngla
nd,
Cou
nty,
D
istri
ct, L
A,
War
d, S
uper
O
utpu
t Are
as
2001
Tr
ansp
ort
Mod
e, A
ge,
Hou
seho
ld
size
Pos
tal s
urve
y E
lect
roni
c O
ffice
for
Nat
iona
l S
tatis
tics
(ON
S)
Cus
tom
er C
onta
ct C
entre
R
oom
1.0
15
Offi
ce fo
r Nat
iona
l Sta
tistic
s C
ardi
ff R
oad
New
port
NP
10 8
XG
08
45 6
01 3
034
http
://w
ww
.sta
tistic
s.go
v.uk
/cen
sus/
defa
ult.a
sp
Rob
ust
quan
tata
tive
data
06
Ede
nbrid
ge
Hea
lth C
heck
N
K
Tow
n &
Loc
al
Dis
tric
N/A
A
ll as
pect
s of
to
wn
in
clud
ing
trans
port
N/A
N
/A
Chr
istin
e La
ne, T
own
Cle
rk
Ede
nbrid
ge T
own
Cou
ncil
Dog
getts
Bar
n 72
A H
igh
Stre
et
Ede
nbrid
ge K
ent
TN8
5AR
01
732
8653
68
cler
k@ed
enbr
idge
tc.k
entp
aris
hes.
gov.
uk
Qua
ntita
tive
data
use
d as
in
dica
tor o
nly/
fo
r inf
orm
atio
n on
ly
07
TRA
DS
da
taba
se
Rec
ent t
raffi
c flo
w d
ata
from
H
A n
etw
ork
Mot
orw
ay
Net
wor
k O
ngoi
ng
No
disa
ggre
gatio
n
ATC
E
lect
roni
c H
ighw
ays
Age
ncy
Hig
hway
s A
genc
y ht
tp://
ww
w.tr
ads2
.co.
uk/
requ
est l
ogin
thro
ugh
ht
tp://
ww
w.tr
ads2
.co.
uk/tr
adsi
i/ ad
min
_use
r_re
ques
t_ad
d.ph
p
Rob
ust
quan
tata
tive
data
08
Ken
t Cou
nty
Cra
sh
Dat
abas
e
Con
tain
s in
form
atio
n on
al
l per
sona
l in
jury
cra
shes
th
at h
ave
occu
rred
in
the
Cou
nty
over
the
mos
t re
cent
10
year
per
iod.
The
who
le
Cou
nty.
10
yea
rs
D-re
port
info
rmat
ion
from
Ken
t P
olic
e, h
ow
the
acci
dent
ha
ppen
ed,
time,
dat
e,
wea
ther
co
nditi
ons,
fo
rm o
f tra
nspo
rt in
volv
ed e
tc.
From
Ken
t P
olic
e cr
ash
repo
rts.
Ele
ctro
nic
Jaco
bs B
abtie
Ja
cobs
Bab
tie
Mill
er H
ouse
43
-51
Low
er S
tone
Stre
et
Mai
dsto
ne
ME
15 6
GB
01
622
6660
00
Rob
ust
quan
tata
tive
data

H07
0130
: Sev
enoa
ks T
rans
port
Stu
dy
Ref
: A
ppen
dix
G
G
09
Tr
affic
dat
a C
onta
ins
info
rmat
ion
on
all t
raffi
c su
rvey
s th
at
have
bee
n ca
rrie
d ou
t, co
unt/s
peed
/orig
in-
dest
inat
ion/
tim
e de
lay/
queu
e le
ngth
etc
.
Spe
cific
lo
catio
ns
arou
nd th
e C
ount
y w
here
su
rvey
s ha
ve
been
car
ried
out.
10 y
ears
S
ome
surv
eys
incl
ude
clas
sifie
d co
unts
(typ
e of
traf
fic).
Aut
omat
ic
and
man
ually
de
pend
ing
on
the
type
of
surv
ey c
arrie
d ou
t.
Ele
ctro
nic
Jaco
bs B
abtie
Jaco
bs B
abtie
M
iller
Hou
se
43-5
1 Lo
wer
Sto
ne S
treet
M
aids
tone
M
E15
6G
B
0162
2 66
6000
Rob
ust
quan
tata
tive
data
10
Traf
fic F
low
C
ount
s R
ecen
t tra
ffic
flow
dat
a fro
m
HA
net
wor
k
M20
, M25
, M
26, A
21
Ong
oing
N
o di
sagg
rega
tion;
som
e A
TC
reco
gnis
e m
odes
axl
e co
unts
,
ATC
, in
duct
ion
loop
E
lect
roni
c Ja
cobs
Bab
tieJa
cobs
Bab
tie
Sch
ool G
reen
S
hinf
ield
R
eadi
ng
Ber
kshi
re
RG
2 9H
L 01
18 9
88 1
555
hatra
ffic@
jaco
bs.c
om
Rob
ust
quan
tata
tive
data
11
Cou
ntry
side
A
cces
s Im
prov
emen
t P
lan
GIS
Map
ping
sy
stem
co
ntai
ning
su
gges
ted
impr
ovem
ents
to
righ
ts o
f w
ay. I
nclu
des
exis
ting
RO
W
netw
ork,
w
alki
ng b
us
rout
es,
prom
oted
ro
utes
. E.t.
c
Ken
t N
/A
All
Inte
rvie
w,
Focu
s G
roup
s an
d R
esea
rch
Ele
ctro
nic
Col
in F
inch
K
ent C
ount
y C
ounc
il 2n
d flo
or
Invi
cta
Hou
se
Cou
nty
Hal
l M
aids
tone
M
E14
1X
X
0162
2 69
6322
co
lin.fi
nch@
kent
.gov
.uk
Rob
ust
quan
tata
tive
data
12
Sch
ool D
ata
(PLA
SC
) Jo
urne
y to
sc
hool
A
ll sc
hool
s in
K
ent (
not
priv
ate?
)
Day
of t
he
surv
ey
Tran
spor
t M
ode
Han
ds u
p su
rvey
H
opef
ully
el
ectro
nic
(don
’t ha
ve it
ye
t)
KC
C
Edu
catio
n, v
ia
Dav
id J
oyne
r,
Sus
tain
able
Tr
ansp
ort
Man
ager
Ken
t Cou
nty
Cou
ncil
Roo
m IH
-1
Invi
cta
Hou
se
Cou
nty
Hal
l M
aids
tone
M
E14
1X
X
davi
d.jo
yner
@ke
nt.g
ov.u
k 01
622
6968
52
For i
nfor
mat
ion
only

H07
0130
: Sev
enoa
ks T
rans
port
Stu
dy
Ref
: A
ppen
dix
G
G
13
K
ent T
rave
l R
epor
t (20
05)
Traf
fic a
nd
mod
e sp
lit
data
Var
ious
site
s ac
ross
Ken
t V
ario
us
Veh
icle
flow
s an
d so
me
mod
e sh
are
acro
ss to
wn
cent
re
cord
ons
(pos
sibl
y S
even
oaks
?)
Aut
omat
ic
coun
ts
Vis
ual s
urve
y
Ele
ctro
nic
John
Luc
ock
Ken
t Cou
nty
Cou
ncil
Stra
tegy
Tea
m
Invi
cta
Hou
se
Cou
nty
Hal
l M
aids
tone
M
E14
1XX
Rob
ust
quan
tata
tive
data
14
Con
man
06
/07
Dat
aset
co
ntai
ns
rele
vant
in
form
atio
n so
th
at K
CC
are
ab
le to
as
sess
pe
rform
ance
of
its
supp
orte
d se
rvic
es
KC
C
supp
orte
d bu
s se
rvic
es
assi
gned
to
Sev
enoa
ks
Dis
trict
Apr
il 20
06 to
M
arch
20
07(p
erio
ds
Feb
& M
arch
es
timat
ed
from
per
iod
1 to
10
data
)
Onl
y su
bdiv
ided
in
to re
venu
e,
rura
l gra
nt
fund
s an
d se
rvic
e m
ileag
e;*
Rev
enue
su
ppor
t pax
. –
484,
795*
R
ural
fund
se
rvic
e pa
x. –
76
,844
* To
tal
serv
ice
mile
age
– 65
5,82
9 m
iles*
N
umbe
r of
supp
orte
d se
rices
– 3
8
Man
ual
retu
rns
are
prov
ided
by
oper
ator
s co
ntra
cted
to
KC
C a
s pa
rt of
con
rtact
t&
c
Pap
er
Tran
spor
t In
tegr
atio
n K
ent C
ount
y C
ounc
il Tr
ansp
ort I
nteg
ratio
n G
ibso
n D
rive
Kin
gs H
ill
Wes
t Mal
ling
ME
19 4
QG
Qua
ntita
tive
data
use
d as
in
dica
tor o
nly
15
Nat
iona
l P
asse
nger
S
urve
y
Info
rmat
ion
cove
ring
satis
fact
ion
leve
ls o
f cu
stom
er fo
r 31
diffe
rent
m
arke
rs
By
Sou
ther
n ne
twor
k A
nnua
l N
one
By
surv
ey
Ele
ctro
nic
Pas
seng
er
Focu
s P
asse
nger
Foc
us
http
://w
ww
.pas
seng
erfo
cus.
org.
uk/
your
-exp
erie
nces
/con
tent
.asp
Qua
ntita
tive
data
use
d as
in
dica
tor o
nly
16
Tran
spor
t to
Hos
pita
l M
ileag
e of
ca
rs
Driv
e ou
tsid
e S
DC
are
a,
Pem
bury
, S
usse
x,
Lond
on, M
25
Bac
k to
be
yond
200
0 41
,000
mile
s pe
r yea
r ap
prox
imat
ely
, no
mor
e de
tail,
35
volu
ntar
y dr
iver
s
Rec
ords
of
volu
ntar
y dr
iver
s cl
aim
s
Pap
er,
Ann
ual
coun
ts
Brid
get H
arris
P
ublic
Tra
nspo
rt M
anag
er
Ede
nbrid
ge V
olun
tary
Tra
nspo
rt A
genc
y 40
Ede
nbrid
ge H
ospi
tal
Mill
Hill
E
denb
ridge
TN
8 5D
A
0173
2 86
5353
bc
hl@
brid
geth
arris
.free
serv
e.co
.uk
Qua
ntita
tive
data
use
d as
in
dica
tor o
nly

H07
0130
: Sev
enoa
ks T
rans
port
Stu
dy
Ref
: A
ppen
dix
G
G
17
S
tatio
n U
sage
In
dica
tes
pass
enge
r de
man
d us
ing
Tick
et a
nd
sale
s re
venu
e.
Sho
ws
estim
ates
of
the
num
bers
of
ent
ries,
ex
its a
nd
inte
rcha
nges
at
eve
ry
stat
ion.
Nat
iona
lly
data
–
avai
labl
e by
ea
ch s
tatio
n.
Ann
ual
Non
e –
by
pass
enge
r on
ly.
The
estim
ates
ar
e de
rived
fro
m
LEN
NO
N
(sal
es d
ata)
, ba
sed
on th
e or
igin
, de
stin
atio
n an
d ro
ute
code
in
form
atio
n.
Exc
el
spre
adsh
eet
Offi
ce o
f Rai
l R
egul
ator
R
ail R
egul
ator
ht
tp://
ww
w.ra
il-re
g.go
v.uk
/ser
ver/s
how
/nav
.137
9
Rob
ust
quan
tata
tive
data
18
Sch
ool T
rave
l P
lans
N
o of
sch
ools
w
ith s
choo
l Tr
avel
Pla
ns
SD
C s
choo
ls
oper
atin
g S
choo
l Tra
vel
Pla
ns
Cur
rent
S
ome
data
on
trans
port
mod
es
App
licat
ion/
in
form
atio
n pr
ovis
ion
Pap
er
Hay
ley
Bro
oks
SD
C C
ounc
il O
ffice
s A
rgyl
e R
oad
Sev
enoa
ks
TN13
1H
C
0173
2 22
7272
For i
nfor
mat
ion
only
19
Stre
ets
Ahe
ad
Prim
ary
child
ern
wal
king
to
scho
ol
15 S
DC
sc
hool
s co
verin
g 2,
500
child
ren
2001
-200
6,
exce
pt 2
004
Tran
spor
t m
ode,
not
for
seco
ndar
y sc
hool
s
Vus
ual
curv
ey,
lead
ing
to
writ
ten
surv
ey
colle
cted
by
scho
ols
Pap
er, f
rom
no
w in
sp
eads
heet
Hay
ley
Bro
oks
SD
C C
ounc
il O
ffice
s A
rgyl
e R
oad
Sev
enoa
ks
TN13
1H
C
0173
2 22
7272
For i
nfor
mat
ion
only
20
Wal
king
B
uses
N
o of
sch
ools
w
ith w
alki
ng
buse
s
4 S
DC
sc
hool
s op
erat
e w
alki
ng b
uses
Cur
rent
D
ata
on
child
ren
cove
red
coul
d be
got
App
licat
ion/
in
form
atio
n pr
ovis
ion
Pap
er
Hay
ley
Bro
oks
SD
C C
ounc
il O
ffice
s A
rgyl
e R
oad
Sev
enoa
ks
TN13
1H
C
0173
2 22
7272
For i
nfor
mat
ion
only
21
Par
king
or
ders
C
opie
s of
TO
s B
uilt-
up
area
s; m
aps
with
re
stric
tions
of
on/ o
ff-st
reet
pa
rkin
g;
char
ges
(Cou
ncil-
man
aged
); no
st
atio
n da
ta
His
troric
al
Leng
ths
of
road
; pla
ns
for f
utur
e re
stric
tions
; ca
r par
k sc
ales
/ ca
paci
ty
Vis
ual s
urve
y;
man
ual
coun
ts o
f car
pa
rk u
se
(onc
e pe
r m
onth
); tic
ket
sale
info
Pap
er
(Ele
ctro
nic
in
futu
re)
And
y B
race
y S
even
oaks
DC
Cou
ncil
Offi
ces
Arg
yle
Roa
d S
even
oaks
TN
13 1
HG
01
732
2270
00
Par
tly
quan
titat
ive
data
us
ed a
s in
dica
tor o
nly

H07
0130
: Sev
enoa
ks T
rans
port
Stu
dy
Ref
: A
ppen
dix
G
G
22
A
ir Q
ualit
y P
ollu
tant
pr
edic
tions
, po
lluta
nt
mea
sure
men
t
AQ
MA
s:
Sev
enoa
ks
Hig
hStre
et;
A21
Bat
&
Bal
l Jct
n; A
25
Sea
l hig
h S
treet
; W
este
rham
hi
gh S
treet
; R
iver
head
A
25/ A
224;
S
wan
ley
Tow
n C
entre
; M
25, M
26,
M20
, A20
(S
wan
ley
Byp
ass)
; A
224
Riv
erhe
ad
5 ye
ars
(old
est);
1
year
(rec
ent
AQ
MA
s)
Nox
(Diff
usio
n tu
bes)
; PM
10;
back
grou
nd
site
for r
ange
of
pol
luta
nts
Diff
usio
n tu
bes;
man
ual
diffu
sion
tu
bes
Ele
ctro
nic
Mal
colm
W
ebb
(SD
C)/
Kin
gs C
olle
ge
Lond
on
Sev
enoa
ks D
C C
ounc
il O
ffice
s A
rgyl
e R
oad
Sev
enoa
ks
TN13
1H
G
0173
2 22
7000
Rob
ust
quan
tata
tive
data
23
Dun
ton
Gre
en
Traf
fic D
ata
ATC
, MC
C,
Que
ue
leng
ths
A22
4 Lo
ndon
R
oad
- D
unto
n G
reen
(S
tatio
n R
oad,
Tes
co)
Nov
/ Dec
20
06
ATC
: Non
e,
MC
C:
Tran
spor
t M
ode
Aut
omat
ic
(spe
ed b
in),
man
ual
coun
ts
Ele
ctro
nic
Mat
thew
H
ogbe
n S
even
oaks
DC
Cou
ncil
Offi
ces
Tran
spor
tatio
n A
rgyl
e R
oad
Sev
enoa
ks
TN13
1H
G
0173
2 22
7357
m
att.h
ogbe
n@se
veno
aks.
gov.
uk
Rob
ust
quan
tata
tive
data
24
Farn
ingh
am
Traf
fic D
ata
ATC
, MC
C,
Que
ue
leng
ths
A20
Lon
don
Rd
Farn
ingh
am
Nov
/ Dec
20
06
ATC
: Non
e,
MC
C:
Tran
spor
t M
ode
Aut
omat
ic
(spe
ed b
in),
man
ual
coun
ts
Ele
ctro
nic
Mat
thew
H
ogbe
n S
even
oaks
DC
Cou
ncil
Offi
ces
Tran
spor
tatio
n A
rgyl
e R
oad
Sev
enoa
ks
TN13
1H
G
0173
2 22
7357
m
att.h
ogbe
n@se
veno
aks.
gov.
uk
Rob
ust
quan
tata
tive
data
25
Net
wor
k A
cces
sibi
lity
to T
he 7
oaks
D
C o
ffice
s
Pub
lic
trans
port
acce
ssib
ility
to
Sev
enoa
ks
tow
n ce
ntre
Ken
t C
urre
nt
(200
7)
Non
e N
/A
Map
ping
(E
lect
roni
c)
with
in s
taff
trave
l pla
n
Mat
thew
H
ogbe
n S
even
oaks
DC
Cou
ncil
Offi
ces
Tran
spor
tatio
n A
rgyl
e R
oad
Sev
enoa
ks
TN13
1H
G
0173
2 22
7357
m
att.h
ogbe
n@se
veno
aks.
gov.
uk
For i
nfor
mat
ion
only

H07
0130
: Sev
enoa
ks T
rans
port
Stu
dy
Ref
: A
ppen
dix
G
G
26
R
iver
head
Tr
affic
Dat
a A
TC, M
CC
, Q
ueue
le
ngth
s
A22
4 Lo
ndon
R
oad
- D
unto
n G
reen
(B
ullfi
nch,
R
iver
head
)
Nov
/ Dec
20
06
ATC
: Non
e,
MC
C:
Tran
spor
t M
ode
Aut
omat
ic
(spe
ed b
in),
man
ual
coun
ts
Ele
ctro
nic
Mat
thew
H
ogbe
n S
even
oaks
DC
Cou
ncil
Offi
ces
Tran
spor
tatio
n A
rgyl
e R
oad
Sev
enoa
ks
TN13
1H
G
0173
2 22
7357
m
att.h
ogbe
n@se
veno
aks.
gov.
uk
Rob
ust
quan
tata
tive
data
27
Sev
enoa
ks
Traf
fic D
ata
ATC
, MC
C,
Que
ue
leng
ths
A22
4 Tu
bs
Hill
- S
even
oaks
, A
224
Lond
on
Roa
d -
Sev
enoa
ks
Nov
/ Dec
20
06
ATC
: Non
e,
MC
C:
Tran
spor
t M
ode
Aut
omat
ic
(spe
ed b
in),
man
ual
coun
ts
Ele
ctro
nic
Mat
thew
H
ogbe
n S
even
oaks
DC
Cou
ncil
Offi
ces
Tran
spor
tatio
n A
rgyl
e R
oad
Sev
enoa
ks
TN13
1H
G
0173
2 22
7357
m
att.h
ogbe
n@se
veno
aks.
gov.
uk
Rob
ust
quan
tata
tive
data
28
Eld
erly
S
hopp
ing
Bus
S
ervi
ce
Nam
es o
f re
gist
ered
us
ers
This
ser
vice
s co
vers
the
who
le o
f the
di
stric
t are
a
Last
two
year
s N
ame
&
addr
ess,
ge
nder
, de
stin
atio
ns
Aut
omat
ic
Cou
nts
Pap
er &
E
lect
roni
c D
irect
S
ervi
ces
Sev
enoa
ks D
irect
Ser
vice
s D
unbr
ik D
epot
2
Mai
n R
oad
S
undr
idge
, Ken
t st
eve.
alla
rd@
seve
noak
s.go
v.uk
Qua
ntita
tive
data
use
d as
in
dica
tor o
nly
29
Brig
hter
Fu
ture
s P
roje
ct
Not
just
tra
nspo
rt, b
ut
to h
elp
elde
rly
mai
ntai
n ac
tive
lifes
tyle
NA
Q
uarte
rly d
ata
sinc
e N
ov
2005
Jour
ney
type
: G
ende
r: D
estin
atio
n (h
ospi
tal/
soci
al a
ctiv
ity
eg.
shop
ping
); A
ge: M
obili
ty
impa
irmen
ts
but n
o w
ider
an
alys
is
Boo
king
s of
dr
iver
sta
ff re
cord
s
Ele
ctro
nic
(Acc
ess
data
base
)
Man
dy
Wyn
ne
Sev
enoa
ks V
olun
teer
Bur
eaux
34
Buc
khur
st A
venu
e S
even
oaks
TN
13 1
LZ
0173
2 45
4785
in
fo@
seve
noak
svol
unte
ers.
org.
uk
For i
nfor
mat
ion
only
30
Pas
seng
er
Num
bers
se
e ab
ove
Tow
n &
C
ount
ry
2001
to d
ate
Tran
spor
t m
ode
Aut
omat
ic
coun
ts
Ele
ctro
nic
Pet
er E
ldrid
geS
outh
east
ern
Rai
lway
41
-45
Bla
ckfri
ars
Roa
d Lo
ndon
S
E1
8PG
02
0 76
20 5
200
pete
r.eld
ridge
@so
uthe
aste
rnra
ilwa
y.co
.uk
Rob
ust
quan
tata
tive
data
31
Sta
tion
foot
fall
figur
es
see
abov
e To
wn
&
Cou
ntry
20
01 to
dat
e Tr
ansp
ort
mod
e A
utom
atic
co
unts
E
lect
roni
c P
eter
Eld
ridge
Sou
thea
ster
n R
ailw
ay
41-4
5 B
lack
friar
s R
oad
Lond
on
SE
1 8P
G
020
7620
520
0 pe
ter.e
ldrid
ge@
sout
heas
tern
railw
ay.
co.u
k
Rob
ust
quan
tata
tive
data

H07
0130
: Sev
enoa
ks T
rans
port
Stu
dy
Ref
: A
ppen
dix
G
G
32
C
ompl
aint
/ Q
uery
dat
a A
ll co
ntac
ts to
ou
r cus
tom
er
serv
ices
de
partm
ent
By
post
code
E
very
4
wee
ks
Non
e A
utom
atic
E
lect
roni
c S
outh
ern
Rai
lway
S
outh
ern
Rai
lway
yv
onne
.lesl
ie@
sout
hern
railw
ay.c
om
For i
nfor
mat
ion
only
33
Per
form
ance
S
how
s th
e nu
mbe
r of
train
s ar
rivin
g on
tim
e.
All
area
s.
Dai
ly,
mon
thly
, m
ovin
g an
nual
av
erag
e
1. P
eak
time
train
s to
and
fro
m L
ondo
n.2.
All
train
s,
ever
y da
y
Aut
omat
ic
Ele
ctro
nic
Sou
ther
n R
ailw
ay
Sou
ther
n R
ailw
ay
yvon
ne.le
slie
@so
uthe
rnra
ilway
.co
m
Rob
ust
quan
tata
tive
data
34
Trai
n lo
adin
gs
Indi
cato
rs o
f ho
w m
any
pass
enge
rs
are
on a
trai
n at
any
one
tim
e
By
train
A
ny/a
nnua
l co
unts
N
one
Som
e au
tom
atic
th
rouh
au
tom
atic
w
eigh
ing
equi
pmen
t; so
me
thro
ugh
man
ual
coun
ts
Ele
ctro
nic
Sou
ther
n R
ailw
ay
Sou
ther
n R
ailw
ay
yvon
ne.le
slie
@so
uthe
rnra
ilway
.co
m
Rob
ust
quan
tata
tive
data
35
Nat
iona
l C
ycle
N
etw
ork
Map
of
netw
ork,
rout
e m
ap o
f su
gges
ted
regi
onal
rout
e
Ken
t C
urre
nt
(200
7)
Non
e N
/A
Ele
ctro
nic
Dav
id Y
oung
S
ustra
ns
Pro
ject
s C
o-or
dina
tor S
outh
Eas
t Li
ttle
Gre
gg B
arn
Gre
gg L
ane
Hea
dcom
TN
27 9
LT
0162
2 89
2368
da
vida
ndja
yne.
youn
g@te
sco.
net
For i
nfor
mat
ion
only
36
Peg
asus
C
lient
st
atis
tics:
m
onth
ly
usag
e;
mile
age;
de
stin
atio
ns
(500
dat
a se
ts)
NA
Fr
om 2
000
(Pap
er)
From
Mar
ch
2007
(E
lect
roni
c)
Pro
file:
Blu
e B
adge
: D
octo
r: D
ate
of B
rith:
N
ame
&
addr
ess:
m
obili
ty
Impa
irmen
t: de
stin
atio
n
Dia
ry b
ased
fro
m d
river
P
aper
(fro
m
2000
); E
lect
roni
c (fr
om M
arch
20
07)
Apu
line
Ann
etts
S
wan
ley
Vol
unte
er C
entre
Li
brar
y &
Info
Cen
tre
Lond
on R
oad
Sw
anle
y B
R8
7AE
08
45 2
41-2
180
info
@sw
anle
yvol
unte
er.o
rg.u
k
Qua
ntita
tive
data
use
d as
in
dica
tor o
nly

H07
0130
: Sev
enoa
ks T
rans
port
Stu
dy
Ref
: A
ppen
dix
G
G
37
LA
TS S
urve
y M
ultim
odal
or
igin
-de
stin
atio
n da
ta b
ased
on
road
side
in
terv
iew
s,
hous
ehol
d in
terv
iew
s an
d tra
ffic
coun
ts
Lond
on a
nd
the
neig
hbou
ring
dist
ricts
and
ar
e av
aila
ble
at L
ondo
n bo
roug
h,
war
d,
post
code
di
stric
t and
tra
nspo
rt zo
ne le
vels
1991
, ong
oing
de
cenn
ially
P
osta
l A
ddre
ss;
hous
ehol
d su
rvey
ca
ptur
ed
hous
ehol
ds;
road
side
and
pu
blic
tra
nspo
rt su
rvey
s ca
ptur
ed
indi
vidu
al
trips
.
60,0
00
hous
ehol
ds in
H
I sur
vey,
ov
er 8
00 R
SI
site
s, la
rge-
scal
e P
ublic
tra
nspo
rt su
rvey
s
Ele
ctro
nic
TfL
TfL
Rom
ulus
ht
tp://
rom
ulus
.tfl.g
ov.u
k/w
ebvi
ew/
requ
est l
ogin
from
ro
mul
usad
min
@tfl
.gov
.uk
Rob
ust
quan
tata
tive
data
38
Ann
ual t
raffi
c co
unt d
ata
Cor
don
coun
t ar
ound
tonn
s S
even
oaks
To
wn,
po
ssib
ly o
ther
ur
ban
area
s
Ann
ual
Tran
spor
t m
ode
Aut
omat
ic
coun
ts,
man
ual
pede
stria
n co
unts
Pap
er &
E
lect
roni
c B
ryan
Fi
tzge
rald
W
est K
ent H
ighw
ay S
ervi
ces
Joyn
es H
ouse
, N
ew R
oad,
G
rave
send
, D
A11
0A
T 01
474
5440
88
brya
n.fit
zger
ald@
kent
.gov
.uk
Rob
ust
quan
tata
tive
data
39
Per
sona
l in
jury
dat
a V
alid
ated
da
ta s
ourc
ed
from
Ken
t P
olic
e
Dis
trict
U
p to
10
year
s A
ll C
rash
repo
rts
from
the
scen
e
Ele
ctro
nic
Bry
an
Fitz
gera
ld
Wes
t Ken
t Hig
hway
Ser
vice
s Jo
ynes
Hou
se,
New
Roa
d,
Gra
vese
nd,
DA
11 0
AT
0147
4 54
4088
br
yan.
fitzg
eral
d@ke
nt.g
ov.u
k
Rob
ust
quan
tata
tive
data
40
Traf
fic S
peed
da
ta
Var
ious
site
s as
pre
viou
sly
requ
ired
Dis
trict
V
ario
us
Tran
spor
t m
ode
Aut
omat
ic
coun
ts
Pap
er &
E
lect
roni
c B
ryan
Fi
tzge
rald
W
est K
ent H
ighw
ay S
ervi
ces
Joyn
es H
ouse
N
ew R
oad
Gra
vese
nd
DA
11 0
AT
0147
4 54
4088
br
yan.
fitzg
eral
d@ke
nt.g
ov.u
k
Rob
ust
quan
tata
tive
data

H appendix
Appendix H Data review and analysis

H070130: Sevenoaks Transport Study Ref : Appendix H
H
Stakeholder consultation H.1 Originating from the list of stakeholders present at the first stakeholder group meeting the
group of consultees has been expanded to cover social exclusion issues, transport for the mobility impaired and other voluntary transport services. The list is shown in Table H1.
T H1 Stakeholders included into data review
Name Organisation Stake-holder Group
Data provided
Trevor Skelton Action with Communities in Rural Kent Yes No data held N/A Age Concern Sevenoaks & District No Yes John Arnold Age Concern Swanley No Yes Malcolm Spalding, Peter Elliot Arriva Southern Counties Yes Yes Alan Tuckwell British Horse Society Yes Yes Betty Howell Compaid Trust Chief Executive No Yes Geoff Meekums Edenbridge Rail Travellers Association Yes Yes Bridget Harris Edenbridge Voluntary Transport Agency No Yes Christine Terry Edenbridge Volunteer Centre No No data held Howard Moore Highways Agency Yes Yes Francoise Montford Independence and Access Matters No No data held James Cook Kent CC Kent Highway Services Yes Not contacted Steven Noad, David Eaton Kent CC Passenger Transport Unit Yes Yes David Joyner Kent CC Sustainable Transport Manager Yes Yes Anne Marie Hannam Kent CC West Kent Highway Services Yes Yes Byran Fitzgerald Kent CC West Kent Highway Services Yes Yes Colin Finch, Nicky Biddall Kent CC Public Rights of Way Team Yes Yes Alex Dawson SDC Assistant Environmental Health Manager No Yes Tracy Cullen SDC Concessionary Fares No No data held Richard Willson SDC Highways Yes Not contacted Andy Bracey SDC Parking No Yes Andrew Steen SDC Senior Planner Yes Not contacted Maggie Williams SDC Team Leader Yes Not contacted Steve Allard SDC Transport Manager Yes Yes Matthew Hogben SDC Transport Planner Yes Yes Sophie Lord SDC Youth Coordinator No Yes Peter Benford, Dr Roger Johnston Sevenoaks District Rail Travellers Association Yes Yes Mandy Wynne, Roger Walshe Sevenoaks Volunteer Centre Yes Yes Mike Gibson Southeastern Public Affairs Yes Yes Sam Hodder, Yvonne Leslie Southern Railways Director of Communications Yes Yes David Young SUSTRANS Yes Yes Pauline Annetts Swanley Volunteer Centre No Yes John Phillips Tandridge DC Planning Policy Yes Not contacted N/A Voluntary Action - West Kent No No data held Dennis Smith West Kent Disabled & Sensory Impaired Group No No data held

H070130: Sevenoaks Transport Study Ref : Appendix H
H
H.2 Consultees provided information about data held within their domain either through a telephone interview or directly through filling in a pro forma. Outline information collected for every data set encompassed the following:
• General description; • Geographical coverage; • Data time period; • Level of disaggregation; • Data collection method; • Data format; and • Holder of the data and contact details.
H.3 Where appropriate, missing information have been added, answers have been
categorised to provide comparability and contact information has been completed.
H.4 The data bank currently encompasses 40 data sets and it was developed in electronic format for best use by SDC. In order to maximise usability and easy upgrade of the data base, the data base was transferred in to a Microsoft Excel spreadsheets which is accessible and editable from most standard office packages, including Microsoft Office itself. Alternative formats will be provided on request.
H.5 In addition, a valuation of the data has been performed in order to allow users of the data bank to make a judgement on the reliability and applicability of quantitative data within the data set. Categorisation of the data quality has been according to the following:
• For information only; • Quantitative data used as indicator only; and • Robust quantitative data.
H.6 While the information allows for a projection of the data available into the future through
indicating data collection cycles, it is also important to notice that the data bank provides a snapshot of currently available data. Travel patterns, being closely linked to residential and employment patterns, are subject to a rapid change and quantitative data in particular must always be used and assessed against the background of its date of origin.
H.7 Appendix G shows the most recent status of the data base, broken down into the categories outlined above and sorted by holder of the individual data set.
Review of existing data available H.8 The comprehensive census data set provided by Office for National Statistics is
considered very robust data and travel-to-work and car ownership figures are fundamental information to determine the future of transport in Sevenoaks District. However the Census data dates from 2001 and will become less relevant over the lifetime of the Transport Strategy. The current Kent Travel Report (2005) is expected to fill this data gap for the development of the strategy.
H.9 Public Transport providers servicing the Sevenoaks District have provided robust quantitative data to allow a detailed analysis of demand and supply. Key bus service provider ARRIVA has continuous passenger figures from electronic ticket machine records. In order to complete the picture about bus travel in the district, an assessment of customers currently on free travel, i.e. free child travel, 60+ passengers and school travel, should be undertaken. Also, as there are a number of rail travellers’ interest groups monitoring performance of the rail providers, no such data on the performance of bus services exists to our knowledge.
H.10 Key rail provider Southeastern has provided information on robust passenger and station footfall figures. Combined with the information expected from Sevenoaks District Rail

H070130: Sevenoaks Transport Study Ref : Appendix H
H
Travellers Association, from which are expected to allow for an assessment of rail-based services, and the commuter travel situation to and from London in particular.
H.11 Southern Railways hold performance and loading data which can be broken down to routes and individual trains. Furthermore there is station usage data and customer complaint/ customer satisfaction data.
H.12 Sevenoaks Rail Travellers Association hold an extensive data set of season ticket holders and rail users assigned to individual station.
H.13 SUSTRANS has provided a useful network map for Kent and identified a gap in the current regional cycle network in Sevenoaks District. However no quantitative data on cycling in the district is currently available, which needs further investigation under the current agenda to promote non-motorised modes.
H.14 Walking as a mode is represented in the stakeholder group through the Kent CC PROW Team who are able to supply the Countryside Access Improvement Plan which covers walking routes throughout the district. Further information is not considered necessary.
H.15 A number of agencies have been contacted to cover the transport and accessibility issues for the socially excluded and mobility impaired. These included services provided by minibus services (Age Concern Swanley), Pegasus (Swanley Volunteer Service), hospital transport services (Edenbridge Volunteer Service), Compaid Trust services (for mobility impaired), Brighter Futures Project (Sevenoaks Volunteer Service) and shopping buses for the elderly (Sevenoaks District Services). Accessibility and social exclusion represent important issues which are expected to grow in significance over the lifetime of the Transport Strategy. Therefore it is essential to back up this largely qualitative or less robust quantitative data with a survey to estimate the demand for dial-a-ride type services for those physically, financially or geographically excluded from private or other forms of public transport.
H.16 Data about licensing fees and maximum taxi fares for Hackney carriages is available. However there is no indication of the usage of taxis and private hire vehicles (‘minicabs’) from the data supplied.
H.17 School travel is well covered by the assessed data sets, including a Kent-wide school travel survey (PLASC) and a separate walking survey (Streets Ahead) of primary school children. Assisting these quantitative data sets is information about school travel plans and walking buses which are applicable as an indicator only. However a closer assessment of the existing school travel plans is expected to generate further quantitative information on the travel behaviour of school children and experience with tackling the traffic management issues and safety issues of the school run, if only indicative and not available area-wide.
H.18 The accessibility maps produced by SDC as part of the Staff Travel Plan are not directly applicable to the Transport Strategy development process. In order to quantify accessibility and identify physical gaps in the public transport network, similar maps should be commissioned for all key town centres in the district (Sevenoaks Town, Edenbridge, Swanley, Westerham, Hartley) and other key employment and leisure attractors in the area. In this context it is advisable to include attractors in the surrounding districts and use the information gathered for cross-boundary partnership working to increase mobility and accessibility.
H.19 In a similar manner, the Town Centre Health Check available for Edenbridge, despite it’s qualitative nature, is considered very useful information to establish the baseline for the Transport Strategy, and to develop actions for the most important town centres in the district. The production of Town Centre Health Checks should be extended to other key towns as outlined in the above paragraph to allow for a consistent approach in the development of town centres.

H070130: Sevenoaks Transport Study Ref : Appendix H
H
H.20 The most comprehensive set of data is available for private motorised traffic. Although the majority stems from Kent-wide traffic data, it is generally possible to develop data specific to Sevenoaks District from these data sets. A number of very recent traffic counts exist on county level, held by Kent CC and Jacobs consultancy, which need to be revisited and compared against the information available from the Kent travel report and four sets of traffic counts commissioned by SDC in 2006. To ensure consistency of traffic data across the district and identify data gaps in important locations, the available sets should be plotted onto the road network. As outlined below, recent traffic data has not been consolidated into a district-wide model.
H.21 The Highways agency holds a number of data sets for their network. The LATS survey has been updated in 2001 and a further 5 year update is currently underway, providing in-depth multimodal origin-destination data from roadside interviews, counts and household surveys. There are also regularly updated, recent ATC counts from the main part of the network, completed by traffic count held in the TADS database.
H.22 A Crash Database for Kent dating back 10 years has been produced by Jacobs which should be compared with personal injury data held by West Kent Highway Services. Stemming from Kent Police this data source is considered very sound and should be sufficient to determine traffic safety related measures. Speed camera data is also available from various sites across the district, held by Kent CC, to complement this.
H.23 While there is sufficient data on the provision and location of existing off-street, parking there is limited data on on-street parking provision, as well as general demand and occupancy in Sevenoaks District. In addition, data on traffic orders issued is available.
H.24 Interrelated with traffic, there is a good and recent dataset available on the AQMAs in Sevenoaks District, with pollutant measurement and predictions. However these are restricted to the current AQMA but will expand with the introduction of further zones as discussed above.
H.25 Other issues linked to the development of a modern Transport Strategy include the demographics, regeneration, employment and housing market. These are covered by existing studies published by SDC prior to this study, including:
• Housing Market & Needs Assessment 2007; • Sevenoaks Retail Study 2005; and • Conservation Area appraisals.
H.26 In addition to the above, SDC has commissioned or is currently updating the following
studies covering related aspect with a relevance to the strategy development:
• Housing Land Availability Assessment; • Sevenoaks Employment Study (March 2006); • Sevenoaks Retail Study; and • Open Spaces Study.
H.27 Further demographics data to support the census should be supplied by the responsible
departments within SDC.
Review of current land-use and transport models H.28 Land use and transport models can be classified into a number of groups:
• Integrated land use and transport spatial predictive models; • Dynamic models that model specific time periods; • Strategic models (regional in context); • Local area models (generally SATURN based);

H070130: Sevenoaks Transport Study Ref : Appendix H
H
• Micro simulation models (for town centres and large junctions); and
• TRANSYT models (which are junction specific). H.29 There are a number of models in existence that apply to the County of Kent that operate
at a strategic level. These include the NAOMI model and the LASER model. These are operated by the Highways Agency. These models cover a wide area with a zoning system that would not be able to test schemes at a specific level in Sevenoaks District. They would however, be able to test the potential impacts of any large infrastructure scheme that SDC would wish to promote.
H.30 The LASER model comprises of a transport and a land use model that can be separated out with the transport model being able to test assignment and mode choice. Goods vehicles LGV and OGV movements can also be tested using the freight trip matrices that are inexistence. The validation year for NAOMI is 1997 which is considered old in modelling terms. The mode choice element of the model uses London Area Transport Survey data that is updated every decade, 2001 being that latest update. This data can also be considered to be ageing.
H.31 KCC did operate a county wide model at one stage some years ago but due to prohibitive costs this model has not been maintained and smaller local area models and micro simulation models have been developed.
H.32 An example of a local area model is the Sittingbourne model. This is an assignment model – SATURN based link flow model that has been developed to test the implications of major infrastructure proposals such as the proposed Sittingbourne Southern Relief Road and residential and commercial development proposals. In addition to this model a local town centre microsimulation model – VISSIM model has been developed to test site specific proposals in the town centre. This type of model could be developed for Sevenoaks District should large proposals be brought forward that could impact on the town centres in the District.
H.33 In Maidstone – a growth area in the South East Plan, another model has been considered. As part of the Core Strategy consultation process, the Borough Council has considered this recurring theme of under-provision of social, environmental and transport infrastructure facilities and schemes and is making consideration of these essential to the process of infrastructure provision at the same time as housing provision. The planned urban extensions would incorporate a school, community facilities and the South East Maidstone Strategic Link (SEMSL) road (formerly known as the Leeds-Langley bypass), along with public transport measures for the entirety of Maidstone. This route should be identified in the RSS as a proposal. The Highways Agency has commissioned a transport model to assess the likely impacts of the level of development proposed in the Core Strategy, with specific concern for the strategic route of the M20. It should be noted that as Sevenoaks District is not in the growth area nor would anticipate such levels of development so it is unlikely that the Highways Agency would commission the development of such a model for the district.
H.34 The closest model in proximity to Sevenoaks District is one for Kent Thameside. However, it would not be feasible to use this model for detailed analysis of proposals in Sevenoaks District as it would only be included in the buffer zones and these would not contain the level of necessary detail to enable testing to take place.
H.35 The criteria for the selection of a model centres on the type of proposal that requires assessment. For example, a large town centre scheme would require a detailed micro simulation model, whereas a local scheme that involved significant levels of residential/mixed use provision would require an assignment model such as SATURN or if at regional level the use of a strategic model as EMME2.

I appendix
Appendix I Literature review of
relevant research

H070130: Sevenoaks Transport Study Ref : Appendix I
I
Literature review of relevant research I.1 The literature on transport and travel behaviour is vast. This review is therefore selective,
yet it illustrates the fundamental shift in thinking about transport provision over the last two decades.
I.2 Eleven key reports have been reviewed, covering the period from 1989 up to the present day. All of these have significantly influenced transport policy or have drawn together evidence from research and case studies. Most have been published by the government or its agencies and are of particular relevance to Sevenoaks District and its environs. The documents are listed in Table I1. (Although there have been organisational changes affecting the Department for Transport, all documents from this department, as well as its predecessor bodies, are referred as being published by the DfT.)
T I1 Documents covered in literature review
Title Author Publication date
Roads to Prosperity Department for Transport Department for Transport, 1989
Trunk Roads and the Generation of Traffic Standing Advisory Committee on Trunk Road Assessment (SACTRA)
Department for Transport, 1994
Solving Congestion - when we must not build roads, increase spending, lose votes, damage the economy or harm the environment, and will never find equilibrium
Phil Goodwin Inaugural Lecture University College London, October 1997
Traffic Impact of Highway Capacity Reductions: Assessment of the Evidence
Cairns, Hass-Klau and Goodwin Landor Publishing, March 1998
Rural transport: an overview of key issues Commission for Integrated Transport (CfIT)
Department for Transport, 2001
The Demand for Public Transport Transport Research Laboratory (TRL)
TRL, 2003
The bus industry - encouraging local delivery
Commission for Integrated Transport (CfIT)
Department for Transport, 2004
Smarter Choices - Changing The Way We Travel
Cairns, Sloman, Newson, Anable, Kirkbride and Goodwin
Department for Transport, 2004
Transport Investment, Transport Intensity and Economic Growth: interim report
Standing Advisory Committee on Trunk Road Assessment (SACTRA)
Department for Transport, 2006
Beyond Transport Infrastructure – lessons for the future from recent road projects
CPRE and the Countryside Agency, Natural England, July 2006
World review of road pricing Commission for Integrated Transport (CfIT)
Department for Transport, 2006
Planning and the Strategic Road Network Department for Transport Department for Transport Circular 2/2007
‘Predict and provide’
I.3 From the late 1950s onwards the transport planning orthodoxy was often characterised by what has been called 'predict and provide'. The axiom was: first forecast how much traffic there will be, and then build enough road space to accommodate it. This resulted in a rapid expansion of road capacity, including the construction of the national network of motorways. It also resulted in behavioural change that has led to other adverse consequences, like the increasing length of car journeys for commuting leading to worse traffic congestion, a poorer air quality and road traffic accidents.
I.4 The 1989 programme of road building, 'Roads to Prosperity', based on the 1989 national road traffic forecasts, was the last time when Government transport policy tried, even partially, to devise a roads programme intended to 'meet the demand' for road transport. The flaw was that the programme would not keep pace with projected traffic growth.
I.5 If road capacity is expanded at a rate less than traffic growth the ratio of vehicles per mile of road can only increase, and therefore congestion is likely to get worse. Supply of road space will not - because it cannot - be increased to match all possible demand

H070130: Sevenoaks Transport Study Ref : Appendix I
I
everywhere. Therefore many analysts believe that demand will have to be reduced to match supply. According to Phil Goodwin (Solving Congestion) in practice, 'predict-and-provide' actually meant, inevitably, 'predict-and-under-provide'. A strategy with road building at its heart would not deliver improvements in travel conditions - this was called “the new realism” by a major study in 1990 funded by the Rees Jeffries Road Fund.
New road capacity and traffic generation
I.6 In 1994 the government’s Standing Advisory Committee on Trunk Road Assessment (SACTRA) report, Trunk Roads and the Generation of Traffic, concluded that road construction in conditions of congestion normally results in an increase in the total volume of traffic – i.e. induced traffic. Hence only a short period of relief from congestion is to be expected from the construction of additional roadspace. This opened the way to recognising that the volume of traffic is – at least in part - the result of policies implemented by central and local government, including land-use planning, and is therefore subject to some degree of control. Prior to this report the effects of induced traffic were often omitted from technical appraisals on the expectation that increases in road capacity would not significantly reduce the net balance of costs and benefits.
I.7 During the 1990s 'demand management' – limiting the use of road space at certain times and places - became part of the transport policy of every political party. Transport policy in principle now is nearly everywhere developing certain common themes: the growth of traffic will have to be slowed down, and in some locations the actual traffic level will have to be reduced, or even traffic will need to be removed.
I.8 In part that implies reversing the long-term decline in public transport. This might require an overall market for public transport expanding at around 3% to 5% a year, sustained for thirty years, and in some locations the logic of policy suggests growth of 25% in two years, 100% in five - achieved by changing relative prices, or the re-allocation of road space, or both, and investing in new systems where the old ones cannot be sufficiently improved. In all cases a strong contractual commitment between public agencies and commercial operators would be needed - favourable treatment for operators, but only in exchange for better services (‘Solving Congestion’, Goodwin 1997).
Road capacity reduction
I.9 In many places town centre road capacity is now being reduced or closed, and the space returned to more productive use. The argument is that is if additions to road capacity induce additional traffic, at least in certain circumstances, then, by reducing opportunities for car use, reductions in capacity will help reduce traffic levels. As Traffic Impact of Highway Capacity Reductions: Assessment of the Evidence reported in 1998, it is now generally accepted that in most locations road capacity will not be increased sufficiently to provide for unrestrained growth in car use. Re-allocation of road capacity, either to favoured classes of vehicles or to non-vehicle use, is a major policy interest. Measures such as bus priority schemes, cycle lanes, wider footpaths etc are now considered appropriate, but their feasibility is sometimes calculated on the assumption that all traffic displaced from one street will simply divert to another.
I.10 Traffic Impact of Highway Capacity Reductions: Assessment of the Evidence assessed the empirical evidence from different types of schemes that reduced road capacity in over 100 places. The average reduction in traffic levels on roads where capacity was reduced was found to be 41%. In over half the cases overall traffic reductions were also reported. In other words traffic does not always shift to other routes, much appears to vanish as a result of behavioural change.
Rural transport
I.11 In Rural Transport: An Overview of Key Issues, the government’s Commission for Integrated Transport (CfIT) cites research by the Countryside Agency (2000) that found that transport is the single most important concern of people living in rural areas. A number of other studies have identified transport as a major barrier to social inclusion in

H070130: Sevenoaks Transport Study Ref : Appendix I
I
rural communities. Recognising these trends, Government policy aims to reduce dependence on the car by supporting local provision of shops and services, and improving the effectiveness of public transport by increasing subsidy levels, whilst encouraging innovation and flexibility. LTP2 contains a requirement that local authorities prepare an accessibility strategy that sets out the need to promote easier access to key activities by those without access to a car.
I.12 Rural areas are often presented as a single homogenous entity, but in reality, rural transport is quite diverse. According to CfIT:
• Rural households rely more on the car, own more cars, make more journeys over longer distances and spend more per week on motoring than those from more densely populated localities.
• Greater reliance on the car in rural areas is likely to be partly a function of people living further away from basic shops and services and having less access to public transport.
• More efficient travelling means that rural travel costs are not that different to those in urban areas.
I.13 Nevertheless car dependency in rural areas is high:
• Reliance on the car in rural areas has increased dramatically in recent years across the UK, whilst use of public transport, walking and cycling has been decreasing in rural areas.
• However, car ownership has been growing more slowly in rural areas than nationally.
• Increasing reliance in rural areas is inter-related with a slow decline in access to rural shops, services and public transport provision (until the recent revival of rural buses in some areas).
• Reliance on the car is greater in isolated areas and among high-income households.
• The car is a more important source of mobility for non-car owners in rural areas than local bus services.
• It has been cautiously estimated that around a quarter of rural car journeys are entirely dependent on the car.
• Despite a significant increase in rural car use, the proportion of journeys without an alternative to the car is increasing relatively slowly.
I.14 According to CfIT the cost of rural motoring is significant:
• Low income households in the least densely populated non-metropolitan areas spend over 30% more a week on motoring than those in more densely populated areas.
• Studies suggest that the impact of increases in fuel duty is less significant than is often supposed.
• The majority of rural households cope with fluctuations in the price of fuel. Nevertheless, a minority of low-income rural households may be vulnerable to rising fuel prices.
I.15 Alternatives to the car for rural dwellers are limited, however:
• Up until 1997, rural bus services were in steady decline. Since 1998, the Government has sought to improve rural transport through the Rural Bus Subsidy Grant scheme, the Rural Bus Challenge Scheme, the Rural Transport Partnership Scheme and the Parish Transport Fund.

H070130: Sevenoaks Transport Study Ref : Appendix I
I
• The Government has set a target for the proportion of the rural population living within about 10 minutes walk of an hourly or better bus service to increase from 37% to 50% by 2010.
• Variations in rural transport services can be partly explained by variation in the density and distribution of the rural population, while the varying commitment of local authorities is also significant.
• Growth on train operators serving rural lines is currently around 6% per annum.
• Walking is much more important in terms of rural journey making than public transport.
• Only 1.4% of rural journeys are made by bicycle - this proportion is in decline.
• Support to safeguard local shop and service provision may help halt further decline in walking and cycling, as will measures designed to improve road safety and reduce traffic impacts.
I.16 Rural areas vary in their character and in the transport problems they confront cannot be
overemphasised.
I.17 In a more recent study, Beyond Transport Infrastructure – lessons for the future from recent road projects (CPRE, Countryside Agency, July 2006), The Campaign to Protect Rural England (CPRE) and the Countryside Agency jointly funded research into the post-opening evaluation of road schemes.
I.18 The research considered three case studies, the Polegate Bypass (East Sussex), Newbury Bypass (Berkshire) and the M65 Blackburn Southern Bypass (Lancashire). The study compared the information in the appraisal of each scheme with the actual impacts that occurred following scheme opening, focusing on the roads’ impacts on landscape, traffic flow and development. In addition, the research examined ten of the twelve existing ‘one year after’ studies undertaken by the Highways Agency on other trunk road schemes.
I.19 The report concluded that road evaluation and policy are failing to learn from the experience of past schemes, and that road building has impacts on landscape, traffic flow and development that are not accounted for when schemes are planned and appraised.
I.20 Traffic flows in all three case studies were near or higher on opening than those predicted for the roads in 2010. Any re-distributional effects of traffic caused by the construction of bypasses were undermined by overall increases in traffic. The research concluded that damage to landscapes can be ‘severe’ and lasting, while new roads can help generate development pressures which are often not anticipated in spatial plans.
Land-use and public transport
I.21 In The Demand for Public Transport (TRL, 2003) the interaction of land-use and public transport use was considered. This review of evidence showed that the effect of land-use on travel is particularly important but varies by trip purpose. It will depend on the extent to which the start/end time, destination, mode and route can be changed, whether the journey is essential or non-essential and the degree to which it can be linked to other trips. Evidence suggests that land-use particularly influences commuting and shopping trips, notably the use of local shops. For non-work trips land-use influences the distances travelled. Various land-use features influence travel behaviour: higher density developments; settlement size; population location; employment provision; and urban form.

H070130: Sevenoaks Transport Study Ref : Appendix I
I
Higher density developments I.22 Public transport use, walking and cycling increase with higher density developments – car
use declines. The average length of journeys tends to decrease with increasing density but this relationship seems to be weakening.
I.23 Higher population densities widen the range of opportunities for the development of local activities without the need for car-use since they reduce the distances between housing and employment opportunities as well as access to public transport services. However a greater number of journeys resulting from higher population densities can create more congestion which can slow bus movements, thereby discouraging public transport use. Furthermore in more highly densely populated areas parking is often limited, thereby limiting travel options, but walking is more efficient.
Settlement size I.24 Settlement size can also influence travel behaviour. It determines the choice of services
that can be accessed and the distances required. Public transport use tends to increase with increasing settlement size but average distances travelled tend to decrease. Commuting by bus increases with increasing settlement size.
Population location I.25 Combining different activities – housing, employment, shopping and other facilities –
provides residents with the opportunities to work and carry out other activities locally. Residential developments at transport nodes and close to urban centres increase the number of public transport trips compared with other developments. Car use also appears to decline with mixed-use developments, but bus ridership does not increase. Provision of everyday facilities such as food stores, a newsagent, open space, a post office, primary school, public house, supermarket and secondary school is key to reducing trip lengths according to the TRL. Provision of specialist and less frequently visited facilities, e.g. dentists and churches, has only a limited impact on travel. Local provision, however, does not necessarily encourage walking journeys or affect public transport, possibly as a result of poor route coverage to local facilities.
Employment provision I.26 The degree of centralisation of employment also influences travel behaviour – greater
centralisation encourages public transport use and reduces car use; peripheral locations tend to be much more car dependent.
Urban form I.27 Urban form will also influence behaviour. Compact urban form decreases the distances
required to reach services and facilities thus increasing the possibilities for non-motorised transport, depending on the size of the settlement. Small compact settlements may encourage walking at the expense of public transport due to the distances involved; whilst in larger compact cities congestion and overcrowding may adversely affect public transport ridership.
I.28 An alternative urban form is the ‘beads on a string’ development pattern involving high residential densities around bus stops and local amenities sited along routes at the centre of the beads. Apparently this is an efficient means of increasing bus use and for generating economic bus operations.
I.29 Developments within existing city limits produce the highest levels of commuting by public transport – research suggests that this is the same for low density developments built as an extension to the urban area as for medium-density developments rural developments.

H070130: Sevenoaks Transport Study Ref : Appendix I
I
I.30 In summary the key message is that land-use planning decisions and settlement policy can have a significant influence of influencing travel behaviour and encouraging more sustainable transport use.
Bus transport
I.31 In The bus industry - encouraging local delivery, CfIT reported that for the majority of regions in England outside London, bus patronage had shown a steady decline. The White Paper which preceded the 1985 Act that led to bus deregulation foresaw a situation where through the benefits of competition, costs and fares would fall, patronage would increase, more businesses would enter the bus market, innovation within the industry would be encouraged, and a greater number of services would be offered. It was also felt that competition would lead to improved marketing and passenger information. However, trends within the bus industry since deregulation have shown mixed results. While the decline since deregulation is a continuation of earlier trends, encouragingly the average rate of patronage decline has slowed in more recent years. For the last five years, the decline has been less than 1%. However, this decline is not uniform across England, London and a few notable exceptions have experienced considerable patronage growth while many areas have not.
I.32 Recent increases in Government funding and new powers under the Transport Act 2000 have made a difference - the age of the fleet has fallen and buses are more accessible, information provision is improving and bus priority schemes are delivering better reliability and punctuality. But the industry is facing cost pressures and operating conditions will worsen as congestion grows without continuing positive action.
I.33 The bus is vitally important for both the accessibility and social inclusion policy agenda. It remains by far the most dominant form of public transport across Great Britain. In 2002/03 4.4 billion passenger journeys were made by bus. This compares to 2 billion journeys recorded on all rail modes in 2002/03 (national rail network patronage totalled 976 million-passenger journeys). The local bus service currently accounts for 45% of the total distance travelled by passenger transport services.
I.34 CfIT believes that the bus industry can deliver far more for the travelling public in a shorter period of time for less money than any other public transit alternative. However, the continuing decline in patronage outside London will not be reversed unless the best practice that has emerged in several areas is rolled out across the whole country.
I.35 The London system has been viewed as a possible alternative to the deregulated modal. However, two key factors need to be considered. First, the London bus system requires significant public subsidy (with annual costs having risen from zero to £600m by 2006). Second, London is also unique in that it has a strong public transport 'culture', coupled with population growth and high population density, as well as bus priority and demand restraint measures (including the congestion charging scheme).
I.36 The Belfast example is also worth considering - in Northern Ireland bus services are operated in a regulated environment and public transport is still state owned. However, in Belfast, unlike London, there has been a lack of investment in bus priority measures and demand restraint, a large increase in parking spaces - 5 fold increase in the last 20 years - and growth in car ownership. As a result, passenger journeys declined by 9% between 1999 and 2003. To exemplify the London experience as a template for other UK towns and cities may, therefore, be over-simplistic.
I.37 CfIT believes that within the existing legislative framework patronage growth can be achieved (as evidenced in areas such as Brighton, Edinburgh, York, Nottingham, Oxford and Cambridge). However, the effective use of the measures currently available to transport authorities and bus operators has not been sufficiently widespread. One of the reasons given by local authorities for not introducing demand restraint is the economic impact of adjoining urban centres using parking policy as a competitive weapon.

H070130: Sevenoaks Transport Study Ref : Appendix I
I
I.38 Research quoted by CfIT has examined bus industry projections to 2010 based upon a 'base case' scenario and a 'fare base' scenario (where fares rise to maintain the real-term value of revenue from diminishing patronage). In both of these scenarios, patronage levels would continue to decline - felt most strongly when operators sought to maintain revenue levels (this would lead to a 32% loss in patronage in English shires). There would be cost implications for local authorities as tender costs would continue to rise and widespread service de-registrations could be expected. Car dependency would also increase as the bus lost mode share, with a knock-on impact on congestion.
I.39 This analysis proposed that quality, reliability, priority and marketing improvements in the 1990s resulted in 1.8% growth in demand per annum in London, and 2.2% outside London. Modelling suggested an even greater impact on patronage could be achieved from the implementation of such schemes (15.4% growth in the shire counties).
I.40 CfIT considered that properly enforced bus priority and demand restraint measures in congested areas are critical in enabling the development of high quality, frequent and reliable services that could attract motorists from their cars. The uptake and implementation of bus priority and demand restraint (particularly strong parking policies) are crucial in improving the feasibility of bus services and, in turn, increasing patronage levels by making them a viable alternative to the car.
I.41 CfIT believe that stronger incentives need to be put in place to encourage wider take-up of partnership working (including the use of Statutory Quality Partnerships, particularly where patronage loss continues to be experienced, and local authorities call for greater control of service provision). But while these are applicable to urban bus service provision, their effectiveness in rural areas is less certain.
I.42 Bus provision in rural areas (where local service provision is not possible at marginal cost due to the needs of school transport provision) should be based on a demand responsive approach according to CfIT.
Smarter Choices and soft measures
I.43 The promotion of Smarter Choices, often referred to as 'soft measures', is a central theme of the DfT's Influencing Travel Behaviour programme (Smarter Choices - Changing The Way We Travel, DfT 2004). The benefits identified by the DfT include:
• A reduction in car use, and easing of localised congestion; • An increase in modal shift; • Environmental benefits; • Economic benefits; and • Better health and fitness through more walking and cycling.
I.44 Local transport authorities, including Kent County Council (KCC), were required to
include Smarter Choice interventions in their Local Transport Plans for 2006-2011 as part of an overall government strategy to deliver the shared priorities of:
• Tackling congestion; • Promoting accessibility and social inclusion; • Delivering safer roads; and • Improved air quality.
I.45 All of these are expected to enhance the quality of life through having a positive impact
on the way people travel by reducing car dependency and promoting sustainable travel. Whilst all share the common goals, Smarter Choices schemes can be grouped into a number of categories. Ranging from personalised travel planning to home shopping, they all reduce the number car trips made and congestion whilst improving people's health and the economic performance of a region.

H070130: Sevenoaks Transport Study Ref : Appendix I
I
I.46 Travel Plans generally incorporate a number of Smarter Choices schemes and are generally most effective where they are supported by infrastructure measures designed to 'lock in' the associated benefits such as bus/cycle/high occupancy vehicle lanes and reduced car parking capacity. Some fifteen types of Smarter Choices interventions were identified by the DfT. These are described in Appendix J.
I.47 Evidence of the impact of Smarter Choices measures is growing as more authorities and others adopt them. A selection of case studies, from both the UK and elsewhere, is provided in Appendix K.
I.48 A DfT funded study (Cairns, Sloman, Newson, Anable, Kirkbride and Goodwin, 2004) into the performance and effectiveness of Smarter Choices measures, although not then Government policy, stirred considerable interest in the impact of Smarter Choices measures. The study firstly reviewed the impacts of Smarter Choices measures separately. It then presented a 'high intensity' scenario to show the potential impact if there were to be a significant expansion in Smarter Choices project delivery. The authors concluded that the main outcomes of the high intensity scenario would be:
• A reduction in peak period urban traffic of about 21% (off-peak 13%);
• A reduction of peak period non-urban traffic of about 14% (off-peak 7%);
• A nationwide reduction in all traffic of about 11%. I.49 The caveat to this is that any freed-up road space could possibly be taken up by other car
users unless there are measures in place to prevent this, such as the re-allocation of road capacity and improvement to public transport service levels, parking control, traffic calming, pedestrianisation, cycle networks or congestion charging.
I.50 The report also outlined the effects of a ‘low intensity’ scenario, which are estimated to be a reduction in peak period urban traffic of about 5%, and a nationwide reduction in all traffic of 2%-3%.
I.51 The study estimated that the public expenditure cost of achieving reduced car use by Smarter Choices is in the region of 1.5 pence per car kilometre, or £15 for removing each 1000 vehicle kilometres of traffic. The benefit of reduced traffic congestion is estimated on average to be about 15p per car kilometre removed; it is considered to be approximately three times higher in congested urban conditions. Consequently, the authors concluded, that every £1 spent on Smarter Choices could bring about £10 of benefit in reduced congestion.
I.52 The study indicated that a travel plan can succeed in almost any location but that the choice of location is a more significant factor in the overall generation of car trips. However the one key factor that was recognised as being of specific importance was the management of car parking. The travel plans that included measures such as parking restriction, introducing charging or payments to those giving up a parking space, achieved an average reduction of over 24% in car driver commuting trips. The travel plans that did not include parking measures achieved an average reduction of 10% in car driver journeys.
Transport investment and economic growth
I.53 The relationship between transport investment and economic growth is complex. In its latest report on ‘Transport Investment, Transport Intensity and Economic Growth: interim report’ (2006), SACTRA suggested that:
• In certain circumstances transport investment may have economic impacts which are additional to those measured in conventional cost benefit appraisal. These additional impacts could be either positive or negative;

H070130: Sevenoaks Transport Study Ref : Appendix I
I
• There is scope to achieve some reduction in national traffic volumes through restraint measures which will at the same time improve economic efficiency. This is likely to entail packages of price and non-price measures, focused on congested parts of the network. SACTRA does not mention the scale of traffic reduction which could be achieved without harmful effects on the economy;
• While in certain circumstances transport schemes may bring added economic benefits to an area needing regeneration, in other circumstances the opposite might occur. Better communications will enlarge markets for goods, services and workers: the area as a whole may gain or lose from this depending on the structure and competitiveness of the local economy. It follows that there is no simple, unambiguous link between transport provision and local regeneration; and
• SACTRA believes that the pervasive, often implicit, assumption that the benefit of improved accessibility will always accrue to the target area may often be misplaced; the possibility of the net impact running counter to regeneration objectives cannot be ruled out.
Road Pricing
I.54 Road pricing covers a wide range of means of paying for road use. A review of international experience undertaken by CfIT (2006) focused on area-wide pricing schemes such as those implemented in London and Singapore. CfIT concluded that locations that had implemented road pricing had done so primarily to:
• control rising congestion levels; • deter further growth in car use; and • to address the negative impacts of traffic and congestion on
transport efficiency and the environment. I.55 The review identified a wide range of locations worldwide that are now considering
implementing local road pricing schemes - focusing on a single town, city or urban area - but only the Netherlands and the UK are looking at national schemes.
I.56 Evidence from 17 case studies indicated that the majority are at very early planning stages with very few having clear specifications of schemes. Other than locations that are extending or modifying schemes already in existence or proposing trials - there are no committed implementation plans across the sites reviewed.
I.57 The evidence also indicated that most locations are developing local schemes on a bottom-up basis, not framed by wider national policy or backed up by legislation that would enable road pricing to be implemented.
I.58 The UK has a national policy framework that is guiding the development of interoperable local road pricing schemes and has legislation that would enable road pricing schemes to be implemented – the Transport Act 2000. Importantly, the longer-term aspiration for a national scheme does not appear to be hindering the progression of local schemes. The DfT is also providing funding to enable the development of road pricing schemes in England.
I.59 However, compared with other locations in the world the authorities in England progressing with road pricing schemes have limited ability to shape the public transport elements of an integrated package of measures to complement road pricing.
I.60 It is clear that the primary focus of road pricing in the UK is to tackle congestion, while the majority of schemes worldwide explicitly seek to achieve a wider range of objectives.

H070130: Sevenoaks Transport Study Ref : Appendix I
I
Circular 2/2007 Planning and the Strategic Road Network
I.61 This Department for Transport Circular sets out how the Highways Agency will work in partnership with regional and local planning and transport authorities, public transport providers and developers to participate in all stages of the planning process to produce sound and deliverable strategies.
I.62 The circular:
• sets out how the Highways Agency will take part in the development of Regional Spatial Strategies (RSSs) and Local Development Frameworks (LDFs) from the earliest stages;
• encourages the Highways Agency and Regional Planning Bodies (RPBs) and Local Planning Authorities (LPAs) to work together to ensure effective participation in the preparation of regional and local sustainable development policy; and
• sets out how the Agency will deal with planning applications. I.63 The policy reinforces the Agency’s approach to mitigating the transport impacts of
development. It’s aim is to apply the following solutions iteratively:
• Impact avoidance through encouraging sustainable locations; • Impact minimisation through realistic travel plans; • Access management; and • Capacity enhancements as last resort and only where compatible
with suitable principles. I.64 This approach is supported by the Department for Transport and Communities and Local
Government supporting document, the Guidance on Transport Assessment. The circular will assist stakeholders in determining whether a transport assessment may be required and, if so, what the level and scope of that assessment should be.
The Agency's role in the preparation of Local Development Frameworks I.65 Circular 2/2007 also points out that the Highways Agency is a named consultee in the
process for producing LDFs, including Local Development Documents (LDDs). LPAs should ensure that the Agency is involved from the pre-production stage of the LDDs and throughout the preparation process. Involving the Agency in the plan preparation process is intended to help to ensure the development of sustainable and coherent proposals and so they are capable of being supported by the strategic road network.
I.66 The Agency will offer advice and technical support to guide the scale and location of proposals in relation to the strategic road network. The Agency will also provide guidance on the scale and nature of improvements to the strategic road network and demand management measures (where such improvements and measures are required) that need to be considered in order to facilitate development.
I.67 Where the Agency considers that a proposal in an LDD may not be deliverable, for example because it would require improvements to the strategic network that are not practicable or which may be unaffordable, it will provide a full and reasoned case to the LPA.
I.68 The Circular argues that the Agency cannot be expected to cater for unconstrained traffic generated by new development proposals. Such growth would be unsustainable and would restrict opportunities for future development where available capacity is limited. Development should be promoted at sustainable locations, and the Agency will expect to see demand management measures incorporated in development proposals.

J appendix
Appendix J Smarter Choices

H070130: Sevenoaks Transport Study Ref : Appendix J
J
Types of Smarter Choices Workplace Travel Plan
J.1 A workplace travel plan aims to reduce car trips to an employment site by staff, visitors, customers and suppliers, and increase levels of public transport use, walking, cycling or car sharing. They will comprise a range of different measures typically including secure cycle parking, office showers for cyclists, the ability to tele-work from home, subsidised bus travel, bus travel information, cycle pools for users and car sharing facilities.
J.2 Travel plans can be voluntarily adopted or secured by a local authority through a Section 106 agreement, or the use of a planning condition. Travel plans ought to specify a desired modal split target or a range of measures to be implemented within a specific timescale. Monitoring and evaluating are vital to ensure their success and long term continuation.
School Travel Plan
J.3 A school travel plan encourages school children and staff to travel to school by alternative methods to a car. It can feature a number of schemes including walking buses (particularly for primary schools), safer walking routes, cycling trains, cyclist and pedestrian training, promotional campaigns and classroom learning activities. School travel plans generally is now an umbrella term for all school travel initiatives, including safer routes to school and cycle parking. The school needs to be actively involved in the process with support from the local authority to help ensure its success.
Area Travel Plan
J.4 An area (or cluster) travel plan covers a number of organisations on a particular site, such as a science park. The travel plan requires input and support form all the organisations it represents and the local authority to help ensure its success and can include particular elements such as car sharing, cycling and walking initiatives as well as better information on bus services. An area travel plan can provide the evidence base to either lever in or plan investment in cycling and walking schemes.
Residential Travel Plans
J.5 Residential travel plans are best adopted during the design and planning phase of a new housing development. They can be secured and funded by S106 agreements and should cover aspects such as public transport access and infrastructure. They are most likely to succeed if implemented at the earliest possible stage of planning and involve input from the developers, local authority and public transport operators. Schemes could include welcome packs for residents with free travel information and free introductory period passes, walking and cycling routes, or free cycles. Car clubs enable residents to use cars when needed occasionally without having to incur all the costs of ownership.
Event and Tourism Travel Plans
J.6 Event and tourism travel plans can be adopted by one off event organisers and by other tourist destinations. By predicting and managing the demand for travel at certain times of the year alternative measures of transport to the private car can be promoted or put in place. Suitable forward planning is required but can bring about huge benefits to the accessibility and car parking requirements of a destination.
J.7 Car-sharing systems may well feature in these travel plans but usually the focus in on improving, if only temporarily, public transport, usually buses.
Personalised Travel Planning
J.8 Personalised travel planning is an approach that provides travel options advice and incentives to a targeted group of people on an individual basis. These schemes can be target neighbourhoods or specific groups, such as school children, employees or single

H070130: Sevenoaks Transport Study Ref : Appendix J
J
parents. Information is based on the individuals’ travel patterns and incentives could be provided that the individual may find useful. Participants are usually provided with information on public transport services as well as walking and cycling routes that they could use for certain, often regular journeys, in order that changing their behaviour is made easier.
Public Transport Information and Marketing
J.9 Promotion and marketing of specific routes, whole networks or improvements to bus services is crucial to achieving an increase in patronage. Smarter Choices projects links improvements in service and route information with the promotion of services. The use of branding and supplying good information is vital. Marketing can be targeted to areas or even individuals. Information can be improved by the introduction of real-time information at bus stops, for example.
Travel Awareness Campaigns
J.10 Travel awareness campaigns raise the public's awareness of the problems caused by car use and encourages the use of alternative modes of transport. Campaigns use a number of media, including exhibitions, road shows, radio adverts, bus backs adverts, poster, leaflets and press releases. On-going communication takes place through the media, targeting broad audience or specific audiences with focused messages, for example promoting the health incentives of cycling and walking and the benefits to the environment.
Car Sharing
J.11 Car sharing schemes are usually internet based and provide matches for people wanting to share the same or similar journeys. The sharers agree to share the costs of their journeys or alternate the driving. Most schemes enable people to set criteria for potential sharer matches, such as gender or non-smoker. Car sharing schemes can be supported by priority parking or discounted parking charges through a workplace travel plan, or use of High Occupancy Vehicle (HOV) lanes.
Car Clubs
J.12 A car club gives people access to a car without them having to own one. A neighbourhood or organisation will have access to a number of cars and members of the car club will pay a fee to be a member. Then members can take the car when they need them by booking in advance. This can reduce the number of cars owned in an area and therefore reduce unnecessary congestion. Users also make financial savings by not having the associated overheads of running a private motor vehicle.
Tele-working
J.13 Tele-working can be incorporated into workplace travel plans and allows individuals to work from home. Recent improvements in ICT allows individuals to work from home whilst remain in constant contact with the office. Support is essential from the employer and they may choose to provide the necessary hardware. If every individual tele-worked one day a week then congestion could be cut by as much as 20%.
Teleconferencing
J.14 Teleconferencing involves the use of ICT to communicate 'in person' without the need to travel. Support is required from employers but the financial savings often outweigh the associated costs. It can be linked with tele-working so that participants can be involved from home.
Home Shopping
J.15 Internet and home catalogue shopping have the potential to reduce shopping car trips. Efficient distribution systems are vital to ensure that there is a net reduction in vehicle

H070130: Sevenoaks Transport Study Ref : Appendix J
J
trips and distance travelled. Home shopping can be particularly useful for rural households without access to a car.
Cycling and Walking
J.16 They can be linked to travel plans or promoted as separate schemes such as segregated cycle lanes, advanced stop lines for cyclists at junctions, safer walking routes, cycle pools for users or cyclist training. Wider and continuous footways benefit pedestrians while the removal of guardrailing and better maintained footways or pedestrian crossings will also help.
Hard (infrastructural) Measures to 'lock in' the benefits of Smarter Choices schemes
J.17 The ‘Smarter Choices - Changing the Way we Travel’ report highlights the scale of single occupancy vehicle trip savings the adoption of smart measures might bring about. Local Authorities are encouraged to "lock in" these benefits through the parallel adoption of demand management measures (infrastructure or "hard" measures), such as the deployment of traffic calming, segregated cycle lanes, wider footways or bus priority infrastructure. Successful dovetailing of both "soft" and "hard" initiatives will ensure the full benefits of the Smarter Choice philosophy is realised.

K appendix
Appendix K Evidence of the benefits
of Smarter Choice

H070130: Sevenoaks Transport Study Ref : Appendix K
K
Evidence of the benefits of Smarter Choices ‘Making Travel Plans Work – Case Study Summaries’ (DfT, 2002)
K.1 An evaluation of twenty workplace travel plans covering a range of employers from across the UK including Boots (headquarters, Nottingham), Bluewater Shopping & Leisure Centre (Kent), Oxford Radcliffe Hospitals NHS Trust (JR site) and the University of Bristol was undertaken by the DfT. Over 69,000 employees at 20 organisations were covered.
K.2 The study found that on average the annual running cost of a travel plan was £47 per employee, although this could be significantly influenced by the extent of funding for other measures such as bus services. It was also reported that initial setting up costs, such as installing cycle parking, can also be high but are only incurred once.
K.3 Impacts resulting from the travel plans varied considerably, with the largest modal shift achieved by Orange where the percentage of staff driving to work was reduced from 79% to 27%.
Workplace Travel Plans: Buckinghamshire County Council Travel Plan (‘Making Travel Plans Work – Case Study Summaries’, DfT, 2002)
K.4 Buckinghamshire County Council began its travel planning work in 1998, developing a travel plan for the council and appointing a travel plan coordinator. Measures included:
• County-wide car-sharing scheme; • Discounts for bus and rail travel; • Extensive publicity and promotion; • Improved cycle parking; and • Car park management, including parking charges.
K.5 The target audience was Council employees, who number approximately 2,200, of whom
1,423 are based in the two County Hall buildings, with a further 780 in Area Offices. The initial set-up cost of the travel plan was £33,000. The annual running costs are estimated at £125,000, approximately £57 per employee.
K.6 The travel plan has reduced single-occupancy car commuting from 71.3% to 49.4% over five years.
School Travel Parents Guide to Child Cycling (DfT, 2004)
K.7 This project aimed to increase levels of cycling to school by targeting parents, the key decision-makers, rather than children. The communication project was developed because it was recognised that perceptions of road danger and parents’ fears about their child being involved in an accident was the single most important barrier to increasing levels of cycling to school. Whilst safe routes are essential to increasing cycling, they are not sufficient on their own. The project involved the production of a full colour factual guide to cycling to enable parents make informed decisions for their children.
K.8 Parents of years five and six students at schools across the city of York were targetted.
K.9 York has a strong history of cycling, with a well developed cycle network, cyclist training, cycling marketing campaigns and safe routes to schools programmes. The authority also has a Public Service Agreement (PSA) target to increase the number of children that cycle to school in year groups 6-9, from 5.8% in 1999 to 10.3% by December 2005. The project cost approximately £50,000 over three years.
K.10 The guide has been well received and replicated by other local authorities in Britain. York reported that it is difficult to isolate the impact of any single initiative on levels of cycling as they run concurrently a number of campaigns, as well as infrastructure improvements.

H070130: Sevenoaks Transport Study Ref : Appendix K
K
Nonetheless, for schools in York, calculations suggest that, on average, primaries with school travel plans had car use that was 15% lower than schools without travel plans.
K.11 However the impact of school travel plans tends to subside to some extent once the initiative has been completed. The guide to cycling, by taking an honest approach to help parents make an informed choice, is trusted and therefore is thought to have had a lasting impact on levels of cycling.
Area Travel Plan: Whiteley Area Travel Plan (Highways Agency, 2005-06)
K.12 An Area Travel Plan (ATP) was developed for Whiteley – an area of residential, employment and retail land-uses – between Southampton and Portsmouth, in Hampshire. It was developed in partnership between the Highways Agency’s (HA) Influencing Travel Behaviour team, Hampshire County Council (HCC), and the Whiteley Business Forum (WBF) and its proactive Transport Sub Group (TSG).
K.13 The development of the ATP was informed by a detailed baseline analysis including site audits, travel surveys and traffic counts. This analysis revealed that the vast majority of trips into the area during peak hours are generated by the Solent Business Park, where around 4,000 people are currently employed.
K.14 An Action Plan was developed with detailed measures to address this trip generation with the emphasis on modal shift, away from the Single Occupancy Vehicle. An ATP Coordinator was then appointed for the summer 2006 period to undertake the initial implementation of these measures. These included:
• A business park-wide car-share scheme; • Public transport improvement negotiations with operators, the TSG
and HCC; • A ‘Healthy Lifestyles’ initiative to encourage walking, jogging and
cycling; and • A promotional campaign.
K.15 The short-term measures of the ATP are targeted at encouraging and enabling the use of
sustainable travel modes by the employees of the Solent Business Park. The future development of the ATP will look to address the travel of residents and shoppers. The HA has developed a programme of Area Travel Plan sites across the UK to 2010, with the aim of reducing congestion and taking pressure off England’s strategic road network.
K.16 The development and initial implementation of the ATP has cost around £50,000, the majority of which has been funded by the HA, but with funding also coming from HCC. The next stage of the project – the appointment of a permanent ATP Coordinator – will be funded by the leading business of the TSG and HCC.
K.17 Over 100 people have registered on the car-share database. Monitoring of the impact of the ATP on congestion at Junction 9 will be carried out through traffic surveys in March 2007. The ATP is supported by a detailed Monitoring Strategy. The impacts of the measures introduced through the ATP will continue to be monitored annually to assess its success and to increase its impact and efficiency.

H070130: Sevenoaks Transport Study Ref : Appendix K
K
Residential travel plans: Plough Lane, Wimbledon (2006)
K.18 This was a Residential Travel Plan (RTP) for a mixed-use development that will increase density at Plough Lane in Wimbledon, south London. The RTP is aimed at residents of the proposed development and includes:
• Improved bus provision • Car Club • Infrastructure and incentives to encourage cycling • Travel awareness information
K.19 A residential travel plan aims to reduce trips from an origin. This RTP has not yet been
fully implemented its outcomes are yet to be seen. However, as part of the planning application for the development the developer had to sign a Confidence in Delivery Agreement to demonstrate its confidence in the measures introduced to offset the impact of the development on the surrounding road network. The developer is contracted to monitor the traffic produced by the development to 2011 and if the level is not at or below the level predicted, it is obliged to use more money to fund further measures to encourage non-car travel.
Public Transport Information and Marketing: Perth, Scotland, direct marketing campaign (DfT, 2004)
K.20 This advertising and marketing campaign included launch publicity, door-to-door interviews with potential customers, the offer of free trips, and promotions such as children’s competitions and pensioners’ lunches. This was followed by a telephone-based direct marketing campaign targeted at nonusers. The campaign was also accompanied by quality service improvements, which included doubling the service frequency, introducing low floor buses, simplifying fares and the council introducing bus priority measures and new bus shelters.
K.21 The marketing campaign aimed at increasing bus use on a poor performing, low frequency bus route in Perth, Scotland with a profile of aged owner-occupiers with high car dependency. The main bus operator, Stagecoach, and the local authority worked in close partnership to provide a range of quality improvements that have resulted in a step change in public transport provision in Perth. These have included new vehicles, priority measures and state of art bus shelter designs.
K.22 Over the first two years passenger growth was 56%, and reported to be on course to be 63% over three years. There was evidence of modal shift from car to bus. The telephone marketing campaign resulted in conversion to public transport of 7-8% of those non-users contacted. This is a high figure as the Direct Marketing Association response rate survey 2003 quotes average response rates for comparable telephone campaigns of 4.9%. The 63% patronage increase is roughly double the average increase for a conventional quality bus partnership, suggesting that the difference was largely due to the direct marketing of this scheme.
K.23 The passenger growth continued to increase over three years.
Public Transport Information and Marketing: Public transport marketing and information in Brighton (‘Smarter Choices Report – Volume 2’ DfT, 2004)
K.24 The City Council and Brighton and Hove Bus and Coach Company currently work together in an informal bus partnership and use a combination of hard and soft measures. The hard measures used include improving services, infrastructure and parking enforcement.

H070130: Sevenoaks Transport Study Ref : Appendix K
K
K.25 The soft elements of their approach include:
• Metro’ branding, including a tube style map and colour-coded routes. • A £1 flat fare for any bus trip was introduced in 2002. The flat fare is
felt to have ‘completely demystified the use of the bus’. Its introduction was heavily publicised on the sides of buses and through radio advertising. Other ticketing initiatives aimed at attracting bus users are a £2.40 one-day saver ticket and a scheme called ‘Bus ID’ which enables young people to travel for a 30p flat fare.
• Development of a customer service culture throughout the bus company, including a customer care training programme.
• A ‘Bus Times’ publication, which gives comprehensive information about bus services run by all operators. This is produced by Brighton and Hove Bus Company, but lists Stagecoach, Arriva and council funded services alongside their own.
• Two ‘one-stop travel shops’ selling tickets and information for all forms of public transport.
• A telephone helpline operated by council staff. It is also possible for travellers to make use of a regional telephone service (Public Transport Information 2000), which the council and the bus company are involved in.
K.26 The city, a south coastal resort, has approximately 250,000 residents and eight million
visitors every year.
K.27 Brighton and Hove Buses spent a total of £22.3m on new buses between 1996 and 2003 and they boast one of the youngest bus fleets outside London. They also spend around £100,000 a year on a comprehensive customer service strategy and training programme. The bus company also spends approximately £225,000 a year on publicity and marketing. Brighton and Hove City Council’s public transport team had a budget of £7.1m. Of this, £35,000 is for publicity.
K.28 The result of the approach has been an increase in bus use of 5% per year for the last decade, which is partially attributable to the marketing of these services. The increase in bus use has been consistent over the last 10 years.
Travel Awareness Campaigns: Hertfordshire’s walk to school week (TAPESTRY, 2003)
K.29 TAPESTRY is a promotion campaign in schools to promote walking during a particular week that targets children. Walk to School Week involves posters in schools, stickers or badges for children and media publicity. The campaign was delivered into 147 separate schools reaching almost 60,000 schoolchildren and their parents.
K.30 Walk to School Week is run in rural and urban schools across the county. The project was built on the experience of previous travel awareness campaigns and the analysis of their results. As a result of all the analysis it was determined that the group could be best reached through the campaign for Walk to School week 2002. This campaign cost £14,800.
K.31 The TAPESTRY project undertook an assessment of Hertfordshire’s Walk to School week campaign, which took place in May 2002. Evaluation was conducted at 11 schools that were targeted by the campaign and two control schools.

H070130: Sevenoaks Transport Study Ref : Appendix K
K
K.32 The schools participating in the campaign this year had also done so the previous year, whilst the control schools had never participated in Walk to School week. Analysis was conducted via a before and after survey. In total, about 1000 completed surveys were received from campaign schools, with a further 200 from control schools. Specific results were as follows:
• There was a small (1.3%) increase in the proportion of children walking to school at least once a week in the campaign schools compared with a small (1.3%) decline in the proportion at control schools.
• The proportion of parents in campaign schools strongly agreeing that "I intend for my child to walk to school for his/her next journey" rose from 48% to 54% (with growth from 64% to 66% in the proportion agreeing or strongly agreeing overall). A similar growth was seen in control schools.
• The percentage agreeing or strongly agreeing that the car doesn't cost much declined from 21% to 16% in the campaign schools after Walk to School week.
K.33 The Tapestry report claims that these results suggest Walk to School Week can have a
positive effect. Moreover, they claim that some of the parallel changes that occurred at the control schools suggest that it may also be having a knock-on effect in schools that do not participate directly. It is equally likely that the small change in walking was a chance effect, or due to another factor.
Car Sharing: CamShare, Car sharing in Cambridgeshire (DfT, 2004)
K.34 In this project car sharing occurs through the Cambridgeshire Travel for Work Partnership (which is focused around workplace travel planning) a county-wide car sharing scheme was set up using Liftshare. Employers are encouraged to intensively promote the scheme to their workforce and incentivise the scheme through providing a guaranteed ride home and dedicated parking spaces.
K.35 The scheme was launched in 2002 at five pilot sites employing approximately 13,000 employees. It was developed and is managed through the Travel for Work Partnership (TfW), which is part-funded by the County Council. Four of the five businesses involved in the CamShare pilot were on the Steering Group that founded TfW. The scheme cost £15,000 to set up and employers pay to register and pay annually for a licence to use the scheme.
K.36 After a year of operation 350 people had registered on the scheme with 230 considered to be ‘live’ members. However in a three-month period in this year 161 searches were made on the site but only two e-mails were sent seeking fellow car sharers. The site organisers believe that some people may be using the system to find potential sharers and then making their own arrangements.
Car Clubs: Edinburgh Car Club (DfT, 2004)
K.37 In this project a car club provided as part of a car free housing development in the urban area. The Edinburgh City Car Club was the first major car club in the UK and was launched in March 1999. Initially it was operated by Budget Rent a Car; in October 2001, the car club was re-launched by Smart Moves. The car club was launched with financial support totalling £253,000 from the city council, Scottish Office and DETR. When the scheme was re-launched a development grant of £40,000 was provided by Edinburgh City Council.
K.38 Edinburgh has a population of almost 450,000. It is a compact city with over half of its households living in tenements or blocks of flats. These were not designed with the car in mind and parking pressure is acute in the city.

H070130: Sevenoaks Transport Study Ref : Appendix K
K
K.39 Budget Rent a Car increased the scheme to 170 members, 22 vehicles and 23 sites over a period of two years. When the scheme was re-launched considerable work was required to regain members. By August 2003 the club had 215 members and 17 cars at 15 sites around the city. By May 2004 there were 317 members and 19 cars. Figures suggest that the Edinburgh car club saved roughly 825,000 car kilometres per year in 2003. In terms of kilometres saved per member, the figures work out at approximately 3,800.
Teleworking: BT (‘Smarter Choices Report – Volume 2’, DfT, 2004)
K.40 BT employees are encouraged to explore the possibility of teleworking, not only to enable BT to increase efficiency and productivity, but for the benefits of work-life balance for employees. Teleworkers are provided with IT equipment and support, grants for office furniture and a dedicated phone and email help desk. Teleworking has been developed at BT as a core element of fundamental restructuring of the company’s operation since the early 1990s. BT has also introduced teleconferencing.
K.41 A team of five people is assigned the programme to support BT teleworkers, and an estimate of cost would put this at approximately £100,000 per year.
K.42 Surveys of employees who regularly telework suggest that they have reduced their weekly mileage by 95 to 193 mile, have increased their productivity, and benefit from other more subtle advantages such as less stressful lifestyles resulting in lower levels of absenteeism. Teleworking is now embedded within BT policy and is attracting a steadily increasing number of employees, passing 7,500 in summer 2003.
Walking: Promoting Walking in York, Johnson and Carter (2000)
K.43 In order to promote and increase walking the City of York Council launched a travel awareness scheme in July 2001. The campaign focused on the health and environmental benefits of walking and attempted to challenge the domination of car industry advertising. The campaign focused on walking alone (rather than walking and cycling) and also aimed to ‘de-market’ the car through imitating the style of car advertisements. The campaign therefore used the messages from car advertising such as a sense of freedom, attractive lifestyle images and family values. The campaign was a sustained attempt to influence travel behaviour (running for approximately 8 months) rather than a one-off week or event. This approach was favoured in order to avoid campaign fatigue amongst the public and also to try and introduce a lasting change in travel behaviour rather than a short one-day response.
K.44 The campaign involved using:
• Advertising on the back of buses • Backs of parking tickets • Postcards to major employers, bars and cafes • A launch to the public and media.
K.45 York is an historic city, with 180,000 residents. York enjoys almost full employment and
attracts four million visitors every year, both of which contribute to the city’s high levels of congestion. The city has invested in a network of cycle routes, a pedestrianised city centre and other walking routes and four (at the time of this campaign) Park & Ride services. The campaign cost in the region of £88,000 for graphic design, print and purchase of media space. Council officer time is not included in this figure.
K.46 The results of the campaign were assessed when it ended in February 2002 via 500 on-street surveys in eight locations around the city. The behavioural impact evaluation showed that amongst car drivers who had seen the campaign 40.6% reported an increase in their walking, compared with 29.6% who had not seen the campaign. The DfT report on Smarter Choices (Cairns 2004) estimated that this campaign had influenced between 3.3 and 12% of car drivers in the city.

H070130: Sevenoaks Transport Study Ref : Appendix K
K
Other DfT initiatives K.47 In order to take Smarter Choices forward the DfT has set up two projects: the Centres of
Excellence and the Sustainable Towns Demonstration Project.
The Centres for Excellence
K.48 The DfT’s Centres for Excellence initiative is designed to highlight good practice in local transport planning and encourage local authorities to share their experiences. The authorities responsible for 16 local transport plans (LTPs) in England have been designated as Centres of Excellence (COE) on the basis of their LTPs and subsequent annual progress reports. One further COE, Cornwall, was designated separately as a COE for Rural Transport as part of a specific initiative. Kent was not selected.
K.49 The authorities responsible for these LTPs will be undertaking a range of good practice dissemination activities aimed at other local authorities across a range of local transport issues as part of their commitment to the COE initiative. Smarter Choices are expected to feature significantly in these experiences. Evidence suggests that these are having an impact.
Centre of Excellence for Integrated Transport Planning: Merseyside TravelWise K.50 This Travel Awareness Campaign involved workplace and school travel plans, car
sharing, and promoting public transport, walking and cycling. In addition to reducing car trips, a key aim is to try and improve social inclusion and accessibility, in particular for the most deprived areas. The campaign targeted all residents in the Merseyside PTA area.
K.51 The overall Smarter Choices budget for 2006/07 was £626,000. The results from the schools data has shown a 2.4% cut in car use, which has been achieved against a general trend of rising car use of around 5%.
Centre of Excellence for Integrated Transport Planning: Nottinghamshire K.52 The ‘Big Wheel’ is the branding for Nottinghamshire’s transport strategy and also a long
term travel awareness campaign. It involves building awareness and support for the aims of the County’s LTP, promote workplace and school travel plans and increase use of car sharing, public transport, walking and cycling. The campaign includes a dedicated website, unique and eye catching branding and information guides.
K.53 An annual survey is undertaken which measures the impacts the Big Wheel is having, including recognition of the campaign and brand.
Sustainable travel demonstration towns
K.54 This 5-year DfT project aims to demonstrate the effect a sustained package of 'Smarter Choice' measures can have when coupled with infrastructure improvements. Darlington, Peterborough and Worcester were selected as 'showcase' demonstration towns. A range of interventions are being adopted both infrastructural as well as encouraging behavioural change by soft measures.
Peterborough Sustainable Transport Demonstration Town K.55 Sustrans and Socialdata were commissioned in autumn 2004 to undertake an extensive
programme of travel behaviour research in each of the towns. The aims of the research in each town were to support local decision-makers in developing their programmes and to provide a baseline against which their outcomes could be measured.
K.56 The key objectives were to provide:

H070130: Sevenoaks Transport Study Ref : Appendix K
K
• a comprehensive database of personal travel behaviour to describe the day-to-day mobility of each Town's population;
• an assessment of public attitudes towards, and perceptions of, local transport issues; and
• a detailed analysis of the potentials for increasing levels of walking, cycling and use of public transport
K.57 In one of the showcase towns, Peterborough, research shows that, for example, on an
average day people make 3.0 trips with 5.2 legs, performing 1.7 out-of-home activities. Per day they spend almost one hour (52 minutes) travelling per person covering an average distance of 21 kms.
K.58 The travel behaviour of most people in the town is quite simple: 40% of all people have just one journey per day with only one out-of-home activity. More than three quarters (78%) of all journeys are just for one activity. In total 86% of all trips start from home or lead back to home. Only 14% of all trips are between two out-of-home destinations. Leisure accounts for more than a quarter of all trips made by Peterborough residents (28%), shopping and travel to work one fifth each (21%). Travel to school or college accounts for 10 % of all trips. On an average day 22% of trips made by Peterborough residents is on foot (i.e. a genuine walking trip), while 5% are made by bicycle. Motorised private modes (car as driver or passenger, motorbike) account for two thirds of all trips; the majority of these trips is made by car as driver (43%). Travel by car as passenger accounts for more than one fifth of all trips (23%). Public transport is used for 6% of all trips.
K.59 The research also reveals the importance of short, local trips:
• Around 20% by Peterborough residents is no further than one km and two fifths of all trips are no longer than three kms.
• Almost two thirds of trips (65%) are in the range of five kms and another 20% are between 5.1 and 10.0 kms. Only one seventh of all trips is longer than ten kms.
• On more than four fifths (83%) of all their trips Peterborough residents remain within the Peterborough urban area, (i.e. the trips begin and end in the city). The average distance of these trips is about 4 kms.
• Despite this, the city centre is the destination or starting point for only 8% of all trips made by Peterborough residents. The share of public transport for trips to or from the city centre is much higher than for all trips (22% compared to 6%). This public transport share is equally high for shopping trips to or from the city centre (22%).
K.60 The analysis reveals that in principle significant shifts in travel behaviour are possible, for
example:
• Three out of five of all trips could be undertaken by sustainable travel modes; or
• Around six out of seven trips could be made by motorised private modes.
K.61 The in-depth research also showed that two fifths of all current car trips within
Peterborough are, in principle, replaceable by sustainable travel modes as follows:
• a sixth by public transport; • a quarter by cycling; and • 12 % by walking.
K.62 A lack of information and poor perceptions of service quality were among the most
important barriers against greater public transport use. Furthermore there were no

H070130: Sevenoaks Transport Study Ref : Appendix K
K
constraints or even subjective barriers preventing a significant proportion of car trips from being switched to walking or cycling. This demonstrates that Peterborough’s ‘Travelchoice’ programme, by focusing on soft measures (i.e. information, motivation etc), has the potential to unlock significant shifts towards use of sustainable travel modes.
K.63 Similar results have been found in the other two demonstration towns: Darlington and Worcester.
Overseas Experience K.64 Much experience exists overseas of the benefits of Smarter Choices and similar
programmes in achieving behavioural travel change.
Individualised Travel Marketing in Perth
K.65 Individualised Travel Marketing (ITM) is an innovative approach to changing travel behaviour through direct contact with households. It encourages people to make greater use of alternatives to car travel by offering them personalised travel information, advice and incentives to try out new ways of getting around –essentially a form of personalised travel planning.
K.66 ITM has been used to promote public transport, walking and cycling in projects across Europe and Australia. In particular, one large scale application covering 35,000 people in Perth (Western Australia) achieved a sustained 14% reduction in car trips and increases in walking of 35%, cycling 100% and public transport use 17%.
K.67 ITM recognises that there is a often a gap between public perception of alternative modes of transport and the reality. Due to a lack of personal experience of, or information on the options available, travelling on foot, by bike or by public transport can seem less attractive than it is. As a result most people make trips by car which could be made just as easily by other modes.
K.68 The traditional approach to changing travel behaviour has been through various measures such as the provision of transport services and infrastructure, which can be of limited value if people are unaware of the improvements. By offering up to date and local information on transport alternatives, together with incentives and further support to try them out, ITM aims to improve people's perceptions of the services and facilities available. This enables them to make more informed travel choices, reducing their car use by switching to other transport modes when it makes sense to do so.
Personalised Travel Planning: Individualised Marketing to Households in Viernheim, Germany (TAPESTRY, 2003)
K.69 The city authority in Viernheim, Germany created an excellent cycling and walking infrastructure, improved public transport and introduced traffic calming measures. These were supported by Individualised Marketing through a phased, targeted approach. In being the first German city to introduce Individualised Marketing, Viernheim acted as a pilot for the rest of the country. Some 3800 households in the Nordweststadt, Weststadt and Breslauer Berg areas of Viernheim were targeted, involving 9120 residents.
K.70 Comparisons before and after the campaign show an increase in sustainable modes was recorded:
• Walking: 7% increase • Bicycle: 10% increase • Public transport: 29% increase • Journeys by car (as a driver) were reduced by 12%.
K.71 The Viernheim pilot was described as a success, demonstrating that Individualised
Marketing could have a positive impact on travel behavioural change.

H070130: Sevenoaks Transport Study Ref : Appendix K
K
Cycling: Wolford – Promoting Cycling to a Place of Employment (‘Mobility Management Manual’ TREATISE, 2005)
K.72 Cycling was promoted to 1,300 employees by implementing the following measures:
• Relocation of cycle parking to the office entrances (underground cycle parking);
• Relocation of car parking away from the office entrances; • Establishment of a cycle service, maintenance and air pump station; • Free roadworthiness check for bicycles; • Company pool bicycles; • Cycle excursions for employees; • Cycle marketing; • Information on cycling; • Cycling promotional competitions;
K.73 From 1993 to 1996 the proportion of employees cycling to work rose from 18% to 35%.
Over the same period, the proportion travelling by car decreased from 34% to 22%. The results show that over a three year period consistent improvements in modal shift have been achieved.
Cycling Odense: the National Cycle City of Denmark (Troelsen, 2004)
K.74 Odense was the official National Cycle City of Denmark from 1999 – 2002. The main aims of the project included increasing the number of journeys by bicycle in Odense by 20% by the end of 2002, compared to the years 1996-1997 and a 20% increase in the number of people who use a bicycle more than three times a week.
K.75 The project included physical improvements to cycle infrastructure, changes in regulations and promotional campaigns, with new initiatives in several areas, including:
• Access for cyclists; • Better and safer parking for cyclists; • Image building activities; • Action-based activities aimed at children and adults; • Focus on operational quality; and • The behaviour of cyclists in traffic.
K.76 The project had a budget of DKK 20 million (about £1.82 million) and ran for four years.
Fifty different projects were developed and implemented in Odense, including physical improvements, changes in regulations and campaigns.
K.77 Overall the volume of cycling traffic increased 22% in 1999-2002 compared to 1996-1997 and this had increased to 24% by the end of 2002. An average of 25,000 new cycling journeys per day occurred during the project period corresponding to 35 million new cycling journeys during the whole project period. Traffic safety also improved; personal injuries amongst cyclists due to accidents involving more than one party fell by 19% from 1996-1997 to 1999-2000 and by 20% by the end of 2002. This met the target set for this area too.
K.78 New cyclists appear to have continued cycling so the volume of cycling traffic was at the same high level in 2003 due to the integration of “soft” and “hard” measures. In addition, the public health of citizens of Odense has also improved, with men gaining five months on their average life expectancy in the period of the project. Citizens received half a day’s less social security benefits than expected. The resulting savings equalled DKK 41 million in the project period 1999-2002. Cost for health insurance increased in the same period by DKK 8 million. Therefore a net DKK 33 million saving was achieved for the DKK 20 million spent on the project, demonstrating that the integration of Smarter Choices with infrastructure improvements can be cost-effective.

H070130: Sevenoaks Transport Study Ref : Appendix K
K
Odense walking campaign
K.79 A Step in the Right Direction was a campaign that focused on walking in and around Odense in Denmark. The campaign was carried out 18th April - 15th May 2005 as a co-operation between Odense and Slagelse. In order to encourage daily exercise both Odense and Slagelse handed out 5,000 and 1,000 pedometers respectively for free. All the pedometers were distributed after three days. The pedometers were distributed in co-operation with three sport shops and a supermarket.
K.80 With a pedometer in the belt people can see how much walking and moving they are doing during a day. It also provides an idea about the energy consumption and how many kms people walk during a day, a week and a month. This contributes to encouraging daily exercise.
K.81 In Odense the participants in the campaign were offered 13 guided tours in the local areas of Odense. In addition to this the city council made 4 new maps from each area of Odense with suggestions to walks. Two-third of the participants were women and two thirds of the participants were under 50 showing that walking is not only of interest to older people. There were more women represented among the 30-60 year old than men.
Mobility Management: Targeting households in Lundby, Göteborg (Target, 2005)
K.82 A Mobility Management Centre was set up in Lundby, a district of Göteborg. It developed a number of different smarter choices approaches to promote sustainable travel through mobility management. These included:
• information meetings, • outdoor activities, • bus side advertising displays, • cycling marketing campaign • website pages, • telephone marketing techniques, and • door-to-door information drops.
K.83 In 2003 the ‘Scrap your Old Car’ campaign was launched as older cars account for more
than half the emissions of hydrocarbons, carbon monoxide and sulphur oxides in Sweden. The aim was to raise people’s awareness of the problem, scrap old cars and encourage people to join car sharing schemes. This inventive project offered the owners of old cars free public transport for one year, or free one year membership in a car pool. Information was sent to 2300 car owners. A Lundby car clubs campaign provided information at meetings and advertising on all buses across Göteborg.
K.84 A car emission campaign was launched to raise awareness about the environment and car emissions. The main communication method was leaflet information drops to all households in the area, supported by direct marketing telephone calls to all 4,000 car owners. The short telephone calls provided information about car-sharing, walking, cycling and public transport as well as information about eco ‘green’ driving and clean vehicles. A measurement station for emissions from old cars was set up in the Lundby area. Motorists passing the measurement station could see how their vehicle affected the environment and a snapshot indication of their driving habits.
K.85 The project was delivered through a transport “Mobility Management Centre” in Lundby, Goteborg. To reduce the expected increase in car trips due to new housing and employment on the Island of Lundby, a mobility management centre was established to support investment in sustainable transport infrastructure. The Lundby Mobility Management Centre is a one stop centre to provide information and promote the use of public transport, car clubs, car sharing, teleworking, cycling and walking.
K.86 This project was undertaken as part of the EU Region Development Fund and Interreg III funded Target 2 project which aimed to develop, implement and evaluate a package of

H070130: Sevenoaks Transport Study Ref : Appendix K
K
mobility management activities to promote, facilitate and encourage the use of alternative modes of transport to the car.
K.87 In October 2004 invitations were sent out to attend a special ‘scrap that car’ launch day, with 30 people officially scrapping their cars. During the first six months of the campaign 96 residents of Lundby chose to scrap their cars. Car clubs in Lundby have grown with over 120 members using a total of eight cars, which is attributed to the information and advertising campaign.
K.88 The performance of the car emission campaign was not directly evaluated. However, 80% of those called requested more information.
K.89 The overall Lundby household project is monitored annually through survey questionnaires. Results for 2004 with 900 households involved showed that 20% of people questioned had considered changing their travel patterns with an actual 4% having changed their travel behaviour as a consequence of the Lundby mobility management centre campaigns.
Transport Management Associations: Lloyd District Transport Management Association, (Annual Report, 2006)
K.90 The aim of the Lloyd District TMA in Portland USA is to ‘improve access and mobility for those who work, reside, shop and commute in and to the Lloyd District’. In order to achieve this, the TMA focuses on improving public transport, journey sharing, parking management and pedestrian and cyclist measures. The Lloyd TMA has been running for 10 years.
K.91 Examples of schemes the TMA has implemented include ‘Commuter Connection’, which is a ‘retail transportation store that brings a new level of convenience for access to transportation information and services.’ As well as improving cycling and walking facilities and public transport services the LDTMA also promotes the use of these modes. One scheme used to facilitate public transport use is the ‘Passport Transit Pass Program’ which is an annual pass that can be used in all zones of the district, and can be purchased by employers at a reduced rate for employees.
K.92 There are 9,000 employees of TMA members, residents and visitors to Lloyd District. The Lloyd District has 650 businesses and 20,000 employees. The Lloyd District Transportation Management Association (LDTMA) was set up in 1995 and now has 69 member businesses which cover approximately 9,000 employees. In 2005 the total TMA funds targeted at trip reduction activities came to $210,200 (about £378,000).
K.93 In 2005 the modal share of the drive alone category was 42.7%, which is a reduction from 1997 figure of 60%. This percentage (of drive alone trips) has decreased in 6 out of the last 7 years. Public transport use has also increased in the same period (21% - 39.1%) particularly among Passport Transit Pass Members. Overall this has reduced about 1,000 daily peak period vehicle trips and about 3.9 million annual vehicle-miles.
K.94 The Lloyd TMA initiatives also resulted in improved air quality, increased capacity for customer and visitor trips and reductions in future development costs for the provision of parking.
The EU CiViTAS programme
K.95 CiViTAS is an EU initiative aiming to help cities to achieve a more sustainable, clean and energy efficient urban transport system by implementing and evaluating an ambitious, integrated set of technology and policy based measures. CiViTAS works on two strands: the organisation and improvement of transport systems, and understanding the human reality which is motivated by pricing, ticket flexibility, accessible systems and education.

H070130: Sevenoaks Transport Study Ref : Appendix K
K
CiViTAS CARAVEL K.96 One such measure is the Stuttgarts Carpooling service ‘Pendlernetz Stuttgart’ which is
supplemented by an event oriented carpooling feature. (CiViTAS CARAVEL). CiViTAS CARAVEL is an internet-based platform of carpooling that offers a new feature especially for big events. This new feature was offered to the public the first time for the top game of the German 1st Soccer-League (Bundesliga) in 2007. “Event-oriented carpooling” involves the organisation of car-pools to big events in Stuttgart. Since around 50,000 visitors are expected to visit each match, the demand for travel to one location at the same time is very high. Visitors now get the opportunity to reach the stadium fast, cheap and in an environmental friendly way by using the new event-oriented carpooling available on the internet. The Stuttgart car-pooling system aims to organise car-pools from door to door, especially for commuters in the Stuttgart Region. The service, which itself is free of charge, is operated by the Stuttgart Mobility Centre, with the aim to improve the mobility of all citizens and visitors of the city and the region of Stuttgart.
K.97 CiViTAS CARAVEL also involves the Genoa Info Mobility Bus. This hybrid bus was transformed into a mobile information centre on active transport services in the City of Genoa The centre distributes information and collects comments and suggestions from citizens in a visitors' book. The CiViTAS CARAVEL InfoMobility Bus allows people to provide suggestions, needs and comments on public transport and mobility in the town.
CiViTAS SMILE K.98 Another CiViTAS project involves public transport priorisation in Tallinn (CiViTAS SMILE).
The city has had many problems regarding co-ordination and co-operation as a result of a drawn-out procurement process. A five sided contract was therefore finalised in December 2006 between the City of Tallinn, Tallinn Bus Company (TAK), Tallinn Tram and Trolleybus Company (TTTK) and other operators.
K.99 As a result public transport priorities are being introduced. The public transport vehicle priority service system, which includes 26 intersections on 12 km of lanes reserved for public transport vehicles, 6 bus and 3 trolleybus lines and equipment for 63 buses and 48 trolleybuses, will come under a common organisation. The passenger information system, which is based on GPS and contains modern internal and external information displays, sound notification systems and on board computers on 252 buses (plus 20 trailers), 52 trams and 89 trolleybuses is also being synchronised and integrated.
CiViTAS MOBILIS K.100 CiViTAS MOBILIS is another EU project in Ljubljana (Slovenia). During a three day
meeting, the host city organised a dedicated workshop on safe cycling. During this workshop, the participants were informed by the EC on recent developments regarding cycling in the EU, followed by presentations of cycling safety issues in the four CiViTAS MOBILIS cities Ljubljana, Odense, Toulouse and Venice. Ljubljana and Toulouse have focused mainly on the construction of cycle lanes and routes throughout their cities. Odense on the other hand reported on a whole range of activities regarding cycling they implemented: introduction of green waves for cyclists, maintenance of cycle paths in wintertime, construction of a cycle centre, introduction of permanent cycle lights. The city of Venice described its city bicycle plan.
K.101 The city of Ljubljana has made a significant effort in order to improve cycling within its city centre, including the construction of cycle lanes and cycle parking. Although difficulties such as people parking their cars on bicycle lanes and pavements still remain. Within the CiViTAS MOBILIS project the city has started an awareness raising campaign in order to put an end to this prohibited parking.

H070130: Sevenoaks Transport Study Ref : Appendix K
K
CiViTAS SUCCESS K.102 UK involvement in CiViTAS was in the form of a political meeting in Preston (CiViTAS
SUCCESS) in March 2006. Politicians from other cities and projects discussed four topics: the need to develop a common language of sustainability; supporting political champions for best practice; involving politicians and citizens; using subsidiarity in the interest of citizens.
K.103 The SUCCESS participants and their city representatives are actively involved in CiViTAS Forums, which gather together those who are keen to make cities a better place to live now and for the future.

CENTRUM HOUSE, 38 QUEEN STREET, GLASGOW G1 3DX
T 0141 221 4030 F 0141 221 4050 E [email protected] W www.jmp.co.uk
CBC HOUSE, 24 CANNING STREET , EDINBURGH EH3 8EGT 0131 272 2705 F 0131 272 2805
E [email protected] W www.jmp.co.uk
3RD FLOOR, CATHEDRAL BUILDINGS, DEAN STREET, NEWCASTLE UPON TYNE NE1 1PG T 0191 261 2261 F 0191 261 1122
E [email protected] W www.jmp.co.uk
20 ADELAIDE STREET, BELFAST, BT2 8GB T 02890 434646 F 02890 434647
E [email protected] W www.jmp.co.uk
MINERVA HOUSE, EAST PARADE, LEEDS LS1 5PS T 0113 244 4347 F 0113 242 3753
E [email protected] W www.jmp.co.uk
BLACKFRIARS HOUSE, PARSONAGE, MANCHESTER M3 2JA T 0161 831 5600 F 0161 831 5601
E [email protected] W www.jmp.co.uk
CASTLE CHAMBERS, 43 CASTLE STREET, LIVERPOOL L2 9SH T 0151 231 6140 F 0151 231 6141
E [email protected] W www.jmp.co.uk
LATCHFORD HOUSE, LYNN LANE, SHENSTONE BUSINESS PARK, SHENSTONE, LICHFIELD, STAFFORDSHIRE, WS14 0SB T 01543 482300 F 01543 482399
E [email protected] W www.jmp.co.uk
AUDREY HOUSE, 16-20 ELY PLACE, LONDON, EC1N 6SN T 020 7405 2800 F 020 7430 9049
E [email protected] W www.jmp.co.uk
THE LANTERNS, LANTERNS COURT, MILLHARBOUR, LONDON E14 9TU T 020 7515 5579 F 020 7538 2946
E [email protected] W www.jmp.co.uk
7TH FLOOR, TOWER POINT 44, NORTH ROAD, BRIGHTON BN1 1YR T 01273 666380 F 01273 666381
E [email protected] W www.jmp.co.uk
FLOOR 2, 66 QUEEN SQUARE, BRISTOL, BS1 4JP T 01179 876216 F 01179 876217
E [email protected] W www.jmp.co.uk
1ST FLOOR, CORNWALL BUILDINGS, 45-51 NEWHALL STREET, BIRMINGHAM , B3 3QR T 0121 222 4141 F 0121 222 4142
E [email protected] W www.jmp.co.uk
JMP Consultants Ltd, Registered Office: Centrum House, 38 Queen Street, Glasgow G1 3DX. Registered in Scotland No. 88006