SEVEN STEPS TO CUSTOMER SUCCESS AT SCALE
64
Seven Steps to Customer Success at Scale Thomas E. Lah Executive Director TSIA
-
Upload
totango -
Category
Technology
-
view
1.108 -
download
1
Transcript of SEVEN STEPS TO CUSTOMER SUCCESS AT SCALE
Seven Steps to Customer Success at Scale
Thomas E. Lah
Executive Director
TSIA
The Discussion
• The current state of the XaaS business model
• The Four Cost Buckets of XaaS
• Seven steps to Customer Success at Scale
2
Current State of XaaS
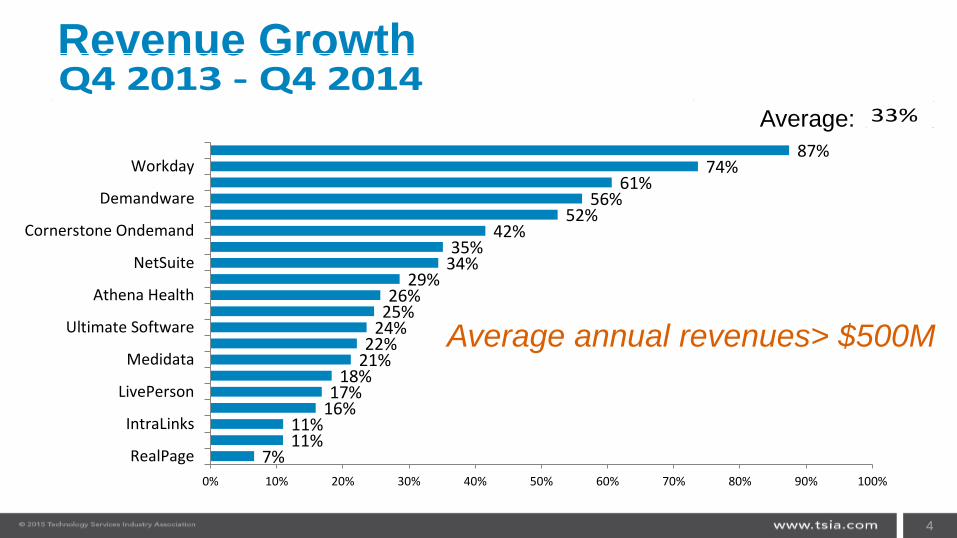
Revenue Growth
4
Average:
Q4 2013 - Q4 2014
7%11%11%
16%17%
18%21%22%
24%25%26%
29%34%35%
42%52%
56%61%
74%87%
0% 10% 20% 30% 40% 50% 60% 70% 80% 90% 100%
RealPage
IntraLinks
LivePerson
Medidata
Ultimate Software
Athena Health
NetSuite
Cornerstone Ondemand
Demandware
Workday
33%
Average annual revenues> $500M
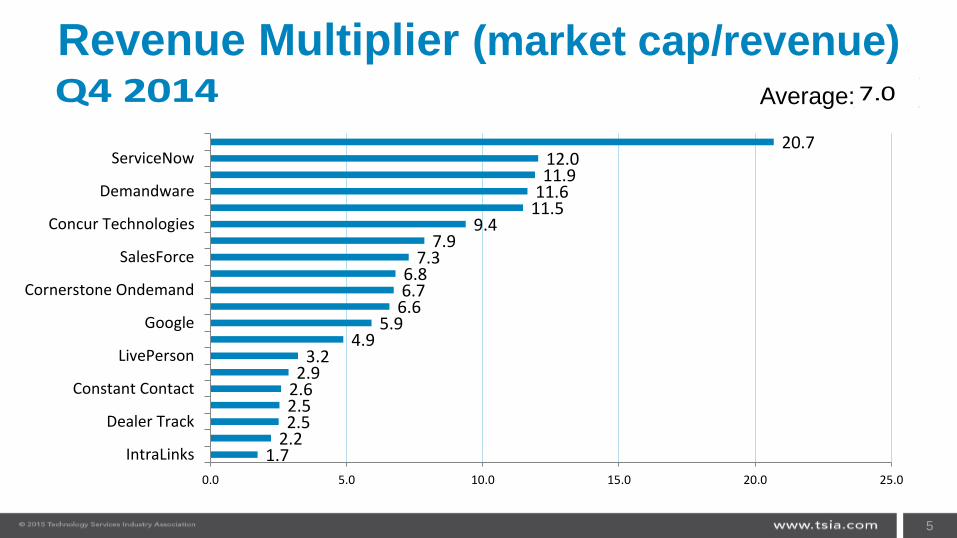
Revenue Multiplier (market cap/revenue)
5
Average:Q4 2014 7.0
1.72.22.52.52.62.9
3.24.9
5.96.66.76.8
7.37.9
9.411.511.611.912.0
20.7
0.0 5.0 10.0 15.0 20.0 25.0
IntraLinks
Dealer Track
Constant Contact
LivePerson
Cornerstone Ondemand
SalesForce
Concur Technologies
Demandware
ServiceNow
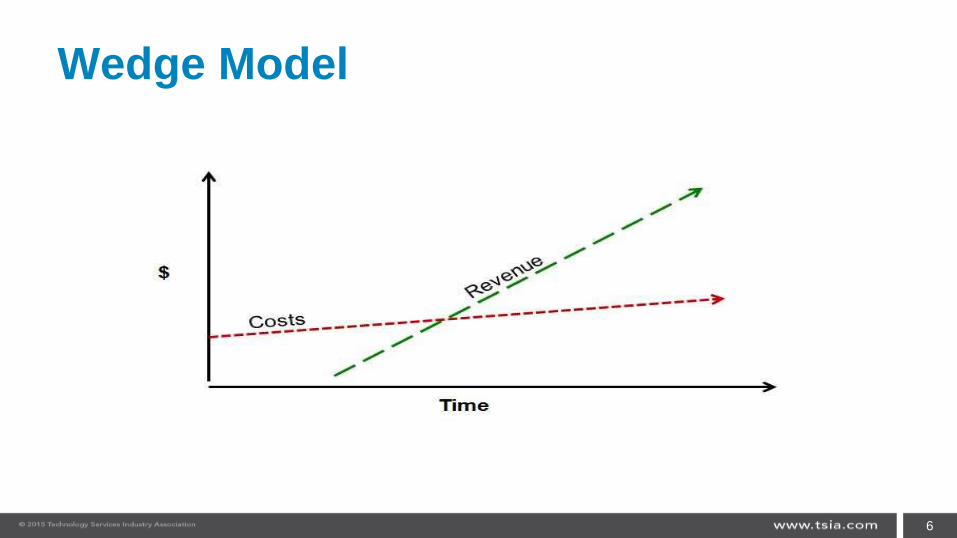
Wedge Model
6
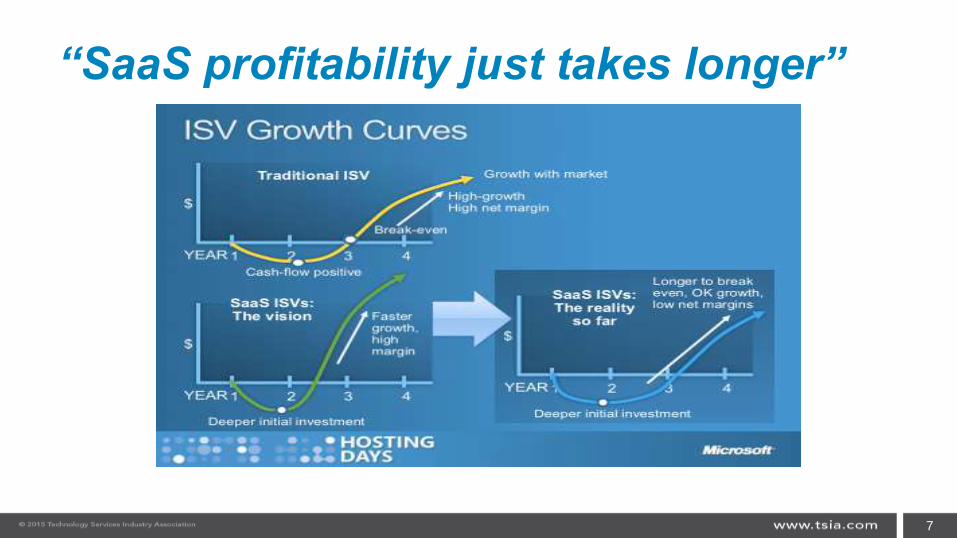
“SaaS profitability just takes longer”
7
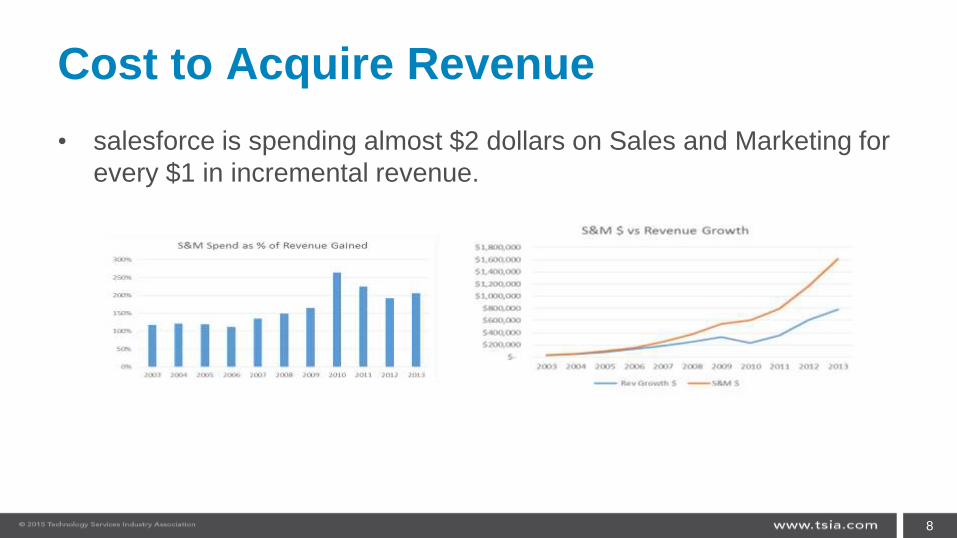
Cost to Acquire Revenue
• salesforce is spending almost $2 dollars on Sales and Marketing for
every $1 in incremental revenue.
8
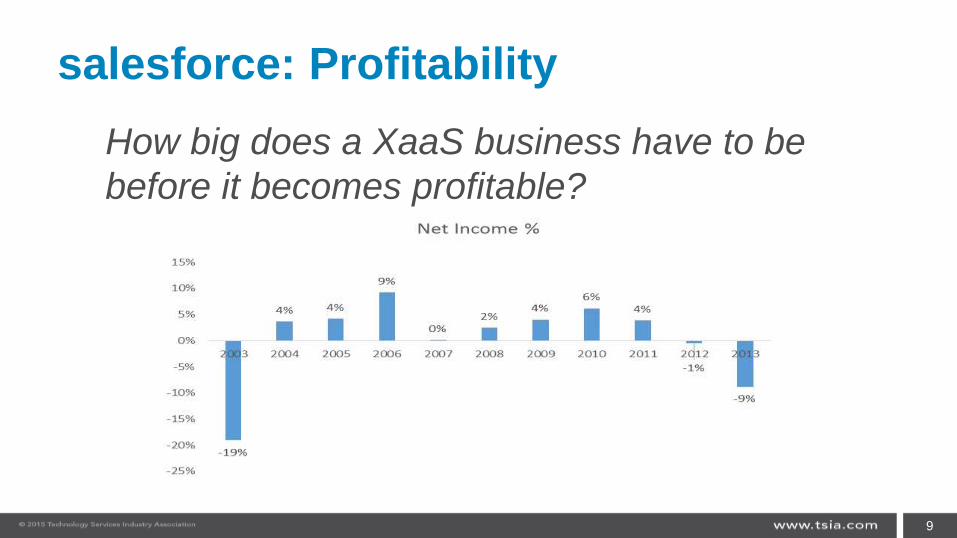
salesforce: Profitability
How big does a XaaS business have to be
before it becomes profitable?
9
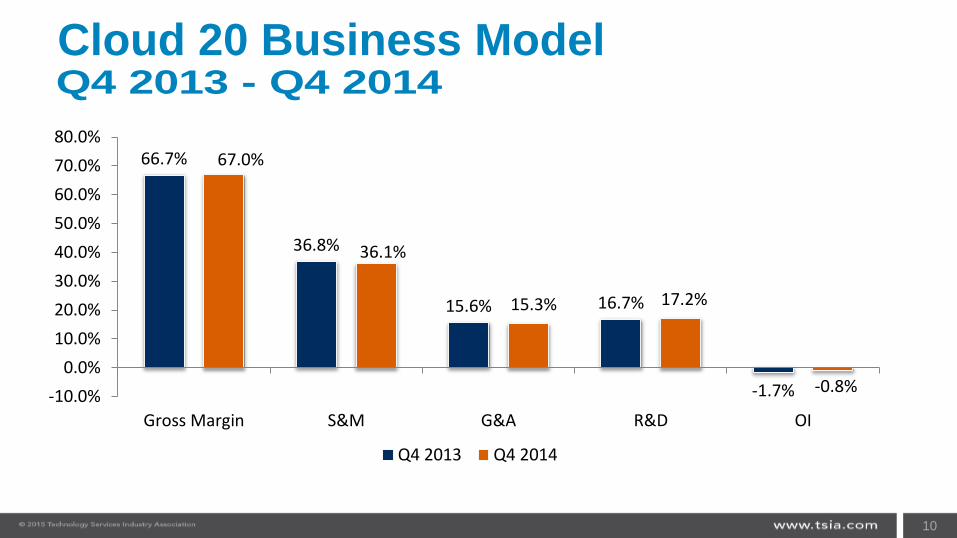
Cloud 20 Business Model
10
Q4 2013 - Q4 2014
66.7%
36.8%
15.6% 16.7%
-1.7%
67.0%
36.1%
15.3% 17.2%
-0.8%-10.0%
0.0%
10.0%
20.0%
30.0%
40.0%
50.0%
60.0%
70.0%
80.0%
Gross Margin S&M G&A R&D OI
Q4 2013 Q4 2014
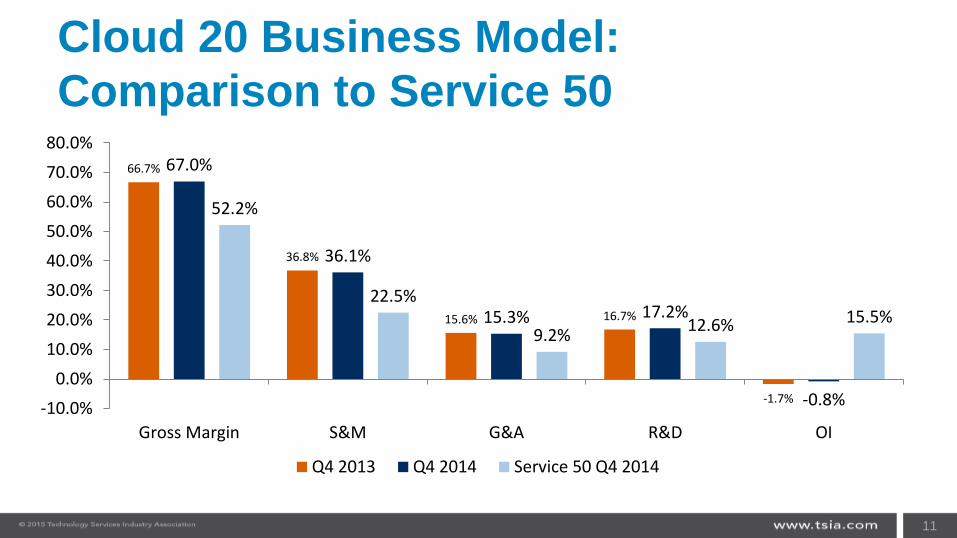
Cloud 20 Business Model:
Comparison to Service 50
11
66.7%
36.8%
15.6% 16.7%
-1.7%
67.0%
36.1%
15.3% 17.2%
-0.8%
52.2%
22.5%
9.2%12.6% 15.5%
-10.0%
0.0%
10.0%
20.0%
30.0%
40.0%
50.0%
60.0%
70.0%
80.0%
Gross Margin S&M G&A R&D OI
Q4 2013 Q4 2014 Service 50 Q4 2014
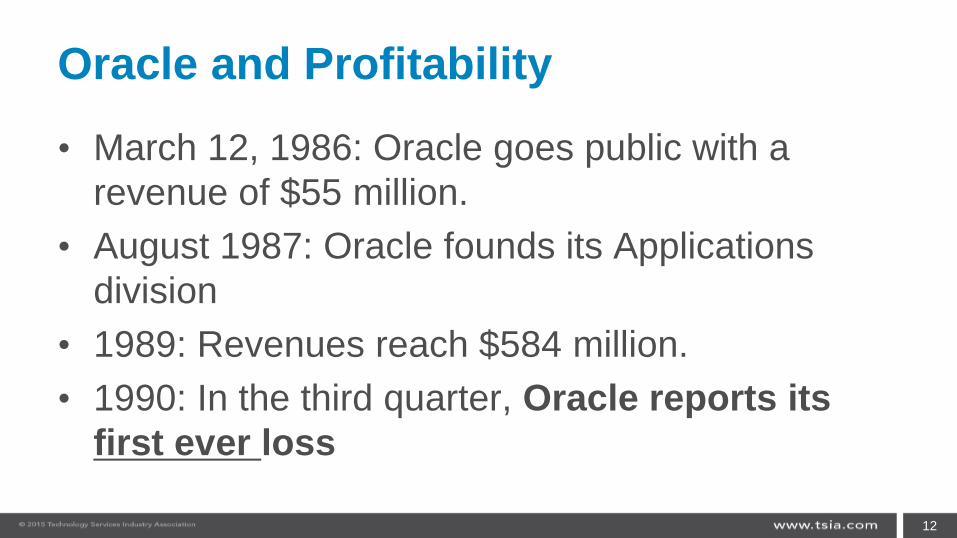
Oracle and Profitability
• March 12, 1986: Oracle goes public with a
revenue of $55 million.
• August 1987: Oracle founds its Applications
division
• 1989: Revenues reach $584 million.
• 1990: In the third quarter, Oracle reports its
first ever loss
12
Thomas and Tien
13
https://www.youtube.com/watch?v=c3zVp59HQ-0
XaaS Talk Track
• We are investing in growth (Sales and Marketing), that is what
investors value today.
• When we need to be profitable, we will reduce our high Sales and
Marketing expenses, making the business model profitable.
• Also, GAAP accounting does not truly reflect the health of an annuity
business.
– Have expense now (selling and adding customer) but revenue flows
over time so expense and revenues are not matched in a given year.
– We have line of sight to deferred revenues
14
Four Cost Buckets of XaaS
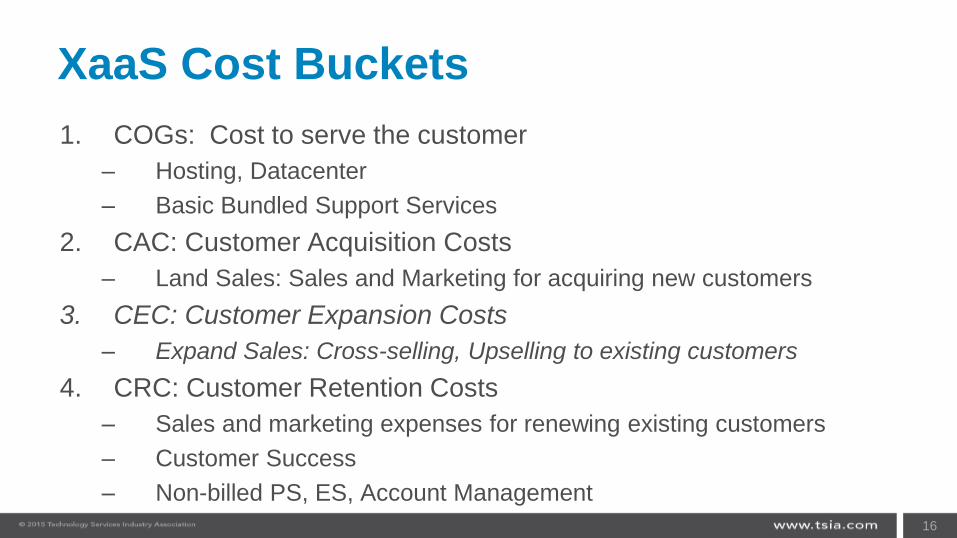
XaaS Cost Buckets
1. COGs: Cost to serve the customer
– Hosting, Datacenter
– Basic Bundled Support Services
2. CAC: Customer Acquisition Costs
– Land Sales: Sales and Marketing for acquiring new customers
3. CEC: Customer Expansion Costs
– Expand Sales: Cross-selling, Upselling to existing customers
4. CRC: Customer Retention Costs
– Sales and marketing expenses for renewing existing customers
– Customer Success
– Non-billed PS, ES, Account Management
16
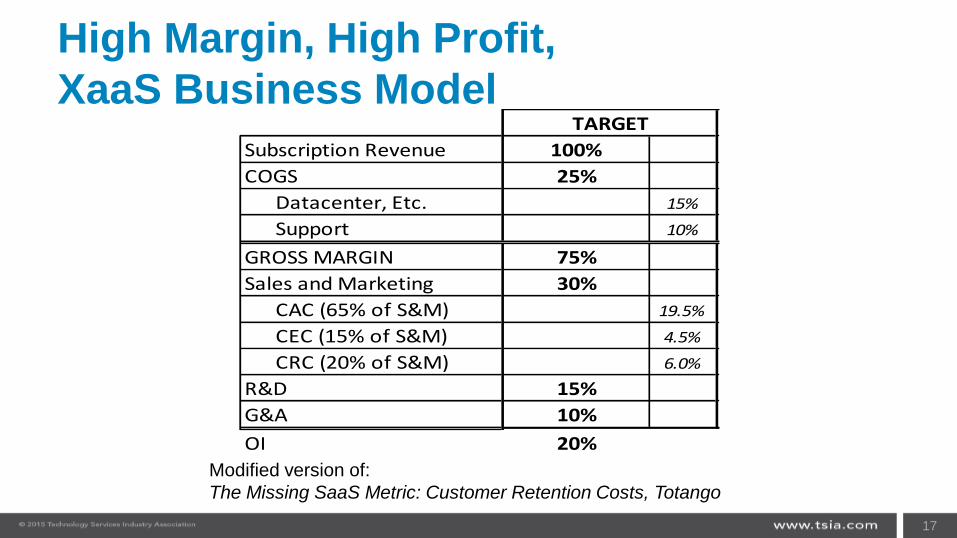
High Margin, High Profit,
XaaS Business Model
17
Modified version of:
The Missing SaaS Metric: Customer Retention Costs, Totango
Subscription Revenue 100%
COGS 25%
Datacenter, Etc. 15%
Support 10%
GROSS MARGIN 75%
Sales and Marketing 30%
CAC (65% of S&M) 19.5%
CEC (15% of S&M) 4.5%
CRC (20% of S&M) 6.0%
R&D 15%
G&A 10%
OI 20%
TARGET
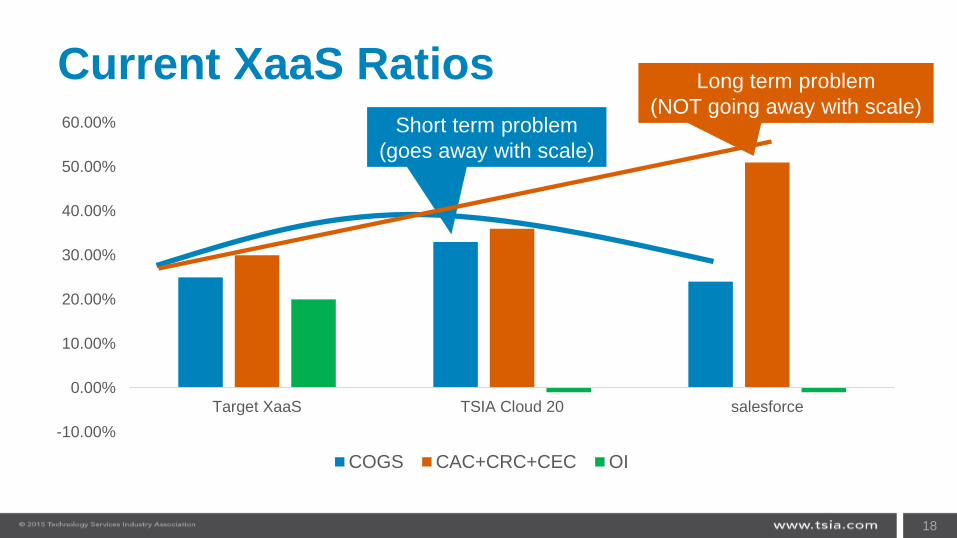
Current XaaS Ratios
-10.00%
0.00%
10.00%
20.00%
30.00%
40.00%
50.00%
60.00%
Target XaaS TSIA Cloud 20 salesforce
COGS CAC+CRC+CEC OI
18
Short term problem
(goes away with scale)
Long term problem
(NOT going away with scale)
Common XaaS Experience
• COGs do go down as the XaaS business scales
– So economies of scale do apply
• However CAC + CRC + CEC not declining enough to
create a profitable XaaS business model.
• TSIA POV: Customer Success is critical to
the long term profitability of the XaaS
business model.
19
Seven Steps for Customer
Success at Scale
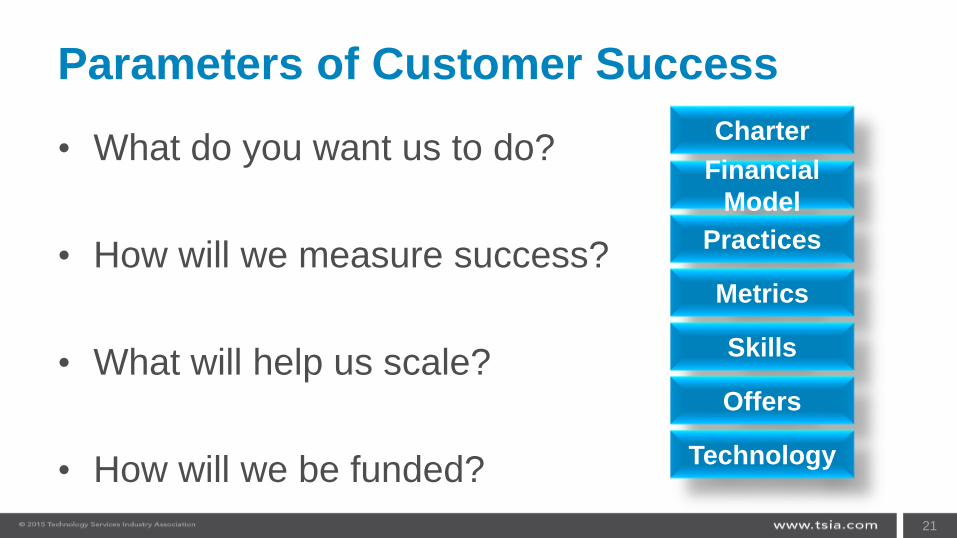
Parameters of Customer Success
• What do you want us to do?
• How will we measure success?
• What will help us scale?
• How will we be funded?
21
Charter
Financial
Model
Practices
Metrics
Skills
Offers
Technology
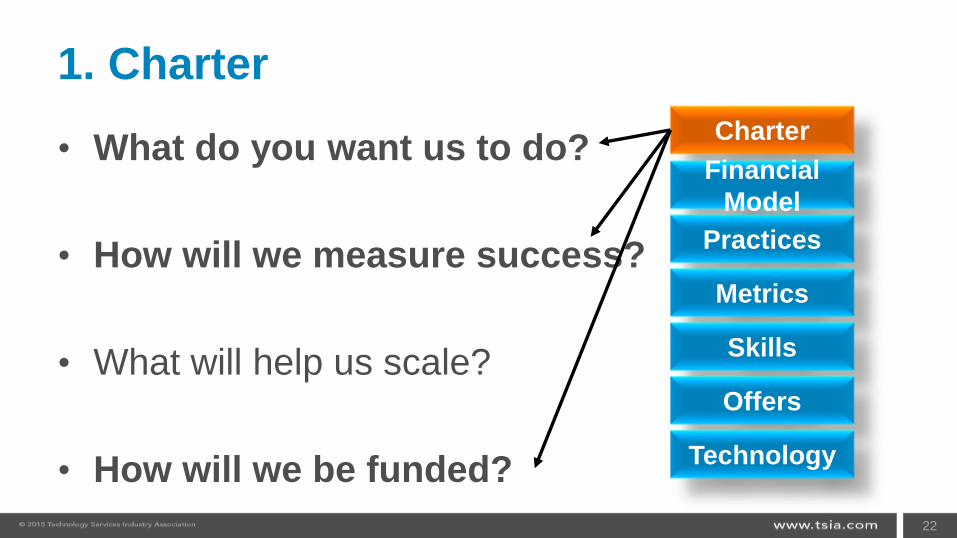
1. Charter
• What do you want us to do?
• How will we measure success?
• What will help us scale?
• How will we be funded?
22
Charter
Financial
Model
Practices
Metrics
Skills
Offers
Technology
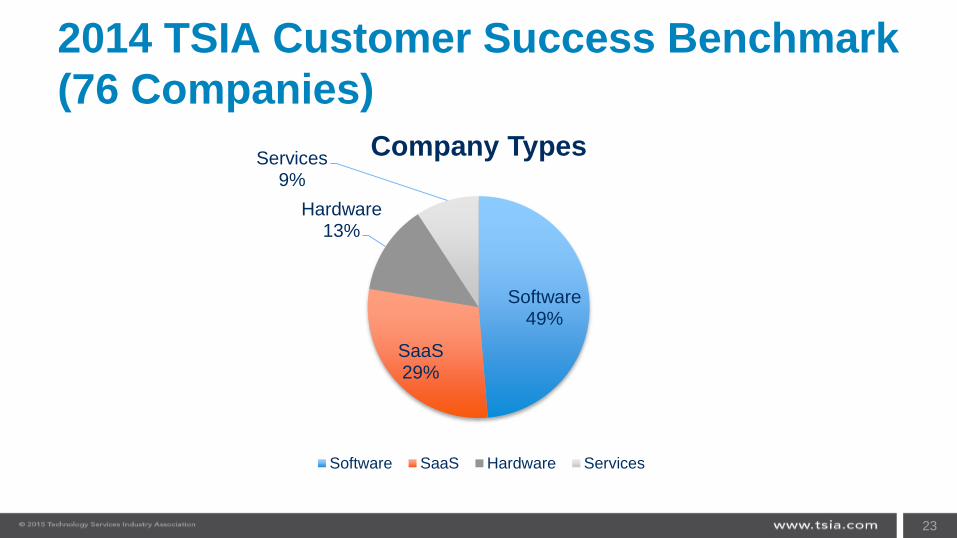
2014 TSIA Customer Success Benchmark
(76 Companies)
23
Software49%
SaaS29%
Hardware13%
Services9%
Company Types
Software SaaS Hardware Services
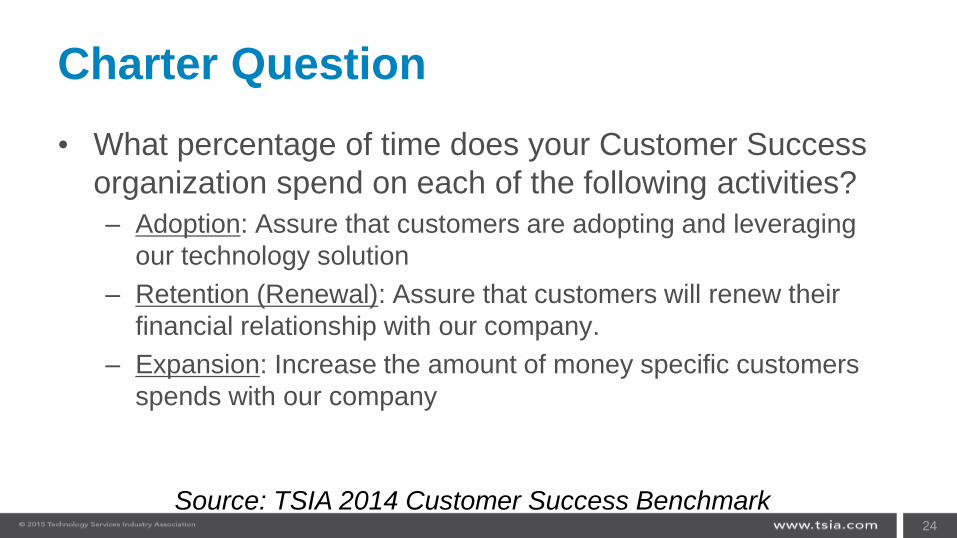
Charter Question
• What percentage of time does your Customer Success
organization spend on each of the following activities?
– Adoption: Assure that customers are adopting and leveraging
our technology solution
– Retention (Renewal): Assure that customers will renew their
financial relationship with our company.
– Expansion: Increase the amount of money specific customers
spends with our company
24
Source: TSIA 2014 Customer Success Benchmark
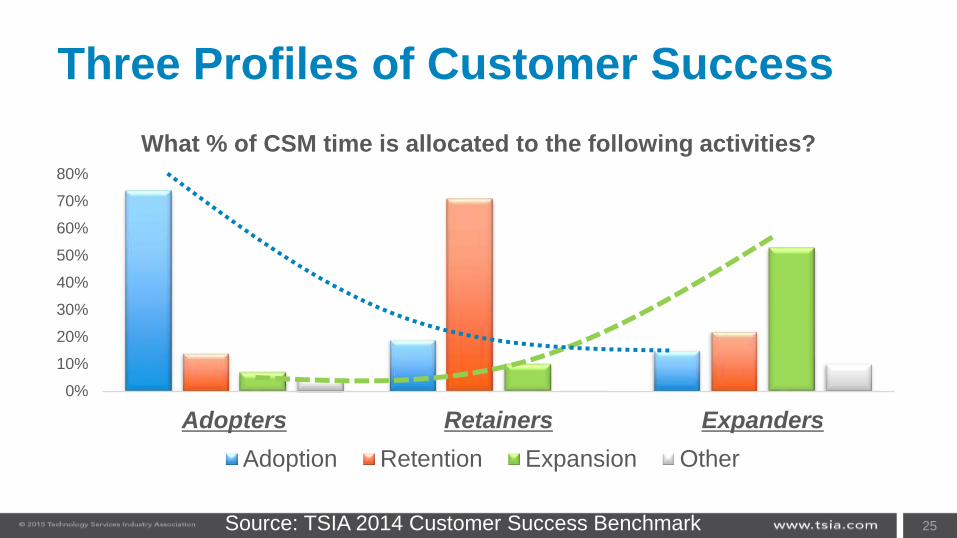
Three Profiles of Customer Success
0%
10%
20%
30%
40%
50%
60%
70%
80%
Adopters Retainers Expanders
What % of CSM time is allocated to the following activities?
Adoption Retention Expansion Other
25Source: TSIA 2014 Customer Success Benchmark
Audience Poll
• Predominate charter of your Customer Success
organization?
A. Adoption
B. Retention
C. Expansion
D. Other
26
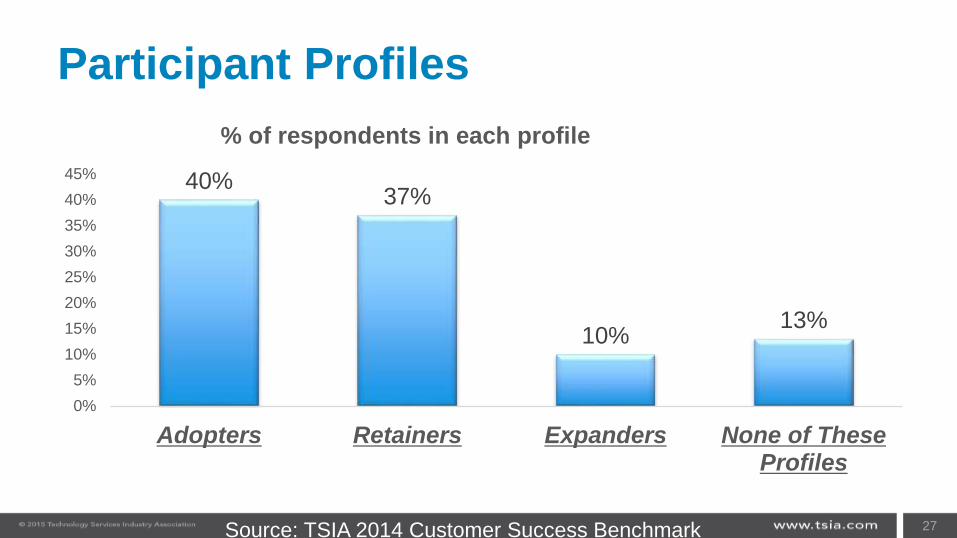
Participant Profiles
40%37%
10%13%
0%
5%
10%
15%
20%
25%
30%
35%
40%
45%
Adopters Retainers Expanders None of These Profiles
% of respondents in each profile
27Source: TSIA 2014 Customer Success Benchmark
Audience Poll
• Do you think the charter of the Customer
Success organization is impacting how
Customer Success is funded at your company?
A. YES
B. NO
C. Don’t Know
28
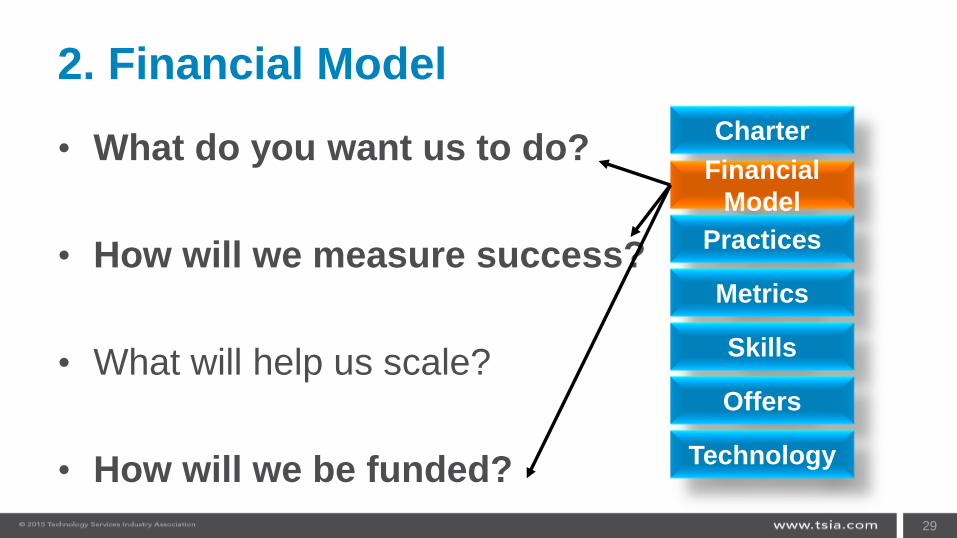
2. Financial Model
• What do you want us to do?
• How will we measure success?
• What will help us scale?
• How will we be funded?
29
Charter
Financial
Model
Practices
Metrics
Skills
Offers
Technology
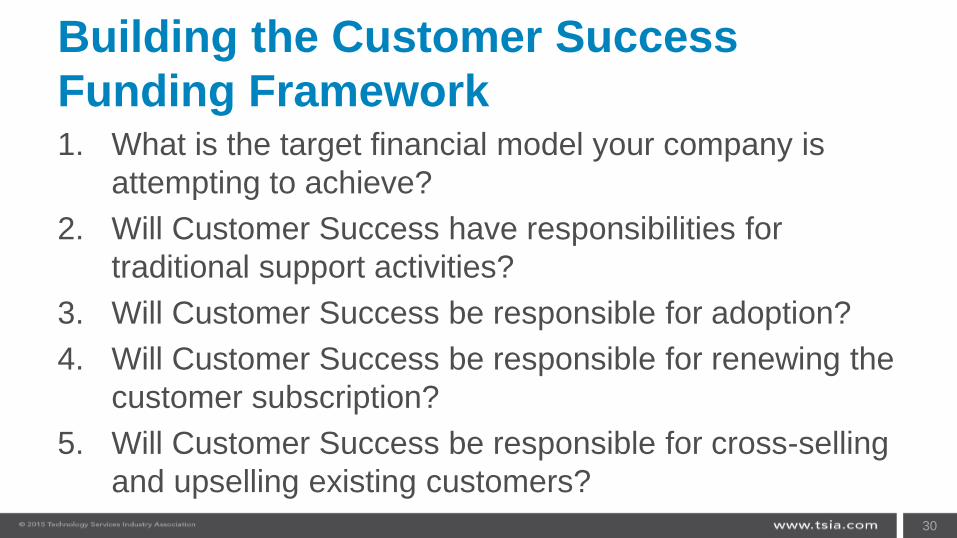
Building the Customer Success
Funding Framework1. What is the target financial model your company is
attempting to achieve?
2. Will Customer Success have responsibilities for
traditional support activities?
3. Will Customer Success be responsible for adoption?
4. Will Customer Success be responsible for renewing the
customer subscription?
5. Will Customer Success be responsible for cross-selling
and upselling existing customers?
30
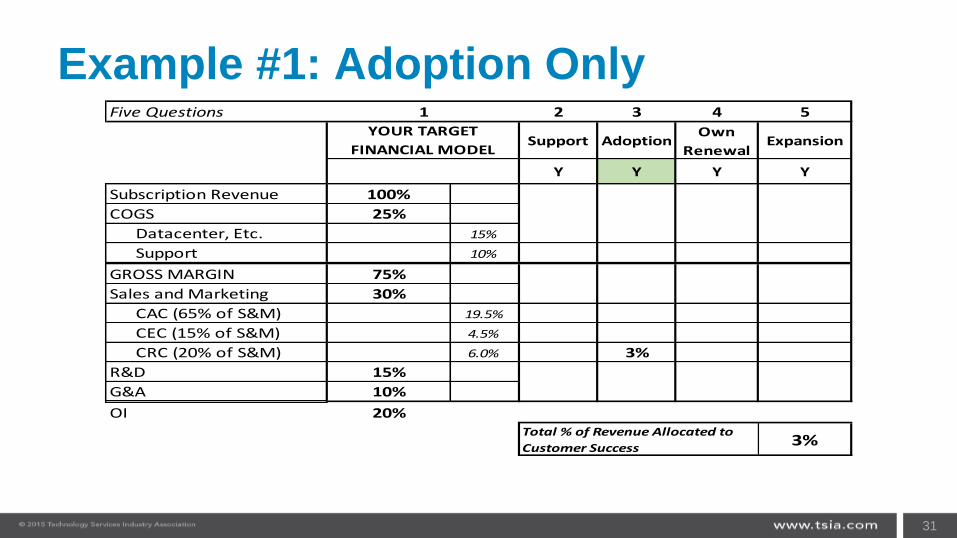
Example #1: Adoption Only
31
Five Questions 2 3 4 5
Support AdoptionOwn
RenewalExpansion
Y Y Y Y
Subscription Revenue 100%
COGS 25%
Datacenter, Etc. 15%
Support 10%
GROSS MARGIN 75%
Sales and Marketing 30%
CAC (65% of S&M) 19.5%
CEC (15% of S&M) 4.5%
CRC (20% of S&M) 6.0% 3%
R&D 15%
G&A 10%
OI 20%
3%Total % of Revenue Allocated to
Customer Success
1
YOUR TARGET
FINANCIAL MODEL
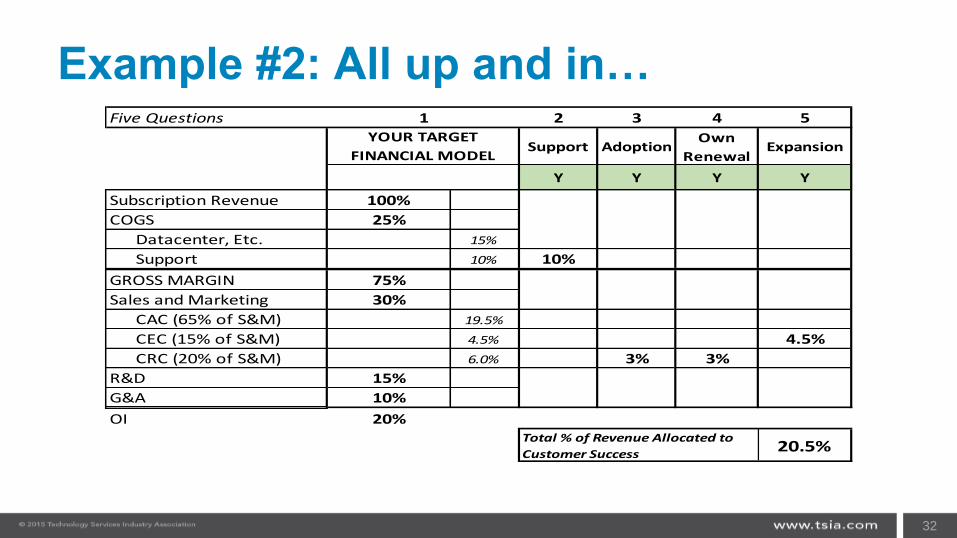
Example #2: All up and in…
32
Five Questions 2 3 4 5
Support AdoptionOwn
RenewalExpansion
Y Y Y Y
Subscription Revenue 100%
COGS 25%
Datacenter, Etc. 15%
Support 10% 10%
GROSS MARGIN 75%
Sales and Marketing 30%
CAC (65% of S&M) 19.5%
CEC (15% of S&M) 4.5% 4.5%
CRC (20% of S&M) 6.0% 3% 3%
R&D 15%
G&A 10%
OI 20%
20.5%Total % of Revenue Allocated to
Customer Success
1
YOUR TARGET
FINANCIAL MODEL
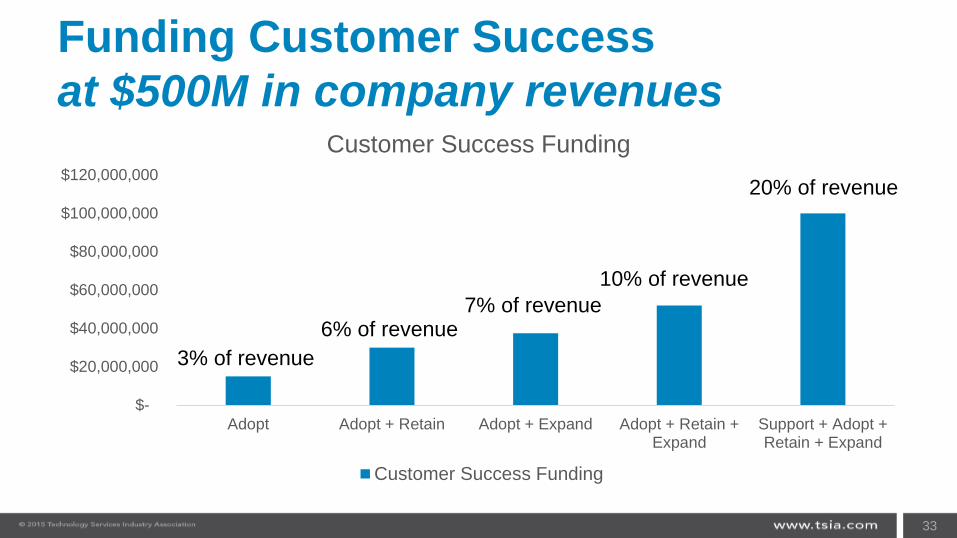
Funding Customer Success
at $500M in company revenues
$-
$20,000,000
$40,000,000
$60,000,000
$80,000,000
$100,000,000
$120,000,000
Adopt Adopt + Retain Adopt + Expand Adopt + Retain +Expand
Support + Adopt +Retain + Expand
Customer Success Funding
Customer Success Funding
33
3% of revenue
6% of revenue
10% of revenue
20% of revenue
7% of revenue
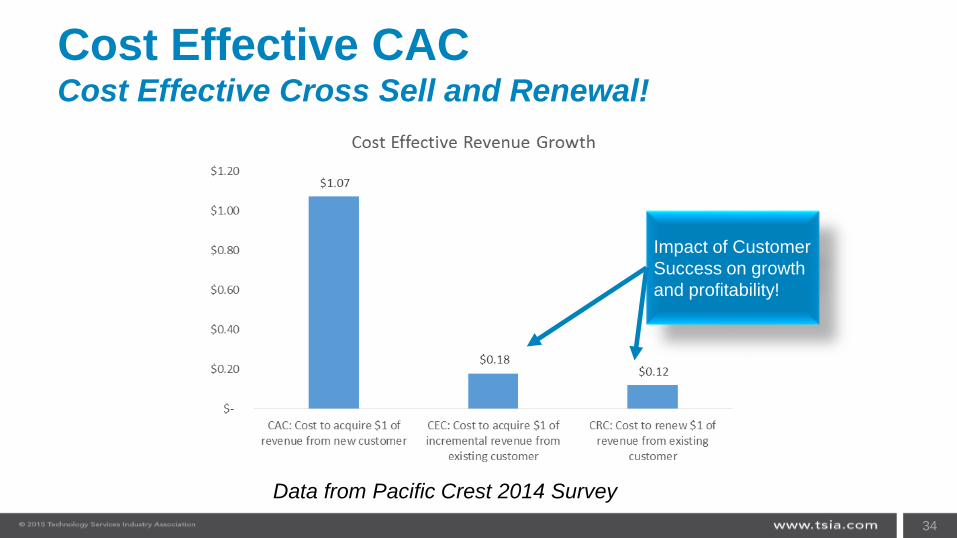
Cost Effective CACCost Effective Cross Sell and Renewal!
34
Impact of Customer
Success on growth
and profitability!
Data from Pacific Crest 2014 Survey
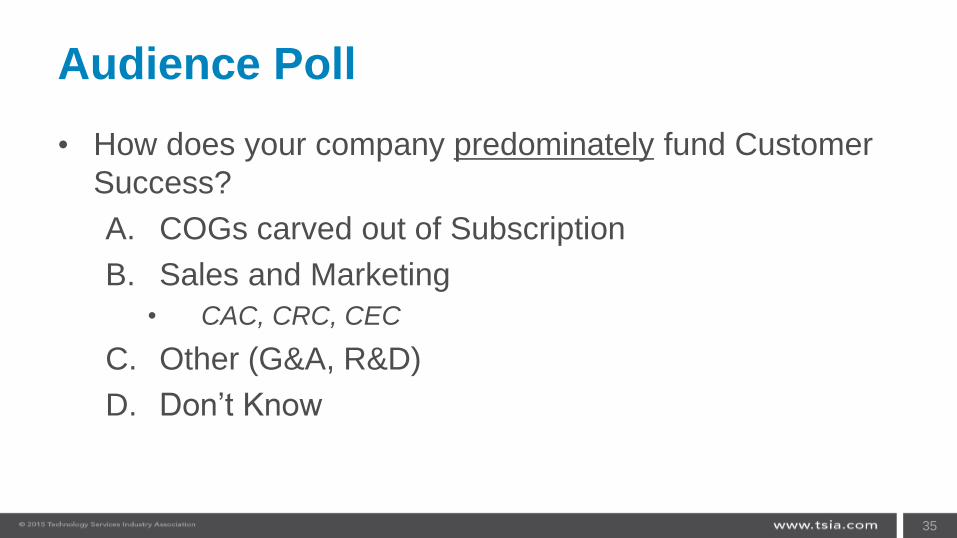
Audience Poll
• How does your company predominately fund Customer
Success?
A. COGs carved out of Subscription
B. Sales and Marketing
• CAC, CRC, CEC
C. Other (G&A, R&D)
D. Don’t Know
35
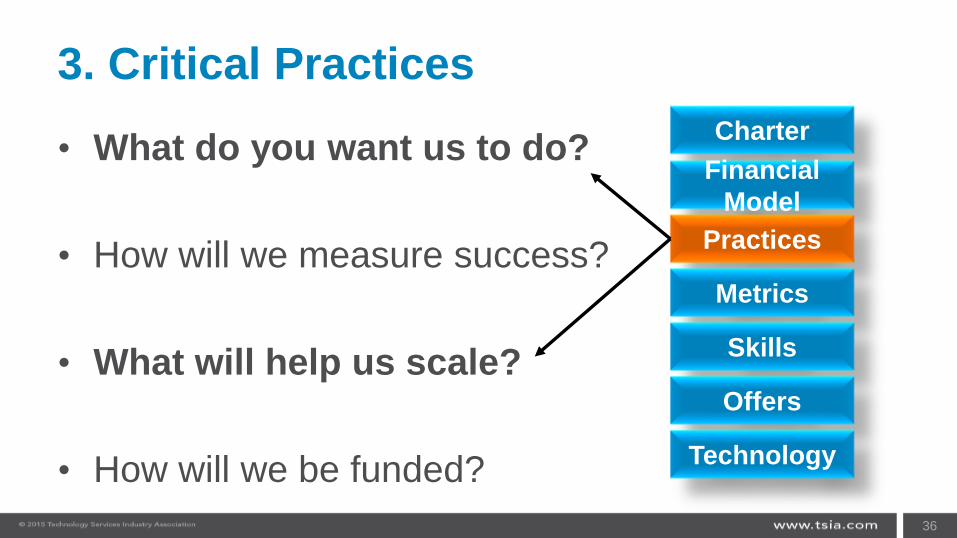
3. Critical Practices
• What do you want us to do?
• How will we measure success?
• What will help us scale?
• How will we be funded?
36
Charter
Financial
Model
Practices
Metrics
Skills
Offers
Technology
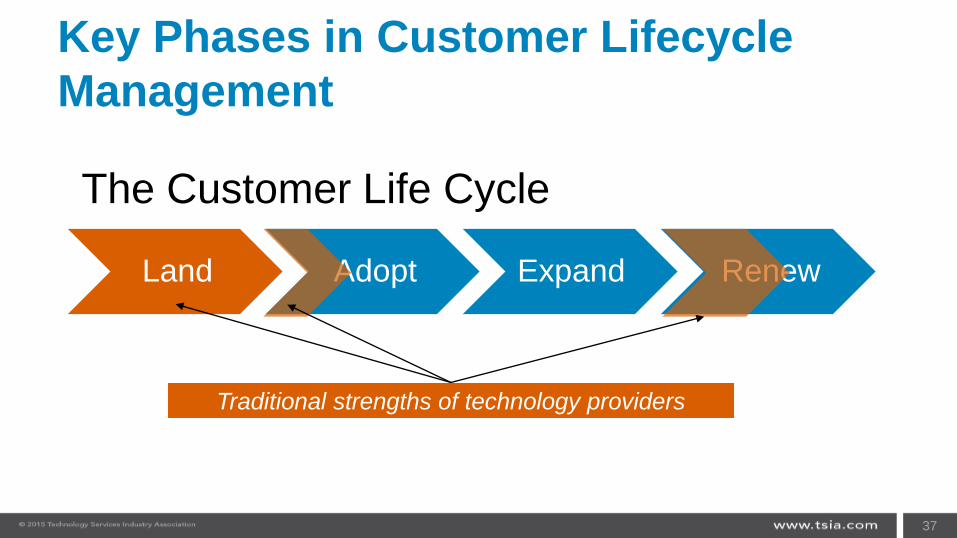
Key Phases in Customer Lifecycle
Management
37
Land Adopt Expand Renew
The Customer Life Cycle
Traditional strengths of technology providers
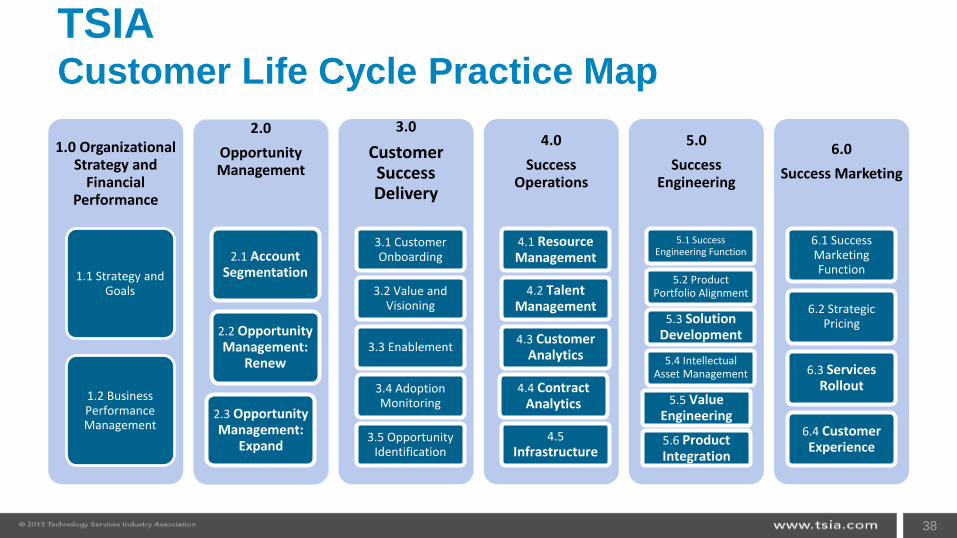
TSIACustomer Life Cycle Practice Map
1.0 Organizational Strategy and
Financial Performance
1.1 Strategy and Goals
1.2 Business Performance Management
2.0
Opportunity Management
2.1 Account Segmentation
2.2 Opportunity Management:
Renew
2.3 Opportunity Management:
Expand
3.0
Customer Success Delivery
3.1 Customer Onboarding
3.2 Value and Visioning
3.3 Enablement
3.4 Adoption Monitoring
3.5 Opportunity Identification
4.0
Success Operations
4.1 Resource Management
4.2 Talent Management
4.3 Customer Analytics
4.4 Contract Analytics
4.5 Infrastructure
5.0
Success Engineering
5.1 Success Engineering Function
5.2 Product Portfolio Alignment
5.3 Solution Development
5.4 Intellectual Asset Management
5.5 Value Engineering
5.6 Product Integration
6.0
Success Marketing
6.1 Success Marketing Function
6.2 Strategic Pricing
6.3 Services Rollout
6.4 Customer Experience
38
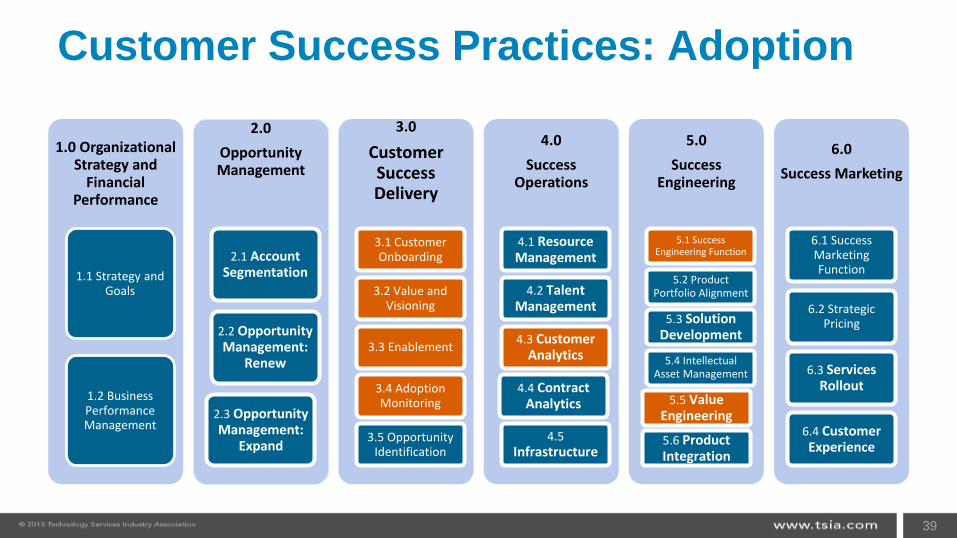
Customer Success Practices: Adoption
1.0 Organizational Strategy and
Financial Performance
1.1 Strategy and Goals
1.2 Business Performance Management
2.0
Opportunity Management
2.1 Account Segmentation
2.2 Opportunity Management:
Renew
2.3 Opportunity Management:
Expand
3.0
Customer Success Delivery
3.1 Customer Onboarding
3.2 Value and Visioning
3.3 Enablement
3.4 Adoption Monitoring
3.5 Opportunity Identification
4.0
Success Operations
4.1 Resource Management
4.2 Talent Management
4.3 Customer Analytics
4.4 Contract Analytics
4.5 Infrastructure
5.0
Success Engineering
5.1 Success Engineering Function
5.2 Product Portfolio Alignment
5.3 Solution Development
5.4 Intellectual Asset Management
5.5 Value Engineering
5.6 Product Integration
6.0
Success Marketing
6.1 Success Marketing Function
6.2 Strategic Pricing
6.3 Services Rollout
6.4 Customer Experience
39
40
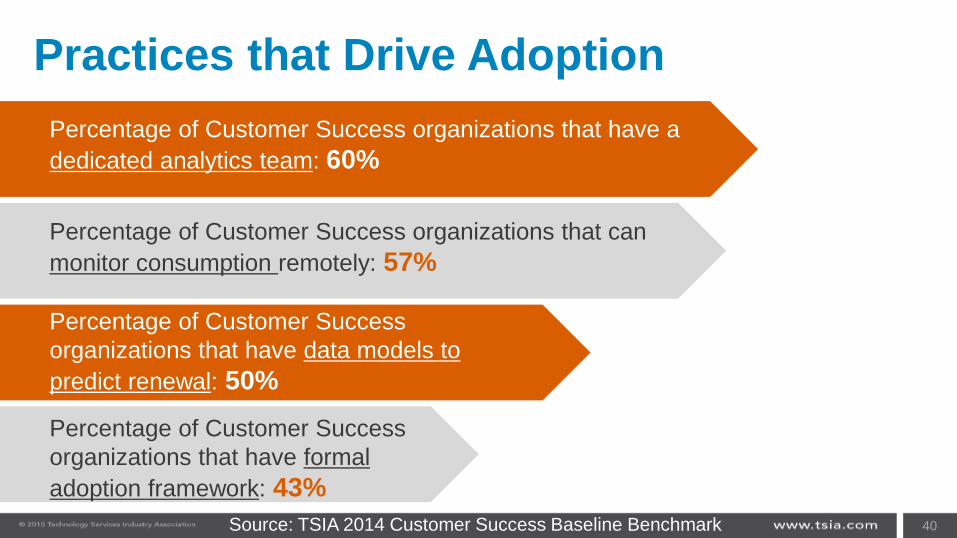
Practices that Drive Adoption
Percentage of Customer Success organizations that can
monitor consumption remotely: 57%
Percentage of Customer Success organizations that have a
dedicated analytics team: 60%
Percentage of Customer Success
organizations that have data models to
predict renewal: 50%
Percentage of Customer Success
organizations that have formal
adoption framework: 43%
Source: TSIA 2014 Customer Success Baseline Benchmark
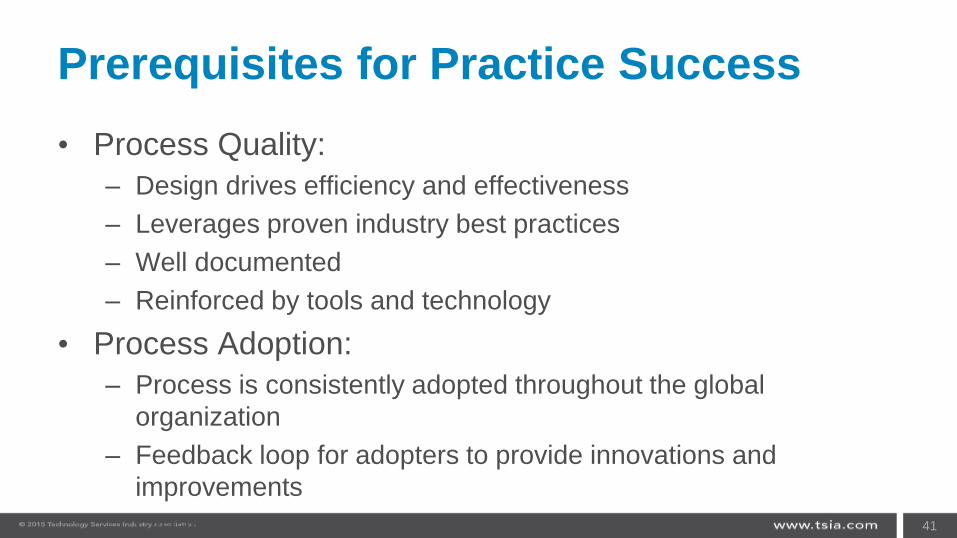
Prerequisites for Practice Success
• Process Quality:
– Design drives efficiency and effectiveness
– Leverages proven industry best practices
– Well documented
– Reinforced by tools and technology
• Process Adoption:
– Process is consistently adopted throughout the global
organization
– Feedback loop for adopters to provide innovations and
improvements
– Clear governance models 41
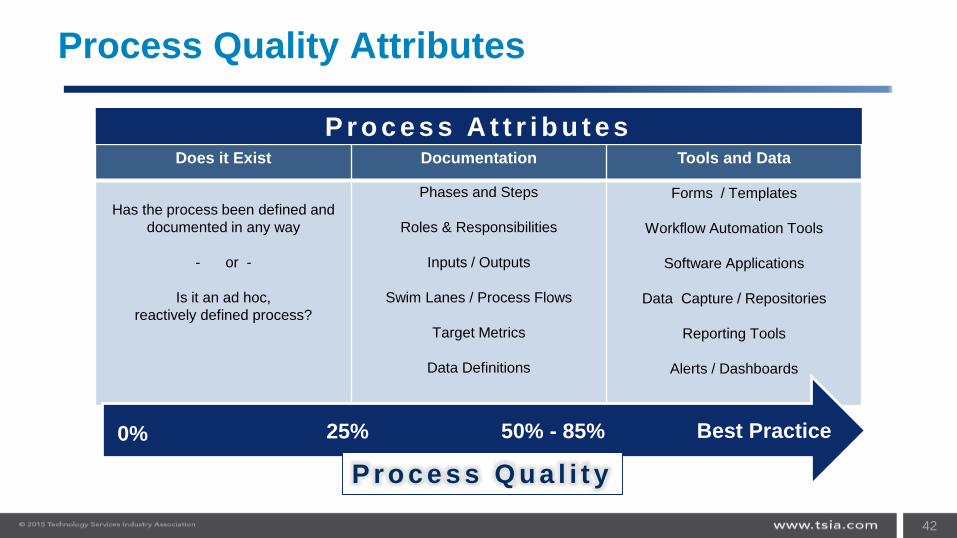
Process Quality Attributes
Does it Exist Documentation Tools and Data
Has the process been defined and
documented in any way
- or -
Is it an ad hoc,
reactively defined process?
Phases and Steps
Roles & Responsibilities
Inputs / Outputs
Swim Lanes / Process Flows
Target Metrics
Data Definitions
Forms / Templates
Workflow Automation Tools
Software Applications
Data Capture / Repositories
Reporting Tools
Alerts / Dashboards
42
Best Practice50% - 85% 25%0%
P r o c e s s Q u a l i t y
P r o c e s s A t t r i b u t e s
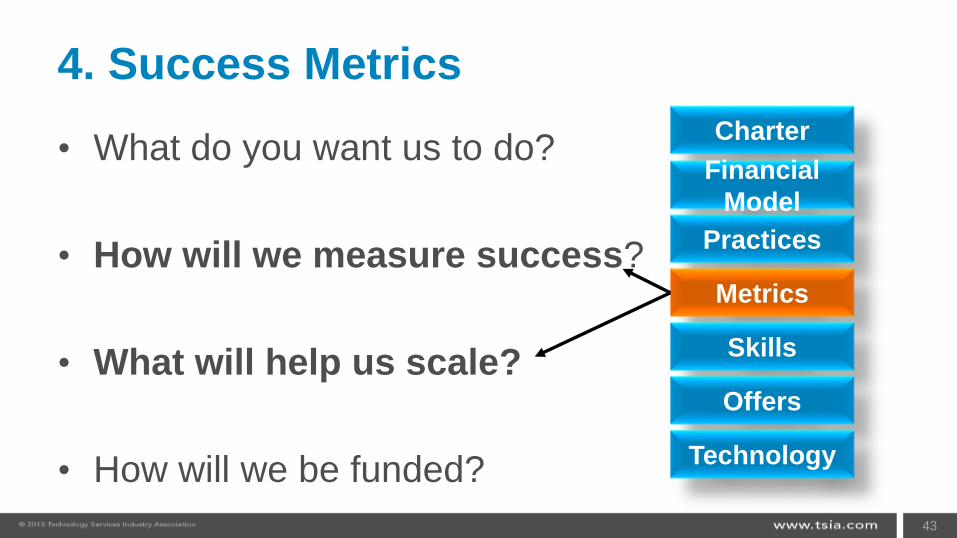
4. Success Metrics
• What do you want us to do?
• How will we measure success?
• What will help us scale?
• How will we be funded?
43
Charter
Financial
Model
Practices
Metrics
Skills
Offers
Technology
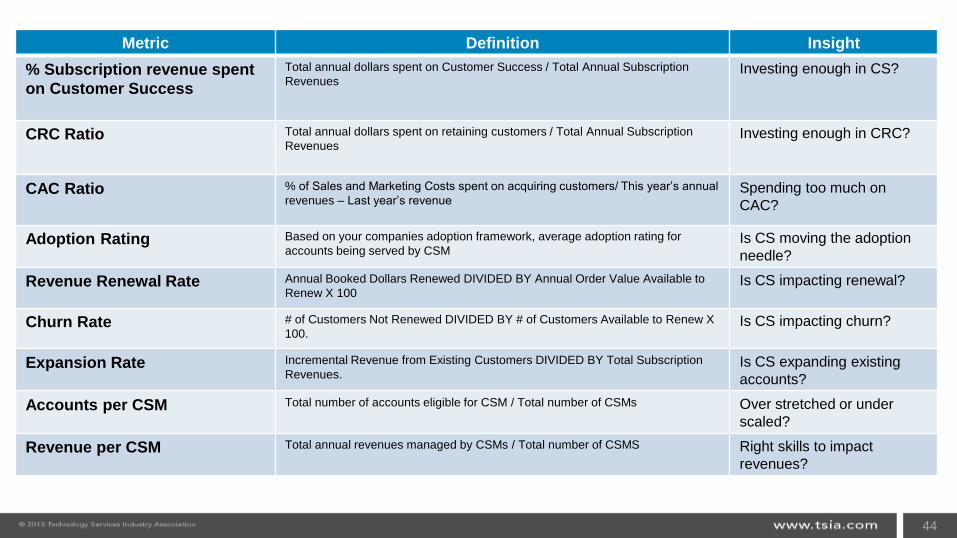
Metric Definition Insight
% Subscription revenue spent
on Customer Success
Total annual dollars spent on Customer Success / Total Annual Subscription
Revenues Investing enough in CS?
CRC Ratio Total annual dollars spent on retaining customers / Total Annual Subscription
Revenues Investing enough in CRC?
CAC Ratio % of Sales and Marketing Costs spent on acquiring customers/ This year’s annual
revenues – Last year’s revenueSpending too much on
CAC?
Adoption Rating Based on your companies adoption framework, average adoption rating for
accounts being served by CSMIs CS moving the adoption
needle?
Revenue Renewal Rate Annual Booked Dollars Renewed DIVIDED BY Annual Order Value Available to
Renew X 100Is CS impacting renewal?
Churn Rate # of Customers Not Renewed DIVIDED BY # of Customers Available to Renew X
100.Is CS impacting churn?
Expansion Rate Incremental Revenue from Existing Customers DIVIDED BY Total Subscription
Revenues.Is CS expanding existing
accounts?
Accounts per CSM Total number of accounts eligible for CSM / Total number of CSMs Over stretched or under
scaled?
Revenue per CSM Total annual revenues managed by CSMs / Total number of CSMS Right skills to impact
revenues?
44
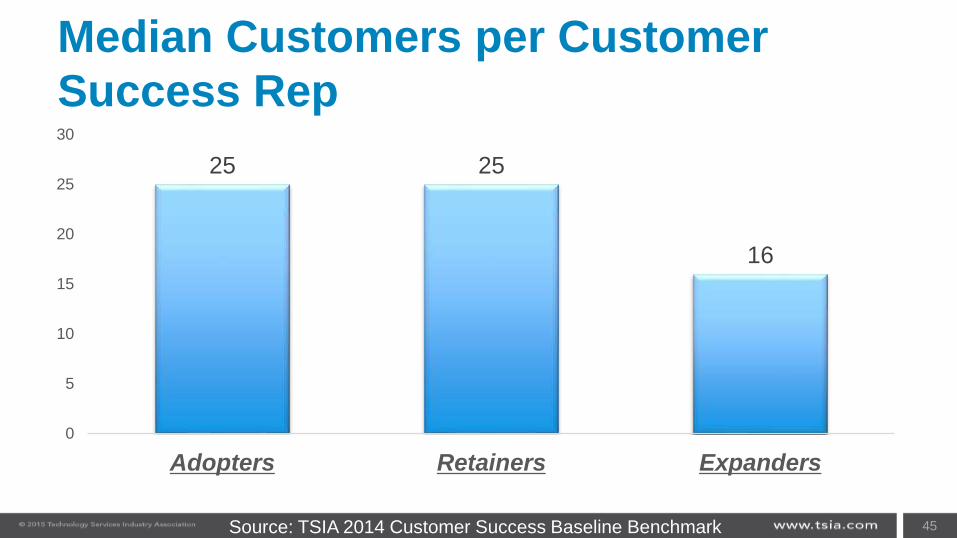
Median Customers per Customer
Success Rep
25 25
16
0
5
10
15
20
25
30
Adopters Retainers Expanders
45Source: TSIA 2014 Customer Success Baseline Benchmark
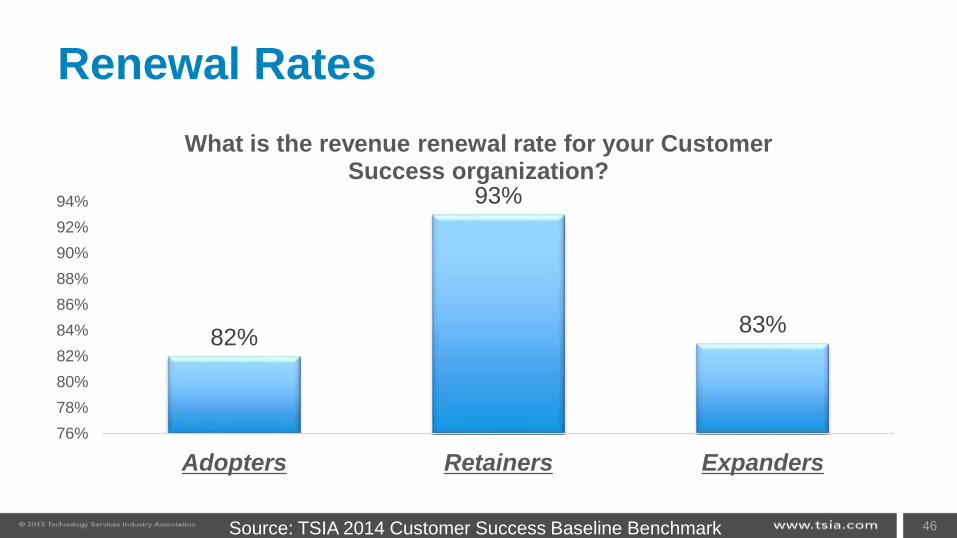
Renewal Rates
82%
93%
83%
76%
78%
80%
82%
84%
86%
88%
90%
92%
94%
Adopters Retainers Expanders
What is the revenue renewal rate for your Customer Success organization?
46Source: TSIA 2014 Customer Success Baseline Benchmark
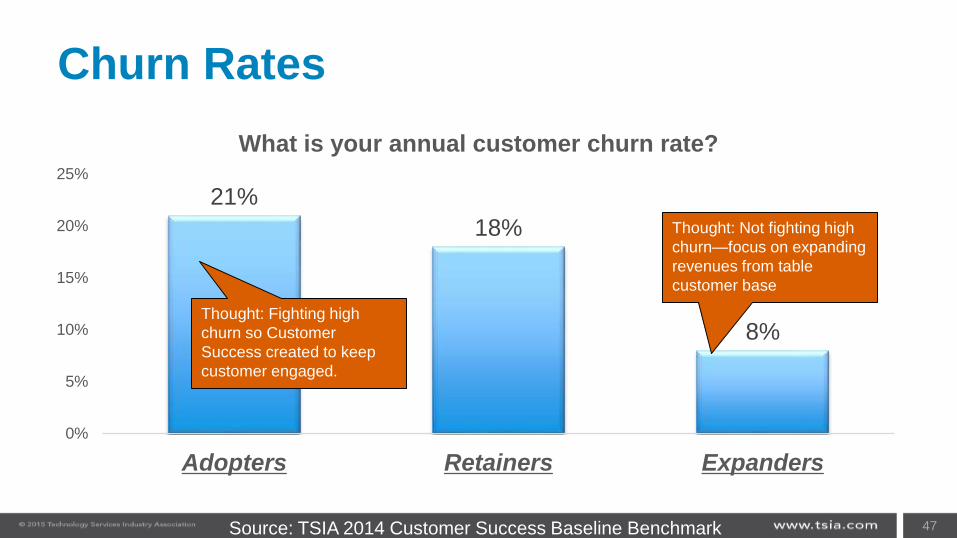
Churn Rates
21%
18%
8%
0%
5%
10%
15%
20%
25%
Adopters Retainers Expanders
What is your annual customer churn rate?
47Source: TSIA 2014 Customer Success Baseline Benchmark
Thought: Not fighting high
churn—focus on expanding
revenues from table
customer base
Thought: Fighting high
churn so Customer
Success created to keep
customer engaged.
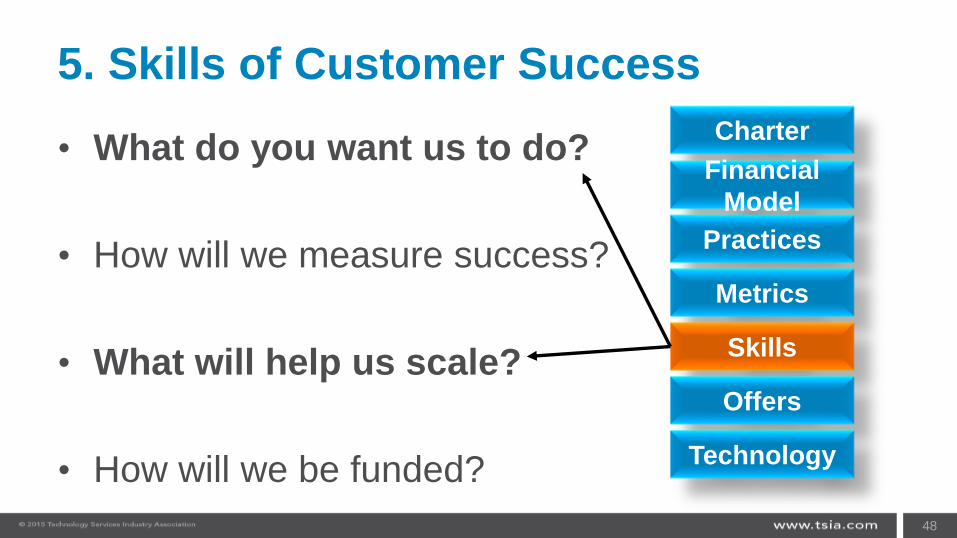
5. Skills of Customer Success
• What do you want us to do?
• How will we measure success?
• What will help us scale?
• How will we be funded?
48
Charter
Financial
Model
Practices
Metrics
Skills
Offers
Technology
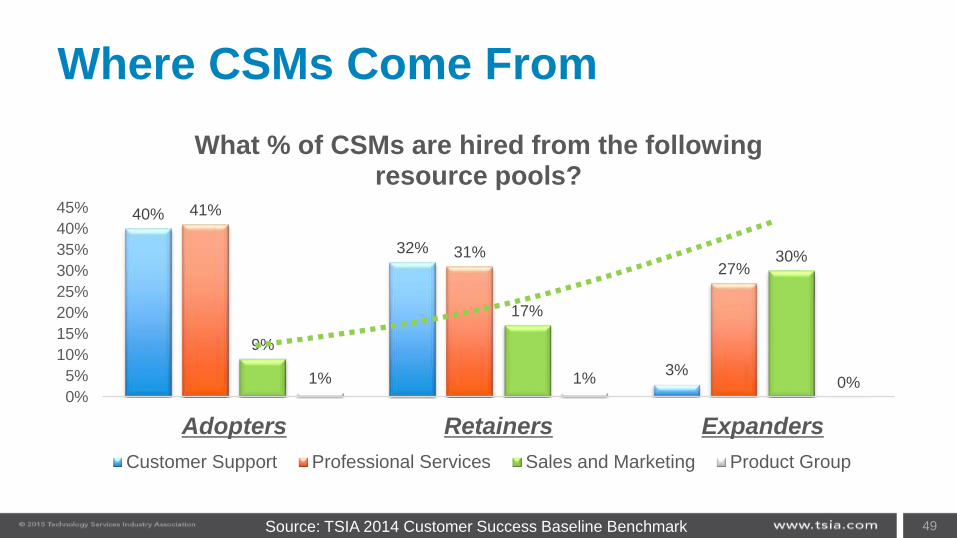
Where CSMs Come From
40%
32%
3%
41%
31%27%
9%
17%
30%
1% 1% 0%0%
5%
10%
15%
20%
25%
30%
35%
40%
45%
Adopters Retainers Expanders
What % of CSMs are hired from the following resource pools?
Customer Support Professional Services Sales and Marketing Product Group
49Source: TSIA 2014 Customer Success Baseline Benchmark
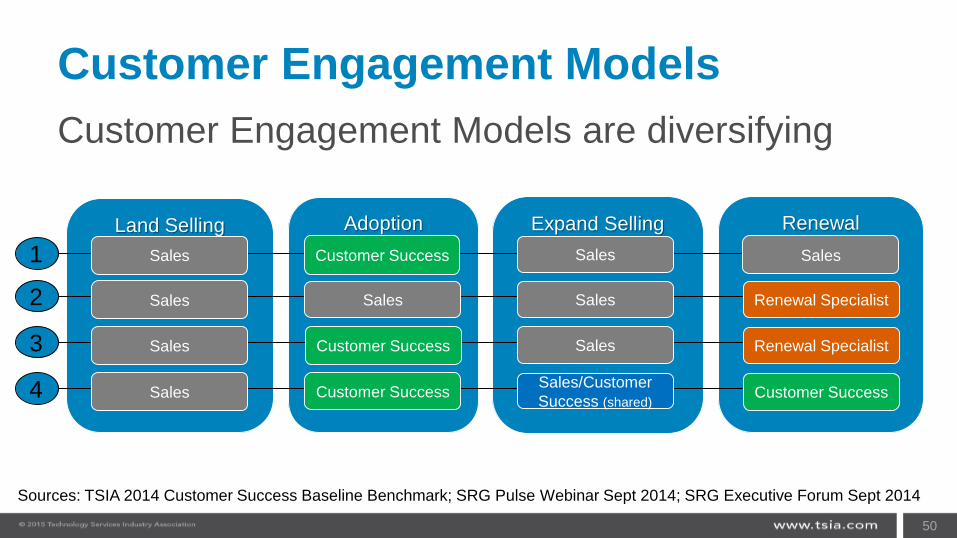
Expand SellingLand Selling
Customer Engagement Models
50
Adoption Renewal
Customer Success Sales Sales1 Sales
2
3
4 Sales/Customer
Success (shared)
Renewal SpecialistSales
Customer Success
Renewal Specialist
Customer Success
SalesSalesSales
Sales
Sales Customer Success
Sources: TSIA 2014 Customer Success Baseline Benchmark; SRG Pulse Webinar Sept 2014; SRG Executive Forum Sept 2014
Customer Engagement Models are diversifying
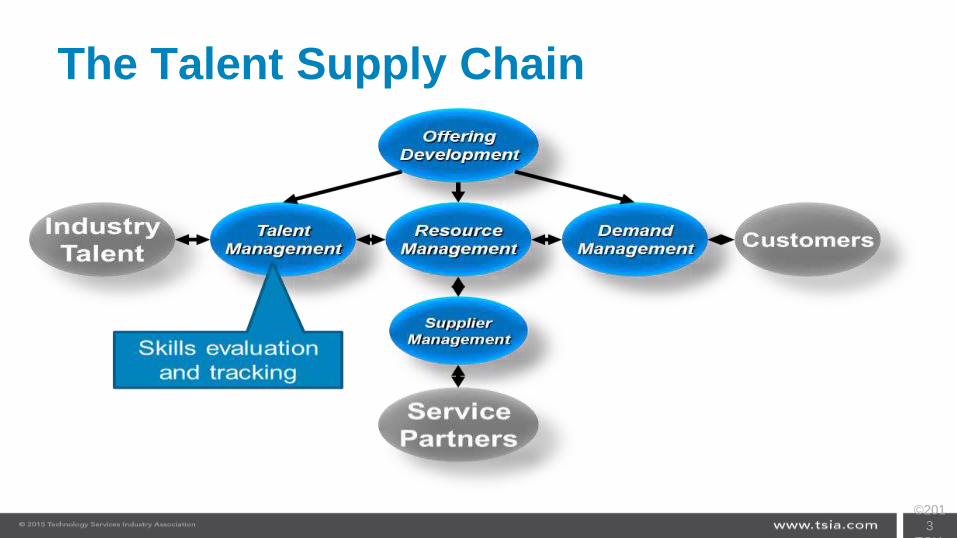
The Talent Supply Chain
©201
3
TSIA
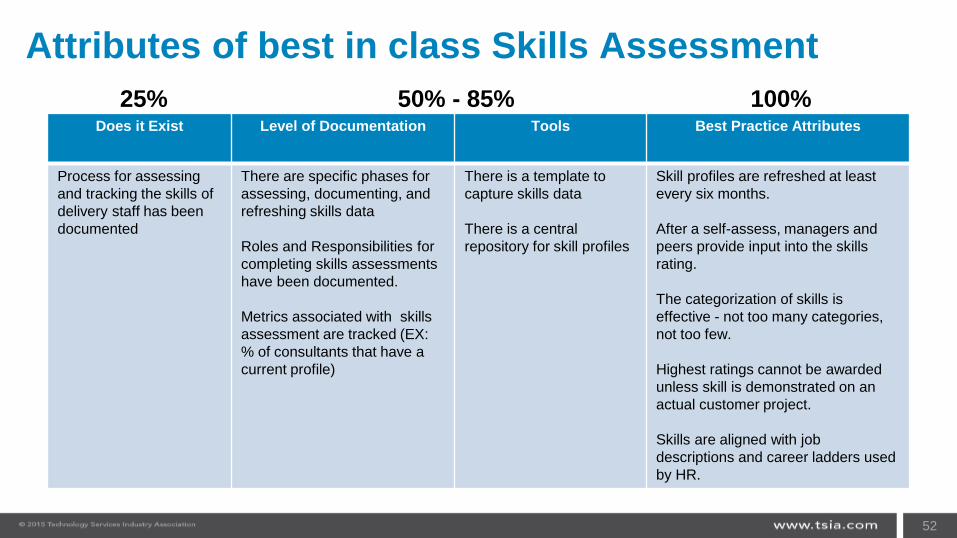
Attributes of best in class Skills Assessment
Does it Exist Level of Documentation Tools Best Practice Attributes
Process for assessing
and tracking the skills of
delivery staff has been
documented
There are specific phases for
assessing, documenting, and
refreshing skills data
Roles and Responsibilities for
completing skills assessments
have been documented.
Metrics associated with skills
assessment are tracked (EX:
% of consultants that have a
current profile)
There is a template to
capture skills data
There is a central
repository for skill profiles
Skill profiles are refreshed at least
every six months.
After a self-assess, managers and
peers provide input into the skills
rating.
The categorization of skills is
effective - not too many categories,
not too few.
Highest ratings cannot be awarded
unless skill is demonstrated on an
actual customer project.
Skills are aligned with job
descriptions and career ladders used
by HR.
52
25% 50% - 85% 100%
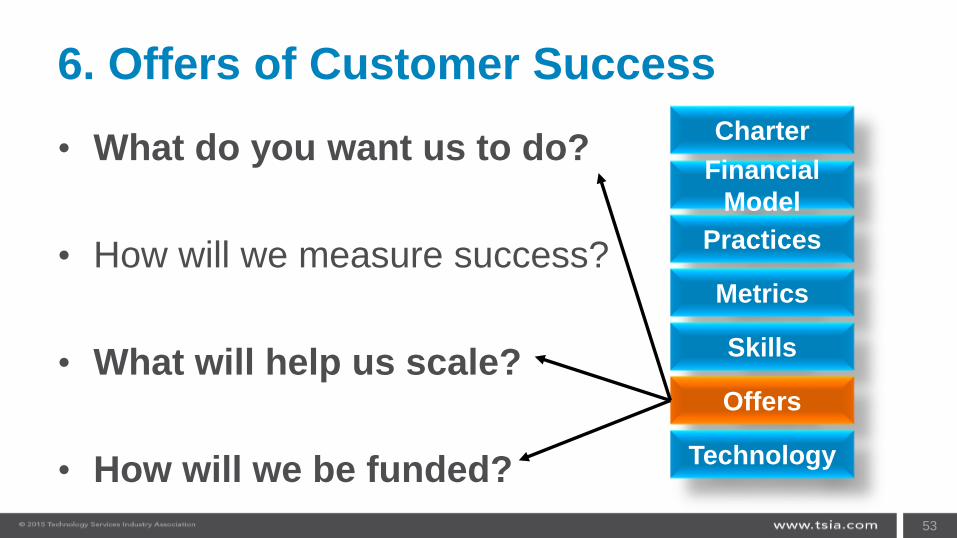
6. Offers of Customer Success
• What do you want us to do?
• How will we measure success?
• What will help us scale?
• How will we be funded?
53
Charter
Financial
Model
Practices
Metrics
Skills
Offers
Technology
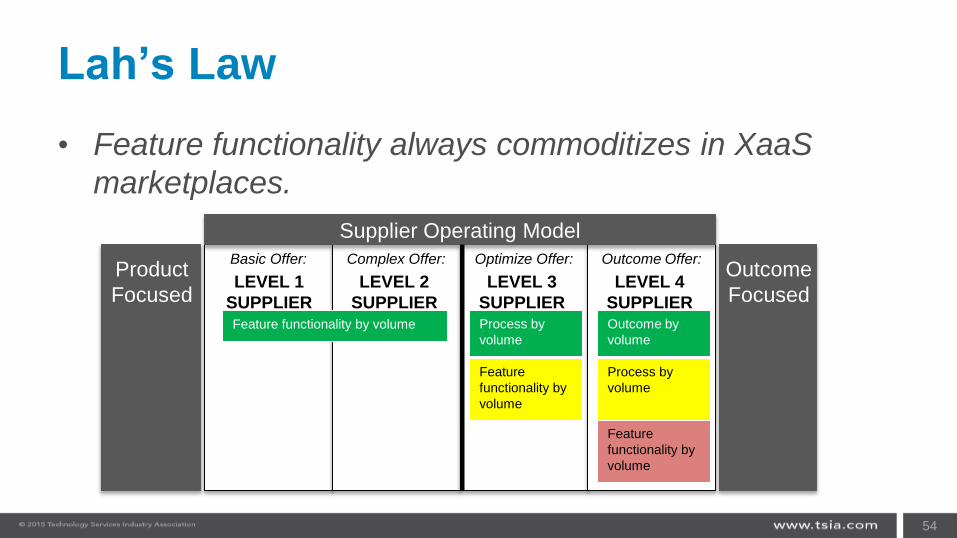
Lah’s Law
• Feature functionality always commoditizes in XaaS
marketplaces.
54
Basic Offer: Complex Offer: Optimize Offer: Outcome Offer:
LEVEL 1
SUPPLIER
LEVEL 2
SUPPLIER
LEVEL 3
SUPPLIER
LEVEL 4
SUPPLIER
Supplier Operating Model
Product
Focused
Outcome
Focused
Feature functionality by volume
Feature
functionality by
volume
Feature
functionality by
volume
Process by
volume
Process by
volume
Outcome by
volume
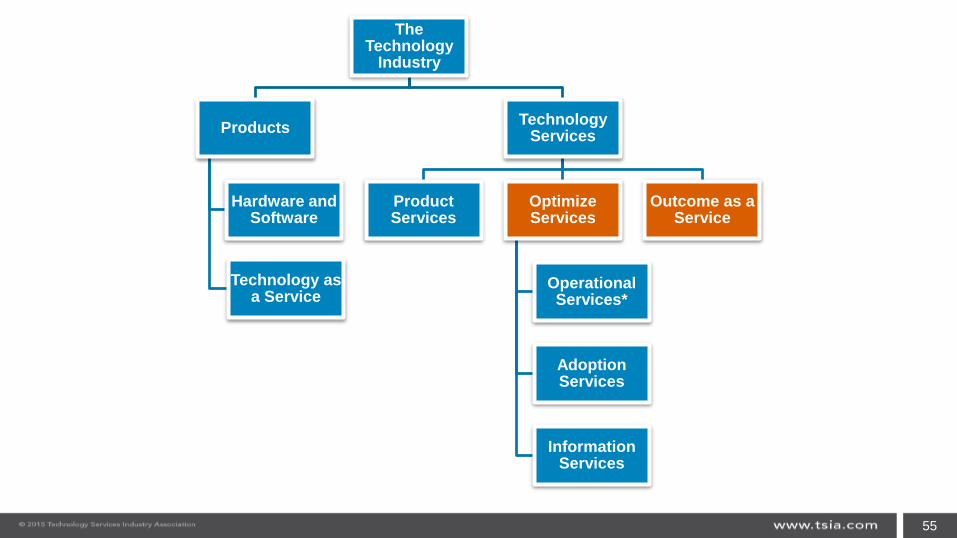
The Technology
Industry
Products
Hardware and Software
Technology as a Service
Technology Services
Product Services
Optimize Services
Operational Services*
Adoption Services
Information Services
Outcome as a Service
55
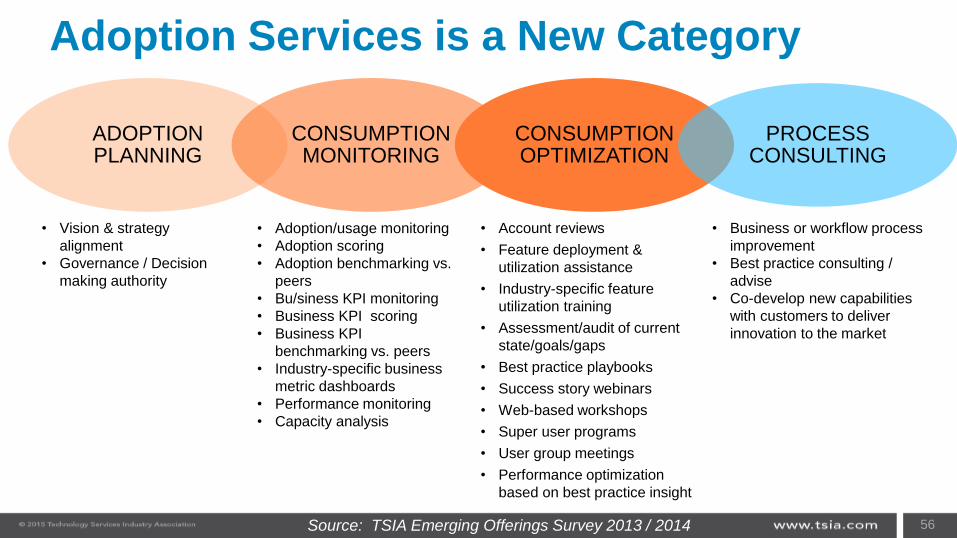
Adoption Services is a New Category
56Source: TSIA Emerging Offerings Survey 2013 / 2014
• Vision & strategy
alignment
• Governance / Decision
making authority
• Adoption/usage monitoring
• Adoption scoring
• Adoption benchmarking vs.
peers
• Bu/siness KPI monitoring
• Business KPI scoring
• Business KPI
benchmarking vs. peers
• Industry-specific business
metric dashboards
• Performance monitoring
• Capacity analysis
• Account reviews
• Feature deployment &
utilization assistance
• Industry-specific feature
utilization training
• Assessment/audit of current
state/goals/gaps
• Best practice playbooks
• Success story webinars
• Web-based workshops
• Super user programs
• User group meetings
• Performance optimization
based on best practice insight
• Business or workflow process
improvement
• Best practice consulting /
advise
• Co-develop new capabilities
with customers to deliver
innovation to the market
ADOPTION PLANNING
CONSUMPTION MONITORING
CONSUMPTION OPTIMIZATION
PROCESS CONSULTING
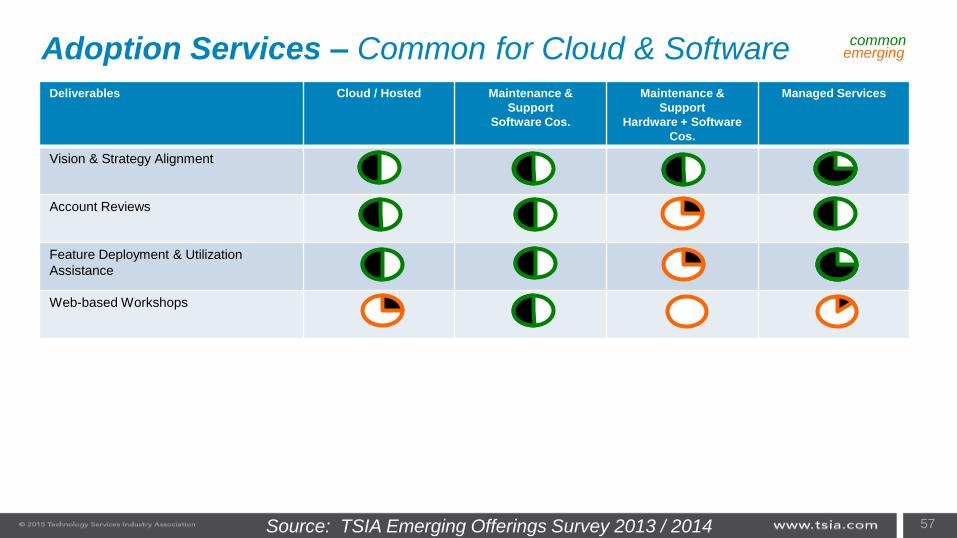
Deliverables Cloud / Hosted Maintenance &
Support
Software Cos.
Maintenance &
Support
Hardware + Software
Cos.
Managed Services
Vision & Strategy Alignment
Account Reviews
Feature Deployment & Utilization
Assistance
Web-based Workshops
Adoption Services – Common for Cloud & Software commonemerging
57Source: TSIA Emerging Offerings Survey 2013 / 2014
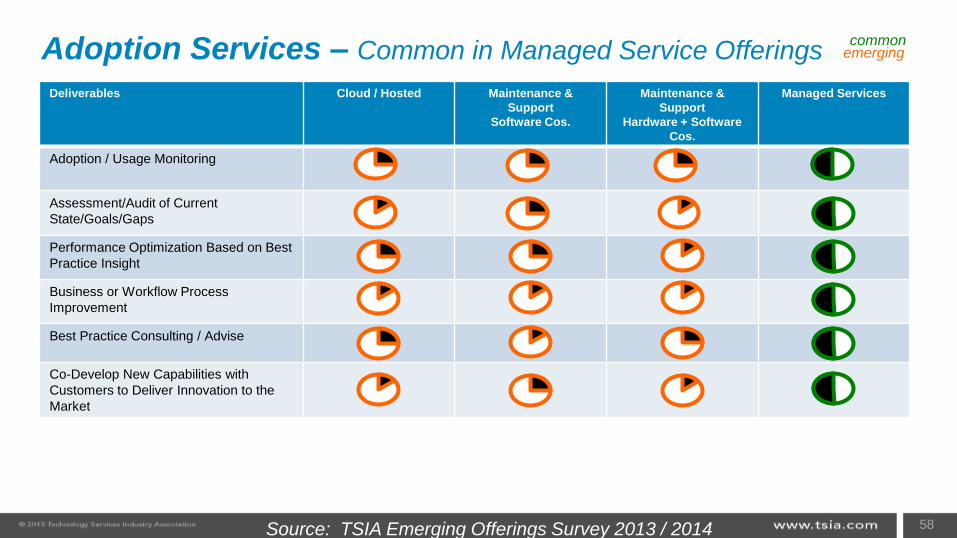
Deliverables Cloud / Hosted Maintenance &
Support
Software Cos.
Maintenance &
Support
Hardware + Software
Cos.
Managed Services
Adoption / Usage Monitoring
Assessment/Audit of Current
State/Goals/Gaps
Performance Optimization Based on Best
Practice Insight
Business or Workflow Process
Improvement
Best Practice Consulting / Advise
Co-Develop New Capabilities with
Customers to Deliver Innovation to the
Market
Adoption Services – Common in Managed Service Offeringscommon
emerging
58Source: TSIA Emerging Offerings Survey 2013 / 2014
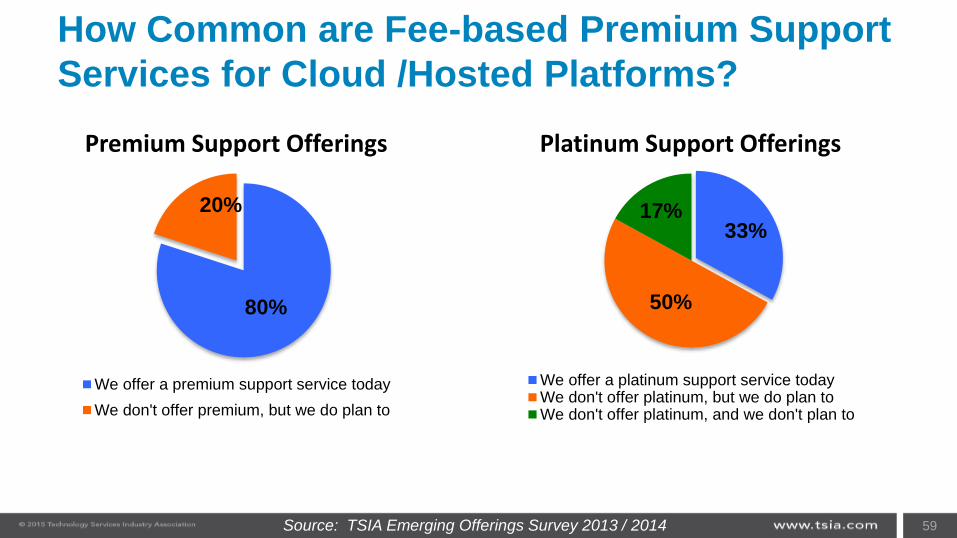
59
80%
20%
Premium Support Offerings
We offer a premium support service today
We don't offer premium, but we do plan to
How Common are Fee-based Premium Support
Services for Cloud /Hosted Platforms?
33%
50%
17%
Platinum Support Offerings
We offer a platinum support service todayWe don't offer platinum, but we do plan toWe don't offer platinum, and we don't plan to
Source: TSIA Emerging Offerings Survey 2013 / 2014
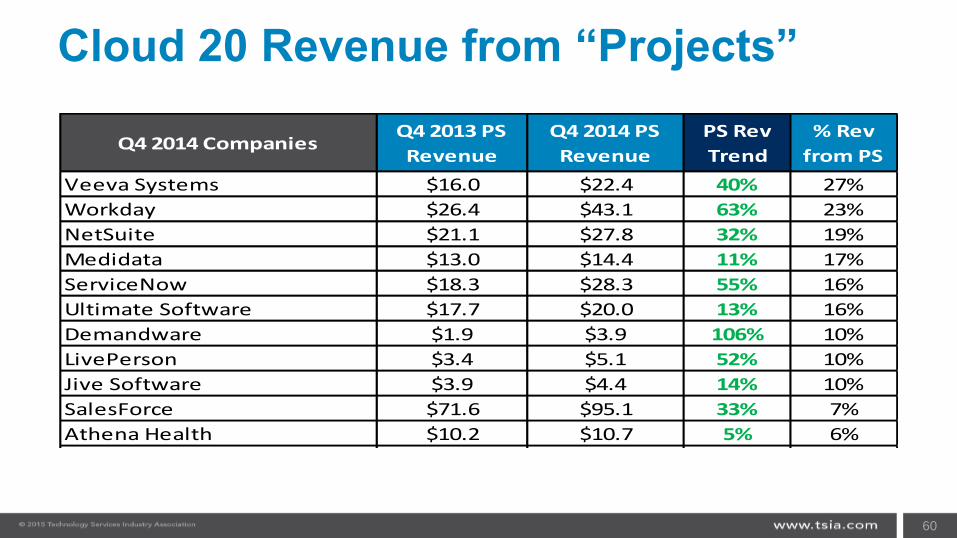
Cloud 20 Revenue from “Projects”
60
Q4 2014 CompaniesQ4 2013 PS
Revenue
Q4 2014 PS
Revenue
PS Rev
Trend
% Rev
from PS
Veeva Systems $16.0 $22.4 40% 27%
Workday $26.4 $43.1 63% 23%
NetSuite $21.1 $27.8 32% 19%
Medidata $13.0 $14.4 11% 17%
ServiceNow $18.3 $28.3 55% 16%
Ultimate Software $17.7 $20.0 13% 16%
Demandware $1.9 $3.9 106% 10%
LivePerson $3.4 $5.1 52% 10%
Jive Software $3.9 $4.4 14% 10%
SalesForce $71.6 $95.1 33% 7%
Athena Health $10.2 $10.7 5% 6%
RealPage $3.1 $3.0 -4% 3%
IntraLinks 0%
RackSpace 0%
Constant Contact 0%
Cornerstone Ondemand 0%
Dealer Track $6 0%
Concur Technologies 0%
Google 0%
LogMeIn 0%
$16.3 $23.2 35.0% 8.1%
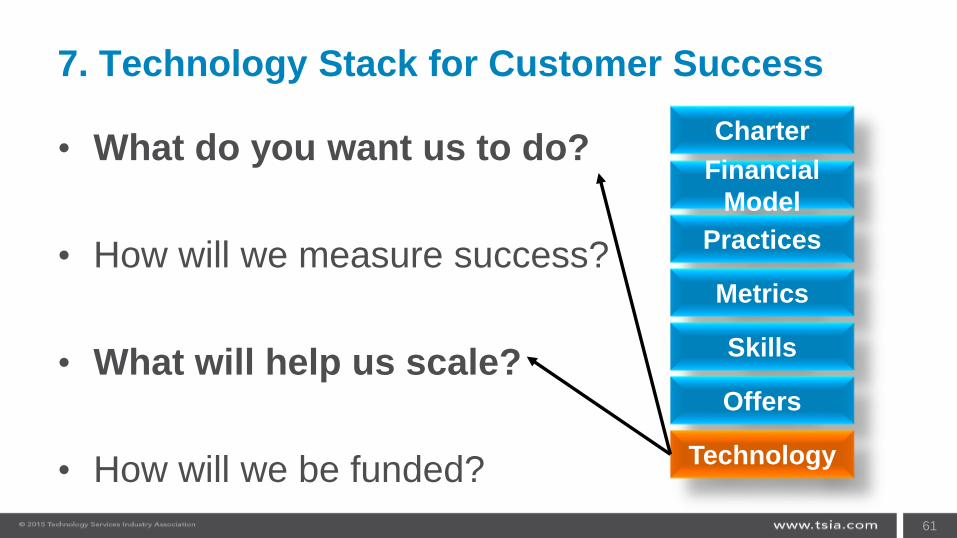
7. Technology Stack for Customer Success
• What do you want us to do?
• How will we measure success?
• What will help us scale?
• How will we be funded?
61
Charter
Financial
Model
Practices
Metrics
Skills
Offers
Technology
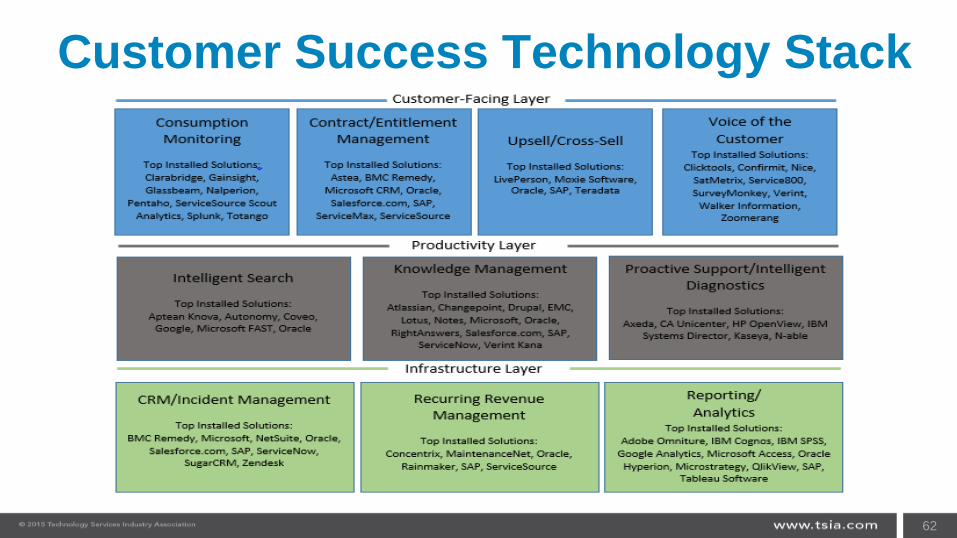
Customer Success Technology Stack
62
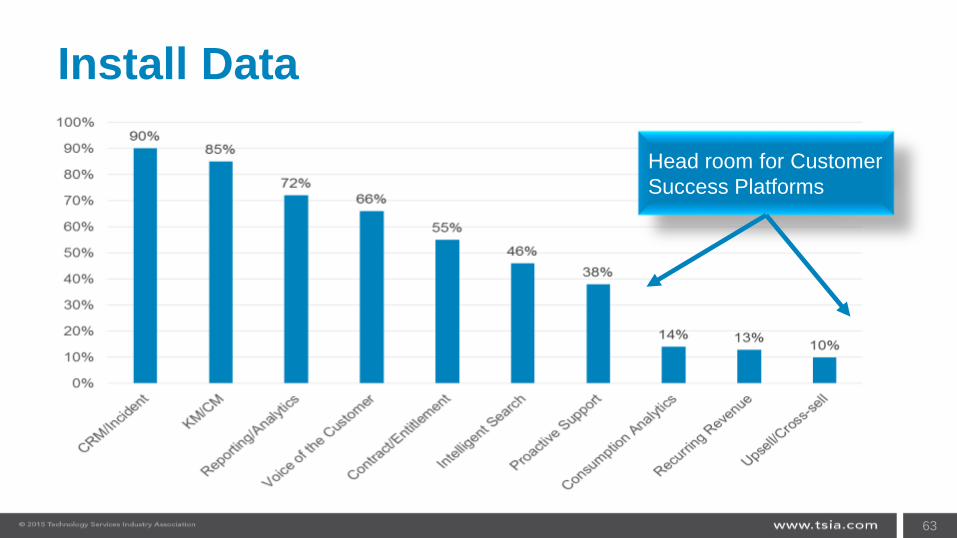
Install Data
63
Head room for Customer
Success Platforms
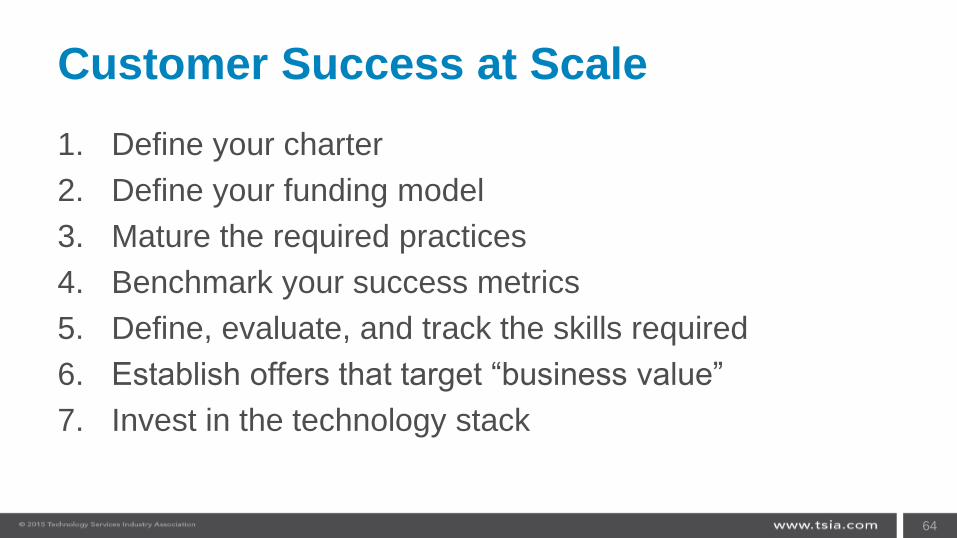
Customer Success at Scale
1. Define your charter
2. Define your funding model
3. Mature the required practices
4. Benchmark your success metrics
5. Define, evaluate, and track the skills required
6. Establish offers that target “business value”
7. Invest in the technology stack
64