Setup and performance test of a small-scale vertical axis wind turbine
56
Industrial Electrical Engineering and Automation CODEN:LUTEDX/TEIE-5285)/1-56/(2011) Setup and performance test of a small-scale vertical axis wind turbine Vincent Petitfils Division of Industrial Electrical Engineering and Automation Faculty of Engineering, Lund University
Transcript of Setup and performance test of a small-scale vertical axis wind turbine

Ind
ust
rial E
lectr
ical En
gin
eerin
g a
nd
A
uto
matio
n
CODEN:LUTEDX/TEIE-5285)/1-56/(2011)
Setup and performance test of a small-scale vertical axis wind turbine
Vincent Petitfils
Division of Industrial Electrical Engineering and Automation Faculty of Engineering, Lund University

Vincent PETITFILS LTH – IEA
2
Abstract
The acknowledgement that mankind has a limited amount of resources in energy and a growing
demand, joined with the awareness of the environmental impact of an only fuel-based electricity
production have led to the expansion and democratization of renewable and green energies. The
wind electricity production nowadays exists under various forms, differing one from another by their
size, their mechanical structure and their power production.
This master thesis aims at explaining the different steps of the installation and performance testing
of a small-scale vertical axis wind turbine developed by the Swedish company EXAMEC. It covers
most of the aspects of such a wide project, ranging from electrical and mechanical considerations to
organization and installation of the setup.
The work achieved was first to establish the specifications of this project: what are the requirements
for implementing the performance test of a wind turbine? Which equipment is needed? The
following task consisted in finding appropriate suppliers for this equipment and installing the whole
setup following the prerogatives determined earlier. In parallel to this, the automatic control
sequence was written and tested under the DYMOLA software. The work achieved stops with a
performance testing done without automatic control over the wind turbine.

Vincent PETITFILS LTH – IEA
3
Acknowledgments
I would like to express my gratitude to all those who gave me the possibility to complete this work.
First of all, I would like to thank my supervisor Jörgen Svensson for giving me the opportunity to
undertake this master thesis and thus complete my engineer training. His advice and assistance have
strongly contributed to the smooth progress of this project.
I would like to thank EXAMEC for having made this project possible, and their interest towards the
evolution of the project. In particular, I would like to thank Lars Brändström and Tony Svensson, for
the time shared on the roof, installing the structure of the wind turbine.
I want to thank the whole Industrial Electrical Engineering and Automation Department for the
excellent welcome and assistance in overcoming the difficulties I encountered throughout this thesis
work. Especially, I would like to give my special thanks to Getachew Darge for his everytime
assistance and the huge part he played in helping me install the equipment needed for this project.
Last but not least, I would like to thank Silvia Pardo Navarro, my friends and my family for their
support during my whole stay in Sweden. It has been a wonderful experience that taught me a lot
both on personal and educational points of view.

Vincent PETITFILS LTH – IEA
4
Contents Abstract ..............................................................................................................................................2
Acknowledgments ..............................................................................................................................3
Table of figures ...................................................................................................................................6
Table of pictures .................................................................................................................................6
Chapter 1: Introduction ......................................................................................................................7
o Background .............................................................................................................................7
o Objectives ...............................................................................................................................7
o Overview of the setup .............................................................................................................8
o Outline ....................................................................................................................................9
Chapter 2: Renewable energies ......................................................................................................... 10
o Hydroelectricity ................................................................................................................. 10
o Biomass ............................................................................................................................. 10
o Geothermal electricity ....................................................................................................... 10
o Solar power ....................................................................................................................... 11
o Wind power....................................................................................................................... 12
Chapter 3: Performance testing of a wind turbine ............................................................................. 15
o Tip speed values and power curves ....................................................................................... 15
Tip speed values ................................................................................................................ 15
Power curve ...................................................................................................................... 16
Chapter 4: Wind turbine control ....................................................................................................... 18
o The control units ................................................................................................................... 18
The overall control unit: dControl ..................................................................................... 20
Micro-controllers ............................................................................................................... 21
µ1 (wind turbine side): ...................................................................................................... 21
µController2 (grid side): ..................................................................................................... 21
o The control modes ................................................................................................................ 22
o The control sequences........................................................................................................... 23
Main control sequence .......................................................................................................... 24
Shutdown sequence: ............................................................................................................. 25
Control sequence, from µ2 point of view ............................................................................... 26
o Commands inputs and outputs .............................................................................................. 27
Chapter 5: Modeling, programming and simulation .......................................................................... 29
o Dymola .................................................................................................................................. 29

Vincent PETITFILS LTH – IEA
5
Overview ........................................................................................................................... 29
Electrical chain .................................................................................................................. 30
Controllers......................................................................................................................... 31
Input signals ...................................................................................................................... 32
o C++ ........................................................................................................................................ 32
zWTC_Init .......................................................................................................................... 32
zWTC_Update.................................................................................................................... 32
zWTC_Get ......................................................................................................................... 34
Sub-functions .................................................................................................................... 34
dControl ............................................................................................................................ 35
o Simulation results .................................................................................................................. 36
Chapter 6: Experimental setup .......................................................................................................... 39
o Stakeholders ......................................................................................................................... 39
o Overview of the setup ........................................................................................................... 39
o The wind turbine ................................................................................................................... 40
Technical specifications ..................................................................................................... 40
o The measurement equipment ............................................................................................... 44
Requirements on the location............................................................................................ 44
o Choice of the equipment ....................................................................................................... 44
Installation of the sensors .................................................................................................. 45
o Interface ............................................................................................................................... 47
o Cabinets for the electrical converters .................................................................................... 48
Chapter 7: A first performance test: Connection to heaters .............................................................. 50
o Description of the setup ........................................................................................................ 50
Chapter 8: Conclusions ..................................................................................................................... 53
o Summary of the project achievements .................................................................................. 53
o Guidelines for future work..................................................................................................... 53
Equipment ......................................................................................................................... 53
Performance tests ............................................................................................................. 54
Appendix A ....................................................................................................................................... 55
References ........................................................................................................................................ 56

Vincent PETITFILS LTH – IEA
6
Table of figures
Figure 1: overview of the configuration ...............................................................................................8
Figure 2 : Global wind energy capacity over the last 15 years (source: BP)......................................... 12
Figure 3 : Trend in increasing wind turbine size (EWEA 2007) ............................................................ 13
Figure 4 : vertical and horizontal axis wind turbines .......................................................................... 14
Figure 5: CP curves for different wind turbines. ................................................................................. 16
Figure 6 : Location of the control system in the setup ....................................................................... 18
Figure 7: possible expansion of the system, using the modularity ..................................................... 19
Figure 8 : overview of the control units ............................................................................................ 19
Figure 9 : Main control sequence, from dControl point of view. ........................................................ 24
Figure 10: Main control sequence, from dControl point of view. ....................................................... 25
Figure 11 : control sequence from µ2 point of view .......................................................................... 26
Figure 12: Dymola model .................................................................................................................. 30
Figure 13: modeling of the wind turbine ........................................................................................... 31
Figure 14: block for grid control ........................................................................................................ 31
Figure 15: tests on the wind speed .................................................................................................... 36
Figure 16: Control sequences over time, depending on the wind speed ............................................ 37
Figure 17 : Cp curve (right) as a function of the wind (left) over time ............................................... 38
Figure 18: overview of the configuration ........................................................................................... 39
Figure 19: location and schematic representation of the environment configuration ........................ 41
Figure 20: mounting the mast. .......................................................................................................... 42
Figure 21 : wind evolution over a day ................................................................................................ 47
Figure 22: schematic representation of the setup ............................................................................. 50
Figure 23: Aron’s method for measuring the power .......................................................................... 51
Table of pictures
Picture 1 : rotor of the wind turbine .................................................................................................. 40
Picture 2: Base of the structure and plinths supporting it .................................................................. 41
Picture 3: transmission system to the generator ............................................................................... 42
Picture 4: safety wires conneting the mast to the structure .............................................................. 43
Picture 5: rods (left) and wire (right) assuring the stability of the structure ....................................... 43
Picture 6: mast and sensors .............................................................................................................. 46
Picture 7: relative positions of the wind turbine and the sensors ...................................................... 46
Picture 8: room setup ....................................................................................................................... 51

Vincent PETITFILS LTH – IEA
7
Chapter 1: Introduction
o Background
Nowadays, the world is facing a strong increase in energy demand, with the certitude that our
lifestyle has to change: the forecasted scarcity of the fossil energies raises the problem of finding a
way to replace these energies, whereas at the same time the environmental issues have become
central in the very idea of sustainability. The development of renewable and environmentally friendly
electricity generation solutions has led to their expansion and democratization. While wind power
refers most often to medium or large-scale facilities, an increasing demand in small-scale solutions
has led many ambitious companies to come up with their own designs. Most solutions currently
include power electronics, to varying degrees. Structurally speaking, most wind turbines are
horizontal axis turbine, vertical axis may be a future option.
Some Swedish companies are interested in testing the potential of the vertical turbines. One of these
companies in southern Sweden named EXAMEC has the ambition to have its own commercial
product. EXAMEC has since a few years ago developed vertically rotating wind turbines for electrical
power generation and intends to develop optimized generators as well as control circuits for the
units. Meanwhile, EXAMEC’s focus is also put on aerodynamics and other parameters involving the
blade configuration. They have already tested a first prototype with a five-blade turbine at two
meters in diameter and a rated output of about 2kW. The company focuses mainly on a small market
for such buildings, houses and boats, with a power range from 0.2 to 30 kW.
The advantage of vertical axis wind turbine is a simple and robust design with few moving parts that
open up for a more cost efficient wind turbines in terms of both investment and operation &
maintenance. Other advantages are the independence of wind direction, less sensitive to turbulence,
straight blade profiles and lower noise. There is also some net connection requirements related to
the wind power and the possibility to supply with power-, voltage- and frequency regulation become
increasingly important in weak networks, such as in some distribution networks and local networks
with the opportunity for island operation.
o Objectives
The purpose of this thesis work is to prepare and carry out a performance test for a small-scale
vertical axis model of wind turbine developed by the Swedish company EXAMEC. A performance test
basically consists in comparing the ratios between the wind power which is received by the turbine,
the power it actually absorbs, and the electrical power generated. However, several steps are
necessary to actually carry out such a test. This project covers most of them, including the
establishment of the project specifications, the installation of the wind turbine and its structure, the
writing and test of the automatic control sequence and the acquisition and installation of the
required equipment regarding the standards of a performance test.

Vincent PETITFILS LTH – IEA
8
o Overview of the setup
This setup includes several largely independent areas, all necessary for fulfilling the specifications of
this project. It consists not only in monitoring the power produced by the setup, but also insuring
that the setup is safe, that the measurements are performed following the standards. The following
picture (Figure 1) gives an overview of how the whole configuration was designed for covering all
these aspects. The setup is divided in three distinct sectors: measurements, control system and
power generation unit.
Figure 1: overview of the configuration
The precedent scheme shows the theoretical interaction between the different components of the
system. The power generation is insured by the wind turbine connected to a generator located at the
base of its mast. The power produced is directly sent to the electrical system, which is controlled and
filtered by AC/DC and DC/AC converters in order, among other requirements, to have it compatible
with the grid requirements. The control system can be itself divided into two parts: the central part
of it is the overall control unit named dControl and is in charge of the coordination and the actions of
the different components of the whole setup. It is connected to a human/machine interface (HMI)
for giving the user a way of choosing different running modes. It is in charge of the safety as well,

Vincent PETITFILS LTH – IEA
9
having access to the measurements (for example an excessive wind speed requires the system to be
shut down) and to the emergency stop buttons (not appearing on the picture).
o Outline
The following paragraphs describe the content of the different chapters of this report:
The chapter 2 is a general introduction to renewable energies, covering the principal techniques used
nowadays as alternative to fossil fuels.
The Chapter 3 is dedicated to the wind energy. It covers the different technologies currently used
and figure illustrating the situation of the wind energy in the world.
Chapter 4 describes how the control sequence over the setup is conceived and the different steps of
the control algorithm from the points of views of the different control units used in this project.
Chapter 5 focuses on the programming, modeling and simulation aspects of this project. It regroups
the C++ code developed for the main control unit, and the model developed under Dymola software
for reproducing the behavior of the real setup and testing the control sequence.
Chapter 6 presents the experimental setup. It is a review of all the different parts of the equipment
actually used for the project, their specifications and how they were installed.
Chapter 7 describes all the parameters of the first performance test that was set up by connecting
the wind turbine directly to a resistive load.
Vincent PETITFILS LTH – IEA
10
Chapter 2: Renewable energies
With a constantly increasing demand in energy supply, the awareness that fossil fuels are not an
unlimited resource, and concerns for the environmental issues linked to our actual energy
production pattern, the importance of renewable energies in the global energy market keeps
growing. Nowadays, several renewable sources of energy are available.
o Hydroelectricity
Hydroelectricity refers to the electrical power generated by converting the energy from different
water flows into electricity. It can both use the kinetic energy and the gravitational potential energy
stored in the water (falling water). It is the most widely used form of renewable energy.
Furthermore, even if the establishment of an hydropower plant is complex and expensive, it doesn’t
produce any waste while running, and emits very little greenhouse gas compared to standard power
plants. This was approximately 20% of the world's electricity, and accounted for about 88% of
electricity from renewable sources. The world annual production in 2010 is estimated around 3430
TWh, whereas the rest of the other renewable energies produced all together some 701 TWh for the
same year.
o Biomass
The term "biomass" encompasses diverse fuels derived from timber, agriculture and food processing
wastes or from fuel crops that are specifically grown or reserved for electricity generation. A part of
the biomass can also be used for producing directly heat, depending on the application.
Biomass energy is derived from five distinct energy sources: garbage, wood, waste, landfill gases, and
alcohol fuels. Wood energy is derived both from direct use of harvested wood as a fuel and from
wood waste streams. The largest source of energy from wood is pulping liquor or “black liquor,” a
waste product from processes of the pulp, paper and paperboard industry. Waste energy is the
second-largest source of biomass energy. The main contributors of waste energy are municipal solid
waste, manufacturing waste, and landfill gas. Biomass alcohol fuel, or ethanol, is derived primarily
from sugarcane and corn. It can be used directly as a fuel or as an additive to gasoline.
Some biomass fuels are derived from trees. Given the capacity of trees to regenerate, these fuels are
considered renewable. Burning crop residues, sewage or manure - all wastes that are continually
generated by society -- to generate electricity may offer environmental benefits in the form of
preserving precious landfill space or may be grown and harvested in ways that cause environmental
harm.
o Geothermal electricity
Geothermal electricity is electricity generated from geothermal energy. Technologies in use include
dry steam power plants, flash steam power plants and binary cycle power plants. Geothermal
electricity generation is currently used in 24 countries while geothermal heating is in use in 70
countries.

Vincent PETITFILS LTH – IEA
11
Estimates of the electricity generating potential of geothermal energy vary from 35 to 2000 GW.
Current worldwide installed capacity is 10,715 megawatts (MW), with the largest capacity in the
United States (3,086 MW), Philippines, and Indonesia.
Geothermal power is considered to be sustainable because the heat extraction is small compared
with the Earth's heat content. The emission intensity of existing geothermal electric plants is on
average 122 kg of CO2 per megawatt-hour (MW·h) of electricity, about one-eighth of a conventional
coal-fired plant. The following table (Table 1) summarizes the installed capacity of geothermal power
over the last fourty-five years:
Year 1975 1980 1985 1990 1995 2000 2005 2007
Installed Capacity
(MW) 1 300 3 887 4 764 5 832 6 833 7 972 8 933 9 732
Table 1: Installed capacity of geothermal power over time (Source: BP )
o Solar power
The solar photovoltaic energy is an electrical energy issuing from solar power. Hence it belongs to the
group of renewable energies. The photovoltaic cell is an electrical component which permits this
transformation to occur: using the photoelectric effect, it converts incoming solar radiation into
electrical current. A solar installation is usually constituted by several modules, each of them being a
set of photovoltaic cells. Photovoltaic electricity is considered as a truly promising technology, but
still represents a very small proportion of the world’s total energy supply.
In 2010, solar photovoltaics was generating electricity in more than one hundred countries around
the world and was the fastest growing power-generation technology in the world, even though its
production still remains very little compared to the total production. As can be seen below in Table2,
the production has not stopped growing from 2GW in 2002 to almost twenty times more in 2010,
almost reaching 40GW.
Year 2002 2003 2004 2005 2006 2007 2008 2009 2010
Installed capacity
(MW) 2248,5 2839,8 3989,1 5426,0 7013,5 9571,5 15900,6 23042,5 39777,8
Table 2: Installed capacity of solar power over time (Source: BP)
Such installations may be ground-mounted (and sometimes integrated with farming and grazing) or
built into the roof or walls of a building. Off-grid PV only accounts approximately for an estimated 3–
4 GW.
Driven by advances in technology and increases in manufacturing scale and sophistication, the cost of
photovoltaics has declined steadily since the first solar cells were manufactured. Net metering and
financial incentives, such as preferential feed-in tariffs for solar-generated electricity, have supported
solar PV installations in many countries.

Vincent PETITFILS LTH – IEA
12
o Wind power
Mankind has known how to use wind power for millenniums. However, back then it was only used
for generating mechanical power, in several applications such as windmills for instance. Not until the
second half of the twentieth century was it used for the electricity production, when the world faced
the first oil price shock and started looking for alternative ways of producing energy. (Thomas
Ackermann, 2005).
The wind power production has kept increasing over the last fifteen years (see Figure 2 and Table 3
below). Even though it used to be a negligible power source, wind power is nowadays one of the
most important protagonists among the renewable energies.
Figure 2 : Global wind energy capacity over the last 15 years (source: BP)
Year 1995 2000 2005 2006 2007 2008 2009 2010
Installed capacity
(MW) 4778 18450 59398 74306 94005 122158 160087 199523
Table 3: Global installed wind power capacity over time, in MW (Source: BP)
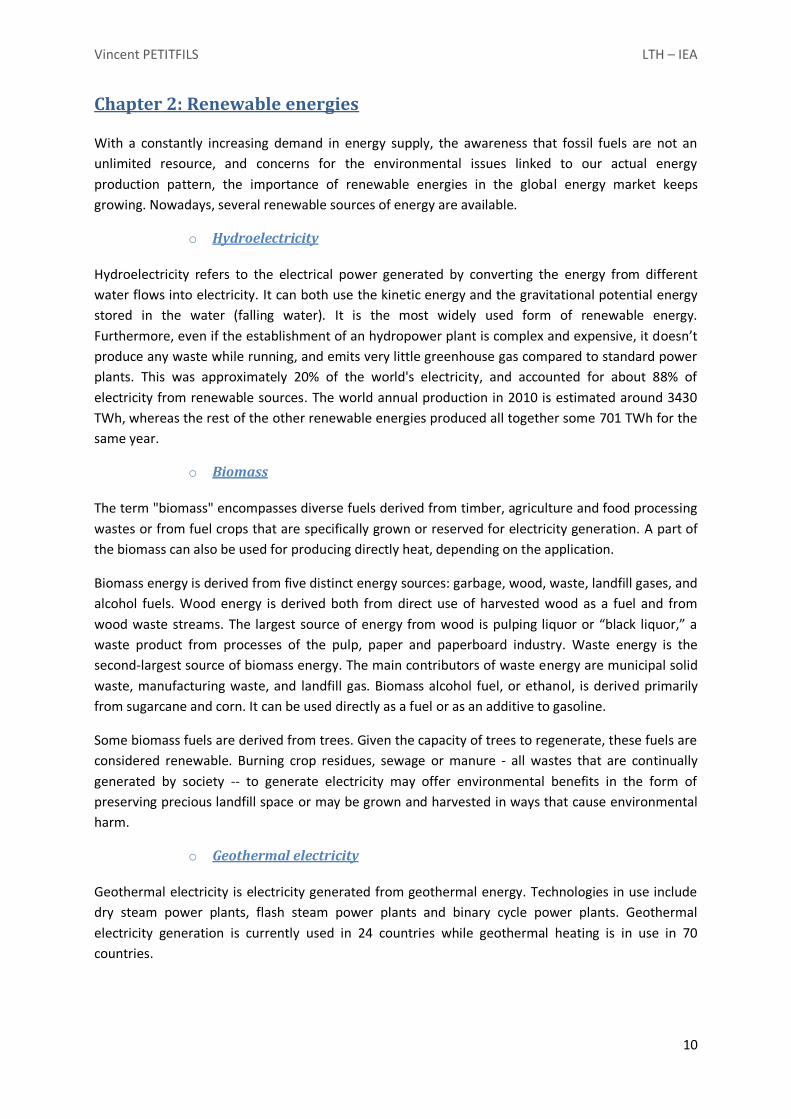
Aware of the potential that this technology represents, the wind energy sector has undergone many
research and development leading to several different designs, scales, and applications. This
breakthrough has led to an increase in the electrical production capacity. By coming up with more
robust infrastructures, biggest wind turbines have nowadays a diameter larger than one hundred
meters (see Figure 3 below), and producing up to several megawatts.
Vincent PETITFILS LTH – IEA
13
Figure 3 : Trend in increasing wind turbine size (EWEA 2007)
However, the expansion of the wind power technique is not limited to the high-scale production. It is
indeed possible now to find wind turbine with any size or produced power to match with specific
needs. As large-scale wind turbines are used for generating high amounts of current destined directly
to the power market, it is nowadays possible for utilities, neighborhoods and even individuals to
access to renewable energies by installing a low or medium power wind turbine. A classification
according to the produced power sorts the production sites into three categories with typical size
range indicated:
o Utility-Scale:
It corresponds to large turbines (from 900kW to 3MW per turbine), intended as mentioned before to
generate electricity to be directly sold to power markets. They are often found in large fields (wind
energy projects) but can also be installed in small quantities on distribution lines.
o Industrial-Scale:
It corresponds to medium sized turbines (50 kW to 250 kW) intended for remote grid production,
often in conjunction with diesel generation or load-side generation (on the customer’s side of the
meter) to reduce consumption of higher cost grid power and possibly to even reduce peak loads.
Direct sale of energy to the local utility may or may not be allowed under state law or utility
regulations.
o Residential-Scale:
It corresponds to micro- and small-scale turbines (400 watts to 50 kW) intended for remote power,
battery charging, or net metering type generation. The small turbines can be used in conjunction
with solar photovoltaics, batteries, and inverters to provide constant power at remote locations
where installation of a distribution line is not possible or is more expensive.

Vincent PETITFILS LTH – IEA
14
Wind turbines come in two types; horizontal axis and vertical axis (see picture below). Horizontal axis
turbines are the more familiar ‘windmill’ type where the blades rotate in a vertical plane about a
horizontal axis and the turbine is dynamically rotated on its tower to face the wind. Vertical axis
turbines do not need orientation into the wind, although the earlier versions, sometimes known as
‘eggbeater’ turbines (see figure 4, right picture) required a power source to start rotating because of
their high torque.
Figure 4 : vertical and horizontal axis wind turbines
More recent innovations have helical blade designs that have low torque and can operate without
external power. Vertical axis turbines are particularly suited to small wind power applications
because they have a small environmental impact and low noise, but have not yet scaled up to the
megawatt level.

Vincent PETITFILS LTH – IEA
15
Uair: laminar wind speed
Chapter 3: Performance testing of a wind turbine
This test aims at measuring the performances of a wind turbine, depending on its characteristics.
A performance test basically consists in comparing the ratios between the wind power which is
received by the turbine, the power it actually absorbs, and the electrical power generated.
The incoming power from the wind comes from its kinetic energy. It can be expressed:
As the air density depends on the temperature, the humidity and the atmospheric pressure, all these
parameters have to be constantly measured for calculating Pair. An accurate measurement of the
wind speed is even more important, because of the cubic dependency expressed above.
The ratio between the mechanical power incoming and the one absorbed by the wind turbine is most
often referred as cp, and expressed as follows:
By plotting the cp values against the wind speed, one can actually see the performance of the
mechanical part of the system. Indeed, this cp coefficient represents the efficiency of the mechanical
conversion of the wind power by the wind turbine. It can be noted that the Betz’ law proves that the
maximum cp value for a wind turbine is cp,max=0.593.
The second part of the system is the conversion from the mechanical power of the rotating wind
turbine into electrical power, via the permanent magnets generator.
Finally, in the case of a complete grid-connected solution, a last relevant value is the conversion rate
between the raw electrical power produced by the generator and the one of the electrical signal
after having been made compatible with the standards of the grid. In this project, the electrical
converters are not optimized so that the overall efficiency of the system can be expected to be
higher with more appropriate components.
o Tip speed values and power curves
Tip speed values
The most important parameter deciding for the output of the wind turbine is the rotor tip speed
ratio. It is expressed as:
Pproduced: mechanical power of
the wind turbine
Vincent PETITFILS LTH – IEA
16
This dimensionless factor is widely used for relating the performance of wind turbines. Its
importance can be interpreted in a simple way: if the rotor rotates very slowly, most of the wind will
flow between the blades, not contributing and transmitting its kinematic energy. On the other hand,
it the rotor has an important tip speed ratio, meaning that its angular speed is too high compared to
the wind speed, the situation is almost the same as if the wind were blowing onto a wall: the air
flows responsible for creating the movement of one blade are disturbed by the next blade,
decreasing drastically the power production of the wind turbine. The optimal rotor tip speed ratio
depends on the number of blades, to aerodynamics of the blades, and the configuration of the
turbine.
Furthermore, the choice of the optimal tip speed ratio has some side effects, most of them
mechanical: a rotor designed for high rotating speed will naturally have a higher overall number of
rotations, leading to more frictions and erosion. It also affects the whole design of the structure,
because the frequency of the vibrations generated by the rotor is directly linked to the rotational
speed of it. The frequency is also important for the noise resulting by the turbine.
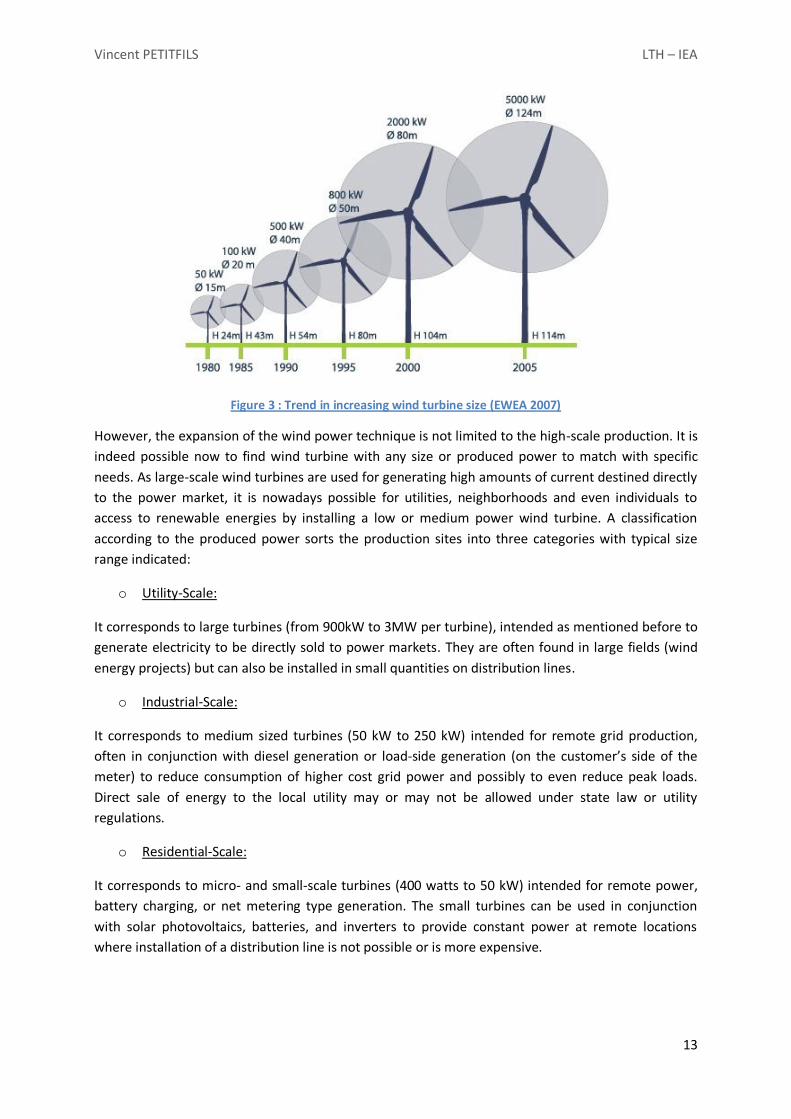
Power curve
A power curve is usually used for characterizing the performances of a wind turbine. It consists in
plotting the cp coefficient introduced earlier against the tip speed ratio λ. The Figure 5 gives some
typical cp curves, for different kind of turbines:
Figure 5: CP curves for different wind turbines.

Vincent PETITFILS LTH – IEA
17
As mentioned before, the ideal Betz limit has a maximum Cp value of 0.59. Depending on the number
of blades and the structure of the windmill, the operating point is totally different: even if both of
them are vertical blades rotor, the Savonius rotor operates at low tip speed ratios, whereas the
Darrieus one requires much higher values for λ.

Vincent PETITFILS LTH – IEA
18
Chapter 4: Wind turbine control
The actions of the different modules constituting the wind turbine setup have to be coordinated and
controlled regarding their behavior and the external conditions. It was decided to locate the control
system as described in the Figure 6 below:
Figure 6: Location of the control system in the setup
The control system is directly connected to the electrical part of the setup. It will be in charge of
interconnecting the different parts of the system as well as of the safety issues and the regulation in
the power produced by the wind turbine. The location within the system gives the possibility to acts
on the electrical part on the wind turbine side and on the grid side at the same time.
o The control units
The design chosen for the control tasks is to have a main control unit, named dControl, which
performs high level control on the setup. Two micro-controllers µ1 and µ2 are used for controlling
the electrical converters respectively on the turbine and grid side. It was chosen to have separate
units and microcontrollers for the AC/DC and DC/AC converters considering the possibility of future
developments of the system. Indeed, if a new power generation device is implanted on the roof
(another wind turbine for instance), the control system can use the already existing dControl unit for
controlling the whole setup. The microcontroller and converter on the grid side would be common
for the whole system as well, and only the microcontroller dedicated to the regulation of the power
generation unit has to be specifically designed. Hence, the modularity of the system is the best
solution for anticipating any future expansion of the production site. A display of the connection
between the cabinets can be seen in the following figure (Figure7).

Vincent PETITFILS LTH – IEA
19
Figure 7: possible expansion of the system, using the modularity
Having a microcontroller dedicated to the grid side means that it can regulate the flow coming from
several units, such as several wind turbines, but other sources such as photovoltaics panels as well
The following figure (Figure 8) gives an overview of the way the controllers are interconnected and
their inputs and outputs.
Figure 8 : overview of the control units

Vincent PETITFILS LTH – IEA
20
The overall control unit: dControl
The overall control unit, named dControl, is used for coordinating and supervising the functioning of
the whole setup. The user’s decisions/requirements will be implemented through this module.
It is responsible for the transitions between the different states of the process, the management of
the errors according to their degree of importance. This unit is directly connected to:
Real-time measurements units: wind speed, rotational speed, pressure
Safety units: mechanical brake, circuit breakers, emergency stop buttons,
Micro-controllers responsible for the control over the electrical converters
dControl has to inform the user if there is any problem and to have predefined answers to the
different situations (ex: not to release the brake if the wind is going too fast, or identifying the errors
and their origins signaled by the µControllers).
Different signals received by this unit:
Inputs:
- Start/Stop button(s)
- Wind speed
- Wind turbine rotational velocity
- Status from the microcontrollers (respectively µ1 and µ2) in different situations:
the microcontrollers are functioning correctly
the microcontrollers have received the mode selection wished
there is an error. Depending on the nature on the error, the microcontrollers
will return an appropriate status: “µ1errorX”, “µ2errorX” where X is used to
describe the error type (and an additional value in the case of an unidentified
problem).
the µcontrollers are running
- Status from the mechanical brake (“mb_closed”, “mb_released”, or “error”)
- Emergency stops (em_stopX), X for the different locations
- Rotor speed (safety signal)
- Vibrations (safety signal)
- Rotation speed sensor
- Torque sensor
Inputs
•Measurements
• Status/Feedback
•Commands
dControl
•Internal functions
•Adapted response to the situation
Output
•Command signals

Vincent PETITFILS LTH – IEA
21
Outputs:
- Instructions to the µControllers
Mode selection
Error signals
- Emergency control over the circuit breakers
- Control over the wind turbine brake (“release brake”, “brake”)
- Interface to the computer
The idea is to have dControl ready to deal with any kind of input and provide an appropriate answer
via its outputs.
Micro-controllers
The role of the microcontrollers is to control the converters, and communicate with the main control
unit (dControl) via predefined signals. The list of inputs and outputs for both microcontrollers is
described below:
µ1 (wind turbine side):
Inputs:
- Orders from dControl (see dControl outputs)
- Voltage/Current from the three-phases connected to the wind turbine,
Voltage/Current from the DC part
- Status of the circuit breaker (“c_open”, “c_closed” (“c_closed” meaning that some
current can flow))
- Emergency stop signals
Outputs:
- Continuous status reporting to dControl (see dControl inputs)
- Error(s) report to dControl
- Control sequences over the AC/DC electrical converter
- Control over the circuit breaker
µController2 (grid side):
Inputs:
- Orders from dControl (see dControl outputs)
- Voltage/Current from the three-phases connected to the grid, Voltage/Current from
the DC part
- Status of the circuit breaker (“c_open”, “c_closed” (“c_closed” meaning that some
current can flow))
Vincent PETITFILS LTH – IEA
22
- Emergency stop signals
Outputs:
- Continuous status reporting to dControl (see dControl inputs)
- Error(s) report to dControl
- Control sequences over the DC/AC electrical converter
- Control over the circuit breaker
The main role of µ2 is to prepare the grid and the DC side by adjusting the voltage level to a preset
value (700V). µ1 has a more advanced role, because it has to control and regulate the power
according to the mode selection chosen initially by the user. Its functioning is described in detail in
the following section.
Both microcontrollers are communicating with dControl in order to report their status the whole
time, insuring that the instructions received have been taken into account and transmitting error
messages when any unwished behavior occurs.
Functioning of µ1:
Initially, µ1 is off. It is turned on when the system starts functioning. If there is no error (i.e no
emergency button pushed, and no internal error detected), the circuit breaker is closed (‘c_closed”).
When this is done, µ1 is waiting for the mode selection (send by dControl). µ1 then works under the
functioning mode request (maximum power or power point tracker) sent by dControl. While
working, the µcontroller µ1 sends back to dControl the state “µ1proceeding”.
If the shutdown procedure is engaged, then µ1 slows down the wind turbine until the mechanical
brake is put on, and come back to an idle status (clear all mode selection, etc). The user can then turn
it off. If the shutdown was due for instance to an excessive wind speed, µ1 will receive again the
mode selection it is demanded to follow.
o The control modes
Quick stop: this is the command used for emergency stopping. Regardless of the situation, it forces
the wind turbine to stop by using the mechanical brake.
Stop: this selection mode is used for stopping the wind turbine normally. It uses the power control
for slowing down the wind turbine, and the mechanical brake is only used once the rotor is stopped.
Start: the system will only start if this selection is chosen. When “Start” is chosen on the board, the
system will automatically be running trying to extract the maximum power from the wind turbine.
Using the computer interface grants access to more options concerning the running mode, such as
for instance setting a fixed level of power produced by the turbine.
Idle: this selection is required for the computer to be taken into account by the system. That way,
the control can be taken over by the control board anytime.

Vincent PETITFILS LTH – IEA
23
o The control sequences
It shows the control sequence from each control unit’s points of view and their own dependency
towards external factors such as for instance the presence of errors. The following control sequence
is written from dControl’s point of view. It represents the different steps of the process, and the
required conditions for validating the transitions between them. The detailed meaning of the
different states and transitions is detailed in Appendix A.
Vincent PETITFILS LTH – IEA
24
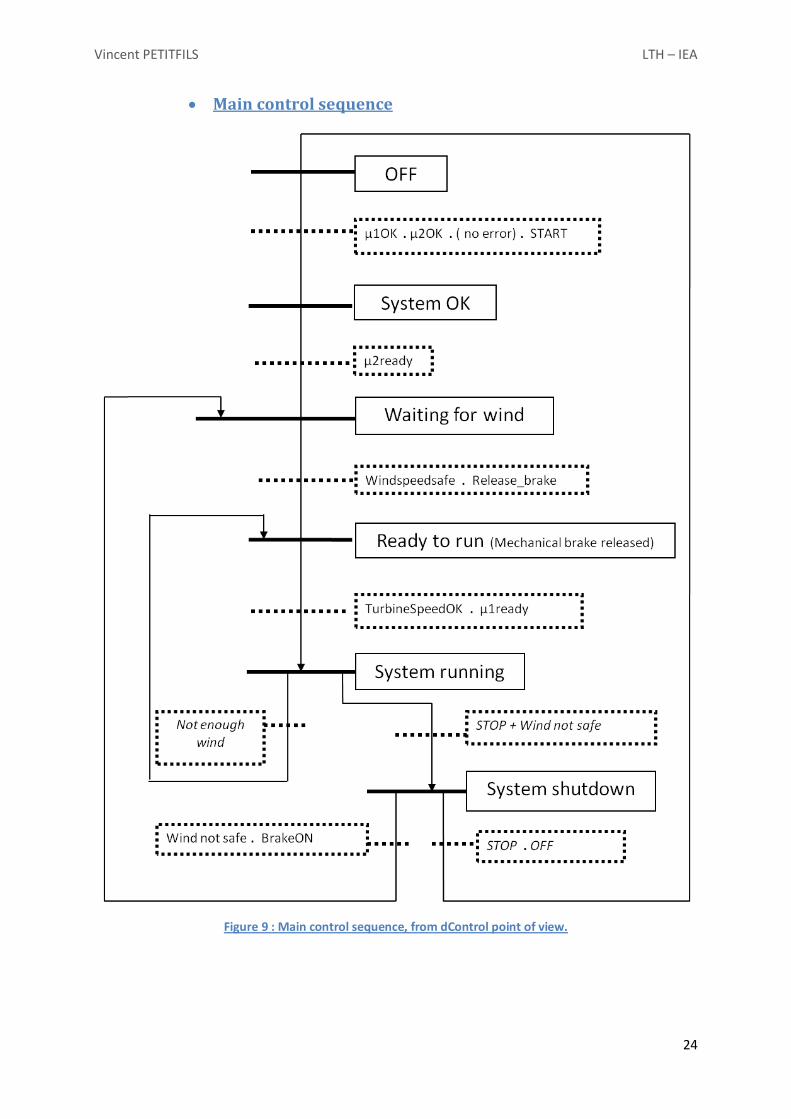
Main control sequence
Figure 9 : Main control sequence, from dControl point of view.

Vincent PETITFILS LTH – IEA
25
Description of the precedent sequence:
Initially, all the devices are switched off. The user starts them by using the ON/OFF button on the
board. If there is no internal error (including emergency stop buttons) and that the user selects the
option “Start” (computer or board selection), the system start working. The microcontroller (µ2) in
charge of the grid side prepares the voltage on the DC side (700V).
Then, if the wind speed is safe (<14m/s), the mechanical brake is released and the rotor set free to
rotate. If the wind is high enough for starting the wind turbine (>5m/s), the control mode instructions
are sent to the microcontroller on the wind turbine side (µ1).
While the wind turbine is running, if the wind goes down for too long, µ1 has its activity stopped and
the system waits for higher wind again.
At any time of the process, if the wind happens to be too high, or an error occurs, the system
switches to a shutdown procedure. Depending on the situation, the system can be normally stopped,
meaning that the microcontrollers help progressively curving the speed of the wind turbine before
braking, or quickly stopped meaning that the brake is directly used for stopping the wind turbine. The
shutdown sequence is structured as follows:
Shutdown sequence:
Figure 10: Main control sequence, from dControl point of view.

Vincent PETITFILS LTH – IEA
26
Shutdown procedure:
At any time during the procedure, some errors or unexpected situations can occur. The system has to
stop when the user decides to as well. That is the reason why it is necessary to have a shutdown
procedure adapted to the different cases, which is ready to start anytime.
The normal shutdown procedure consists in slowing down the wind turbine by adjusting the power
with the help of the microcontrollers and put the brake on when it is still. If the user wants to stop
the whole setup completely, then the microcontrollers are switched off, and the user can put the
board in the “OFF” position.
The quick stop procedure happens in the case of a major failure (see the errors classification). Then
the brake is directly used for stopping the wind turbine.
Control sequence, from µ2 point of view
Figure 11 : control sequence from µ2 point of view
OFF
µ2 turned
on
START
errorX . _
prepareDC
µ2OK
µ2ready
µ2 Shutdown
shutdown
OFF

Vincent PETITFILS LTH – IEA
27
Description of the procedure for the µcontroller µ2:
Initially, µ2 is off. The user turns it on. If there is no error (i.e no emergency button pushed, and no
internal error detected), the circuit breaker is closed (‘c_closed”).
When this is done, µ2 is waiting for the mode selection (send by dControl).
µ2 then regulates the voltage on the DC side (“prepared”). While working, the µcontroller µ2 keeps
reporting its status to dControl. When the wished voltage is reached, the signal “µ2ready” is sent to
dControl.
When the system is shutdown by the user (“shutdown”), then µ2 initiates its shutdown procedure.
Then it is ready to be turned off by the user.
o Commands inputs and outputs
Legend for the following page:
Means that the dControl unit sends a signal
Means that the dControl unit receives a signal
Means that the dControl unit calls and internal function for a test.
____________
Initially: OFF. The user presses a Start button.
Send the “get ready” value to µ1
Send the “get ready” value to µ2
Status confirmation from µ1 “µ1OK”
Status confirmation from µ2 “µ2OK”
System OK
Send the “Prepare DC” value to µ2
Status confirmation from µ2: “µ2ready”
Waiting for wind
Tests on the wind speed: too low for wind <5m/s, too high for wind>14m/s
Send the command to release the brake: “releasebrake”
Status confirmation from the brake
Ready to run
Send the mode selection to µ1 : “maximum power” or “setpoint”
Receive status confirmation from µ1: “µ1ready”
System running

Vincent PETITFILS LTH – IEA
28
The system can be stopped by the user, or due to some safety reasons
Shutdown procedure
Send “shutdown” to µ1, which tries to decrease the speed from the turbine by power control
IF the turbine is slowing down, wait till it stops. Then:
Send the command to put the brake on
Status confirmation from the brake “BrakeON”
IF NOT, then the emergency braking has to start: the brake is put on without waiting.
___________________
If the shutdown procedure started because of an excessive wind speed, the system goes back to the
status “Waiting for wind” and can restart after an additional test on the wind stability. If the
shutdown procedure was due to some major system failure or by the user’s will, the turbine is
stopped and in case of electrical issues, the circuit is put off tension.

Vincent PETITFILS LTH – IEA
29
Chapter 5: Modeling, programming and simulation
In this chapter, the detail of the control code and its test using the simulation tool Dymola are
described.
Indeed, as the code responsible for the control sequence has for purpose to control and regulate the
behavior of the whole setup, the possibility to test it first by implementing it in a simulation tool
before running it with the real equipment was a real opportunity. The simulation tool Dymola was
chosen to reproduce the behavior of the whole setup, so that the control sequence and its code
could be tested.
As a programming language compatible with most of the processors was required, the control
sequence was written in C++ programming language.
o Dymola
Dymola is a simulation tool used for creating models and simulations of integrated and complex
systems for use within automotive, aerospace, robotics, process and other applications. Hence it was
possible to simulate the behavior of this wind power system, by designing the different modules and
components constituting it. A Dymola model is usually structured in several blocks, each block
designed for simulating a specific aspect of the model. A model is structured in different levels, each
block containing sub-blocks until it reaches an elementary level. The blocks are interconnected by
inputs and outputs and each one of them can be monitored after the simulation, granting the user
the possibility to check the behavior of any level of the model.
All the blocks are described using the Modelica modeling language, which allows to develop specific
functions and behavior for some of them. In our model for instance, dControl is exclusively described
using Modelica. Furthermore, the Modelica language permits to implement and execute C++
libraries, by using a C++/Modelica interface. Hence, Dymola could be used testing the control
sequence before actually using it for the wind turbine. The main objective of this simulation tool was
to test the coherence of the C++ code, fix its errors and possibly improve it.
Overview
The first step using Dymola was to build the setup including all the organs of the real setup. However,
the finality of this project not being to develop a simulation tool for a wind power unit, the model
developed is not an exact replica of the real setup of this project. It is nevertheless close enough to
have the same behavior as the real setup. The stress has been put on getting the correct trends more
than providing exact numerical values. Furthermore, the control code was developed for a generic
kind of installation (i.e not depending on the size of the turbine, except for the safety considerations
regarding the wind speed limits), which guarantees that the numerical values of the model do no
alter the nature of the results. The following picture shows an overview of the block structure used
for implementing this setup into Dymola.

Vincent PETITFILS LTH – IEA
30
Figure 12: Dymola model
The red “Control” box above represents the dControl unit in the real setup. It is connected to some
virtual inputs representing the board and the computer (green boxes above), necessary for the
starting the model and selecting the running mode. It is connected to the microcontrollers as well
(orange boxes). As additional inputs, it receives directly the wind speed, the torque from the wind
turbine, and the time from a clock (used for temporization). The chain at the bottom of the picture
(blue box) represents the electrical path from the wind turbine to the grid, with converters and filter
in between.
Each of the units inside of the Dymola model is defined at lower scale by a combination of basic
Dymola components (switches, multipliers, PID filters for instance), and/or defined by a code written
in Modelica programming language.
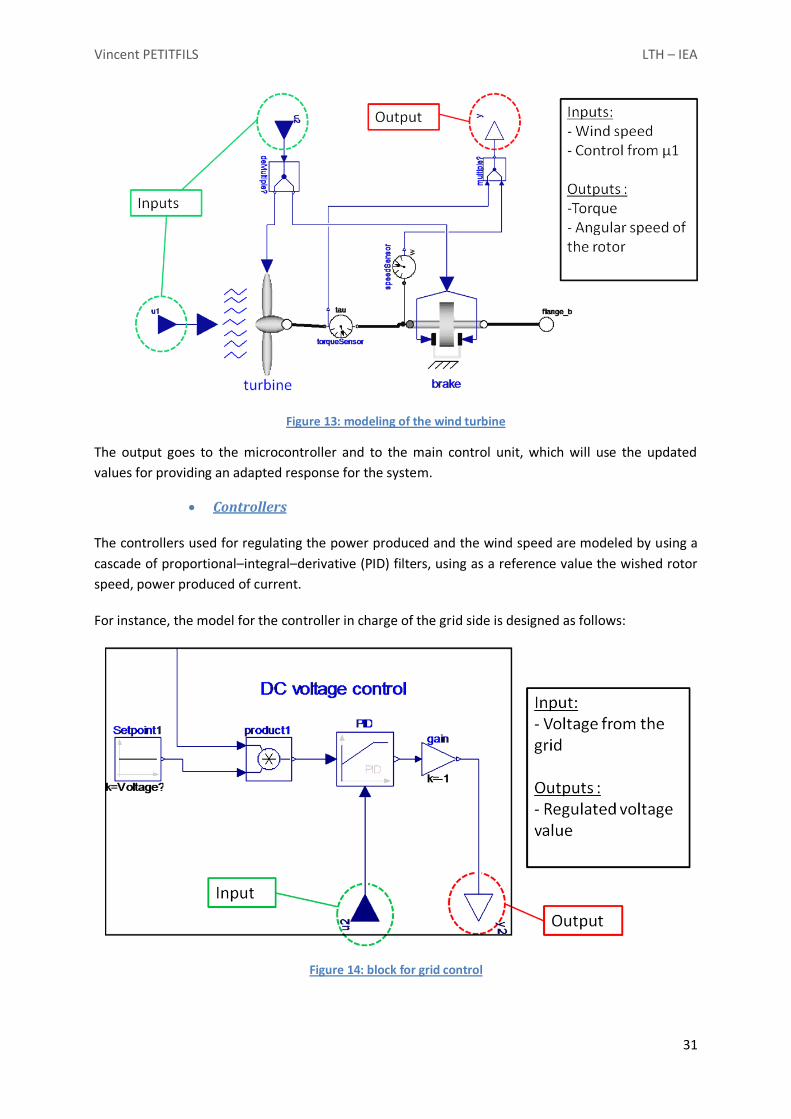
Electrical chain
The connection from the wind turbine to the grid (teal box) is constituted by several blocks. It
includes the wind turbine, the electrical converters, the generator and the grid itself. The models for
components such as the turbine, the generator or the brake are issued from Dymola libraries. The
following picture shows how the wind turbine block is built: a chain constituted by the rotor and the
brake is used for simulating the mechanical part of the turbine. This block has the wind speed and
some control signals as inputs and the torque and angular speed of the rotor as outputs.
Vincent PETITFILS LTH – IEA
31
Figure 13: modeling of the wind turbine
The output goes to the microcontroller and to the main control unit, which will use the updated
values for providing an adapted response for the system.
Controllers
The controllers used for regulating the power produced and the wind speed are modeled by using a
cascade of proportional–integral–derivative (PID) filters, using as a reference value the wished rotor
speed, power produced of current.
For instance, the model for the controller in charge of the grid side is designed as follows:
Figure 14: block for grid control

Vincent PETITFILS LTH – IEA
32
It compares the value of the voltage coming from the input u2 (which represents a measurement of
the DC voltage) to a setpoint. The “product1” box simply takes as inputs two signals and returns their
product as an output. Therefore it can be is used as a simple switch condition, considering that if a
“0” value comes from the dControl command unit, the results of the product will be 0, which results
here in a setpoint value equals to 0V. The other controller block is slightly more advanced, but works
on the same model as this controller.
Input signals
The inputs signals of the model have to be simulated in order to test the response of the model to
changes. Different wind profiles have been chosen for the simulations. It is generated by a
mathematical function which makes it vary over time.
Another kind of input signals is the control ones emitted in the real setup by the control board or a
computer. It is modeled as an input which value can vary between integers, each of them
representing a control mode (for instance 0= off, 1=run, etc).
o C++
The aim of the C++ code is to define the behavior of the dControl unit. It has to give an appropriate
answer to any kind of situation, depending on the inputs received.
The code is divided into two sequences. The first one is used for running the system in a normal
situation. If any error occurs, or the system is required to shutdown, the code switches to the other
sequence, dedicated to the shutdown of the system. Each one of these sequences is constructed as a
loop, where a validated transition is needed for going to one state to the other. It was hence
required to define a class representing a state. Basically, each state of the process is represented by
an integer. Using this system, most of the work focuses on implementing the correct transitions
between one state and another. If they are completed, the system will move from one state to the
one defined by the transitions it validated.
The code is divided into three main methods:
zWTC_Init
It builds up and assigns values to all the parameters which would be used in the code. The inputs and
the outputs are respectively stored in vector “m_inVec” and “m_outVec”. The choice of the initial
value is important especially for safety issues: for instance, the mechanical brake has to be set on by
default.
zWTC_Update
This method is the one actually in charge of the control of the system. Once every parameter has
been initialized by zWTC_Init, zWTC_Update enters in action.
The first test it contains has for purpose to detect and give an appropriate answer to the control
source. Indeed, the control over the installation can be issued from a board or from a computer used
as an interface: each of the modes of the board corresponds to an integer. The code below simply
tests which mode is selected.

Vincent PETITFILS LTH – IEA
33
//Board: 1=quickstop, 2=stop, 3=start, 4=idle if (m_inVec->elementAt(5)==1) {quickstop=true;} else if (m_inVec->elementAt(5)==2) {stop=true;} else if (m_inVec->elementAt(5)==3) { start=true; } //Computer: if the Board is "idle", then the computer can give orders. 1=quickstop, 2=stop, 3=start else if (m_inVec->elementAt(5)==4) { source =1; } if (source==1) { if (m_inVec->elementAt(8)==1) { quickstop=true; } if (m_inVec->elementAt(8)==2) { stop=true; } if (m_inVec->elementAt(8)==3) { start=true; } else {stop=true;} }
The first line of this example consists in testing if the value of the component number 5 of the vector
“m_inVec” is equal to 1. If it is the case, the boolean “quickstop” is set to “true”. By considering all
the different cases, the code is written in a way insuring that the system will start if and only if either
the board or the computer sends a “start” signal to dControl. If the selection is done, then the main
part of method can start. It is mainly composed by the normal and the shutdown loop. Each one of
them is structured like the following model:
switch (number of the state) { case x:
actions, tests uploading the number of the state
break; … }
Vincent PETITFILS LTH – IEA
34
In this example, when the state number is “x”, the actions defined for “case x” will be implemented,
and the number of the state will be uploaded towards the next wished state. For example, when the
safety tests are done, the system can move on to a state where the mechanical brake will be
released. The “normal” and the “shutdown” loops are defined in a way that it is always possible to
jump from one to the other (if an error occurs, the “shutdown” loop should start immediately), but
impossible for both to be running at the same time.
In the example above, when the wind reaches a value considered dangerous for the system, the
control mode switches from the normal running sequence to the shutdown sequence. As soon as the
“shutdown” loop is activated, the “normal” one is turned off. When the wind slows down, the system
switches back to the normal control sequence, and the shutdown sequence is deactivated.
The zWTC_Update method then stores the different outputs in a vector defined inside of the C++
code, which will be used by the following sequence:
zWTC_Get
The zWTC_Get method is used as an interface for Dymola. Its role is to export the components of the
output from the C++ vector generated by zWTC_Update into a vector defined in Dymola. The vector
created in Dymola will then be used to assign the new values to the output of dControl.
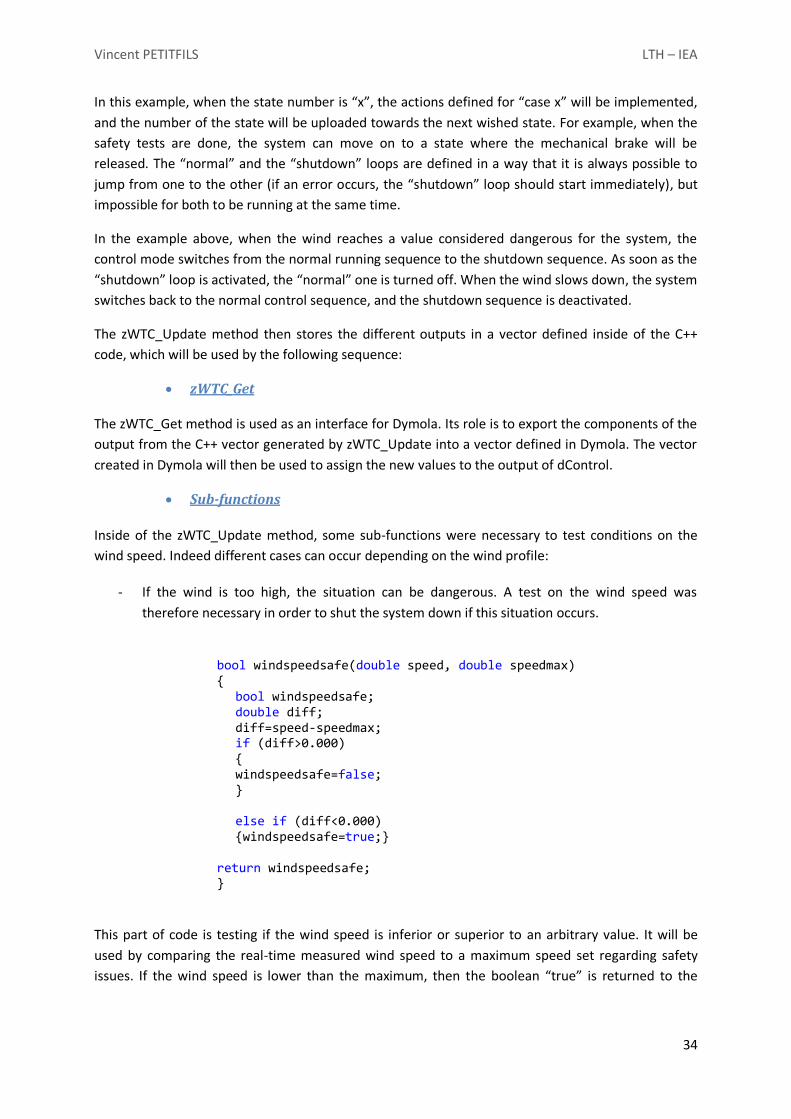
Sub-functions
Inside of the zWTC_Update method, some sub-functions were necessary to test conditions on the
wind speed. Indeed different cases can occur depending on the wind profile:
- If the wind is too high, the situation can be dangerous. A test on the wind speed was
therefore necessary in order to shut the system down if this situation occurs.
bool windspeedsafe(double speed, double speedmax) {
bool windspeedsafe; double diff; diff=speed-speedmax; if (diff>0.000) { windspeedsafe=false; }
else if (diff<0.000) {windspeedsafe=true;}
return windspeedsafe; }
This part of code is testing if the wind speed is inferior or superior to an arbitrary value. It will be
used by comparing the real-time measured wind speed to a maximum speed set regarding safety
issues. If the wind speed is lower than the maximum, then the boolean “true” is returned to the

Vincent PETITFILS LTH – IEA
35
system; else, “false” is returned. This test is performed at each compilation step, starting when the
turbine is about to be run.
In contrary, when the wind speed drops while the wind turbine tries to be run, the system stops.
When the wind happens to be too low, the wind turbine will simply stop. The system is then set to an
“idle” status, waiting for stronger wind. The function in charge of this test is designed with the same
structure as the previous one, and is called “lowwindspeed”. It returns “true” is the wind is low, and
“false” if not.
When the wind happens to be too high, the system is shut down waiting for more appropriate and
safer wind speeds. As it is unwished to have a system starting and stopping if the wind if oscillating
around the maximum value, the condition for the wind to restart includes a temporization and a
lower wind speed limit, to insure that the wind is steady, at a lower speed.
dControl
The Modelica code used for describing the behavior of dControl imports functions described
separately in a C++ programming sequence. In this block, the three main methods developed in the
C++ code are imported and executed into the Modelica modeling language. They can later on be
used inside of the simulation performed by Dymola. The Modelica sequence consists in:
1) Initializing the simulation:
The methods developed in C++ programming language are imported in Dymola. The initial
parameters used for describing the configuration (number of inputs, outputs) and defined.
model WindTurbineX1Controller
import zWTC_Init; import zWTC_Update; import zWTC_Get;
parameter Integer cvSize=3; parameter Integer inVecSize=12; parameter Integer outVecSize=6; parameter Real cv[cvSize] = {4,inVecSize,outVecSize}; Real inVec[inVecSize]; Real outVec[outVecSize]; Real id1; Real id2; [ …..]
2) Calling the “zWTC_Init” function, which is in charge of initializing the variables defined
above:
equation when initial() then id1 = zWTC_Init(cv, cvSize); end when;
Importing the C++
functions
Definition of the parameters
used during the simulation

Vincent PETITFILS LTH – IEA
36
The “initial()” condition means that the instructions contained in the loop will be read only once
when the simulation starts. The rest of the sequence is read at every simulation step:
3) The inputs coming in dControl are read at every step and stored in a vector. This vector
“inVec” is then used by the C++ method “zWTC_Update” which has for purpose to evaluate
the appropriate response signals to these input ones.
inVec[1] = u1; inVec[2] = u2; [ …] inVec[12]= u7;
id2 = zWTC_Update(id1, inVec, inVecSize);
4) Affecting the calculated outputs inside of a Dymola vector, using “zWTC_Get”:
for i in 1:outVecSize loop outVec[i]=zWTC_Get(id2,i); end for;
5) Assigning the vector components directly in the dControl outputs:
y1 = outVec[1]; […] y6 = outVec[5];
o Simulation results
This section aims at checking if themodel reacts in the expected way to the control code. The
following graphes are obtained using Dymola for the simulation. The picture below shows the
reaction of the Booleans responsible for the tests on the wind speed following its variations.
Figure 15: tests on the wind speed
The graph on the left illustrates the response of the boolean “lowwindspeed”. The threshold being
set for a wind speed of 5m/s, the Boolean switches from “true” (numerical value 1) to “false” when
the wind (red curve) reaches this value. The right hand graph shows the response of the Boolean
Storing the inputs in a vector
“inVec”
Using “inVec” for calculating
the appropriate responses

Vincent PETITFILS LTH – IEA
37
“windspeedsafe”, created for securing the setup in case of strong winds. When the wind exceeds the
threshold value (set to 14m/s for our setup), the Boolean turns “false”. This test is used for insuring
the safety of the installation.
The following graph shows the evolution of the control sequences over time, as a function of the
wind speed. The blue line represents the “normal” sequence, the green one the “shutdown”
sequence and the red line represents the wind speed.
Figure 16: Control sequences over time, depending on the wind speed
The “normal” sequence starts when the wind has reached a value high enough for starting the
turbine. Even if the quickness of the computation does not allow to see it on this picture, the
program goes through all the states one after the other, verifying at every computational step that all
the tests necessary to validate the transition from one state to the next one have been completed.
Eventually, the loop reaches a stable state, when the turbine is actually running (state number 42 on
the graph above). As the wind speed keeps increasing, it ends up reaching the safety limit (14m/s):
the control unit switches from the “normal” sequence to the “shutdown” one. According to the
situation, the action can be totally aborted, but here the turbine is simply put in a “standby” mode,
waiting for the wind to reach an acceptable value again, set to 12m/s. This acceptable value is below
the safety one, so that the system does not get stuck in a situation where it doesn’t stop switching
between the different control modes because the wind is oscillating around the safety threshold
value.
Finally, the next graphs show the simulated values of the Cp coefficient as a function of the time, for
different wind profiles. In these simulations, the control system is designed for extracting the
maximum power from the wind turbine.

Vincent PETITFILS LTH – IEA
38
Figure 17 : Cp curve (right) as a function of the wind (left) over time
Except from the oscillations when the wind turbine starts running, due to some modeling issues, the
simulation works and gives the expected results: in both cases the Cp values reach a maximum
around 0,5. In the first case, the system is unable to keep it this value that high, because the wind
gets too strong for being compensated by the controllers.

Vincent PETITFILS LTH – IEA
39
Chapter 6: Experimental setup
o Stakeholders
This project results from the cooperation between the company EXAMEC and The Lund Institute of
Technology (LTH). It officially started in January 2011, having for final aim to provide fully operational
small-scale wind electricity solutions for EXAMEC. It grants the opportunity for LTH to have a wind
setup that is operational. The wind turbine itself is a visible emblem of the interest and commitment
of the university into renewable energies and environmental issues. It also benefits in this way to the
owner of the building, namely Akademiska Hus.
In particular, the IEA division can use this setup for testing different devices, such as generators or
control systems. It will also be used as a pedagogical support for a course about wind power.
o Overview of the setup
The experimental setup follow the theoretical configuration decided for it. The following picture
restates the overview of it:
Figure 18: overview of the configuration
Vincent PETITFILS LTH – IEA
40
The setup is divided in three distinct sectors: measurements, control system and power generation
unit. In the following paragraphs the specifications and actions of the different devices are described
more in detail.
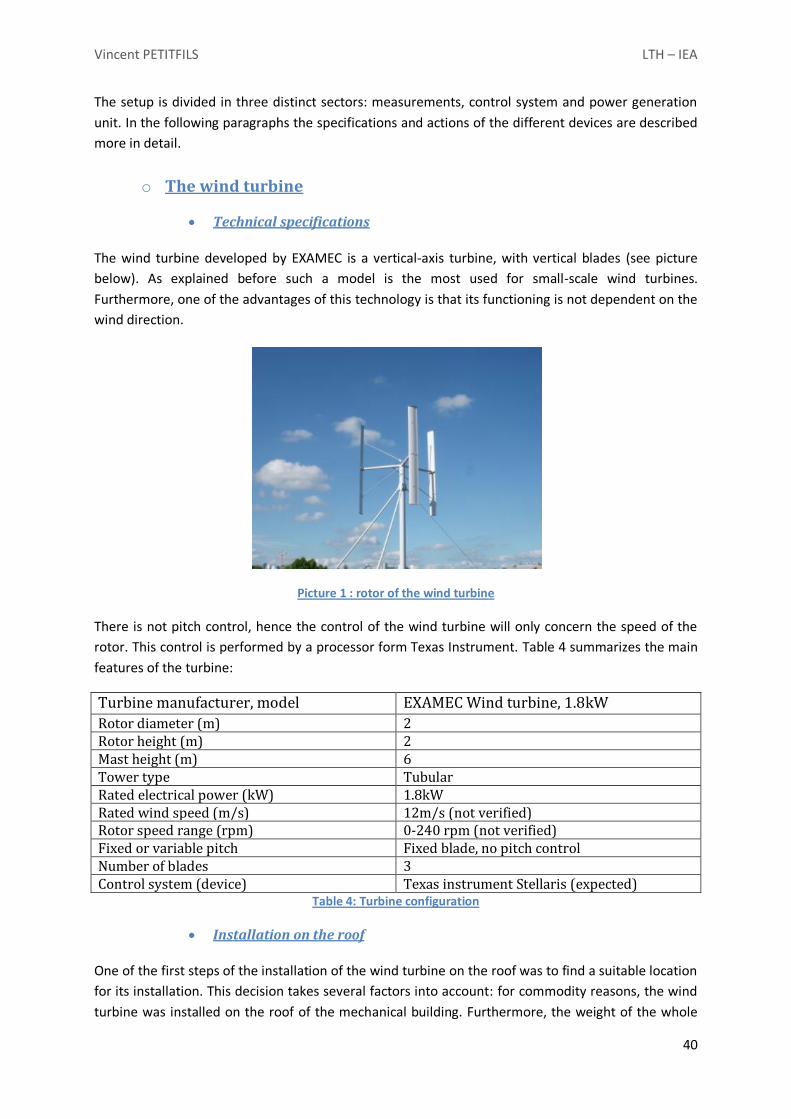
o The wind turbine
Technical specifications
The wind turbine developed by EXAMEC is a vertical-axis turbine, with vertical blades (see picture
below). As explained before such a model is the most used for small-scale wind turbines.
Furthermore, one of the advantages of this technology is that its functioning is not dependent on the
wind direction.
Picture 1 : rotor of the wind turbine
There is not pitch control, hence the control of the wind turbine will only concern the speed of the
rotor. This control is performed by a processor form Texas Instrument. Table 4 summarizes the main
features of the turbine:
Turbine manufacturer, model EXAMEC Wind turbine, 1.8kW
Rotor diameter (m) 2 Rotor height (m) 2 Mast height (m) 6 Tower type Tubular Rated electrical power (kW) 1.8kW Rated wind speed (m/s) 12m/s (not verified) Rotor speed range (rpm) 0-240 rpm (not verified) Fixed or variable pitch Fixed blade, no pitch control Number of blades 3 Control system (device) Texas instrument Stellaris (expected)
Table 4: Turbine configuration
Installation on the roof
One of the first steps of the installation of the wind turbine on the roof was to find a suitable location
for its installation. This decision takes several factors into account: for commodity reasons, the wind
turbine was installed on the roof of the mechanical building. Furthermore, the weight of the whole
Vincent PETITFILS LTH – IEA
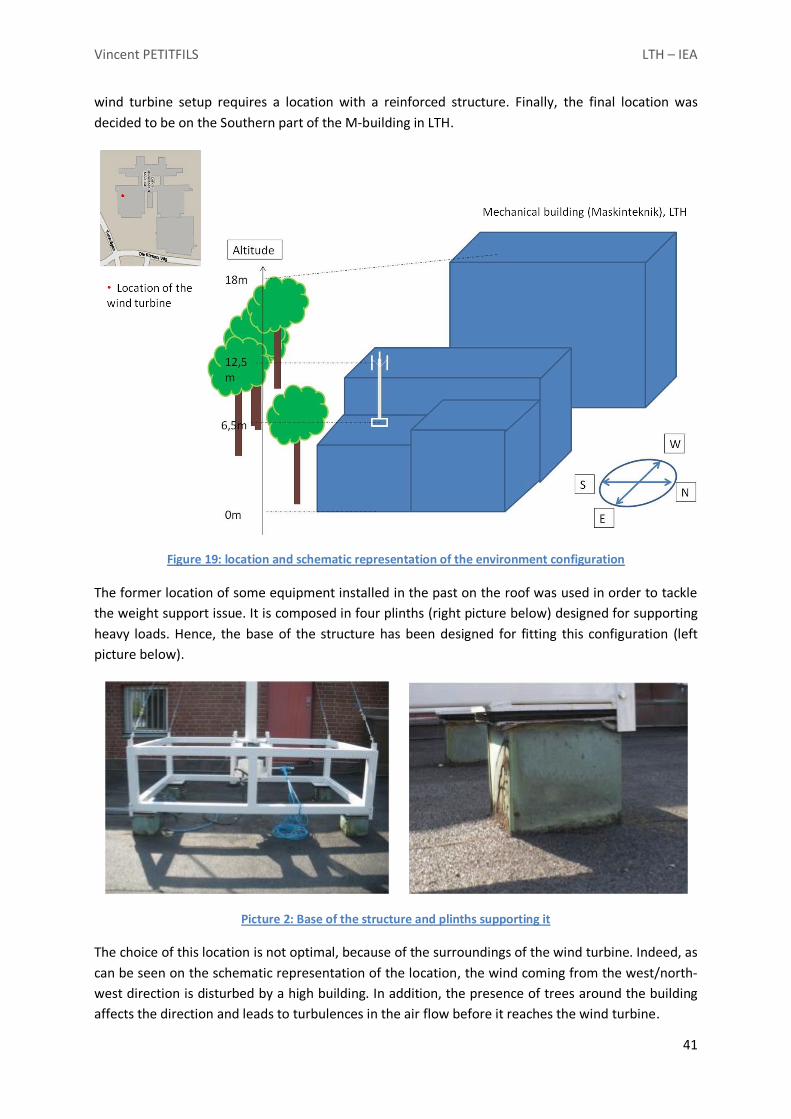
41
wind turbine setup requires a location with a reinforced structure. Finally, the final location was
decided to be on the Southern part of the M-building in LTH.
Figure 19: location and schematic representation of the environment configuration
The former location of some equipment installed in the past on the roof was used in order to tackle
the weight support issue. It is composed in four plinths (right picture below) designed for supporting
heavy loads. Hence, the base of the structure has been designed for fitting this configuration (left
picture below).
Picture 2: Base of the structure and plinths supporting it
The choice of this location is not optimal, because of the surroundings of the wind turbine. Indeed, as
can be seen on the schematic representation of the location, the wind coming from the west/north-
west direction is disturbed by a high building. In addition, the presence of trees around the building
affects the direction and leads to turbulences in the air flow before it reaches the wind turbine.
Vincent PETITFILS LTH – IEA
42
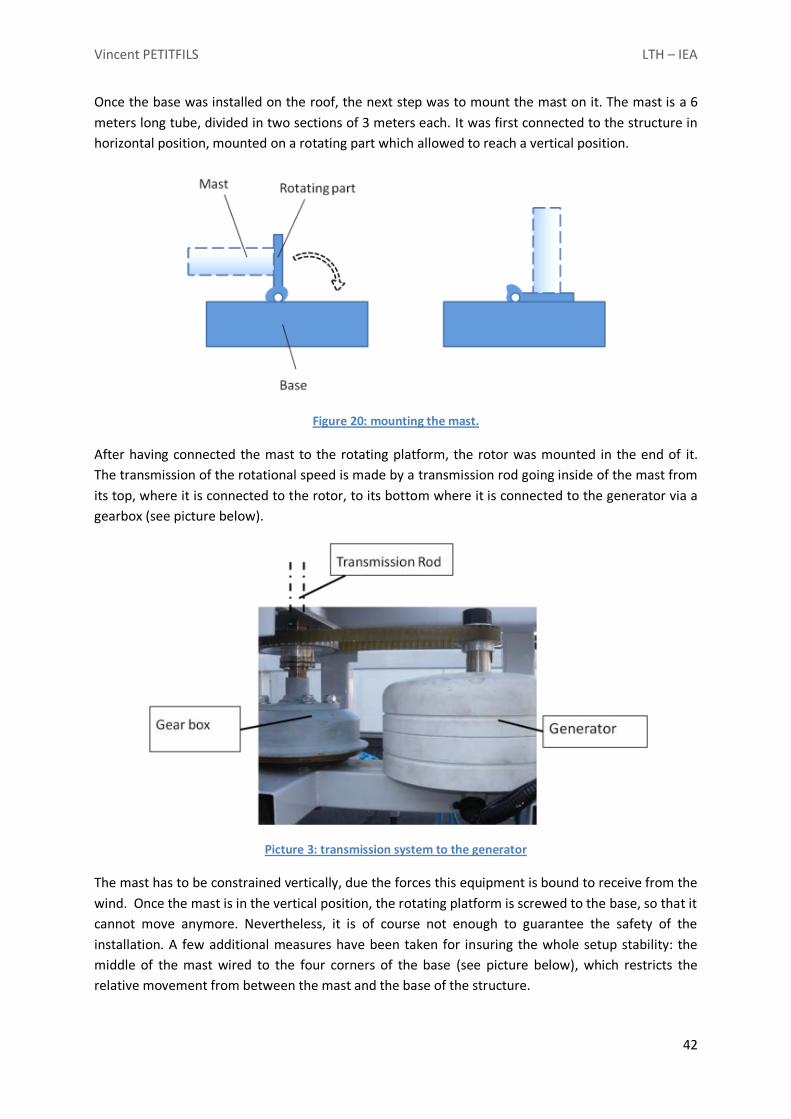
Once the base was installed on the roof, the next step was to mount the mast on it. The mast is a 6
meters long tube, divided in two sections of 3 meters each. It was first connected to the structure in
horizontal position, mounted on a rotating part which allowed to reach a vertical position.
Figure 20: mounting the mast.
After having connected the mast to the rotating platform, the rotor was mounted in the end of it.
The transmission of the rotational speed is made by a transmission rod going inside of the mast from
its top, where it is connected to the rotor, to its bottom where it is connected to the generator via a
gearbox (see picture below).
Picture 3: transmission system to the generator
The mast has to be constrained vertically, due the forces this equipment is bound to receive from the
wind. Once the mast is in the vertical position, the rotating platform is screwed to the base, so that it
cannot move anymore. Nevertheless, it is of course not enough to guarantee the safety of the
installation. A few additional measures have been taken for insuring the whole setup stability: the
middle of the mast wired to the four corners of the base (see picture below), which restricts the
relative movement from between the mast and the base of the structure.
Vincent PETITFILS LTH – IEA
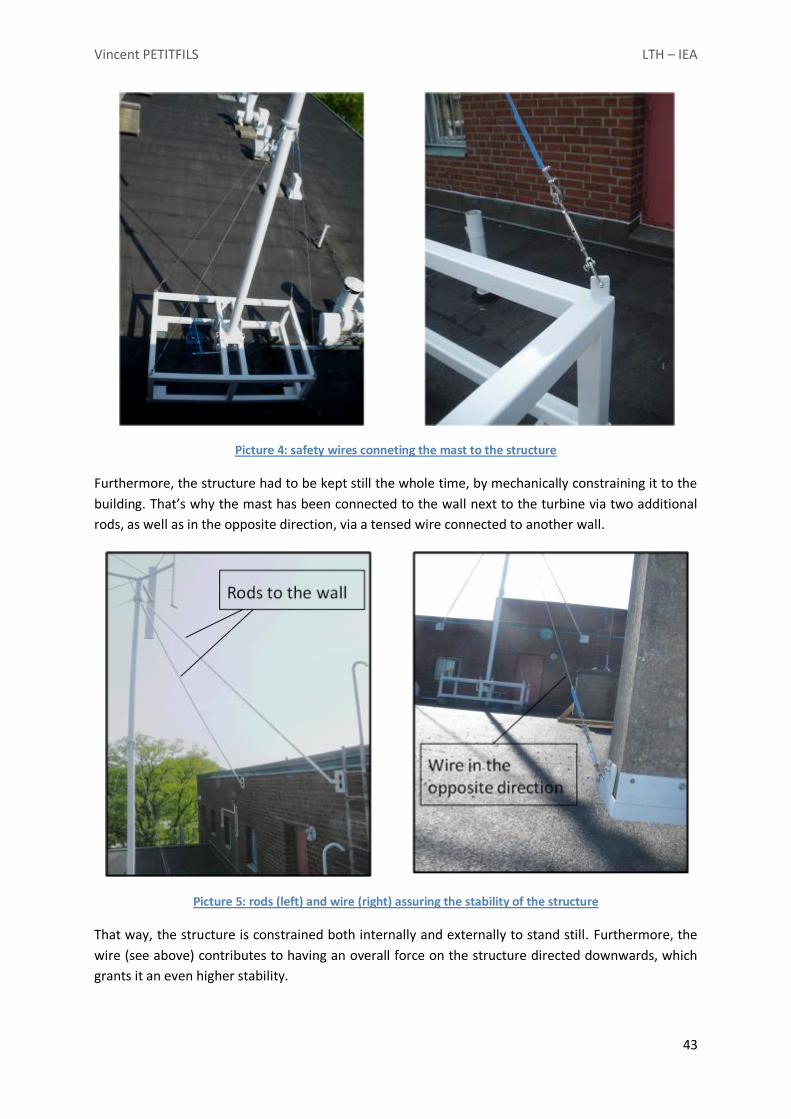
43
Picture 4: safety wires conneting the mast to the structure
Furthermore, the structure had to be kept still the whole time, by mechanically constraining it to the
building. That’s why the mast has been connected to the wall next to the turbine via two additional
rods, as well as in the opposite direction, via a tensed wire connected to another wall.
Picture 5: rods (left) and wire (right) assuring the stability of the structure
That way, the structure is constrained both internally and externally to stand still. Furthermore, the
wire (see above) contributes to having an overall force on the structure directed downwards, which
grants it an even higher stability.

Vincent PETITFILS LTH – IEA
44
o The measurement equipment
A measurement system is required for the performance testing. It has to collect the wind speed, the
wind direction and the atmospheric conditions.
General requirements
The measurement of the wind speed is both important for safety reasons and for the performance
test itself. As explained before, the kinetic energy coming from the wind has a cubic dependency on
the wind speed. Hence, sensors with a good accuracy were needed for this test. The wind speed is
measured by the MAX40 anemometer, which has an accuracy of 0.1m/s. A wind vane is necessary as
well for measuring the direction of the wind, and see if it affects the performances of the turbine.
The atmospheric conditions have to be monitored as well, because of their influence on the air flow
properties. One needs to know the atmospheric pressure and the temperature for having a correct
value of the air density.
Requirements on the location
The requirements on the accuracy of the wind measurements impose conditions on their installation
as well. Indeed, the wind speed that is measured should be as representative as possible of wind
which would have actually reached the rotor. As we want to minimize the impact due to the
presence of the rotor on the measurements, a previous study has to determine the dominant
direction of the wind over time. According to the International Electrotechnical Commission (IEC)
standards, an acceptable distance between the wind speed sensor and the center of the wind turbine
should be between two and four times the turbine diameter, and the optimal one is stated to be 2.5
times to rotor diameter. Furthermore, the anemometer should be placed in the same horizontal plan
as the center of the wind turbine.
The wind direction measurement is not as crucial as the wind speed one. However, an accurate
measurement still requires it to be as close as possible from the same horizontal plan as the center of
the turbine and the anemometer, and should be installed so that it doesn’t interfere with the wind
speed measurement at all. A casual solution could consist in having both sensors placed on the same
horizontal axis, perpendicular to the dominant wind direction).
The temperature and pressure sensors are much less sensitive than the wind sensors. Indeed, those
parameters vary very little in a few meters range, with mean they can be installed on the same mast
as the wind sensors, without any specific requirement, as long as they would not interfere with the
wind measurements.
o Choice of the equipment
Once the specifications and the design of the setup were defined, the next step was to find the
equipment fulfilling the requirements.
The company EKOPOWER was chosen for the whole measurement package, including anemometer,
wind vane, pressure and temperature sensors and a datalogger.
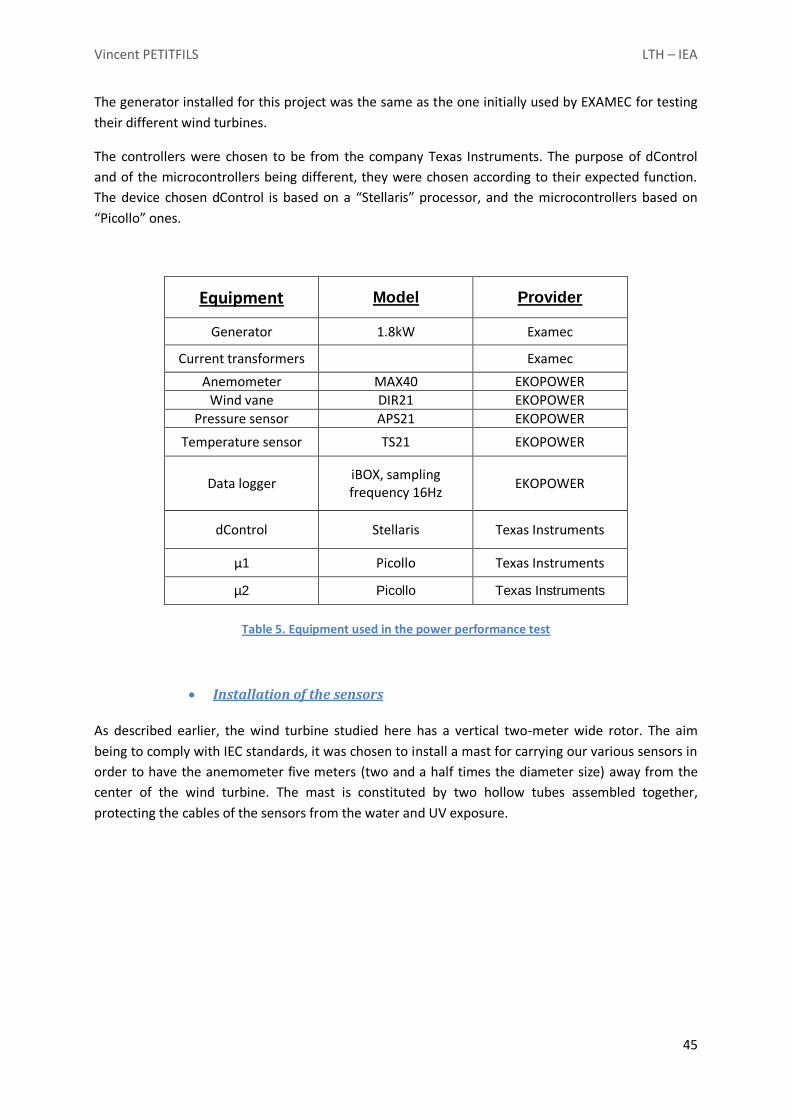
Vincent PETITFILS LTH – IEA
45
The generator installed for this project was the same as the one initially used by EXAMEC for testing
their different wind turbines.
The controllers were chosen to be from the company Texas Instruments. The purpose of dControl
and of the microcontrollers being different, they were chosen according to their expected function.
The device chosen dControl is based on a “Stellaris” processor, and the microcontrollers based on
“Picollo” ones.
Equipment Model Provider
Generator 1.8kW Examec
Current transformers Examec
Anemometer MAX40 EKOPOWER
Wind vane DIR21 EKOPOWER
Pressure sensor APS21 EKOPOWER
Temperature sensor TS21 EKOPOWER
Data logger iBOX, sampling frequency 16Hz
EKOPOWER
dControl Stellaris Texas Instruments
µ1 Picollo Texas Instruments
µ2 Picollo Texas Instruments
Table 5. Equipment used in the power performance test
Installation of the sensors
As described earlier, the wind turbine studied here has a vertical two-meter wide rotor. The aim
being to comply with IEC standards, it was chosen to install a mast for carrying our various sensors in
order to have the anemometer five meters (two and a half times the diameter size) away from the
center of the wind turbine. The mast is constituted by two hollow tubes assembled together,
protecting the cables of the sensors from the water and UV exposure.

Vincent PETITFILS LTH – IEA
46
Picture 6: mast and sensors
For practical reasons, the wind vane is slightly below the level of the anemometer. The distance is
around half a meter, and should not have any significant influence on the measurements. The cables
going out of the mast are connected to the data logger which collects all the information.
In our setup, the dominant direction of the wind is South-West, hence it was decided to install the
mast carrying the sensors in the South-West direction from the wind turbine.
Picture 7: relative positions of the wind turbine and the sensors
The anemometer is installed in the same plan as the center of the rotor, and the distance between
them is around 5 meters, which follows the IEA recommendations for this kind of setup.

Vincent PETITFILS LTH – IEA
47
Example of the data collected
The data is stored as a text file in the data logger. The frequency and the duration of the
measurement samples can be set directly in the logger. For each one of the sample, the average
voltage of the power supply, the minimum, maximum and average wind speeds, the standard
deviation of these measurements and the average temperature and pressure.
The analysis of the measurements shows that the wind can vary a lot during a day, and is always not
very steady: the following plot shows the variation of the wind over a day of July 2011. The maximum
and minimum values are the ones measured during each sample, meaning in this case in a 5 seconds
time span. By selecting for instance the peak in the following graph, it results that in a five seconds
interval the wind reached the maximum speed of almost 13m/s, but felt down to 4m/s. The average
value for this sample is around 8m/s. The problem of this kind of wind is that the wind turbine is not
constantly helped in its rotation. For accurate measurements, a more steady and regular wind is
required, the ideal being a perfectly laminar wind flow.
Figure 21 : wind evolution over a day
o Interface
A human/machine interface is needed for deciding the different control modes, as well as simply
starting or stopping the system. It was decided to have two different ways for the users to interact
with the wind turbine: using a control board or a computer as interface. For safety reason, the
priority is given to the orders coming from the board, so that in any case the user can manually
change the running mode or stop the turbine by switching manually between the different possible
selections.
0 500 1000 15000
2
4
6
8
10
12
14
Time (minutes)
Win
d s
peed (
m/s
)
average wind speed
Maximum wind speed
Minimum wind speed

Vincent PETITFILS LTH – IEA
48
The board consists in two buttons:
ON/OFF selection, switching on or off the power supply for the system
Mode selection:
o Quick stop
o Stop
o Start
o Idle
The commands from the computer are taken into account by the system only if the board is in the
“Idle” position. Then, the computer can select modes:
o Quick stop
o Stop
o Start: mode selection
o Cabinets for the electrical converters
A design for the electrical system has been prepared. Following the modularity solution chosen for
this setup, the equipment is divided into two cabinets.
The Cabinet A contains the electrical equipment in charge of the operation on the grid side. The
major difference between this cabinet and the other is that it contains an LCL filter in order to kill
unwished harmonics in the electrical signal. The front of cabinet B will carry the buttons described
earlier, giving the possibility to switch between different control modes and to start/stop the whole
setup. The cabinets are voluntarily designed for a power higher than the 1.8kW generated by the

Vincent PETITFILS LTH – IEA
49
turbine presented in this project, once more anticipating a possible expansion to additional power
sources.

Vincent PETITFILS LTH – IEA
50
Chapter 7: A first performance test: Connection to heaters
As the turbine had never been tested in outdoor environment, its behavior and properties (starting
speed, rotational speed of the rotor, etc) were only estimations.
In order to have a first glance over the actual features of the turbine, a first test was set up to
estimate roughly some properties of the turbine: it consists in connecting directly the wind turbine to
a resistive load in order to see how much raw power it can actually generate. It also allows to know
which wind speed the turbine needs for actually starting, its nominal rotation speed and other
important properties of it.
o Description of the setup
The equipment used for acting as a resistive load is a set of heaters. The advantage of this equipment
is that it can be used without any power control or regulation. It is not sensible to harmonics in the
current and is not damaged by fluctuations in the power produced by the wind turbine. Another
basic advantage of the choice of using heaters is that it is very easy to know if the wind turbine is
actually working without power monitoring because of the heat generated by the equipment.
Figure 22: schematic representation of the setup
The configuration chosen is composed by nine heaters (see scheme above). Each one of them has a
power around 200W when connected to the grid, so that when all the nine heaters are connected to
the wind turbine operating at nominal power, the maximum power of the turbine can be drawn.
Each phase is connected to three heaters. As the heaters are independent, it allows to adapt the load
to the situation. It can be seen as a manual regulation of the power. For instance, for low wind
speeds, the functioning of the turbine was tested by having only one heater per phase connected.
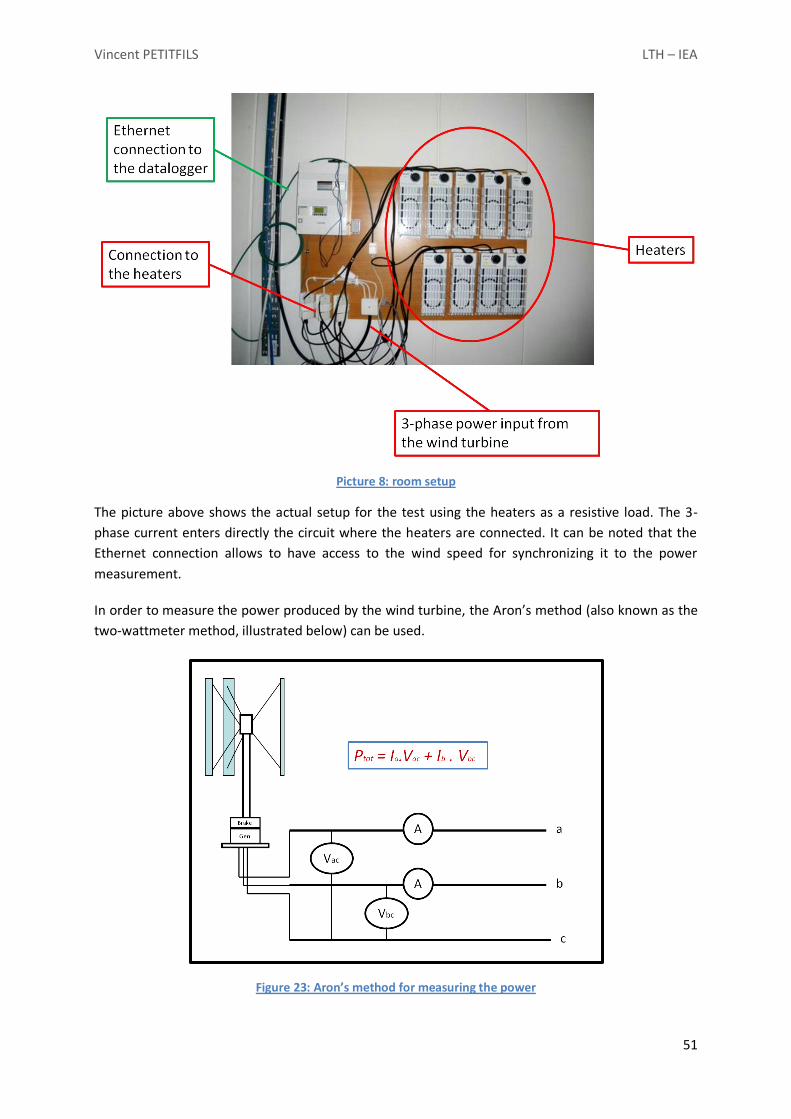
Vincent PETITFILS LTH – IEA
51
Picture 8: room setup
The picture above shows the actual setup for the test using the heaters as a resistive load. The 3-
phase current enters directly the circuit where the heaters are connected. It can be noted that the
Ethernet connection allows to have access to the wind speed for synchronizing it to the power
measurement.
In order to measure the power produced by the wind turbine, the Aron’s method (also known as the
two-wattmeter method, illustrated below) can be used.
Figure 23: Aron’s method for measuring the power

Vincent PETITFILS LTH – IEA
52
By measuring the current in two of the lines and the two voltages from those two lines with respect
to the third line, one can measure the total power produced by the wind turbine. The total power is
then given by the formula:
Ptot = Ia . Vac + Ib . Vbc
For implementing this method, two hall-effect current sensors and two voltmeters were connected
to a computer, using data acquisition (DAQ) software for collecting the data.

Vincent PETITFILS LTH – IEA
53
Chapter 8: Conclusions
o Summary of the project achievements
During this thesis work, numerous essential steps have been completed in the process leading to the
performance test of the wind turbine designed by EXAMEC.
The wind turbine is installed on the roof of the Mechanical Engineering building and
currently connected to the heaters.
The measurement system has been ordered, installed, tested and is ready to be used.
The control sequence is operational and has already been tested using Dymola.
The models for the main controller and the micro controllers were decided and can be
ordered.
A model able to simulate the behavior of a wind power setup such as the one presented in
this project has been developed under Dymola.
The cabinets in charge of the electrical part of the setup were designed and ordered, but had
not arrived at the end of the project period.
o Guidelines for future work
Equipment
The future work necessary for carrying out the performance test of this wind turbine includes the
installation and acquisition of some equipment.
The safety aspects have to be dealt with: in addition to the one on the cabinet, one emergency stop
button next to the turbine and an additional one next to the future location of the control computer
have to be installed. An automatic solution for controlling the mechanical brake of the wind turbine
has to be designed and installed. This is also necessary for having a remote control over the brake.
The installation of a webcam in order to watch remotely the wind turbine remains to be done. The
mast used for supporting the measurement equipment can be used for this purpose.
The cabinets will have to be installed in the command room and connected both to the grid and the
turbine.
The controllers remain to be ordered and programmed. Depending on their exact operating details,
some minor modifications in the main control code are to be expected. The code for the micro-
controllers has to be adapted to a modular solution as well.

Vincent PETITFILS LTH – IEA
54
Performance tests
The limited amount of time and the absence of wind during the period dedicated to the
measurements did not permit the first performance test (connected to heaters) to be performed.
However, the setup is ready to be used.
Later on, after the equipment mentioned above is installed, two more different performance tests
can be carried out: as the electrical part is not optimized for this very wind turbine, one can expect it
to affect the overall efficiency of the setup. It is hence recommended to carry out not only a test
based on the power sent to the grid but also a test on the power available before entering the
electrical part.

Vincent PETITFILS LTH – IEA
55
Appendix A
List of the commands/signals:
- START: the START button was pushed
- STOP: the STOP button has been pushed (initiates the shutdown procedure)
- QUICK STOP: initiates the quick shutdown procedure
- OFF: the OFF button switches off all the devices (to be pressed after STOP)
- µ1OK: µcontroller 1 operational
- µ2OK: µcontroller 2 operational
- µ2ready: voltage reached on the DC side (700V)
- µ1ready: µcontroller 1 working according to the mode selection
- em_errorsX: emergency buttons (X=1,2 or 3): 1=near the operator, 2=near the cabinets,
3=near the wind turbine.
- Windspeedsafe: wind speed <14m/s
- mb_closed: the mechanical brake is on and immobilizes the wind turbine
- low_Wind: no power produced because of a low wind
- releasebrake: release the mechanical brake
- shutdown: normal shutdown procedure(sent to the µcontrollers)
- shutdownwind: shutdown procedure due to high wind speed (sent only to µ1)
- TurbineSpeedOK: internal message from dControl, reached when the turbine speed is hig
enough
- error: global signal if any error occurs in the system (emergency or not)
List of the sensors:
- torque measurement
- rotor speed measurement
- wind speed measurement
- temperature measurement
- pressure measurement
- webcam (?)
- vibration security signal
- rotor speed security signal
- emergency stop buttons 1, 2 and 3
- errors
- state of the mechanical brake
- current/voltage on the different measurement points

Vincent PETITFILS LTH – IEA
56
References
Books and articles:
Wind power in power systems (2005), Thomas Ackermann
World Geothermal Generation in 2007, Ruggero Bertani, ENEL – International Division – Renewable
Energy Business Development
Active Distributed Power Systems (2006), Functional Structures for Real-Time Operation of
sustainable Energy Systems, Jörgen Svensson, LTH – IEA Department
Wind Energy Handbook, Tony Burton, Nick Jenkins, David Sharpe & Ervin Bossanyi
Optimal rotor tip speed ratio (2011), Dr. M. Raghed
Internet sources:
BP Website: http://www.bp.com/sectionbodycopy.do?categoryId=7500&contentId=7068481
http://www.powerscorecard.org/tech_detail.cfm?resource_id=1
http://www.biomassenergycentre.org.uk/
http://www.eia.gov/cneaf/solar.renewables/page/biomass/biomass.html
http://www1.eere.energy.gov/solar/csp_program.html