Setting New Standards for Local Government - Dallasdallascityhall.com/government/Council Meeting...
20
Transcript of Setting New Standards for Local Government - Dallasdallascityhall.com/government/Council Meeting...

DALLAS Center for Performance Excellence (CPE) Setting New Standards for Local Government
Lean Six Sigma Initiative
City Council Briefing Wednesday, January 7, 2015

City Manager
Assistant City Manager
Working Group
Public-Private Advisory Board
DALLAS Center for
Performance Excellence
Sunset Reviews
Strategic
Planning/Business
Planning/Performance
Metrics/Baldrige
Framework
Quality Management
Systems
(ISO9001)
Strategic Partners
City University
Auditor’s Standards Integration
Department Professional Accreditations
EMS ISO 14001 & OHSAS 18001
Internal/ External Communication
Plans
Business Intelligence/ Performance Analytics/311
Lean Six Sigma
Comprehensive Planning
Continuity of Operations Plans
(COOP)
Collaborative
Direct
RELATIONSHIP TO CPE
2
Lean Six Sigma: A Component of the CPE

Lean Six Sigma: What is it?
3
A combination of two disciplined, data-driven
approaches and methodologies for improving
performance:
• Lean Enterprise:
Developed by Toyota Motor Company as the Toyota
Production System in the 1950’s
• Six Sigma:
Developed by Motorola in the 1980’s
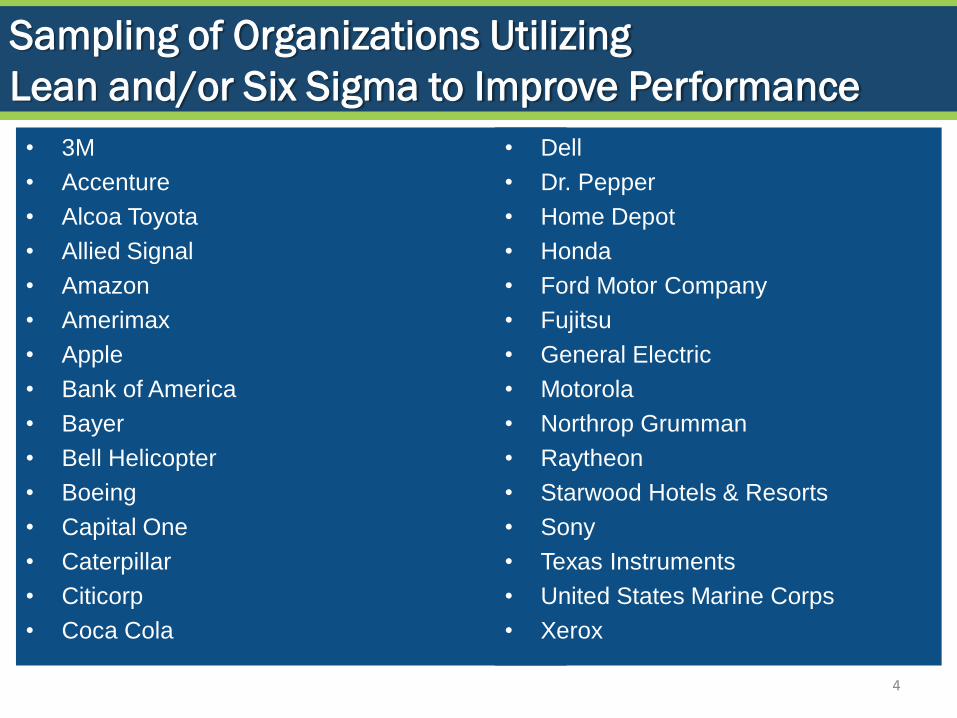
Sampling of Organizations Utilizing
Lean and/or Six Sigma to Improve Performance
• 3M
• Accenture
• Alcoa Toyota
• Allied Signal
• Amazon
• Amerimax
• Apple
• Bank of America
• Bayer
• Bell Helicopter
• Boeing
• Capital One
• Caterpillar
• Citicorp
• Coca Cola
4
• Dell
• Dr. Pepper
• Home Depot
• Honda
• Ford Motor Company
• Fujitsu
• General Electric
• Motorola
• Northrop Grumman
• Raytheon
• Starwood Hotels & Resorts
• Sony
• Texas Instruments
• United States Marine Corps
• Xerox

Focus Comparison
5
Specify Value
Understand Demand
Flow
Level
Perfection
Improved efficiency and speed
Define
Measure
Analyze
Improve
Control
Improved effectiveness
Lean – focuses on dramatically improving flow in the
value stream and eliminating waste
Six Sigma – focuses on eliminating undesired results
and reducing variation in processes

Process Comparison
6

Six Sigma: Statistically Visualized
7
Source:

8
In other words,
a measure of
quality that
strives for near
zero defects.
Achieving Six Sigma
*Defects per million opportunities
Sigma Level DPMO % Defective % Yield 1 691,462 69% 31% 2 308,538 31% 69% 3 66,807 6.7% 93.3% 4 6,210 .62% 99.38% 5 233 .023% 99.977% 6 3.4 .00034% 99.99966%
A statistical representation

Six Sigma: 8 Areas of Waste
9

Sampling - Lean Six Sigma Analysis Methods
• Descriptive Statistics
• Pareto Charts
• Graphing
• Regression Analysis
• Capability Analysis
• Process Mapping
• Value Stream Mapping
• Fish Bone Diagram
• Spaghetti Diagram
• XY Summary
• TAKT Time and Cycle Time
• Visual Management 10
8070605040302010
USL
LSL *
Target *
U SL 10
Sample Mean 61.3
Sample N 40
S tDev (Within) 11.1355
S tDev (O v erall) 11.0644
P rocess Data
Z.Bench -4.61
Z.LSL *
Z.U SL -4.61
C pk -1.54
Z.Bench -4.64
Z.LSL *
Z.U SL -4.64
Ppk -1.55
C pm *
O v erall C apability
Potential (Within) C apability
PPM < LSL *
PPM > U SL 1000000.00
PPM Total 1000000.00
O bserv ed Performance
PPM < LSL *
PPM > U SL 999997.96
PPM Total 999997.96
Exp. Within Performance
PPM < LSL *
PPM > U SL 999998.23
PPM Total 999998.23
Exp. O v erall P erformance
Within
Overall
Process Capability of DAYS ELAPSED
From:
To:
Supervisor
Cam McCabe
Takt Time Cycle Time Operator Number
Prepared By
Judy M
Quality Check Safety Precaution Standard WIP Units STD WIP
Dept/Location
Municipal Court
Team Leader
Judy M
Standard Work
Chart
12/2/2009
12/2/2009
Date Prepared
12/9/2009
1
1451291139781654933171
90
80
70
60
50
40
30
20
10
0
Observation
Ind
ivid
ua
l V
alu
e
_X=15.2
UCL=34.4
LCL=-4.1
Baseline ProjectBaseline Project Improvement
11
1
1
1
1
1
1
1
1111
1
11
11
I Chart of DAYS ELAPSED Project Progress
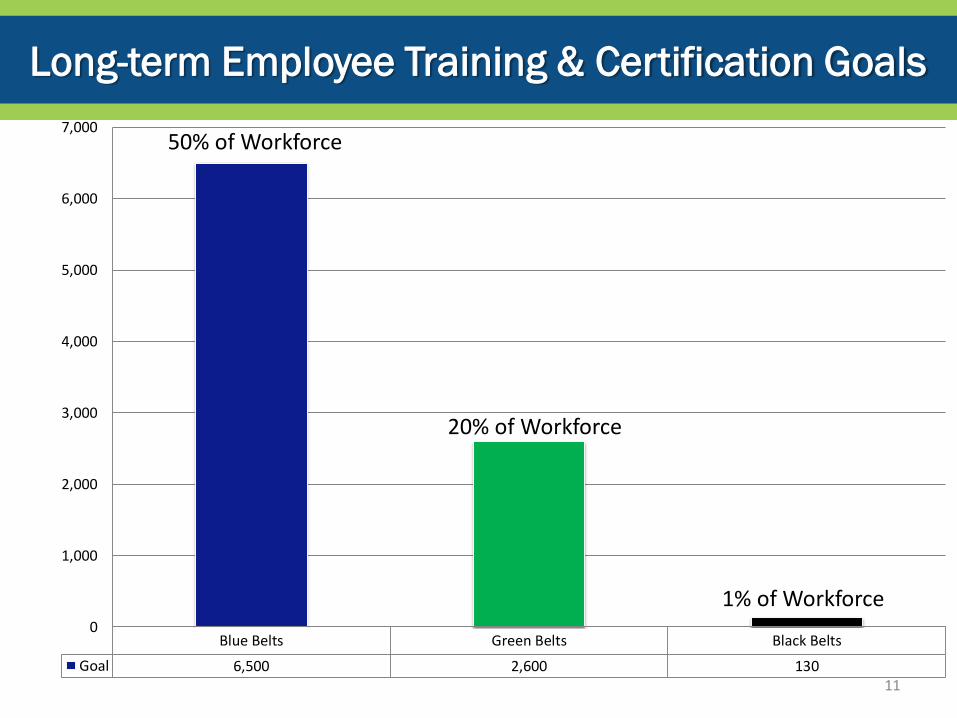
Long-term Employee Training & Certification Goals
11
Blue Belts Green Belts Black Belts
Goal 6,500 2,600 130
0
1,000
2,000
3,000
4,000
5,000
6,000
7,000
1% of Workforce
50% of Workforce
20% of Workforce
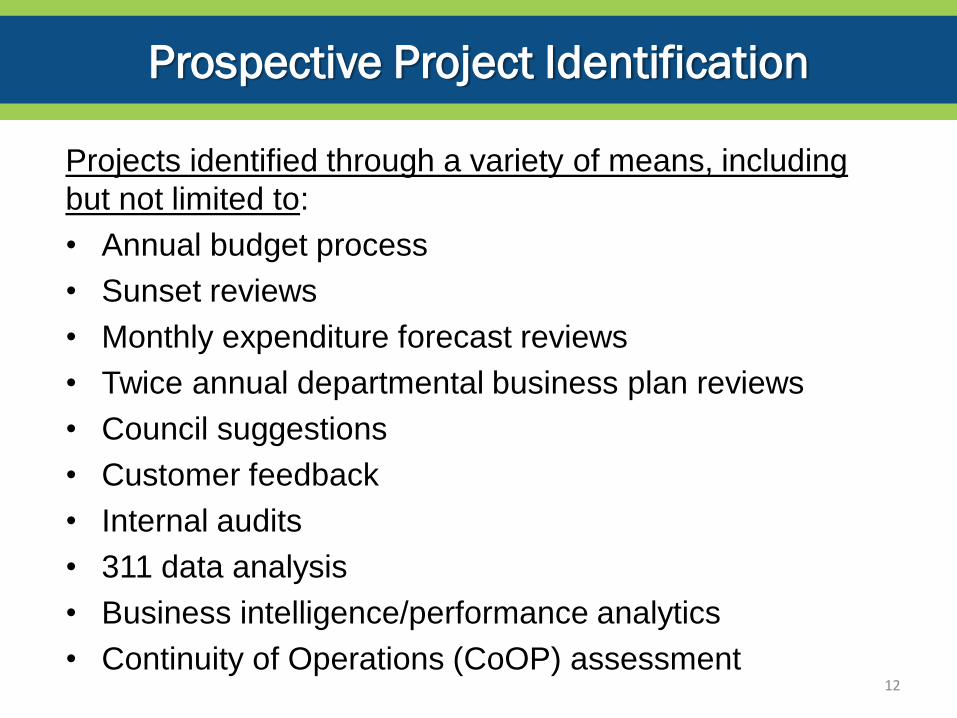
Prospective Project Identification
Projects identified through a variety of means, including
but not limited to:
• Annual budget process
• Sunset reviews
• Monthly expenditure forecast reviews
• Twice annual departmental business plan reviews
• Council suggestions
• Customer feedback
• Internal audits
• 311 data analysis
• Business intelligence/performance analytics
• Continuity of Operations (CoOP) assessment
12
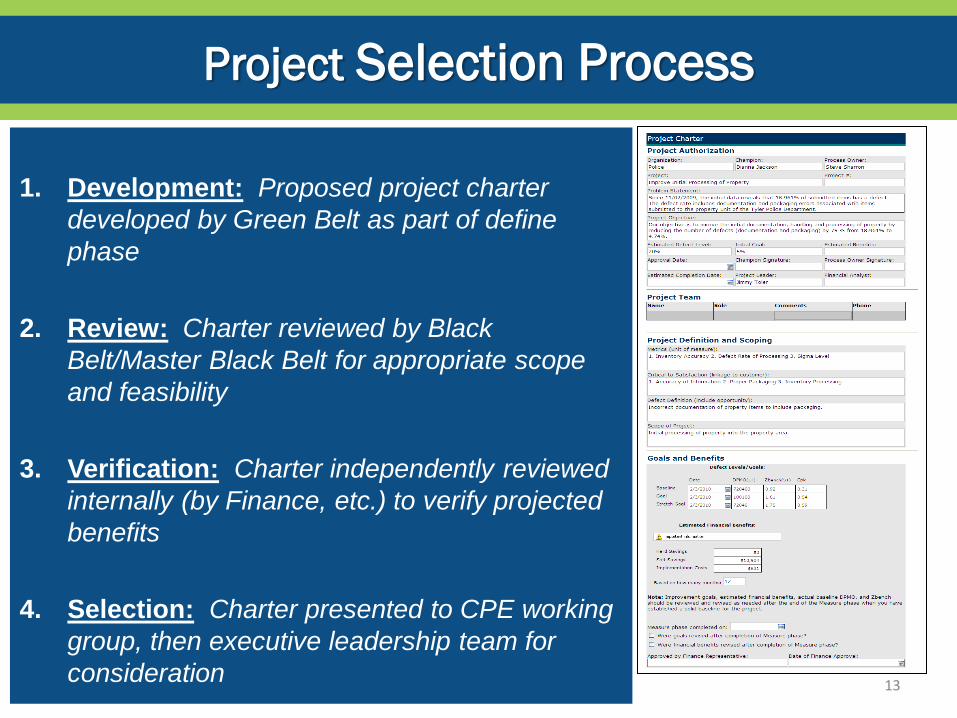
Project Selection Process
1. Development: Proposed project charter
developed by Green Belt as part of define
phase
2. Review: Charter reviewed by Black
Belt/Master Black Belt for appropriate scope
and feasibility
3. Verification: Charter independently reviewed
internally (by Finance, etc.) to verify projected
benefits
4. Selection: Charter presented to CPE working
group, then executive leadership team for
consideration
13
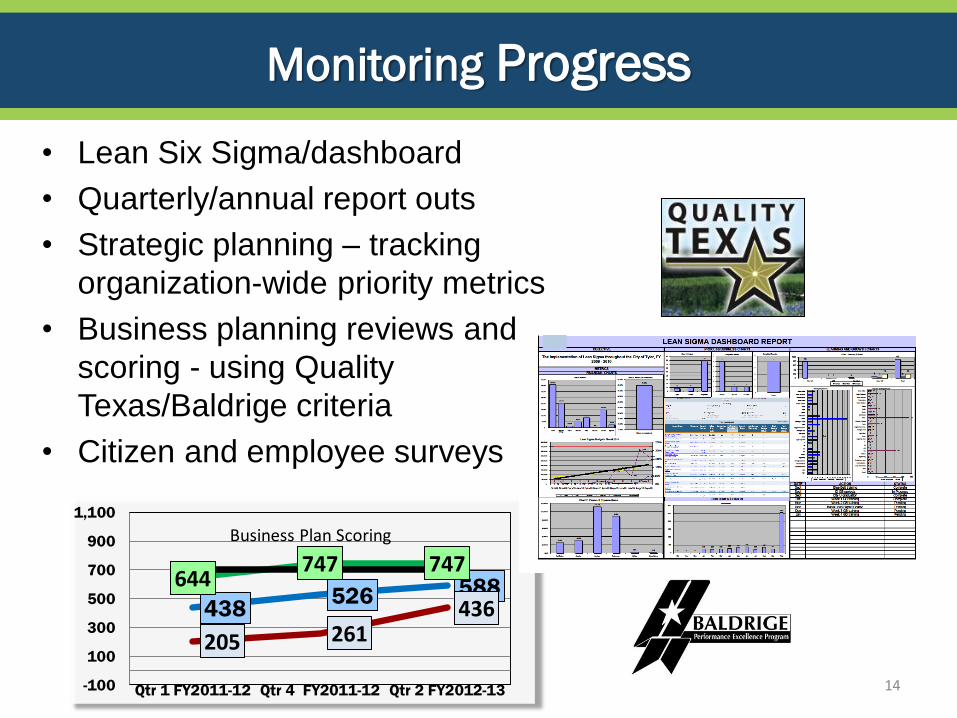
Monitoring Progress
• Lean Six Sigma/dashboard
• Quarterly/annual report outs
• Strategic planning – tracking
organization-wide priority metrics
• Business planning reviews and
scoring - using Quality
Texas/Baldrige criteria
• Citizen and employee surveys
14
438 526 588
205 261 436
644 747 747
-100
100
300
500
700
900
1,100
Qtr 1 FY2011-12 Qtr 4 FY2011-12 Qtr 2 FY2012-13
Business Plan Scoring

• Development Services – reduced time for residential
plan review
• Fire – Implemented in-house total predictive
maintenance program for protective gear
• HR – Improved employee requisition process
• Library – Reduced time to reshelf existing books, and
time from purchase to shelf for new books
• Library – Optimized hours open
• Municipal Court – Condensed warrant process time
• Parks – Improved work order system
• Parks – Reduced time required to chalk ball fields
• Police – Increased time on street by reducing time to
issue daily equipment from armory
15
Project Examples from Other Cities

• Police – Reduced dispatcher attrition rate
• Sanitation – Extended life of tires on heavy trucks
• Sanitation – Reduced missed collections
• Sanitation & Fleet – Reduced residential truck
hydraulic maintenance costs
• Sanitation & Streets - Reduced costs associated with
brush disposal
• Utility Billing - Improved billing process
• Warehouse – Reduced inventory costs
• Water – Optimized magnesium dosage, reducing cost
for chemicals
• Water – Reduced inventory cost in water meter shop
16
Project Examples from Other Cities
Applying Lessons Learned from Others
• It is a marathon, not a sprint
• Participants need to work in their own areas so
projects are considered part of their current job
• Senior managers must actively steer, while
participants push for progress from organizational
layers
• The optimum ratio of Green Belts to Black Belts is
critical to mentoring and successful project completion
• The indirect benefits are even greater than the
direct benefits 17
Indirect Benefits – Not Just About Saving $$$
• Enhanced Responsiveness for Citizens/Customers
• Increased Capacity of Existing Workforce (Saving Time)
• Improved Organizational Communications
• Employee Empowerment + Job Enrichment = Motivated
Workforce
• Opportunity to Differentiate Ourselves in a Positive Way
18
Next Steps for Deployment
• Using existing resources, hire Master Black Belt –
January, 2015
• Recruit and begin in-house training of up to 50 Green
Belts from all levels of the organization in various
departments – February/March, 2015
• Progress report to City Council – May, 2015
19