Setting boundaries between business planning and ...
28
Setting boundaries between business planning and operations management Valentijn de Leeuw Vice President ARC Advisory Group Hannover Messe, 6. MES Tagung, 10 April 2014 Update of the 2012 MESA World Conference Presentation 13-14 September, Coventry, United Kingdom
Transcript of Setting boundaries between business planning and ...

Setting boundaries between
business planning and operations management
Valentijn de Leeuw Vice President
ARC Advisory Group
Hannover Messe, 6. MES Tagung, 10 April 2014 Update of the 2012 MESA World Conference Presentation
13-14 September, Coventry, United Kingdom

2 © ARC Advisory Group
Acknowledgement
t Thanks to: • Jean Vieille for his participation • Michel Devos MES Consult, MESA board member,
for his constructive review • Mike James ATS Global, MESA Chairman, for
spotting the opportunity • Udo Enste for spotting the speaking slot

3 © ARC Advisory Group
Setting boundaries
t Understood, but how to go about this? • How to best set the boundaries • How to handle the interface
• How often? which detail? upward? downward? …

4 © ARC Advisory Group
Syntax
t ISA 95 terms: Business Planning and Operations Management, defined as domains
ANSI/ISA-95.00.03-2005 - 20 -
Level 4
Level 1
Level 2
Level 3
Business Planning & Logistics
Plant Production Scheduling,Operational Management, etc
Manufacturing Operations Management
Dispatching Production, Detailed ProductionScheduling, Reliability Assurance, ...
BatchControl
DiscreteControl
ContinuousControl
1 - Sensing the production process, manipulating the production process
2 - Monitoring, supervisory control and automated control of the production process
Time FrameHours, minutes, seconds, subseconds
3 - Work flow / recipe control to produce the desired end products. Maintaining records and optimizing the production process.
Time FrameDays, Shifts, hours, minutes, seconds
4 - Establishing the basic plant schedule -production, material use, delivery, and shipping. Determining inventory levels.
Time FrameMonths, weeks, days
Level 0 0 - The actual production process
Figure 2 - Multi-level functional hierarchy of activities
4.3 Manufacturing operations management elements
The shaded areas in Figure 1 represent the manufacturing operations management activities modeled in this Part 3 standard. Manufacturing operations management is the collection of production operations management, maintenance operations management, quality operations management, inventory operations management, and other activities of a manufacturing facility.
Four formal models are defined: production operations management, maintenance operations management, quality operations management, and inventory operations management.
a) The production operations management model includes the activities of production control (3.0) that operate as Level 3 functions and the subset of the production scheduling (2.0) that operate as Level 3 functions and as shown in Figure 1.
b) The maintenance operations management model includes the activities of maintenance management (10.0) that operate as Level 3 functions.
c) The quality operations management model includes the activities of quality assurance (6.0) that operate as Level 3 functions.
d) The inventory operations management model includes the activities of management of inventory and material including product inventory control (7.0) and material & energy control activities (4.0) defined as operating as Level 3 functions and as shown in Figure 1.
Other categories of operation management may exist depending on company policy or organization. They are not formally modeled in this Part 3 standard, but they can make use of the generic standard model.
4.4 Criteria for defining activities below Level 4
In this Part 3 standard an activity is included as a Level 3, 2, or 1 activity if the activity is directly involved in manufacturing, includes information about personnel, equipment, or material, and meets any of the following conditions:
a) The activity is critical to plant safety.
Copyright 2005 ISA. All rights reserved.

5 © ARC Advisory Group
Functions, domains and applications
t BP (and OM) applications overlap BP and OM domains
t ISA-95 functions are distributed over BP and OM applications
OM App
EAM app ERP app LIMS P&S app BP Domain
OM Domain
ISA 95 function

6 © ARC Advisory Group
A best practice study
t We studied user practices • Application and function repartition • IT delivery (sourcing, customization, ..) • Systemic coupling (granularity, master data, ..)
t and performance indicators • IT delivery (% fulfillment, time, satisfaction of repartition) • IT costs (Capex and Opex) • Business impact (Ops, Maintenance, ..)
t IT Costs could be in both categories.. • We tried both, hold on…

7 © ARC Advisory Group
Best practice methodology
t Ten users interviewed • Several industry sectors
t Ranked the results by user • Performance categories: leaders,
competitors and followers
t In trying different objective functions, we found that the BP-OM boundary moves! • IT delivery performance and costs • IT delivery performance • IT delivery, IT costs, business impact • Business Impact
0"
10"
20"
30"
40"
50"
60"
70"
80"
Global"performance"index"
leaders"
compe;tors"
followers"

8 © ARC Advisory Group
!5.0%
15.0%
35.0%
55.0%
75.0%
95.0%
0.3% 0.4% 0.5% 0.6% 0.7% 0.8%
Number%of%providers%
%%Customiza?on%
%%Requirement%%challenge%%%
Quality%boundary%
%%fulfillment%
Rel.%Fullfillment%speed%
Ops%and%Mnt%performance%
Rela?ve%Capex%performance%
Rela?ve%OpEx%performance%
Performance versus “production boundary”
• X-axis: production boundary: -1=all functions in BP, +1 = all in OM
• Y-axis: Performance indicators • Call-outs: % functions
implemented in OM for 4 objective functions – 1. IT Performance and cost
65% – 2. IT Performance 75% – 3. Business Case 84% – 4. Business performance 89%
1 2 34

9 © ARC Advisory Group
!5.0%
15.0%
35.0%
55.0%
75.0%
95.0%
0.3% 0.4% 0.5% 0.6% 0.7% 0.8%
Number%of%providers%
%%Customiza?on%
%%Requirement%%challenge%%%
Quality%boundary%
%%fulfillment%
Rel.%Fullfillment%speed%
Ops%and%Mnt%performance%
Rela?ve%Capex%performance%
Rela?ve%OpEx%performance%
“Business case” is an interesting compromise
t Benefits almost at maximum
t Costs have not run a way yet
t IT resists customizing
t Number of providers drops
t Implementation speed is at optimum
t % fulfillment starts decreasing but benefits continue to increase

10 © ARC Advisory Group
!1.0% !0.6% !0.2% 0.2% 0.6% 1.0%
Inventory%boundary%
Maintenance%%boundary%
Quality%boundary%
Produc:on%boundary%
Followers%
Compe:tors%
Leaders%
Boundaries by ‘pillar’
t Leaders implement more functions in the OM application
t Leaders have less OM-BP overlap
Function Distribution
Degree of Overlap of BP applications over the OM Domain
8"
22"
15"
leaders"
compe0tors"
followers"
0" 5" 10" 15" 20" 25"

11 © ARC Advisory Group
And by function J
0%# 50%# 100%#
Defini+on#management#
Resource#management#
Detail#scheduling#
Dispatching#
Execu+on#management#
Data#collec+on#
Tracking#
Performance#analysis#
0%# 50%# 100%# 0%# 50%# 100%#
%#Mixed#
%#BP#
%#OM#
%#N/A#
0%# 50%# 100%#
Defini+on#management#
Resource#management#
Detail#scheduling#
Dispatching#
Execu+on#management#
Data#collec+on#
Tracking#
Performance#analysis#
0%# 50%# 100%# 0%# 50%# 100%#
%#Mixed#
%#BP#
%#OM#
%#N/A#
0%# 50%# 100%#
Defini+on#management#
Resource#management#
Detail#scheduling#
Dispatching#
Execu+on#management#
Data#collec+on#
Tracking#
Performance#analysis#
0%# 50%# 100%# 0%# 50%# 100%#
%#Mixed#
%#BP#
%#OM#
%#N/A#
0%# 50%# 100%#
%#Mixed#
%#BP#
%#OM#
%#N/A#
0%# 50%# 100%#
%#Mixed#
%#BP#
%#OM#
%#N/A#
0%# 50%# 100%#
%#Mixed#
%#BP#
%#OM#
%#N/A#

12 © ARC Advisory Group
Application landscape
t Time criticality (unavailability in hours before production stop) • MTTR / buffering needs
to be in line with criticality
t Degree of customization of BP and OM applications
4"
18"
61"
55"
40"
47"
leaders"
compe3tors"
followers"
0" 50" 100" 150"
Custom"BP"
Custom"OM"
16#
112#
19#
4#
3#
3#
leaders#
compe2tors#
followers#
0# 50# 100# 150#
Time#cri2cality#OM#
Time#cri2cality#BP#

13 © ARC Advisory Group
* Sourcing
t Mostly off-the shelf, commercial software • Need to ask in next round how custom solutions
are managed for cost and value, and what the trend is (diminishes as far as we know)
Sourcing of BP Applications
0"
0"
25"
100"
100"
75"
leaders"
compe1tors"
followers"
0%" 20%" 40%" 60%" 80%" 100%"
BP";"Custom"";"Home"made"or"externalized"
BP";"Open"source";"Commercial"
BP";"Proprietary";"CommerciaL"
BP";"Open"source";"Free" 27#
0#
26#
68#
100#
74#
leaders#
compe3tors#
followers#
0%# 20%# 40%# 60%# 80%# 100%#
OM#:#Custom##:#Home#made#or#externalized#
OM#:#Open#source#:#Commercial#
OM#:#Proprietary#:#CommerciaL#
OM#:#Open#source#:#Free#
Sourcing of OM Applications

14 © ARC Advisory Group
* Standard product and functionality?
t Leaders have less providers t Leaders ‘challenge’ less and customize
more • Business requirements have more priority?
Number of Application Providers
0" 1" 2" 3" 4" 5" 6" 7" 8" 9"
leaders"
compe6tors"
followers"
Requirement Challenge Compared with Degree of Customization
0"
10"
20"
30"
40"
50"
60"
leaders" compe3tors" followers"
%"Customiza3on"
%"Requirement""challenge"""

15 © ARC Advisory Group
* Criteria for setting boundaries
t Leaders have the most balanced criteria (‘business case’)
t Competitors are more technically oriented
t Followers have more organizational emphasis
t Next round: should ask for ROI and financial criteria
Criteria For Setting the Boundary Between BP and OM Applications
0" 20" 40" 60" 80" 100"
leaders"
compe2tors"
followers"
Poli2cs"
Policy""
SLA"fit""""
Organisa2onal"fit"""
Func2onal"fit"""

16 © ARC Advisory Group
Systemic coupling
0.0#
0.1#
0.1#
0.2#
0.2#
0.3#
0.3#
Asynchronous#coupling#
leaders#
compe8tors#
followers#
t Legend: Granularity is inversely proportional to detail. • BP: order granularity, OM: material and resource reporting granularity
t Leaders’ production orders have slightly less detail • Production order detail inversely proportional to OM production functionality
t Production reporting is aggregated to similar levels t Very little master data synchronization between BP-OM
0.00#
0.20#
0.40#
0.60#
0.80#
1.00#
1.20#
1.40#
1.60#
1.80#
2.00#
BP#produc1on#granularity#
OM#produc1on#granularity#
Produc1on#granularity#ra1o#
Produc1on#boundary#
leaders#
compe1tors#
followers#
17 © ARC Advisory Group
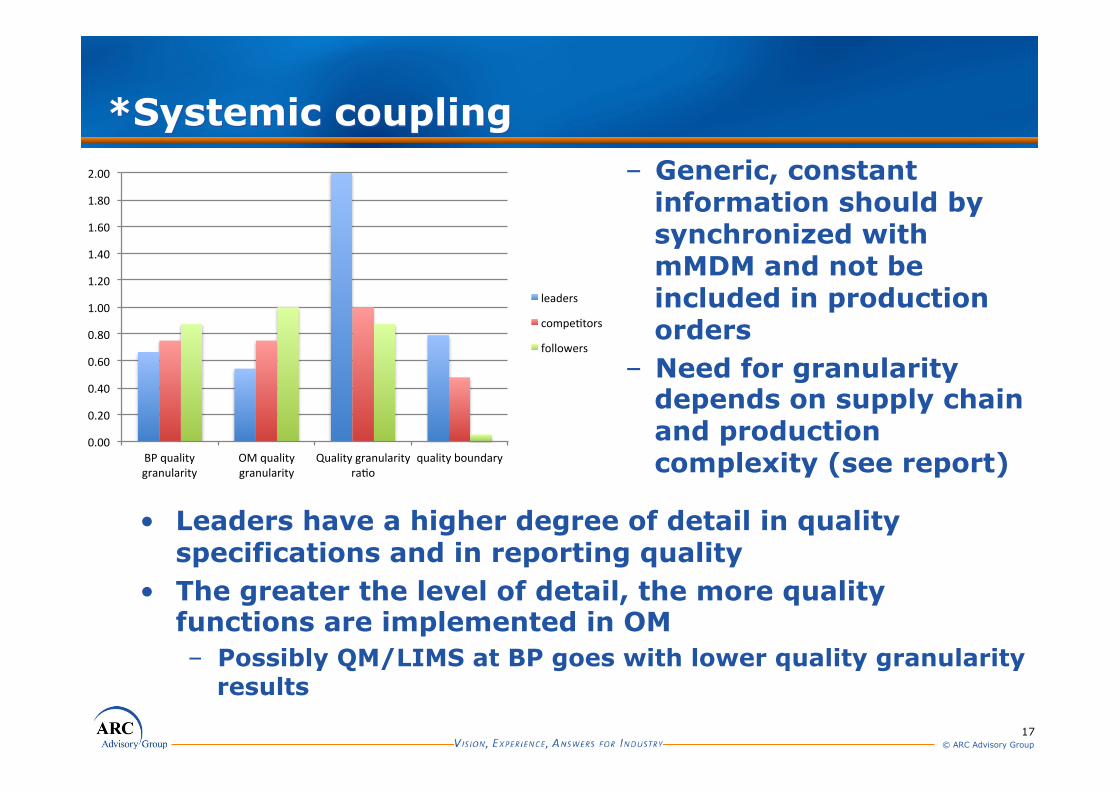
*Systemic coupling
• Leaders have a higher degree of detail in quality specifications and in reporting quality
• The greater the level of detail, the more quality functions are implemented in OM – Possibly QM/LIMS at BP goes with lower quality granularity
results
– Generic, constant information should by synchronized with mMDM and not be included in production orders
– Need for granularity depends on supply chain and production complexity (see report)
0.00#
0.20#
0.40#
0.60#
0.80#
1.00#
1.20#
1.40#
1.60#
1.80#
2.00#
BP#quality#granularity#
OM#quality#granularity#
Quality#granularity#ra8o#
quality#boundary#
leaders#
compe8tors#
followers#

18 © ARC Advisory Group
Satisfaction and IT cost
t Leaders implement fast but not all the user wants • Fulfillment includes scope, cost, quality and user
acceptance
t Leaders have lower upfront investment, and a reasonable operational cost
0"
20"
40"
60"
80"
100"
120"
Perfect"Fulfilment"(%)"
Fulfilment"Cycle"Time"(days)"
leaders"
compe@tors"
followers"
0.00#
0.20#
0.40#
0.60#
0.80#
1.00#
1.20#
1.40#
IT#CAPEX#%COGS#
IT#OPEX#%#COGS#
leaders#
compe>tors#
followers#

19 © ARC Advisory Group
Business impact
t Operations KPI’s impacted more than Maintenance
t Leaders emphasize responsiveness, followers reliability
0" 20" 40" 60" 80" 100"
leaders"
compe2tors"
followers"
Maintenance"cost"Maintenance"responsiveness"Opera2ons"Availability""Opera2ons"Cost"
Opera2ons"Responsiveness"Opera2ons"Reliability"

20 © ARC Advisory Group
* Impact on organization and development
t Impact is lower in absolute terms, but high considering the impact is very indirect
0" 20" 40" 60" 80" 100"
leaders"
compe2tors"
followers"Organiza2on"cost"
Organiza2on"responsiveness"
Engineering"cost"
Engineering"Responsiveness"
Product"development"Cost"
Product"development"Responsiveness"
Impact on Organization and Product Development
• Leaders mostly value impact on: – Engineering
responsiveness – Product
development responsiveness
– Organizational cost

21 © ARC Advisory Group
Conclusions t A balanced business case for an optimal cost/benefit
ratio t Leaders implement more production and quality
functions in OM, and use less providers t Customization/configuration is unavoidable for OM
• But % fulfillment does not need to be perfect for business impact • Leaders implement fast
t Time criticality of applications needs to be in line with availability, SLA and buffering, and supply chain
t Leaders’ production orders are more granular (subsidiarity)
t Manufacturing master data synchronization can improve • Could be designed according to ISA 88 / ISA 95
t Note: business performance is proportional to investment

22 © ARC Advisory Group
* Recommendations (1)
t Function repartition • Boundaries should be set based on strategy, not based on
existing functions implemented • Not: OM cover the blanks left over by BP • But: business case, including functional fit, usability, CAPEX
and OPEX and business benefits.
t IT delivery practices • Maximize configuration minimize coding
• Reducing implementation and maintenance costs • Rationalize number of providers • Choose providers with overall IT synergies

23 © ARC Advisory Group
* Recommendations (2)
t Systemic coupling: horses for courses • Master data synchronization
• In general very poor. Too much information is repeated. Order information must become more lean and master data retrieved to fill in. Information transferred should be unique to the order
• Granular versus coarse: depends on production and supply chain complexity • More granular -> BP is more critical, OM has more
functions, more demanding of bandwidth, link more critical (and vice versa). Complex production: granular orders are costly (changes) • For simple mixing or filling operations detail orders, and simple BP-
based OM functions maybe simplest • Leaders have more granular orders, more functions implemented in
OM (Next round: is this independent of supply chain complexity?

24 © ARC Advisory Group
* Recommendations (2)
t Systemic coupling: horses for courses • Generic versus specific: More generic if
resource types and products are more stable • More generic orders instantiated by OM -> Higher
effort at implementation and synchronization, lower network load, link is more robust to change (and vice versa)
• More specific if products are more unique and made on multi-purpose equipment, and vice versa
• Detail planning as high level as needed • BP level detail planning and scheduling required/
useful when production / supply chains are interlinked -> more complex scheduling, more demanding on network for synchronization of actual versus plan and rescheduling (and vice versa)

25 © ARC Advisory Group
* Recommendations (3)
t IT delivery performance and cost • Start with manageable pilots using configurable
tool, make iterations • Use value delivered as additional project KPI • Optimize processes before implementation • Implement BP and OM simultaneously • Make a master, institute change management
and customization control, roll-out as globally as possible
• No need to be perfect or complete, add value on specific pain points, and create momentum
26 © ARC Advisory Group
* Recommendations (4)
t Business impact • Include functionalities in all 4 ISA-95 pillars:
production, quality, maintenance and inventory • Measure value and follow-up (adapt) • Subsidiarity principle: implement at higher level/domain
what is common, implement at lower level/domain what is unique
• Include process/product development processes, and value created from those • Production / product performance reporting • Product definition adapted to application and testing of
improvements and new products

27 © ARC Advisory Group
Call for participation
t The report could provide comparison of your practices with best identified • Create opportunities to plan ahead and improve
t Statistical significance is not sufficient yet • We also need input and feedback on KPI’s
t If you participate to the study • The meaning of the results improve • You will receive the report at no cost
t Broad industry sector participation desirable t If interest exists, the study can be regularly
updated

29 © ARC Advisory Group
Thank You. For more information, contact the author at
[email protected] or visit our web pages at www.arcweb.com