
SET Opportunity Day Q2/2019 JMART Group...2019/08/22 · • Award Winning for Debt Collection...
109
1 SET Opportunity Day Q2/2019 JMART Group
Transcript of SET Opportunity Day Q2/2019 JMART Group...2019/08/22 · • Award Winning for Debt Collection...

1
SET Opportunity Day Q2/2019
JMART Group

2
Disclaimers
The information contained herein is intended to represent the Company’s operating and financial position at a given point in time and may also contain forward looking information which only reflects
expectations based on the prevailing geo-political, economic and non-controllable factors. Such
information has been obtained from sources believed to be most reliable and the means in analyzing
and preparation of such information for disclosure are based on approve practices and principles in
the investment industry. The views are based on assumption subject to various risks and uncertainties
and no assurance is made as to whether such future events will occur. No assurance is made as to the
accuracy or completeness of information presented in this document.
2 Jaymart Public Company Limited
https://www.facebook.com/groups/JMART.JMT/

Jaymart Group Group of Companies
Debt Collection and
Management
55.8%
Personal Loan Property Development
74.9%
Home and Commercial
Appliance
30.3% Listed Listed Listed
Listed
95.6% 99.9%
Mobile Business
80.0%
Fintech & Start-up
99.9% 99.9%
9.8% 0.3%
60.0% 55.0%
18.9% 3.1%
3 3 Jaymart Public Company Limited 3
2.0% 0.6%
Update as of 15 Aug 2019
4 4
03
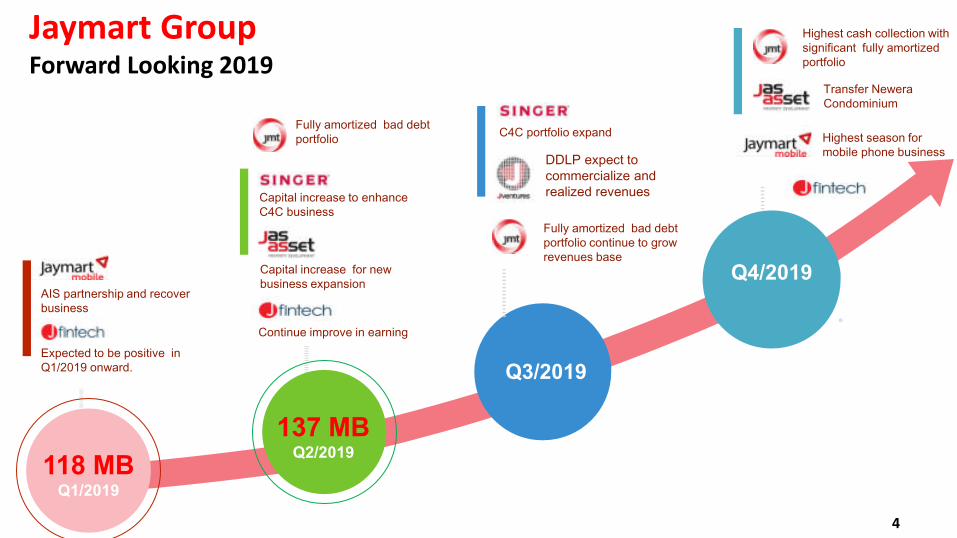
AIS partnership and recover
business
118 MB Q1/2019
Expected to be positive in
Q1/2019 onward.
Fully amortized bad debt
portfolio
DDLP expect to
commercialize and
realized revenues Capital increase to enhance
C4C business
137 MB Q2/2019
Q3/2019
Q4/2019 Capital increase for new business expansion
Continue improve in earning
Highest cash collection with significant fully amortized
portfolio
Highest season for
mobile phone business
Jaymart Group Forward Looking 2019
C4C portfolio expand
Fully amortized bad debt
portfolio continue to grow
revenues base
Transfer Newera
Condominium
4
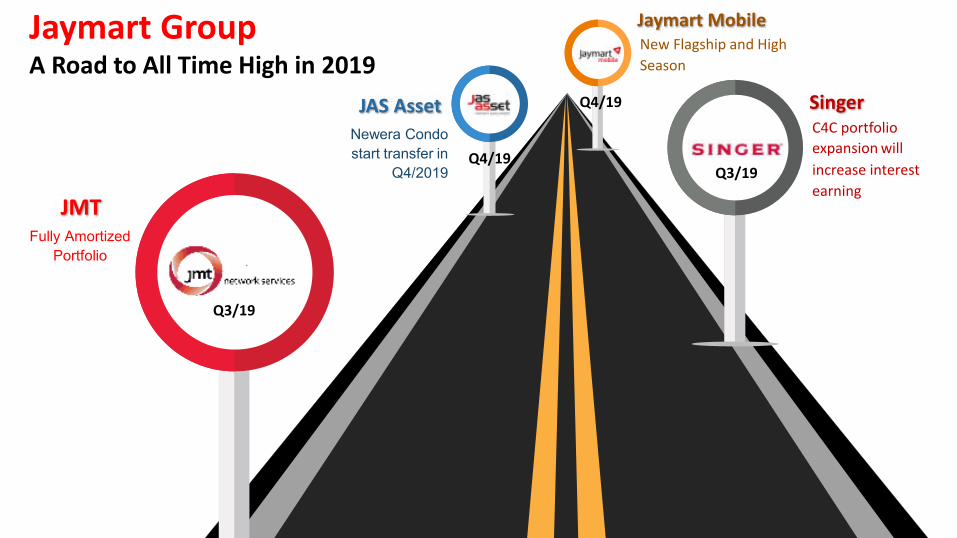
Jaymart Group A Road to All Time High in 2019
Fully Amortized
Portfolio
JMT
C4C portfolio
expansion will
increase interest
earning
Singer
Newera Condo
start transfer in
Q4/2019
JAS Asset
New Flagship and High
Season
Jaymart Mobile
Q3/19
Q3/19 Q4/19
Q4/19

6
Jaymart Group Investment Valuation: Sum of the Parts (SOTPs)
Listed Co. holding
Value = 10,726 M.THB
or 14.61 THB/Share
Non-listed Co. holding
Value = 3,800 M.THB +
Valuation
GAP
Fully
Amortized
Portfolio
C4C
Portfolio
Expansion
Condo +
New Project
AIS partner +
5G trend
Lending
Portfolio
Diversified
Fintech +
Tokenomic
Key
Drivers
16,517
3,112
754 2,000
1,200 600
8,930
0
2,000
4,000
6,000
8,000
10,000
12,000
14,000
16,000
18,000
JMT Singer J JMB JFintech JVC JMART
9,218
(55.8%)
943
(30.3%)
565
(74.9%)
14,526 M.THB
JMART SOTPs
Update as of 20 Aug 2019
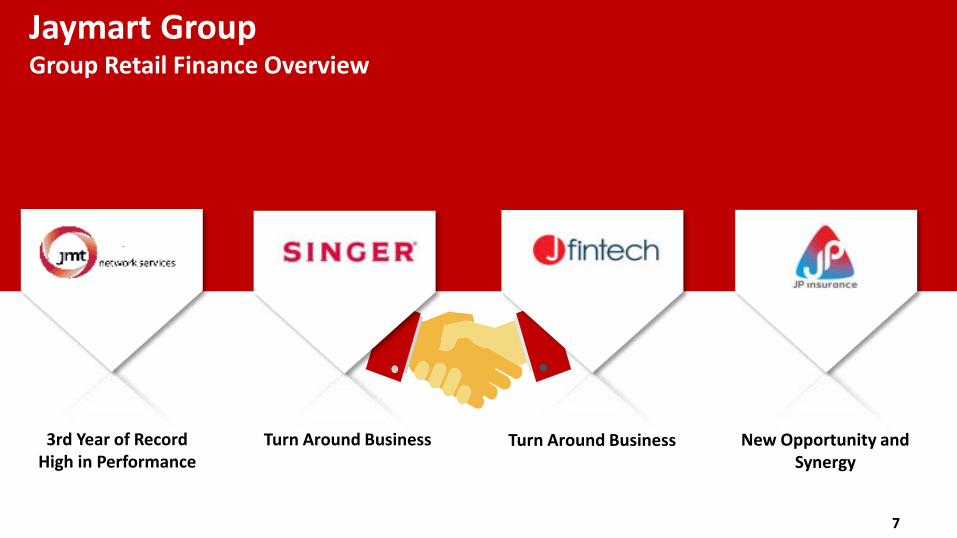
Jaymart Group Group Retail Finance Overview
3rd Year of Record
High in Performance
Turn Around Business Turn Around Business New Opportunity and
Synergy
7

8
Jaymart Group Group Digitalized Finance Business
1
2
3
4
5
6
7
Data
Distribution
Channel
Collection
InsurTech
Technology
Synergy
CRM
Combine Jaymart Competitive Edge in Fintech World
8

Jaymart Public Company Limited 9
Mobile Distribution Business

Jaymart Public Company Limited 10
Mobile Business 1H/2019 Revenues Breakdown
By Products: Mobile, Camera and Accessories By Distribution: Type: Retail VS Wholesale
16% 84%
Wholesale
Retial
95%
1%
3% 1%
Mobile
Camera
Accessories
Other

Jaymart Public Company Limited 11
Mobile Business Shop Coverage
Jaymart 140
Smartphone 13
Brand Shop 29
AIS 9
Total 191
Shops Breakdown
73%
7%
15%
5%
Smartphone
Jaymart Brand Shop
AIS Shop

Jaymart Public Company Limited 12
Mobile Business 1H/2019 Mobile Update
Mobile Unit Sold in 1H/2019 Mobile Business Value Sold in 1H/2019
Unit: Million Unit: ‘000
1,217
1,070
555 443
2017 2018 1H/2018 1H/2019
10,584
9,453
4,498
3,339
2017 2018 1H/2018 1H/2019
Jaymart Public Company Limited 13
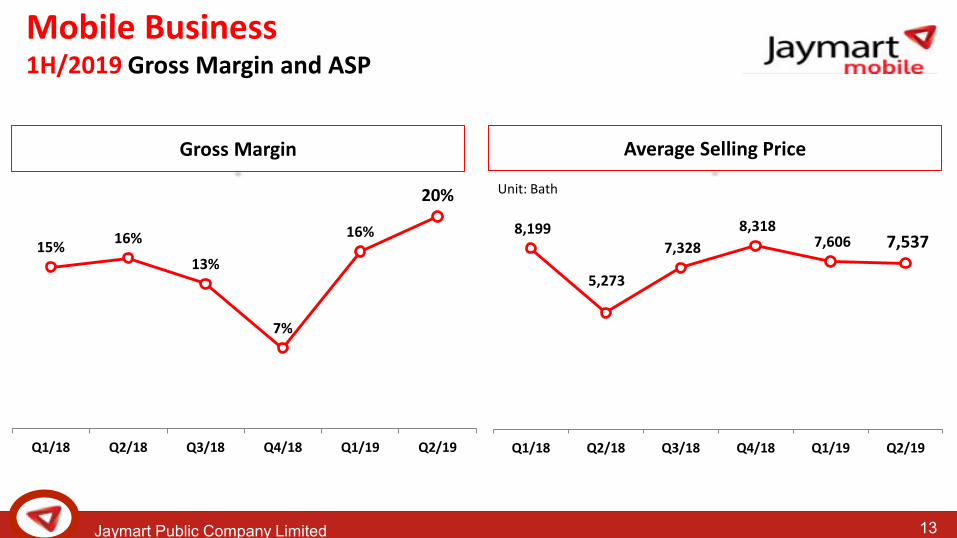
Mobile Business 1H/2019 Gross Margin and ASP
Gross Margin Average Selling Price
Unit: Bath
8,199
5,273
7,328
8,318 7,606 7,537
Q1/18 Q2/18 Q3/18 Q4/18 Q1/19 Q2/19
15% 16%
13%
7%
16%
20%
Q1/18 Q2/18 Q3/18 Q4/18 Q1/19 Q2/19

Jaymart Public Company Limited 14
Mobile Business Brand Portfolio Mixed
48%
12%
35%
5%
Samsung
iPhone
Chinease Brand
Other
1H/2018 1H/2019
46%
15%
33%
6%
41%
12%
45%
2%

Jaymart Public Company Limited 15
Mobile Business Exclusive Partnership: SIM Subscriber
Boost up subscriber at Jaymart
Shop and group of companies
AIS Sim Subscriber Performance
9,066
11,231
15,959
13,789 14,645 14,342
12,978
15,911 17,026
Oct-18 Nob-18 Dec-18 Jan-19 Feb-19 Mar-19 Apr-19 May-19 Jun-19
Increasing Trend in SIM Subscriber

Jaymart Public Company Limited 16
Mobile Business Forward Looking in 2019
2,006
1,329
1,087
2017 2018 1H/2019
Inventory Control Margin Control
Unit: Million Monitor Average Margin > 15% + More
Accessories Sale
15% 16%
13%
7%
16%
20%
Q1/18 Q2/18 Q3/18 Q4/18 Q1/19 Q2/19
Inventory Day 65 Days

Jaymart Public Company Limited 17
Mobile Business Forward Looking in 2019
30th Years of Jmart Campaign Phase II +
New Flagship Release in Q3-Q4/2019 Event in Shop Activities / ioT Shop

Jaymart Public Company Limited
2G Phase 3G Phase 4G Phase
• Feature Phone
• 64 kbps
• Voice and text
• Smart Phone
• 2,000 kbps (or 2 Mbps)
• Voice, text and multimedia
• Smart Phone
• 100 Mbps
• Data transmission
• IP Based Protocol (LTE)
4.94 5.36
7.36
8.99 8.08 8.35
9.52 10.58
9.45
2010 2011 2012 2013 2014 2015 2016 2017 2018
Unit: B.THB
5G Phase
2020
18
Mobile Business Forward Looking 5G Phase
10.X
“Jaymart Mobile ‘s Phone Sale will increase as technology platform change”
• Internet of things
• 20 Gbps

19
Debt Collection and Management
JMT Network Services Public Company Limited
*Market Cap between 10,000 – 30,000 M.THB
SET Awards 2018
Best Company Performance Award Nomination 2018*

20
JMT Network Services Best in Class in Collection Business
Debt Collection Business Debt Acquisition Business Insurance Business
Business
and Clients
Market
Positions
Strength
• No.1 in debt collection • No.1 in unsecured non-performing
debt management
• Proven tracking record and
experienced more than 20 years
• Data base system over 3 million
account all nationwide
• Award Winning for Debt Collection
Services
• IT and data base system
• Well training staff
• Connect through synergy channel of
Jaymart Group of Companies
• InsurTech / Synergy
Revenues
Proportion (1H/2019)
16% 77% 7%

21
JMT Q2/2019 Cash Collection and Revenues Performance
Q2/2019 Debt Acquisition Revenue Trend Q2/2019 Cash Collection
“Fully Amortized Portfolio increase Debt Acquisition Revenue”
Unit: M.Baht Unit: M.Baht
514 548
608
730 708 706
Q1/2018 Q2/2018 Q3/2018 Q4/2018 Q1/2019 Q1/2019
341 351 369
420 419 449
Q1/2018 Q2/2018 Q3/2018 Q4/2018 Q1/2019 Q1/2019

22
JMT Q2/2019 Revenues Performance (QoQ analysis)
Unit: M.Baht
“Q2/2019 Revenues Increase mainly from Debt Acquisition Revenues”
90
419
44
553
92
449
50
591
Debt collection Debt Acquisition Insurance Total
Q1/2019
Q2/2019
+7%
+7%
+2%
+14%
23
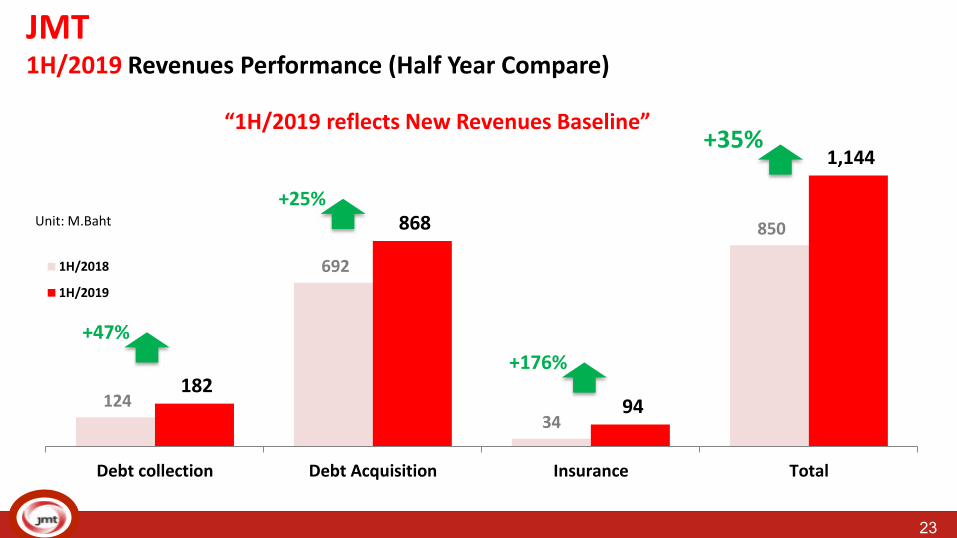
JMT 1H/2019 Revenues Performance (Half Year Compare)
Unit: M.Baht
“1H/2019 reflects New Revenues Baseline”
124
692
34
850
182
868
94
1,144
Debt collection Debt Acquisition Insurance Total
1H/2018
1H/2019
+35%
+25%
+47%
+176%

24
JMT 1H/2019 Debt Collection Performance
Commission Rate and Success Rate Collection Services Portfolio Size
Unit: M.THB
13,707 13,950 15,954
25,367
18,291
22,353 20,133 19,176
38,672
2012 2013 2014 2015 2016 2017 2018 H1/2018H1/2019
2.9% 3.6%
4.8% 4.8%
7.7% 8.3%
9.3% 9.4%
5.8%
22.6%
15.8%
10.3%
6.9% 7.4%
10.3% 10.5% 9.6% 9.9%
2012 2013 2014 2015 2016 2017 2018 H1/2018H1/2019
% Success rate
% Commission rate
Collection Revenues Increased

25
JMT 1H/2019 Debt Acquisition Milestones
Secure Loan
“The Next S-Curve Growth”
6,429 13,542
22,017
31,679
63,223
88,683
108,283
124,554
145,557 148,091
2010 2011 2012 2013 2014 2015 2016 2017 2018 1H/2019
Secure Loan
Hire Purchase
Personal Loan
Total

26
JMT 1H/2019 Cash Collection Performance
1 42 86 102 160 154 136 194 254 97
212 46 122
14 23 54 73 173
194 153 228
417 603
916
1,227
594
655
303 326
17 15 27 82
182 211 256
350
384 287
737
919
372
547
199 258
31 39 81 156
397 491 511
739
954
1,026
1,847
2,399
1,062
1,414
548
706
Y2006 Y2007 Y2008 Y2009 Y2010 Y2011 Y2012 Y2013 Y2014 Y2015 Y2016 Y2017 Y2018 6M/18 6M/19 Q2/18 Q2/19
Revenue 100%
Revenue
Amortization of investment
Cash collection
Unit: MB
Target 2019: 3,000 MB

27
JMT Debt Acquisition: Portfolio Return and Investment
Collected as %
of Investment 483% 252% 404% 506% 270% 277% 207% 140%
Investment(MB) 39 16 49 74 122 384 399 439
2006 2007 2008 2009 2010 2011 2012 2013
OS Balance (MB)
Collected
Investment

28
JMT Debt Acquisition: Portfolio Return and Investment
Collected as % of
Investment 126% 100% 132% 76% 22% 3% 93%
Investment (MB) 1,613 1,319 906 1,598 2,583 1,235 9,998
148,091
Total 2014 2015 2016 2017 2018 1H/2019
OS Balance (MB)CollectedInvestment

29
JMT Q2/2019 Gross Profit and SG&A
Q2/2019 Gross Profit Margin Q2/2019 Gross Margin
Unit: M.Baht
248 272
285 279
323 302
-
50
100
150
200
250
300
350
Q1/18 Q2/18 Q3/18 Q4/18 Q1/19 Q2/19
62.1% 65.4% 64.2% 64.0%
61.3% 57.6%
62.1% 60.4% 59.0%
52.3%
58.4%
51.2%
Q1/18 Q2/18 Q3/18 Q4/18 Q1/19 Q2/19
Debt Only GPM
Consol GPM

30
JMT Q2/2019 SG&A and Consolidated Net Profit
Q2/2019 Consolidated Net Profit Q2/2019 %SG&A to Revenues
Unit: M.Baht
15.5% 16.3%
12.3% 11.5%
15.0% 13.8%
15.5%
18.6%
16.0% 14.9%
17.3%
15.7%
Q1/18 Q2/18 Q3/18 Q4/18 Q1/19 Q2/19
%SG&A Debt
%SG&A Consol 116 120
138 131 144 149
29.0%
26.6%
27.7%
19.8%
25.6%
23.2%
0.0
5.0
10
15
20
25
30
35
-
20
40
60
80
100
120
140
160
Q1/18 Q2/18 Q3/18 Q4/18 Q1/19 Q2/19
Net Profit % NP
31
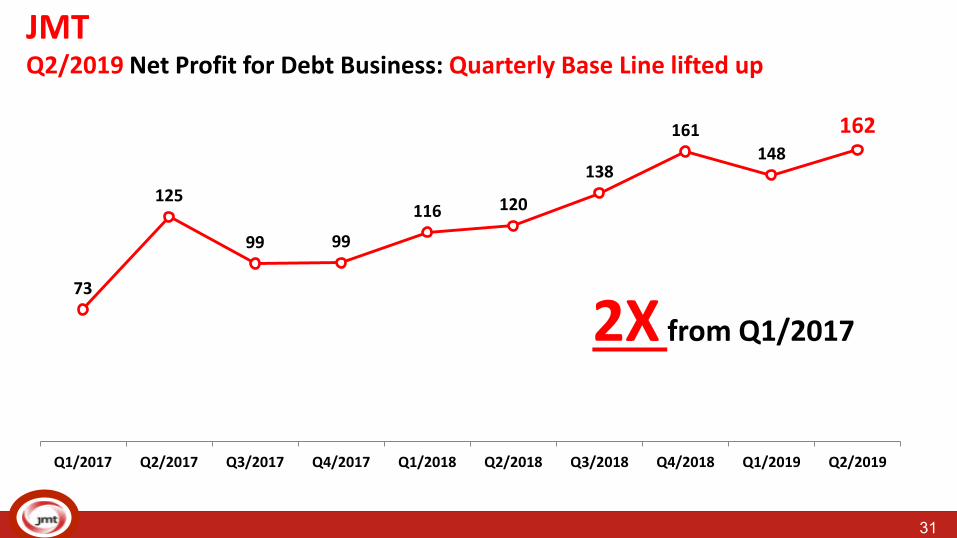
JMT Q2/2019 Net Profit for Debt Business: Quarterly Base Line lifted up
73
125
99 99
116 120
138
161
148
162
Q1/2017 Q2/2017 Q3/2017 Q4/2017 Q1/2018 Q2/2018 Q3/2018 Q4/2018 Q1/2019 Q2/2019
2X from Q1/2017

32
JMT 2019 Forward Looking
1. Debt Collection
Business
2. Debt Acquisition
Business
3. Insurance Business
Key initiatives
• Maintain portfolio at least 20,000 M.THB.
• Target 30% growth in debt collection services revenues by improving
collection efficiency.
• Synergy services to Jaymart Group of companies for collection services
• Target to acquire distress debt with budget 4,500 million baht in 2019.
• Fully Amortized Revenues will significantly increase since 2019 onward.
• Target to achieve cash collection more than 3,000 million baht in 2019
• Secure Loan Bad Debt is the next S-curve to JMT
• Revenues target 300 million baht in 2019. Focus on net margin not sale
revenues.
• Diversify portfolio toward less loss ratio such as non-motor insurance by
target 70% motor insurance with less loss ration and 30% non-motor
insurance.
• InsurTech: Surewarp Application
Actual 1H/19
• Debt collection revenues
growth at 47% yoy.
• Debt acquisition will be
loaded in Q3- Q4/2019.
• Cash Collection in line with
the target.
• Insurance revenues decline
due to remove of port of
high loss ratio, auto type, to
reduce insurance overall loss
ratio

33
JMT Fully Amortized Portfolio
OS Balance of 100% Fully Amortized Number of Portfolio
“The potential of 100% fully amortized revenue will significantly boost up
earning in Q2/2019 onward”
17,600
106,954
24,529
121,038
33,374
114,717
Fully Amortized IRR
2017
2018
1H/2019
43
99
50
102
Fully Amortized IRR
2018
Q2/2019

34
JMT Revenues Stream Fully Amortized Portfolio
Cash Collection Trend Expected Rev. Stream – Fully Amortized Increase
Q1/19 Q2/19 Q3/19 Q4/19
Other Insurance
100% Revenues IRR Revenues
Debt Collection Sevices
553 591
XXX XXX
Unit: M.Baht
708 706 XXX
XXX
Q1/19 Q2/19 Q3/19 Q4/19
Unit: M.Baht
“Revenues Stream Expectation in Q3-Q4/2019”

35
JMT 2018 Gross Profit and SG&A

JP insurance
#JPInsurTech
#InsurTechAwakening
#Goingforward!
ภาพรวมเบยประกนภยรบเดอน ม.ค. – ก.ค. 2562

เปรยบเทยบเบยรบรวมและก าไรขาดทนสะสม ในชวง ม.ค.-ก.ค.แบบ YoY 2561 vs 2562
ปรบเพมสดสวนงานNon-motor
ใหเพมขน
มงเนน InsurTech โดยการเชอมตอOnline กบ Brokers และ พนธมตร
เพมชองทางขาย B2B2C และปรบคา Commission ใหต าลง
ลกษณะการด าเนนงานท JPI ยดมนเสมอมา
109.43
-54.94
217.71
-37.28
(100)
(50)
-
50
100
150
200
250
เบยประกนภยรบ ก าไร (ขาดทน) สทธ
Millions
เบยรบเตบโตขนจากชวงเวลาเดยวกนในปกอน 98.95%
ก าไร(ขาดทน)สทธ ลดลงถง32.14%
เบยประกนภยรบ ก าไร(ขาดทน)สทธ
2561
2561
2562
2562
*Remark*
ขอมลเบยรบและก าไร(ขาดทน)น เปนตวเลขทางบญช ณ ป 2562
ท าให JP’s Portfolio ดขน โดยการยกเลกงานประกนภยรถสาธารณะ

JP insurance
www.jpinsurance.co.th
93%3%
4%
Broker
B2B2C
Synergy
ภาพรวม Commercial ม.ค.-ก.ค. 2562
สดสวนเบยรบจากชองทางขายกลยทธ
Broker
208,096,588.32
B2B2C
7,600,254.4
Synergy
8,559,833.59
Motor190,952,097
Non-motor24,915,391
คดเปน 100%
Total: 199 รายคดเปน 59%
L/R<60%: 140 ราย*คดเปน 73%
Active: 145 ราย
* LR ของกลมตวแทนทนอยกวา 60% คดจากนายหนาทงหมด 226 รหส** ขอมล LR ของตวแทนชดน เปน LR เฉพาะงาน Motor เทานน
Active Agents & Brokers
New Target Sale: 392 MB
How far we have come!
44.93%55.07%
เบยประกนภยรบ(รวมสลกหลง) ม.ค.-ก.ค. 2562
88% 12%
Motor Non-motor
ขอมลยอดขายรวมสลกหลงตามวนท ารายการ ณ วนท 2/08/19
เบยรบตามวนท ารายการ ณ วนท 2/08/19
215,867,487.71 176,144,733.31

JP insurance
www.jpinsurance.co.th
91% 90% 91% 72% 88% 87% 86%
9% 10% 9% 28% 12% 13% 14%
0%
20%
40%
60%
80%
100%
Jan Feb Mar Apr May Jun Jul
Motor
Non-Motor
อตราสวนเบยรบ Motor : Non-Motor ในชวง ม.ค.-ก.ค. 2562

172,032
6,810,224
ม.ค.-1
8
ก.พ.-1
8
ม.ค.-1
8
เม.ย.-
18
พ.ค.-1
8
ม.ย.-1
8
ก.ค.-1
8
ส.ค.-1
8
ก.ย.-1
8
ต.ค.-1
8
พ.ย.-1
8
ธ.ค.-1
8
ม.ค.-1
9
ก.พ.-1
9
ม.ค.-1
9
เม.ย.-
19
พ.ค.-1
9
ม.ย.-1
9
สดสวนประเภทงานฝายรบประกนภยรถยนตเทยบจากเบยประกนภยรบ
พรบ40%
รถบาน31%
รถสาธารณะ16%
รถบรรทก13%
สดสวนงานขาย ม.ค. – ก.ค. 2562
31%
40%16%
13%
รถสาธารณะ62%
พรบ27%
รถบาน6%
รถบรรทก5%
สดสวนงานขาย ม.ค. – ก.ค. 2561
62%27%
50%
64%
99% 102%92%
29%
81% 83%
65%
78%
พรบ รถกระบะ รถบรรทก รถบาน รถสาธารณะ
2018
2019
Flagship Package of Motor : JeedJad
ป 2562 แพคเกจจดจาด มยอดขายเตบโตเพมขนอยางตอเนองนบจากชวงเปดตวจนถงปจจบน
Motor Loss Ratio แบงตามประเภทการใชงาน 2561 VS 2562ณ ส.ค. 2562
2561
2562
83.09%
60.02%
0.00%
20.00%
40.00%
60.00%
80.00%
100.00%
2018 2018
ภาพรวม Loss Ratio ณ ส.ค. 2562
2561 2562
Motor

สดสวนประเภทงานฝายรบประกนภยทวไปเทยบจากเบยประกนภยรบ
66.00%
32.00%
0.00%
20.00%
40.00%
60.00%
80.00%
2108 2019
ภาพรวม Loss Ratio ณ ส.ค. 2562
2561
ม.ค.-ก.ค.
2562
ม.ค.-ก.ค.
กลมงาน Non-motor ท Focus
LR : 1.35%
Neon SignMarine/Carrier
LR : 27%
Drone
LR : 2.53%
MISC
LR : 6.59%
PA
LR : 41.42%
LOSS RATIO
26.16%
NEW
2561 2562
Non-Motor

What Happened in 2019
Flash Express COD
Mobile Plus
ประกนภยรถ ป.1 จดจาด

Flash Express ยอดรวม 293,186 บาท
16,171
41,103
47,820 46,998
54,281
60,260
Week 1 Week 2 Week 3 Week 4 Week 5 Week 6
ยอดขายแยกรายสปดาห
Gross PremGrowth 273%
เรมขาย 26 มถนายน 2562 – 6 สงหาคม 2562
*หมายเหต week1 มเพยง 3 วน : 26 June – 28 June 2019
Week 1 Week 2 Week 3 Week 4 Week 5 Week 6
5,390* 5,872 6,831 6,714 7,754 8,609
ยอดขายเฉลย
LOSS RATIO
26.16%
ยอดขายเฉลยตอวน
7,060
7,319
7,869
10,019
72,994
นครศรธรรมราชนนทบร
พษณโลกปทมธานกรงเทพ
Top 5 จงหวดทมยอดขายสงสด
1,735
1,755
1,830
3,690
6,585
เชยงใหมสราษฎรธานสมทรปราการ
ชลบรกรงเทพ
Top 5 จงหวดทมเคลมสงสด

ประกนภยรถประเภท 1
ประกนภยรถ ประเภท 2+,3+
ประกนภยรถประเภท 1 จดจาด
ประกนอคคภยส าหรบบานอยอาศย
ประกนอคคภยส าหรบธรกจ(SME)
ประกนอบตเหต(PA)
ประกนการเดนทาง(TA)

JPI ควารางวลE-Claim Awards 2018
เจพ ประกนภย ควา 2 รางวลระดบเอเชยรางวล “Effective Adoption of
Technology into the Insurance Business” และ “Woman in Insurance Leadership” จากงาน “Emerging Asia
Insurance Awards 2019”
Miss Mobile Thailand 2019
JPI ไดรบรางวล “การใชระบบสนไหมอตโนมตดเดน ประจ าป 2561” จาก บรษท กลางคมครองผประสบภยจากรถ จ ากด
JPI มอบรางวลกรมธรรมประกนภย ทนประกน จ านวน 500,000 บาท ใหแก Miss Mobile Thailand 2019 ณ งาน Jaymart Mobile & Gadget Show
2019

JP insurance
#JPInsurTech
#InsurTechAwakening
#Goingforward!
Looking Ahead

ทศทางในชวงเดอน ส.ค.-ธ.ค. 2562
JPI ยงคงมงมนทจะพฒนาผลตภณฑประกนภยเพอยกระดบการใชชวตใหกบกลมลกคาเปาหมายอยางตอเนอง
ไมวาจะชนหนก หรอชนเบา เรากมแผนความคมครองประกนภยรถหลากหลายแบบใหเลอกสรร
ประกนภยรถ ป.1 จดจาด
ประกนภยรถประเภท 1
ประกนภยรถประเภท 2+,3+
Highlight
Flash Express“Declare Value”
TA“InsurTech Autoclaim”
“Mobile Care”
ปลดลอกความกงวลดวยแบบประกนการเดนทางของ JPI ทคมคากวาทใด
ใชกลยทธ Reinsurance
Strategy เพอสรางก าไรอยางตอเนองตงแตเดอนส.ค. 2562 โดยการปรบอตราสวน Reinsurance
จาก 50:50 เปน 75:25

JP insurance
www.jpinsurance.co.th
24.23
20.90
25.39 24.70
30.42
46.87 45.21
29.16 29.15
51.99
32.15 31.85
0.21
3.56
2.66
3.25
3.45
-
0.50
1.00
1.50
2.00
2.50
3.00
3.50
4.00
-
10.00
20.00
30.00
40.00
50.00
60.00
Jan Feb Mar Apr May Jun Jul Aug Sep Oct Nov Dec
Millions
Millions
Premium
Profit(Loss) 2561
Financial Forecasting (ส.ค.-ธ.ค. 2562)
Actual Forecast
ในเดอน ต.ค. จะมงาน “ประกนพชผลทางการเกษตร(ขาวนาปรง)” หรองานประกนภยเบดเตลดเขามา ท าใหเบยรบประกนภยจะเตบโตสงกวาปกต

JP insurance
www.jpinsurance.co.th
81% 89% 54% 87% 88%
19% 11% 46% 13% 12%
0%
20%
40%
60%
80%
100%
Aug Sep Oct Nov Dec
Motor
Non-Motor
อตราสวนเบยรบ Motor : Non-Motor ในชวง ส.ค.-ธ.ค. 2562
เนองจากงาน “ประกนพชผลทางการเกษตร(ขาวนาปรง)” ทเปนงานประกนภยเบดเตลดจะเขามาในเดอนต.ค. ท าใหสดสวนเบยประกนภยงาน Non-Motor
อาจจะปรบสดสวนมากขนกวาปกต

www.jpinsurance.co.th

Jaymart Public Company Limited 36
Opportunity Day Q2/2019

Jaymart Public Company Limited 37
• Construction on achieve 70%
• Expected to transfer in Nov 2019
Transfer Newera in Q4/2019
• Debt burden will diminish start 2021
Capital Structure Balance
Forward Looking 2019 and 2020
New Project in 2019 : The Jas Amata
• Activities, Rental Space and Event
Synergy with JMART Group
2019 2020
• Signed up contact with Key tenant
• Expect to receive rental revenues in Q3/2019

38
JAS Asset Revenues Flow: 2019 - 2020 Projection
2015 2016 2017 2018 2019 (FC) 2020 (FC)
Condominium
Other Income
Beans & Brown
The Jas
J Market
IT Junction
539 562
751 670
900
1,180
Jas Amatanakorn
Condominium
“Transfer condominium in Q4/2019 and New Project JAS Amatanakorn in Q1/2020”
Unit: MB

Jaymart Public Company Limited 39
44 Branches
Total Rental: 1,217 unit
OCC Rate (Q2/2019): 81%

40
Occ rate : 91% (end of Q2/2019)

41
The Jas Wanghin Occ rate : 97 (end of Q2/2019)
The Jas Ramintra
Occ rate : 98 (end of Q2/2019)

Jaymart Public Company Limited 42
Revenues Breakdown
Unit: MB Unit: MB
Total Revenues
562
758
916
375 370
2016 2017 2018 H1/2018 H1/2019
295.5, 80%
44, 12%
30.7, 8%
Rental Income
Sale Income
Other Revenues

Jaymart Public Company Limited 43 43
Unit: MB
EBITDA Net Profit
Unit: MB
70
148 138
2 -5
2016 2017 2018 H1/2018 H1/2019
5.7 6.4
-17
-14
-17
2016 2017 2018 H1/2018 H1/2019


Jaymart Public Company Limited 45
Construction Update Newera Condo
Over 80% completed in construction progress
With 70% Sale

Jaymart Public Company Limited 46
The Jas AMATA NAKORN

Jaymart Public Company Limited 47
Project Update The JAS Amatanakorn
Secure Key Tenant

Jaymart Public Company Limited 48
The JAS Amatanakorn

BEANS AND BROWN CO.,LTD

22/08/62
50
“Daily Dose of Coffee
for Every Lifestyle”


BRANCHES CASA LAPIN XL PATTAYA

BRANCHES CASA LAPIN XL PATTAYA

BRANCHES (UPCOMING) CASA LAPIN X ATT U BANGNA
OPENING
SEPT 20

1.CLMV
2.Phnom Penh**
3.Copenhagen
4.Tokyo**
5.Singapore **
6.Seoul
7.Taipei
8.Hong Kong
9.Indonesia
OVERSEA EXPANSION TARGET IN ASIA 2019 - 2021
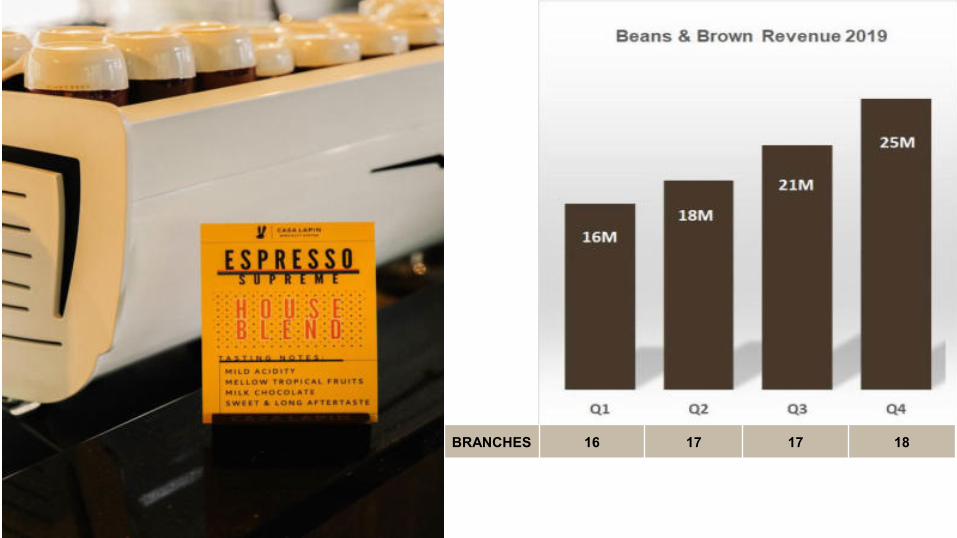
BRANCHES 16 17 17 18
21M
18M
18M
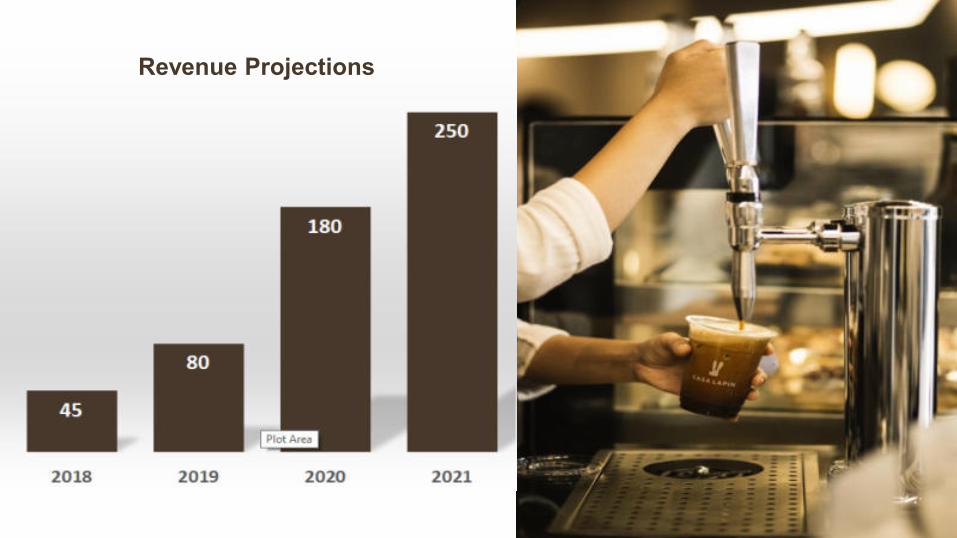
Revenue Projections

REVENUE STREAM
COFFEE SHOPS
CASA LAPIN 13 BRANCHES
RABB COFFEE 4 BRANCHES
MERCHANDISES
CATERING SERVICE
BRAND COLLABORATION Casa Lapin x Pancake Café
Casa Lapin x Spaces Casa Lapin x CODE Dessert


1.Gross Margin
Strengthening • Revenue mix - healthy
• Product focus
• Revenue share from
vending machine
2.Bad Debt
Improving • Collection continue to
improve
• Reclassify sales &
collection capability
KPI
• Improved collection
system
3.Loan Portfolio
Diversification • Continue expansion of
C4C
• Collateral loan –
Captive Finance
• Stabilize interest
earnings
• Growth in fees
4.Operation
Optimization • Utilize technology –
Oracle ERP
• Full IT-driven process
& control
• Fraud control process
SINGER Turn-around
CONTROL
COLLECT
CONSISTENT
CONVERSION

Revenue Mix
Unit: MB
3,395
2,546
2,363
2,888
580 603
• QoQ – Q2’19 total revenue grows 13% from Q1’19 on higher sales revenue mainly from summer products (i.e. air condition)
• YoY – Q2’19 total revenue decreases 10% from Q2’18 – 66MB from TV (last year was World
Cup 2018 season) and 28MB from airtime
machine sales. Y2015 Y2016 Y2017 Y2018 Q1'18 Q2'18 Q1'19 Q2'19
Other Income
Service Revenue
Interest Earning
Sales Revenue
681 760
377
511
334 412
136
148
191
185 30
33
26
20 37
67
53
65
Q1'18 Q2'18 Q1'19 Q2'19
580 603
681
760

2018 2019
Optimization of high-profit margin products
Product Gross Margin

AR Portfolio vs Bad Debt Provision
Unit: MB
Portfolio Growth
Unit: MB
Bad Debt Provision (QoQ)
1,951 1,950 2,116
3,294 3,228 3,177
Y2015 Y2016 Y2017 Y2018 Q1'19 Q2'19
100
184
372
446
94 105
Y2015 Y2016 Y2017 Y2018 Q2'18 Q2'19

Portfolio Mix & Interest Earning Mix
Interest Earning Mix Portfolio Mix
* C4C started in May, 2017
100% 99%
80%
68% 67%
1%
15%
22% 23%
5% 10% 10%
Y2016 Y2017 Y2018 Q1'19 Q2'19
CAPTIVE C4C HP

NPL Performance
NPL
27.1%
18.4%
22.5% 22.9%
1.4% 0.6% 0.8% 0.5%
4.7%
1.3% 1.3%
3.6%
20.6%
10.2%
12.3% 12.9%
Q1'18 Q4'18 Q1'19 Q2'19
HP C4C Captive Total 38.9%
29.2% 28.4%
25.7%
32.8%
40.7%
10.2%
14.7% 14.5%
18.4%
22.5% 22.9%
Q4'18 Q1'19 Q2'19
DC
DPS
Farmer
Total HP
Hire Purchase NPL Clarification
Q4'18 Q1'19 Q2'19
DC 8,577 4,553 2,611
DPS 70,658 53,469 37,280
Farmer 55,668 65,627 78,232
Total HP 134,903 123,649 118,123
Number of Account Receivables

66

67
J Fintech Loan Portfolio Size and Portfolio Type
Loan Portfolio Type Loan Portfolio Size (Outstanding Balance)
Unit: MB Unit: MB
As of Ending of Q2/2019
633
2,209
3,258
4,028 3,726
2015 2016 2017 2018 Q2/2019
3,241 , 87%
191 , 5%
295 , 8%
RL
TL
FT

68
J Fintech 1H/2019 Revenues Performance
Total Revenues
Unit: MB
Revenues Composition
Unit: MB
40
257
560
1,016
458 485
2015 2016 2017 2018 1H/2018 1H/2019
530
876
404 429
30
128
52 24
1
12
2 33
2017 2018 H1/2018 H1/2019
Bad Debt Recovery
Fee and others
Interest Income

69
J Fintech Bad Debt Recovery and Collection Performance
Bad Debt Recovery Revenues
Unit: MB
Collection Rate (Normal + X Day)
1 1 1
3
7
14
20
Q4/2017 Q1/2018 Q2/2018 Q3/2018 Q4/2018 Q1/2019 Q2/2019
96.9%
96.7% 96.5%
96.9%
97.6%
97.3%
Q1/2018 Q2/2018 Q3/2018 Q4/2018 Q1/2019 Q2/2019

70
J Fintech Forward Looking in 2nd Half in 2019
Write Off Portfolio OS – Recover Opportunity Confidence in Synergy Collection Partner
96.9%
96.7%
96.5%
96.9%
97.6%
97.3%
97.XX% 97.XX%
Q1/2018 Q2/2018 Q3/2018 Q4/2018 Q1/2019 Q2/2019 Q3/2019 Q4/2019
345.8
542.7
711.1
2018 Q1/2019 Q2/2019
Unit: MB 1% Target

71
J Fintech Forward Looking in 2nd Half 2019
Portfolio Size Target (Revised Target)
Unit: MB
Bad Debt Recovery Revenues Target
633
2,209
3,258
4,028 4,200
2015 2016 2017 2018 2019
(Target)
Target Principle
Balance in 2019
1
12
60
2017 2018 2019 (Target)
Target Bad Debt Recovery in
2019 = 60 million baht or
average 5 million per month.
Revenues from
interest income
increase as portfolio
expand
Unit: MB
34

Khun Taro comes from Mar
Credit Picture: Reader’s Digest

J Ventures for JMART Opp Day
22 August 2019

Copyright © 2019 J Ventures
JFIN DDLP UPDATE
• J Loan Lite
• Stake Rewards
TOKENOMICS

Copyright © 2019 J Ventures
JFIN DDLP

Copyright © 2019 J Ventures 5
B2B: BANK TO BUSINESS/
INVOICE
P2B: PERSONAL TO
BUSINESS/ BOND
B2B (DLP):
UNBANK TO SME/
INVOICE
B2P (DLP):
UNBANK /
PERSONAL LOAN
P2P: PERSON /
PERSONAL LOAN
P2B: PERSON /
BOND
PLATFORM
Digital
Lending
B2C: BANK TO CONSUMER/
PERSONAL LOANAnalog
Lending

Copyright © 2019 J Ventures
J LOAN LITE

Copyright © 2019 J Ventures
192,000THB
180
Download App
6,019KYC
2,358
Apply Loan
1,902Approved (9.46%)
Total Approved Loan Amount
ข�อมล ณ วนท 19 สงหาคม 2562
J LOAN LITE

© J Ventures 2019
PAH MARKETPLACE: PRODUCT ROADMAPB2B B2P P2B P2P
Blockchain
ONE TIME LOAN
OCTOBER 2018
FAST MONEY
JUN 2019 7 AUG 2019
Temjaipay J LOAN LITE P2P
DEC 2019
www.ป�า.com JFIN Wallet
Loan OriginationCredit Scoring
Digital Lending P2P Lending
Marketplace
Loan Repayment Management
Debt Collection
JFIN Identity Management
JFIN Wallet Management
Stake Rewarding
Stake Rewards
J MONEY

© J Ventures 2019
PAH MARKETPLACE: PRODUCT ROADMAP 2020
B2B B2P P2B P2P
JAN 2020
DCF J LOAN PAH AUTO PAH ADVANCE PAH MAKE DOOM J LOAN PLUSWORKING CAP
1 MAR 2020Q1/2020 Q2/2020
FACTORING
INVOICE

© J Ventures 2019
Scan QR Code to
Register
E-KYC
Paybackเล�นเกมส� และตอบ
แบบสอบถาม
Apply Loan
Approved /
Reject Process Cash out
IAL 2.2
SCORE
• E-Contract
• E-Signature
รบ
QR/Barcode
เพอสแกนจ�าย
ชำระเงน
E-Wallet
1 min 3 min 5 min 3 min 3 min 3 min 3 min *1-2 Days for money to bank
account
PAH MARKETPLACE: CUSTOMER JOURNEY

Copyright © 2019 J Ventures
DIGITAL PAYMENT
BLOCKCHAIN
SCORE
E-KYC
CREDIT SCORING
WHY PAH MARKETPLACE

Copyright © 2019 J Ventures
STAKE REWARDS
Copyright © 2019 J Ventures
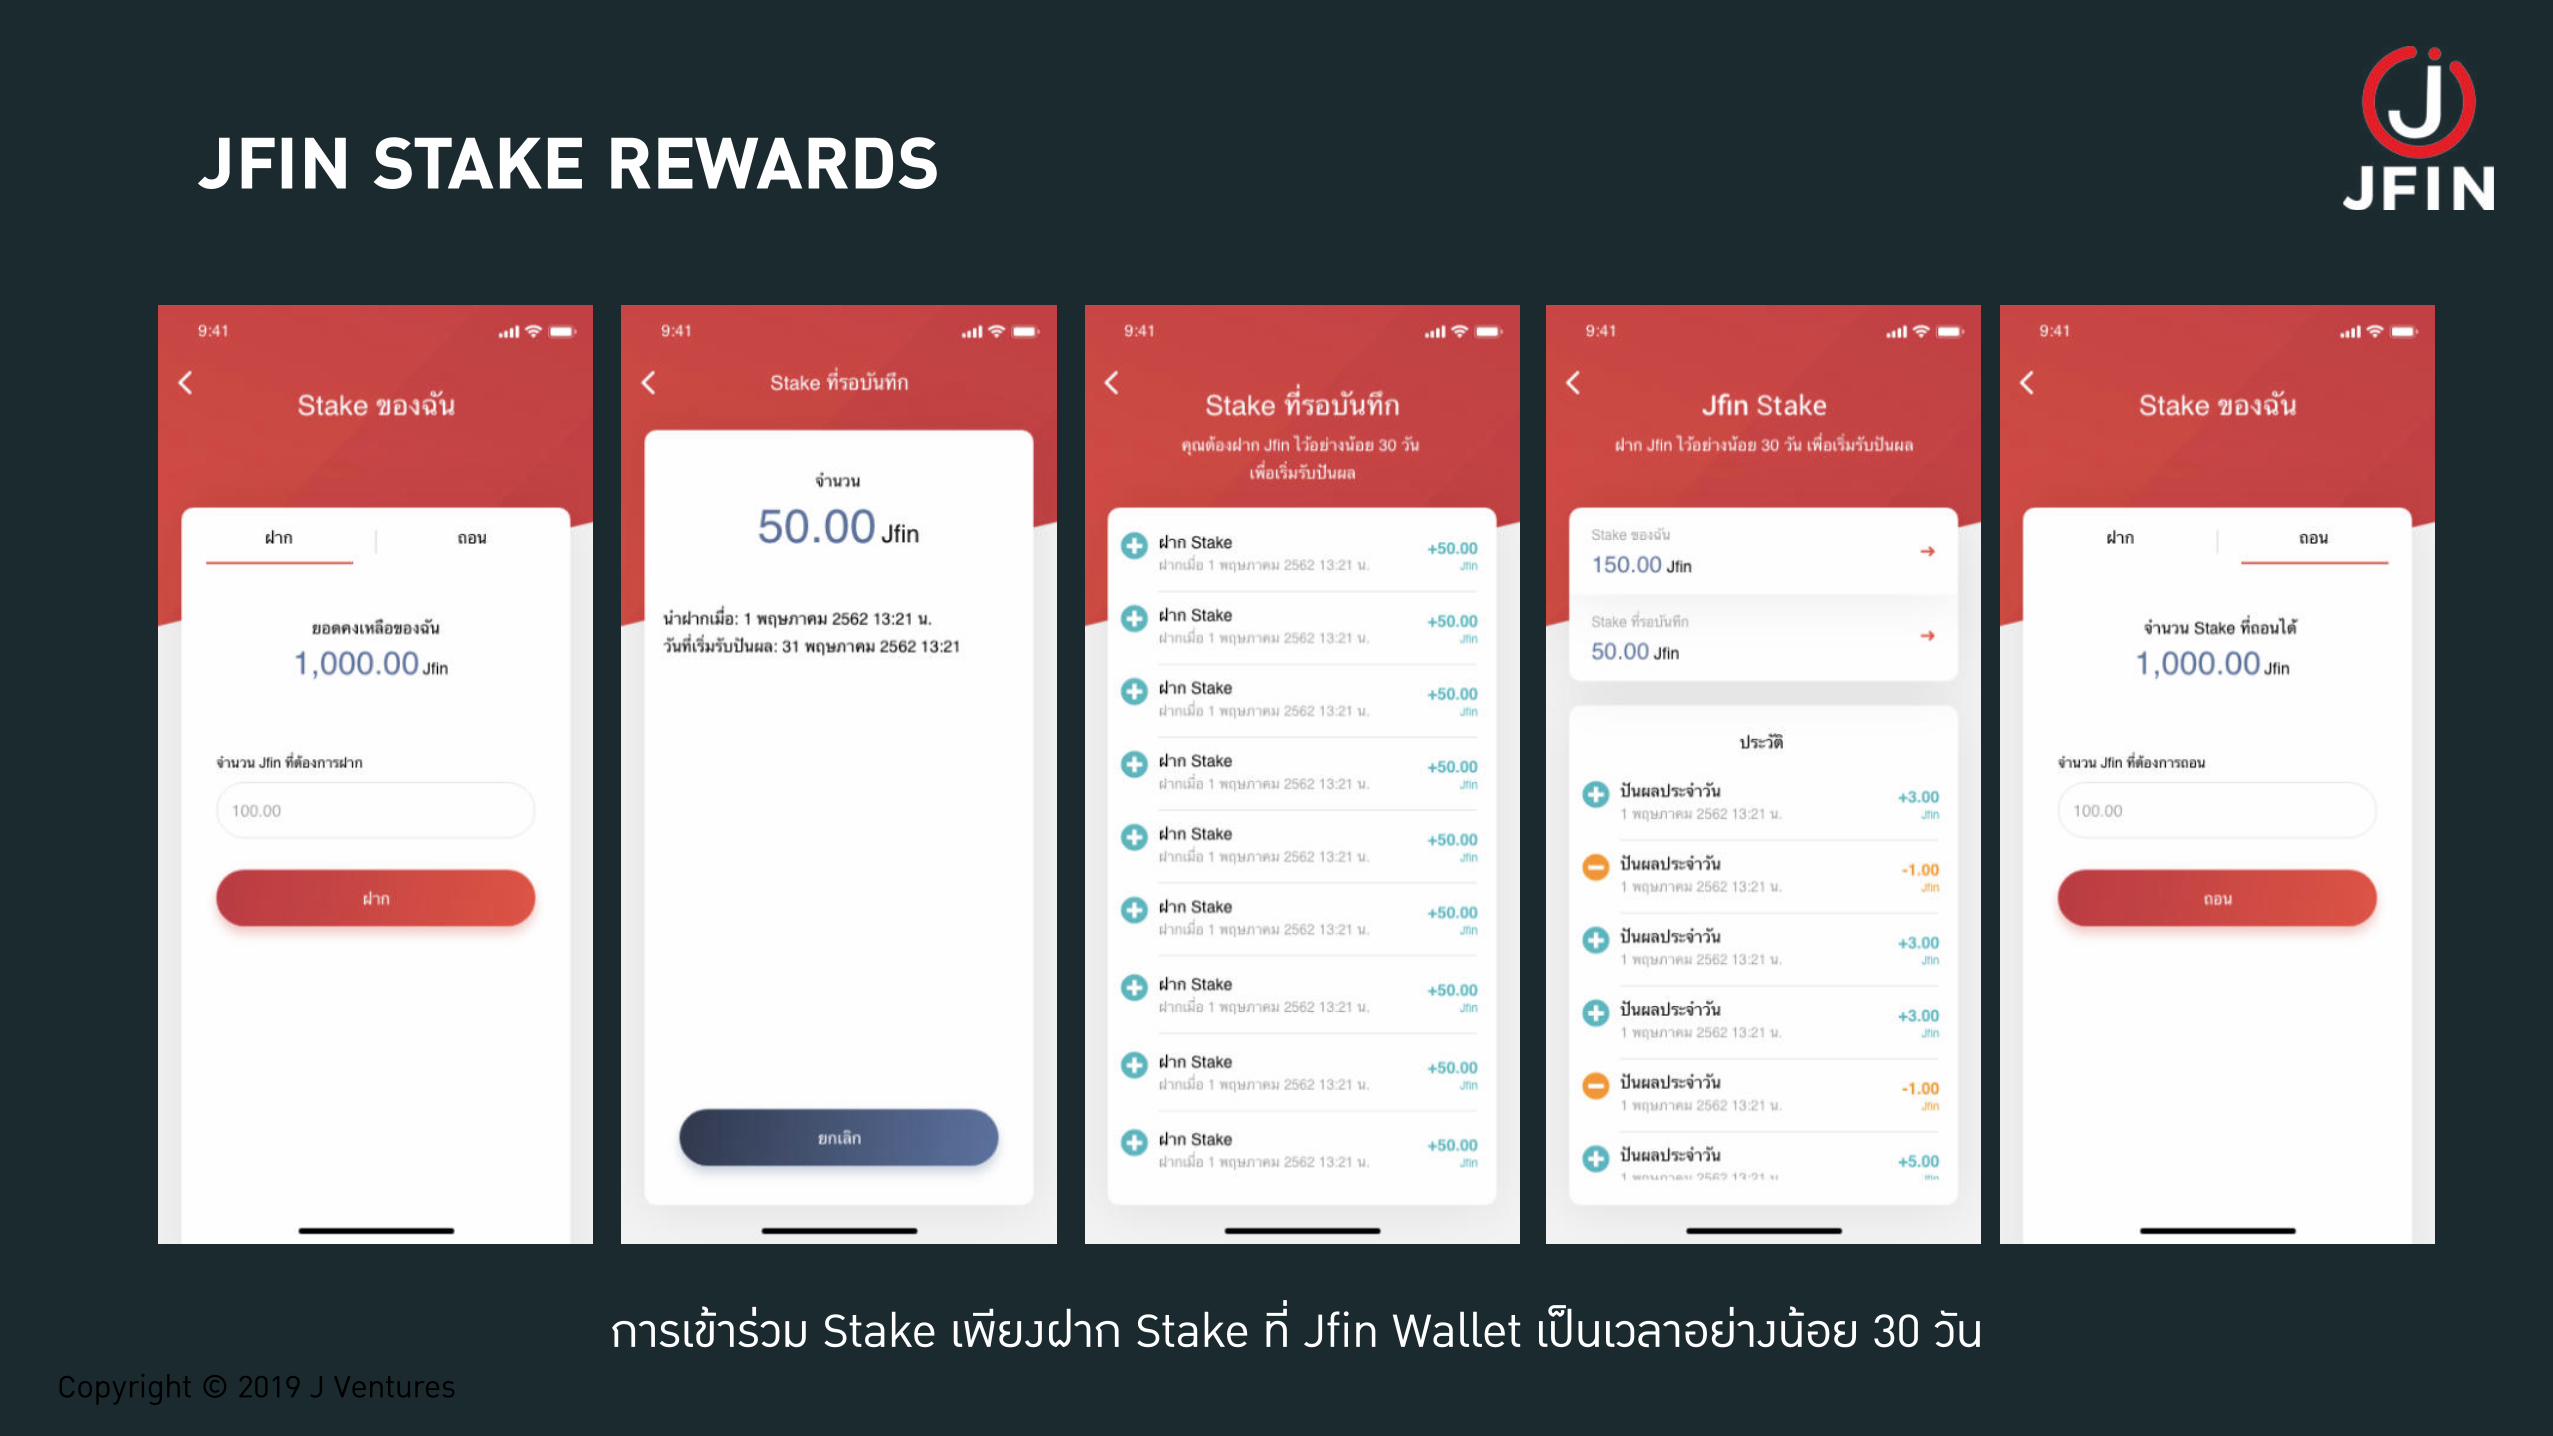
JFIN STAKE REWARDS
การเข�าร�วม Stake เพยงฝาก Stake ท Jfin Wallet เป�นเวลาอย�างน�อย 30 วน

Copyright © 2019 J Ventures
6,042,103.73
95JFIN STAKE REWARDS
Total Stakers
Total JFIN in JFIN Wallet
ข�อมล ณ วนท 19 สงหาคม 2562

Copyright © 2019 J Ventures
TOKENOMICS

© J Ventures 2019
TOKENOMICS
IDP NDID PLATFORM
J IDENTITY
PROVIDER
UNIVERSAL
POINT SYSTEM
LOYALTY POINT
EXCHANGE PLATFORM
CRYPTO
OTC
CRYPTO
LENDING
MICRO LENDING /
DEBT CROWD
FUNDING
CRYPTO OFFLINE
EXCHANGE
CRYPTO as LENDING
COLLATERALFRACTIONAL DEBT
MANAGEMENT
IDP is a services to enroll, identity proofing, and perform authentication of the identity for relying party. A service allow Digital Identity,
Digital Consent and Digital Signature for business in Thailand.
UPS is a loyalty Point Exchange Platform where customer can manage
and accumulate the major loyalty points into a single platform
Crypto OTC is an crypto offline exchange services for major
crypto where traveller can get instant cash directly from their
crypto wallet.

© J Ventures 2019
July August September October November December Q1 2020
JFIN Wallet Phase II
7 July 2019 Universal Point System (UPS) Phase 1
17 Sept 2019
Offline Exchange OTC
(Dealer / Broker license) Q1 2020
IDP
7 Dec 2019
Crypto Lending 26 Dec 2019
Debt Crowd Funding Q1 2020
TOKENOMICS MASTER PLAN
Crypto PayDigital Asset
Marketplace
ON HOLD
10,000 USERS
40,000 USERS
50,000 USERS
70,000 USERS
Universal Point System (UPS)
Phase 2 7 Nov 2019

© J Ventures 2018
Debt Crowdfunding Platform
BORROWER
LENDER
ESCROW
PLATFORM
REGISTAR
SECURITIES DEPOSITORY
SECURITIES
© J Ventures 2018
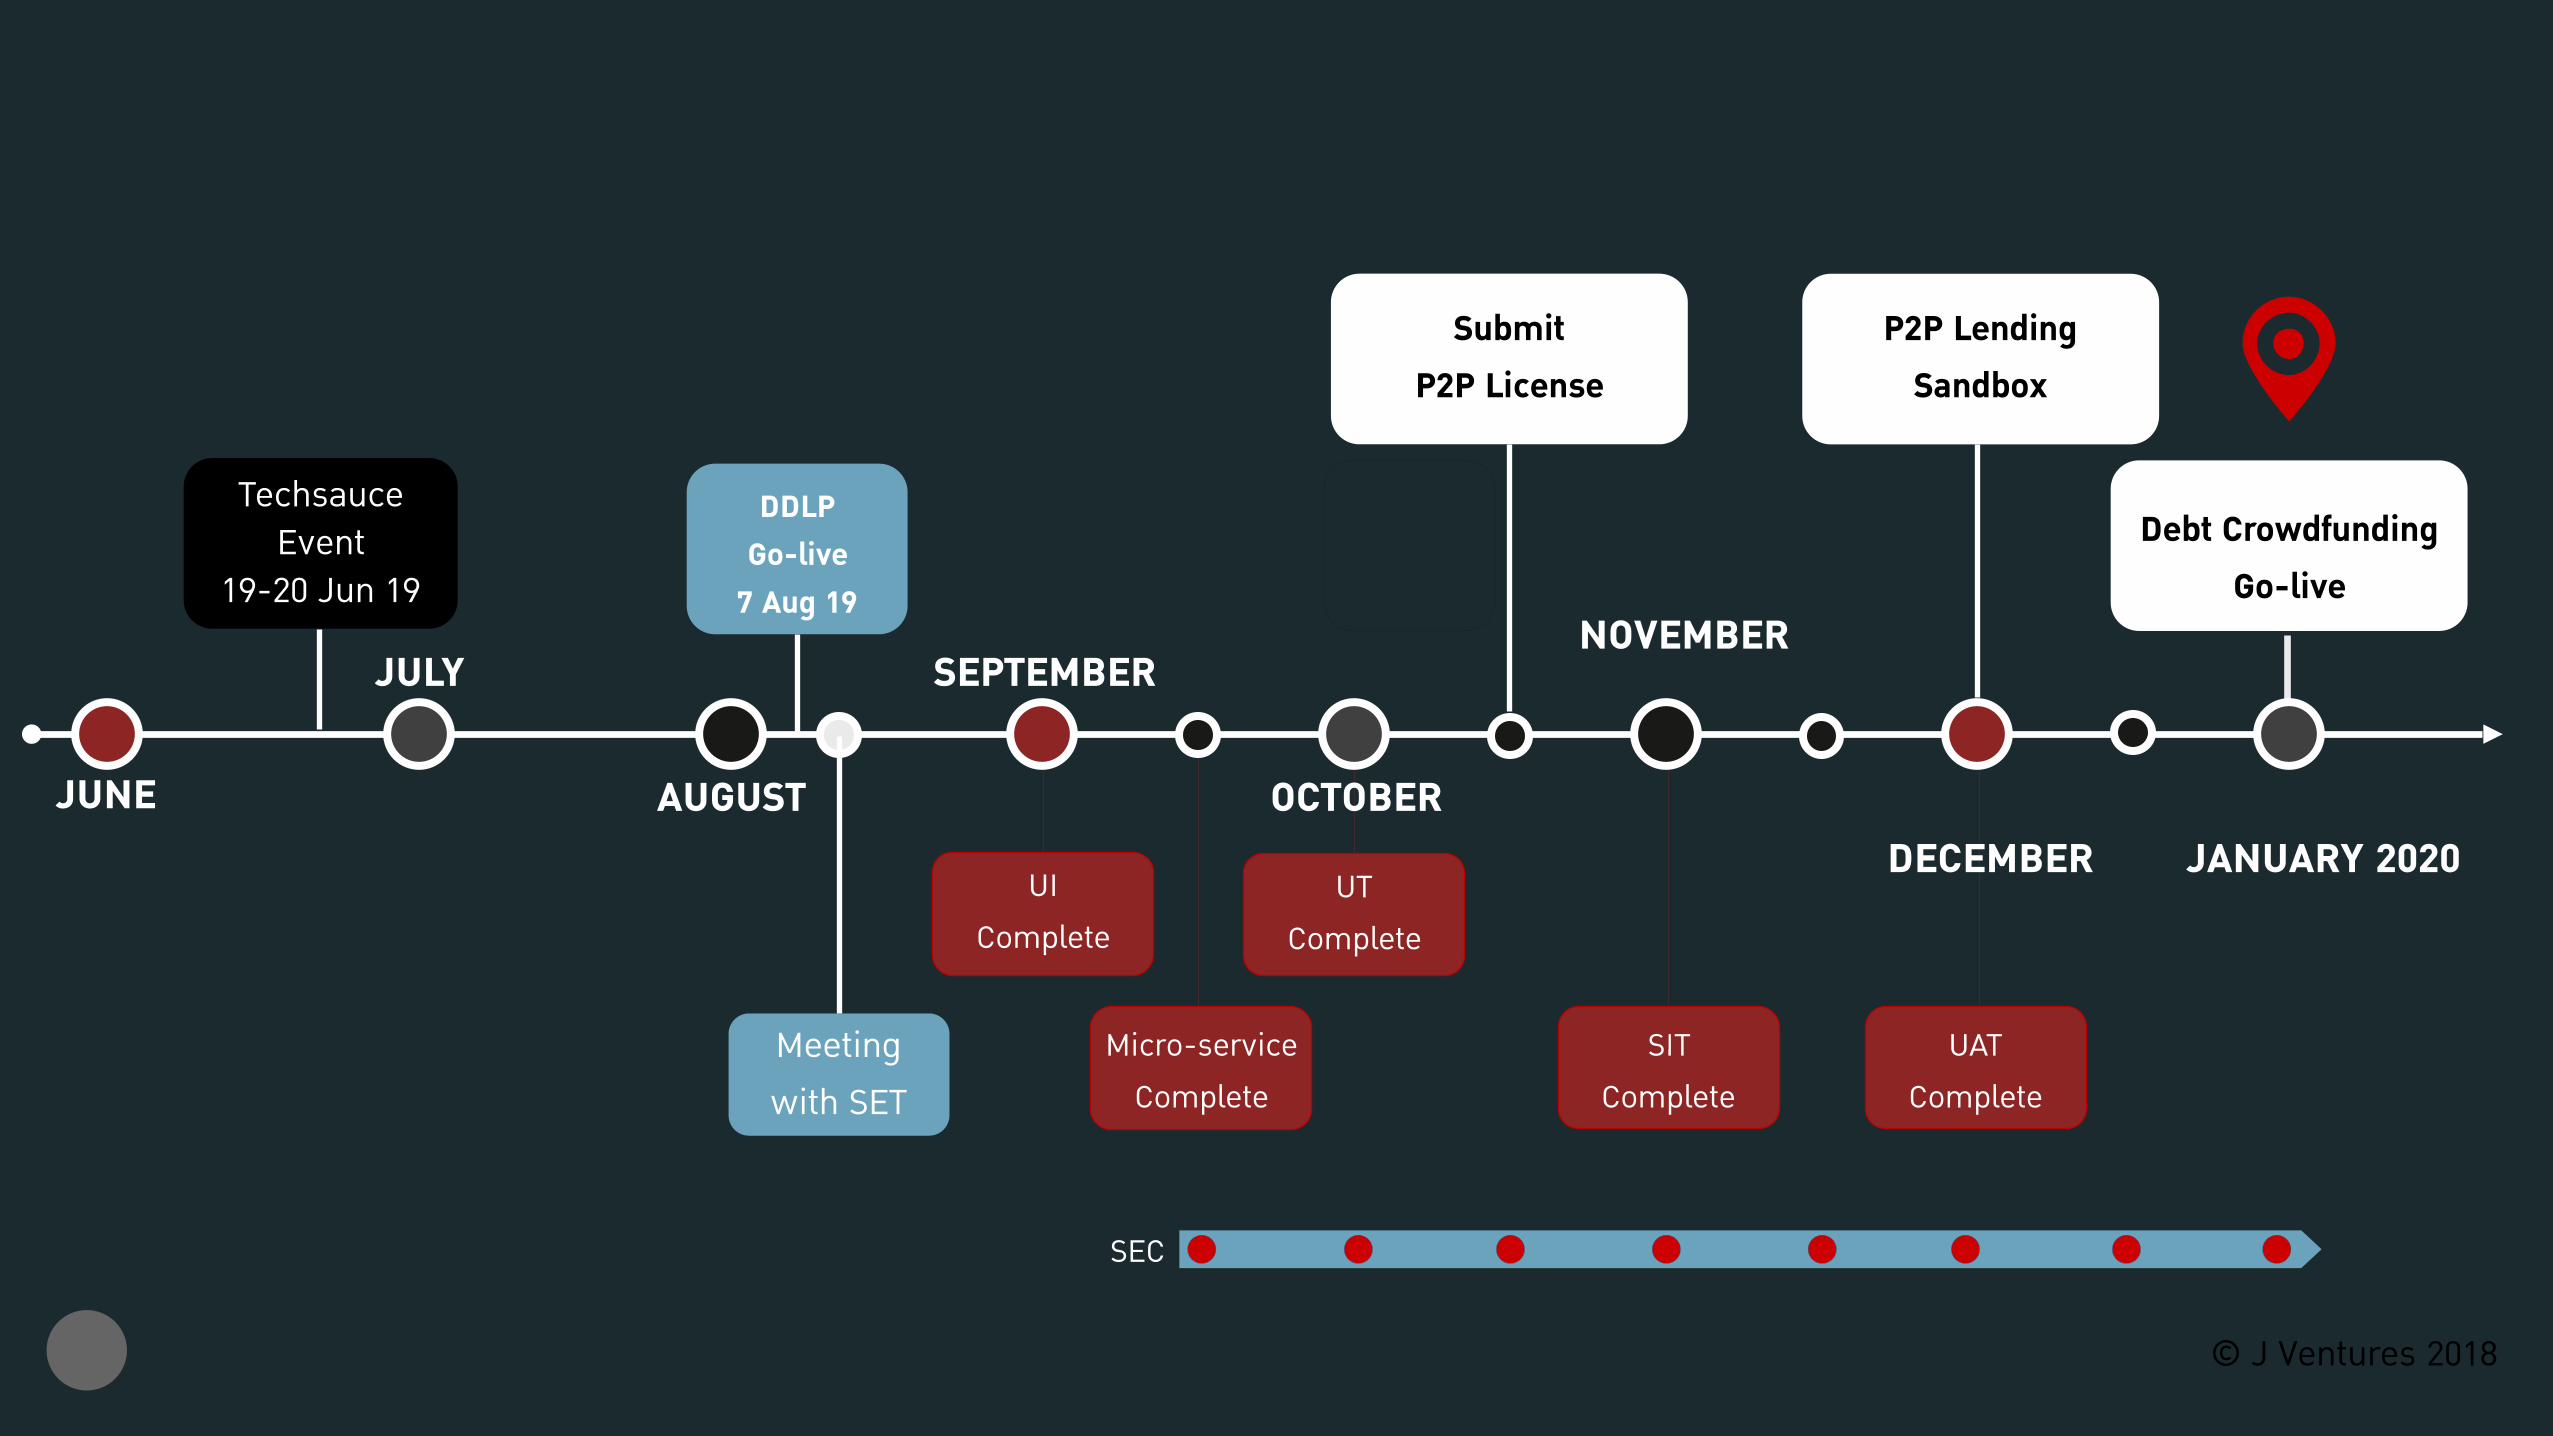
Techsauce Event
19-20 Jun 19
Debt Crowdfunding
Go-live
UI
Complete
SIT
Complete
P2P Lending
Sandbox
Submit
P2P License
UAT
Complete
DDLP
Go-live
7 Aug 19
SEC
UT
Complete
Micro-service
Complete
JULY SEPTEMBERNOVEMBER
JUNE AUGUST OCTOBER
DECEMBER JANUARY 2020
Meeting
with SET

UPS : Universal Personal System
CORPORATE POINTS
LOYALTY POINT EXCHANGE PLATFORM
SME POINTS
Point Issuing Point Exchange Point Transfer Point Wallet

RP Relying Party
IDP Identity Provider
AS Authoritative Source
1
2
3
4
5
6
7
Authentication on JFIN Wallet
Secure Storage eKYC App on Mobile Device
1
2.12.22.3
J IDENTITY PROVIDER

72
7,930
Data as of 20 Aug 2019

Jaymart Public Company Limited
Q&A
73
Follow us:
https://www.facebook.com/groups/JMART.JMT/