Session Lecture Cellular Automata - spatialcomplexity.info · Cellular Automata One and Two‐D ......
31
Centre for Advanced Spatial Analysis, University College London Centre for Advanced Spatial Analysis Session 4: Lecture 4: Session 4: Lecture 4: Cellular Automata Cellular Automata One and Two One and Two ‐ ‐ D Automata D Automata and the Beginnings of ABM and the Beginnings of ABM Michael Batty Michael Batty http://www.complexcity.info/ http://www.spatialcomplexity.info/ Lectures on Complexity and Spatial Simulation Lectures on Complexity and Spatial Simulation Thursday, 14 March 2013 Thursday, 14 March 2013 [email protected] @jmichaelbatty
Transcript of Session Lecture Cellular Automata - spatialcomplexity.info · Cellular Automata One and Two‐D ......

Centre for Advanced Spatial Analysis, University College LondonCentre for Advanced Spatial Analysis
Session 4: Lecture 4:Session 4: Lecture 4:
Cellular AutomataCellular AutomataOne and TwoOne and Two‐‐D Automata D Automata
and the Beginnings of ABMand the Beginnings of ABM
Michael BattyMichael Batty
http://www.complexcity.info/http://www.spatialcomplexity.info/
Lectures on Complexity and Spatial Simulation Lectures on Complexity and Spatial Simulation Thursday, 14 March 2013Thursday, 14 March 2013
[email protected]@jmichaelbatty

Centre for Advanced Spatial Analysis, University College LondonCentre for Advanced Spatial Analysis
OutlineOutline
• A Couple of Slides on Fractal Shapes that I Missed in the Last Lecture
• Some Fractal Shapes of Cities that Imply Cellular Growth
• Early Cellular Automata – One D CA ‐ NetLogo• The Games of Life ‐ NetLogo• Applications through Cellular Automata• Different Model Applications: DUEM – Demo• Moving to Agent‐Based Models: Schelling ‐ NetLogo

Centre for Advanced Spatial Analysis, University College LondonCentre for Advanced Spatial Analysis
It is 2‐d but when we crumple it we make it more than 2‐d
Other great examples are tree structures ….

Centre for Advanced Spatial Analysis, University College LondonCentre for Advanced Spatial Analysis
What is the dimension of a fractal tree? How much space does it fill?

Centre for Advanced Spatial Analysis, University College LondonCentre for Advanced Spatial Analysis
Fractal Shapes of Cities that Imply Cellular GrowthCities are excellent exemplars of complexity, no one really plans them. Look at cities across the world – the nightlights data show cities are more like organisms that evolve in a cellular way

Centre for Advanced Spatial Analysis, University College LondonCentre for Advanced Spatial Analysis

Centre for Advanced Spatial Analysis, University College LondonCentre for Advanced Spatial Analysis

Centre for Advanced Spatial Analysis, University College LondonCentre for Advanced Spatial Analysis
Early One Dimensional AutomataEarly One Dimensional Automata
Essentially we can define a line of cells and we then specify a rule that basically says that the cells changes from say black to white – empty to full – if a certain configuration of cells takes place in the neighborhood
Basically this generates lots of different configuration and we can see what happens over time when we string each change in the pattern on top of each other this producing patterns that might diverge or converge or oscillate over time as we show on the next slide – ok we will use Netlogo to show these ideas

Centre for Advanced Spatial Analysis, University College LondonCentre for Advanced Spatial Analysis

Centre for Advanced Spatial Analysis, University College LondonCentre for Advanced Spatial Analysis
The Game of LifeThe Game of Life
Imagine we have a world were you are located in space –randomly – then there are three rules – you spawn a new cell adjacent if there are two or three cells around you that are active – i.e. you are not active but you become active if there are two or three cells there
If you are active you die if there are more than 3 cells around you ie over population too much density
If you are active you die of there are 0 or 1 cells around you
I think that is it – what do we get – ok NetLogo again

Centre for Advanced Spatial Analysis, University College LondonCentre for Advanced Spatial Analysis
John Conway invented it – look at the Netlogo version for a further explanation and look at William Poundstone’s book The Random Universe. For a link to the Beatles look at this –http://www.nytimes.com/1993/10/12/science/scientist-at-work-john-h-conway-at-home-in-the-elusive-world-of-mathematics.html?pagewanted=all&src=pm
John Lennon didn’t go the same school but he went to the one I did go to http://jmichaelbatty.wordpress.com/school/

Centre for Advanced Spatial Analysis, University College LondonCentre for Advanced Spatial Analysis
Applications through Cellular AutomataApplications through Cellular AutomataTo illustrate how CA works, we first define• a grid of cells, ( or it could be irregular but to simplify we will
assume a square grid)• a neighbourhood around each cell which is composed of the
nearest cells, • a set of rules as to how what happens in the neighbourhood
affects the development of the cell in question• a set of states that each cell can take on – i.e. developed or
not developed• an assumption of universality that all these features operate
uniformly and universally

Centre for Advanced Spatial Analysis, University College LondonCentre for Advanced Spatial Analysis
This defines a (cellular) automata machine that can be applied to all cells that define the system: i.e. each cell is an automata
Some things to note: cells are irregular and not necessarily spatially adjacent.
Neighbourhoods can be wider then those which are formed from nearest neighbours‐ they could be formed as fields –like interaction fields around a cell
Strict CA are models whose rules work on neighbourhoods defined by nearest neighbours and exhibit emergence – i.e. their operation is local giving rise to global pattern
Cell‐space models can relax some or all of these rules

Centre for Advanced Spatial Analysis, University College LondonCentre for Advanced Spatial Analysis
(a) (b) (c)The neighbourhood iscomposed of 8 cells
around the central cell
Place the neighbourhood over each cell on the grid. The rule says that if there
is one or more cells developed (black) in theneighbourhood, then the
cell is developed.
If you keep on doing this for every cell, you get the diffusion from the central cell shown below.
This is how a CA works defined on a square grid of cells with two states – not developed and developed

Centre for Advanced Spatial Analysis, University College LondonCentre for Advanced Spatial Analysis
These are strictly deterministic CA models and we can have different shaped local neighbourhoods composed of different combinations of cells e.g.
(a) Moore
(b) von Neumann
(c) Extended Moorevon Neumann

Centre for Advanced Spatial Analysis, University College LondonCentre for Advanced Spatial Analysis
And we can have probabilistic fields defining neighbourhoods where there is a probability that a cells changes state –where the probabilities might vary regularly reflecting say action‐at‐a‐distance principles e.g.
We will now show some examples of how one can generate idealised patterns that illustrate emergence

Centre for Advanced Spatial Analysis, University College LondonCentre for Advanced Spatial Analysis
For example, for any cell {x,y}, • if only one neighborhood cell either NW, SE, NE, or SW
other than {x,y} is already developed,• then cell {x,y} is developed according to the following
neighborhood switching rule
And changingThere rules in various ways lead tomany different patterns

Centre for Advanced Spatial Analysis, University College LondonCentre for Advanced Spatial Analysis

Centre for Advanced Spatial Analysis, University College LondonCentre for Advanced Spatial Analysis
For probabilistic rules, we can generate statistically self‐similar structures which look more like real city morphologies. For example,
ifif any neighborhood cell other than {x,y} is already developed, thenthen the field value p {x,y} is set &&ifif p {x,y} > some threshold value, thenthen the cell {x,y} is developed

Centre for Advanced Spatial Analysis, University College LondonCentre for Advanced Spatial Analysis
Here are the constructions we have seen overlayed so you can see how neighbourhood rules make a distinct difference

Centre for Advanced Spatial Analysis, University College LondonCentre for Advanced Spatial Analysis
We can steer the development in different ways by constructing rules based on ‘ruling’ out or ‘admitting’certain cells for development – embodying constraints –Look at the paper I circulated from AD

Centre for Advanced Spatial Analysis, University College LondonCentre for Advanced Spatial Analysis
Different Model ApplicationsDifferent Model ApplicationsAt least 12 groups around the world, probably more
developing these kinds of model• White and Engelen, RIKS, Holland – GeoDynamica, METROnamicaGeoDynamica, METROnamica• Clarke, UCSB/NCGIA, USA – SLEUTHSLEUTH• Yeh and Li, Hong Kong – Pearl River – RS bias• Wu/Webster – Southampton/Cardiff – urban economics• Xie/Batty – Ypsilanti/London, US/UK – DUEMDUEM• Cechinni/Viola – Venice, Italy – AUGH• Rabino/Lombardi – Milan/Turin, Italy – NN Calibration• Semboloni – Florence, Italy – links to traditional LU models• Phin/Murray – Brisbane/Adelaide, Aus – visualization• Portugali/Benenson – Tel‐Aviv, Israel – CITYCITYmodels• Various applications in INPE (Brazil), China (Beijing), Japan, Portugal, Taiwan,
Canada, Haifa (Technion), Ascona, France (Pumain’s group), Louvain‐la‐Neuve, Netherlands (ITC), JRC (Ispra+Dublin+RIKS), even at CASA Kiril Stanilov’s model

Centre for Advanced Spatial Analysis, University College LondonCentre for Advanced Spatial Analysis
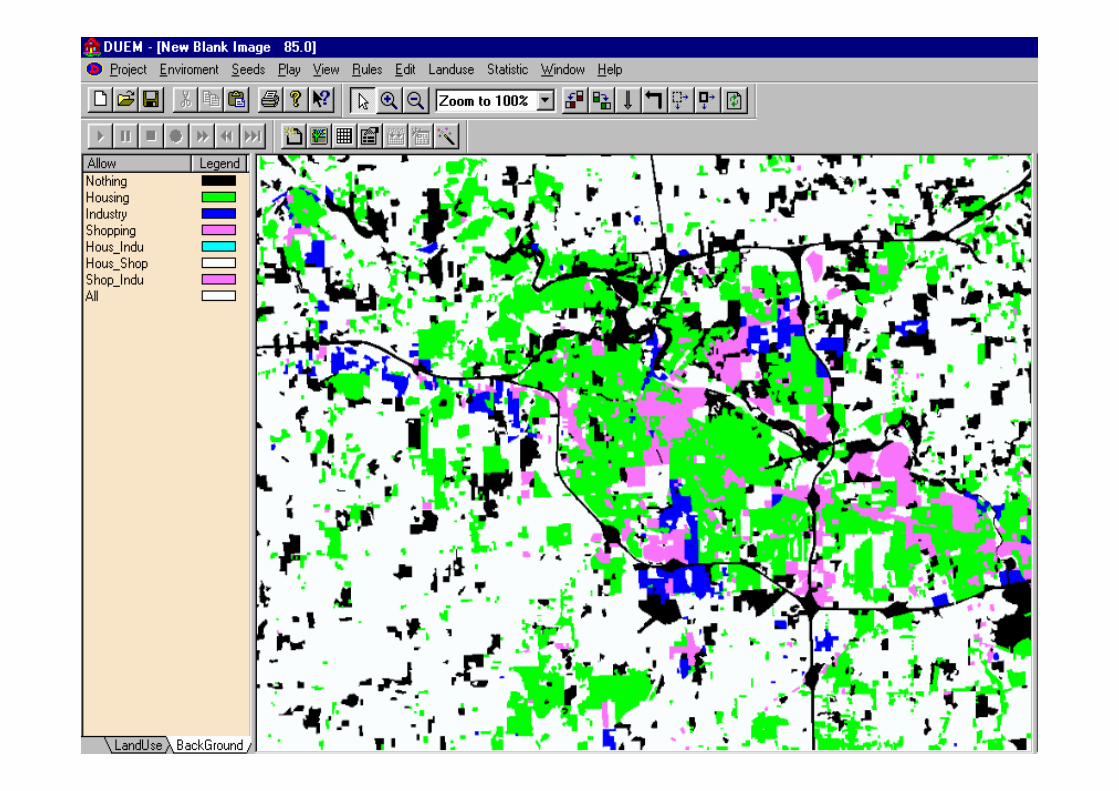
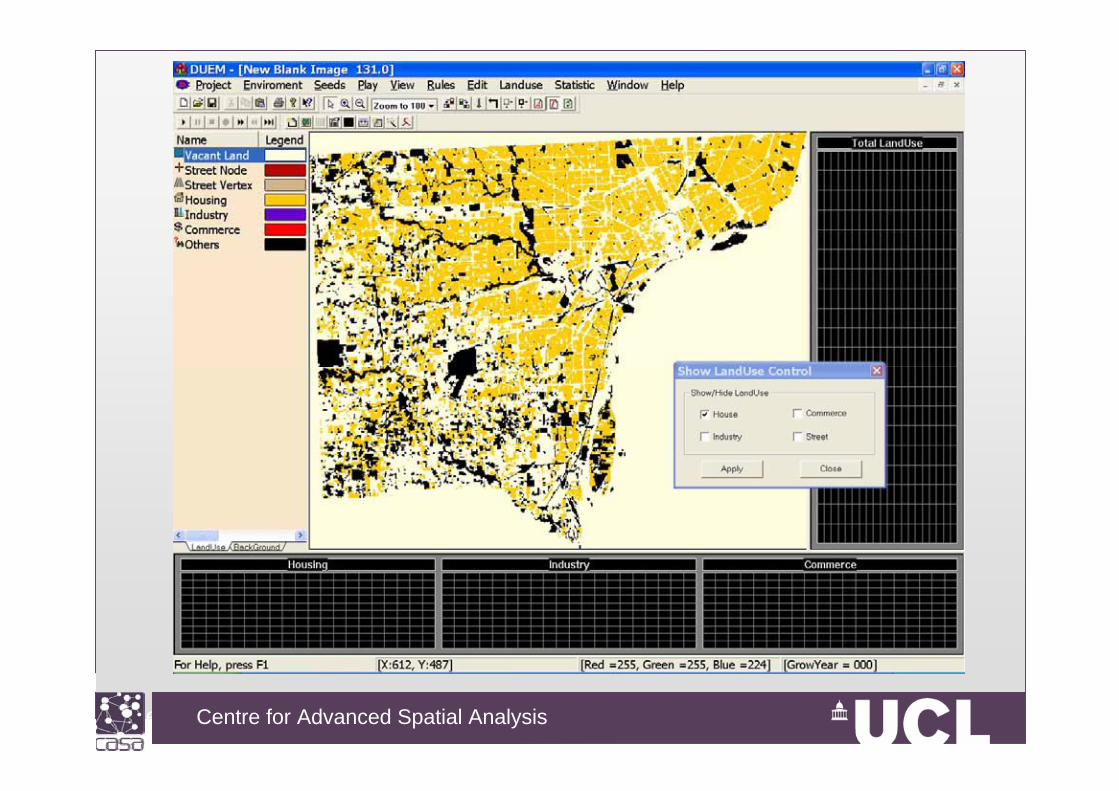
DUEM DUEM –– Dynamic Urban Evolutionary ModelDynamic Urban Evolutionary ModelLet me demo it first – you can download it fromhttp://www.bartlett.ucl.ac.uk/casa/latest/software/duem‐caCaveat Emptor – it is very very old – you can read about in my C&C book ….
Centre for Advanced Spatial Analysis, University College LondonCentre for Advanced Spatial Analysis

Centre for Advanced Spatial Analysis, University College LondonCentre for Advanced Spatial Analysis

Centre for Advanced Spatial Analysis, University College LondonCentre for Advanced Spatial Analysis
Centre for Advanced Spatial Analysis, University College LondonCentre for Advanced Spatial Analysis

Centre for Advanced Spatial Analysis, University College LondonCentre for Advanced Spatial Analysis
Moving to AgentMoving to Agent‐‐Based Models: Schelling Based Models: Schelling ‐‐NetLogoNetLogo
Ok this model essentially redistributes people – we divide our landscape up into two types of people and we allocate them randomly.
Now the rule is dead simple – if there are more people of another type than yourself in your Moore 8x8 cell neighbourhood, you switch your type or opinion
If there are less you do not shift – i.e. you are quite happy say with 50‐50 of each type – but unhappy with a majority against you – this is not blind prejudice but mild preference

Centre for Advanced Spatial Analysis, University College LondonCentre for Advanced Spatial Analysis
From a random distribution of two unlike groups, each with a very mild preference to live amongst their own kind, people shift if more than half are different, the picture unravels and dramatic segregation emerges. Netlogo demo

Centre for Advanced Spatial Analysis, University College LondonCentre for Advanced Spatial Analysis
GIS,Spatial Analysis & Modelling GIS,Spatial Analysis & Modelling (ESRI Press, 2005) (ESRI Press, 2005) Various chapters – my own with Yichun Xie
but also that by Mike Wegener on land use transport models

Centre for Advanced Spatial Analysis, University College LondonCentre for Advanced Spatial Analysis
Questions,Questions,Discussion?Discussion?