Session 9: Photovoltaic System Case Studies And · PDF filePhotovoltaic System Case Studies...
35
October 21, 2015 – Santiago, Chile Michael Coddington National Renewable Energy Laboratory Golden, Colorado, U.S.A. Session 9: Photovoltaic System Case Studies And Electric Distribution Planning for DER
Transcript of Session 9: Photovoltaic System Case Studies And · PDF filePhotovoltaic System Case Studies...
October 21, 2015 – Santiago, Chile
Michael Coddington
National Renewable Energy Laboratory
Golden, Colorado, U.S.A.
Session 9:
Photovoltaic System Case Studies
And Electric Distribution Planning for DER

DISCLAIMER
ISGAN is an initiative of the Clean Energy Ministerial (CEM). It is formally
organized as the Implementing Agreement for a Co-operative Programme
on Smart Grids (ISGAN), operating under a framework of the International
Energy Agency (IEA). The views, findings and opinions expressed herein do
not necessarily state or reflect those of any of ISGAN’s participants, any of
their sponsoring governments or organizations, the CEM, the IEA
Secretariat, or any of the IEA’s member countries. No warranty is expressed
or implied, no legal liability or responsibility is assumed for the accuracy,
completeness, or usefulness of any information, apparatus, product, or
process disclosed, and no representation is made that its use would not
infringe privately-owned rights. Reference herein to any specific
commercial product, process, or service by trade name, trademark,
manufacturer, or otherwise does not necessarily constitute or imply its
endorsement, recommendation, or favoring.

Case Study #1 – 5.2 MVA
Located at Colorado State University (Fort Collins, CO, USA)
5.2 MWDC PV System 6.6 miles from substation
Installed in 2 phases (2 MW + 3.2 MW)
Capacity penetration - 57% (Σ DG / Peak Load)

Case Study #1 – 5.2 MVA
Peak Load on Circuit – 9.1 MVA Circuit Voltage – 13,200 Volts

Details of PV System and Customer
• Large Conductors serving Colorado State University West Research Campus
• Two sets of voltage regulators on circuit and LTC at substation
• Voltage at campus requested to be ± 1% (per unit)
• The following steps are to be followed, sequentially, if there are voltage problems (next slide)

Planned Steps if Problems Occured
1. Adjust the voltage regulators to stabilize the voltage levels, and if necessary;
2. The inverters (10 total) will be configured to absorb 100 kVAR each to reduce voltage rise, and if necessary;
3. The inverter configurations will be changed so they will absorb 150 kVAR each, and if necessary;
4. Request that PV system operator disconnect part or all of the PV system and install a power factor controller or static VAR compensator (SVC)
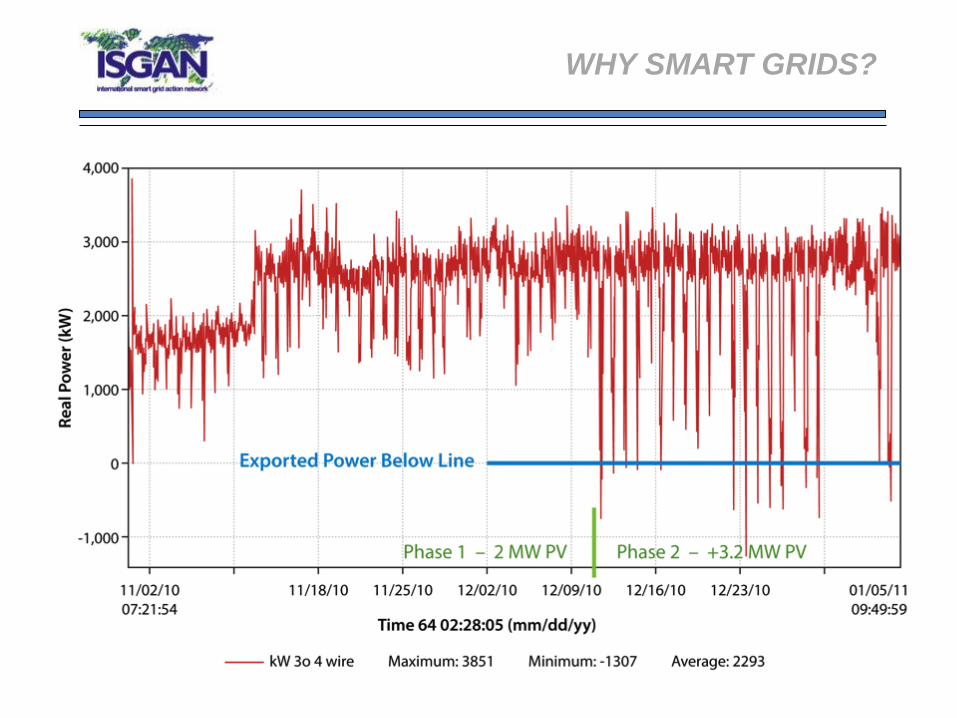
WHY SMART GRIDS?

Staggered Start for Inverters Required
Inverter No. Start-up time Inverter Size
1 230 sec. 500kW
2 260 sec. 500kW
3 290 sec. 500kW
4 320 sec. 500kW
5 350 sec. 500kW
6 380 sec. 500kW
7 410 sec. 500kW
8 440 sec. 500kW
9 470 sec. 500kW
10 500 sec. 500kW

Feeder Load Profile with PV
Can you see the “Duck Curve” shape?

Common PV “Penetration” Metrics
• Capacity Penetration* ≈ Total PV System MW
Peak Load MW
• Energy Penetration ≈ Total DG kWh
Total kWh
• Penetration Screen Fails at 100% MDL or 15% peak load (depending on rules)
* This is how “Penetration” is calculated in Technical Screens

Observations
• This large PV system behaved well on a typical distribution circuit
• This distribution feeder circuit is very “stiff” and has excellent capacity for absorbing DG of this size
• While this PV system required no system upgrades, most of this size would likely require system modifications

Case Study #2 – 20 kW Residential PV

Typical Voltage Drop for Utility Loads

Case Study #2 – One-Line Diagram

Very High Voltage behind Transformer
131.5 Volts +9.5%

Case Study #2 – 20 kW Residential PV
Voltage rises with minimal local load
The ANSI C84.1 (Range A) upper limit is violated at the PV system, and worst violation at the micro-inverters farthest from the service disconnect
This facility experienced 127.5 Volts at the utility meter and 131 Volts at the PV array (ANSI Range A upper limit 126 Volts)
Local load will affect voltage levels significantly
This residential system exports power during the day, which is when most residents are out or using little power. The exported power causes voltage problems locally

Case Study #2 – 20 kW Residential PV
• Steady-state voltage can be out of acceptable ANSI C84.1 range A (or B) with even with a small residential PV system
• This PV system, if only one of a few small PV systems on this feeder, means capacity penetration was <1%, yet there are localized voltage problems. In reality, this system should have failed a review and required mitigation!
• No other utility customers were negatively impacted by this high voltage example
Would you have known there might be a problem with this interconnection application?

Case Study #3 – 10 MVA Solar PV
Carlsbad, New Mexico, US

Case Study #3 – 10 MVA Solar PV
Carlsbad, New Mexico, US
Located near Carlsbad, New Mexico
10 MWDC PV System - 3/4 Mile from Substation
Capacity Penetration of Approximately 100% based on peak annual load
Minimum daytime load on feeder 3.87 MVA
(Capacity Penetration ~300%)

Case Study #3 – 10 MVA Solar PV
Carlsbad, New Mexico, US
• Interconnection with Xcel Energy
• Distribution voltage 12.47 kV
• Hopi Substation transformer bank size
16.8 MVA
• Peak Load on feeder 10 MVA
• Minimum Daytime Load on feeder 3.87
MVA
• Circuit conductor ¾ mile 336 ACSR from
PV system to substation

Case Study #3 – Detailed Impact Studies
SynerGEE modeling program utilized for Detailed Impact Studies
The following issues were focused on during detailed impact study phase
•Fault current contribution
•Protection coordination
•Voltage profiling studies

Case Study #3 – Mitigation Strategies
1. ¾ mile of 336 ACSR feeder conductors installed
2. Additional line protection added to address “desensitized relaying”
3. Voltage supervised reclosing was added to the substation breakers to address potential problems with PV system size
4. PV owner was required to regulate their output power factor to a fixed value to address possible voltage issues.
5. Additionally the PV owner was required to energize the inverters incrementally in order to avoid large voltage steps.

Case Study #3 – Conclusions
Detailed Impact Studies were required to interconnect this very large PV system
This PV systems exports power to the substation, and back through the substation transformer Load Tap Changer (LTC)
Large conductors, short distance to substation were key to the success of this system
Mitigation strategies were required
The PV system and the utility feeder and substation have operated properly since PV system installation

Important Considerations for Siting Locations
PV System Size
Distance from Substation (MW-Ω)
System Impedance at PV location
Distribution Circuit/Substation Design (conductor sizes, regulators, LTCs, etc.)
Voltage Regulators & Capacitors
Exporting vs. Non-Exporting PV systems
Proximity to Other Loads on Circuit
Types of Utility Customers on Circuit

Case Study #4 – Colorado Convention
Center – Denver, CO, USA
• Facility Name: Colorado Convention Center
• Owner: City and County of Denver
• Secondary Network Type: Spot
• PV System Size: 300 kWp DC
• Type of Interconnection – – Minimum Facility Load greater than PV System
– Reverse Power Relay
– Dynamically Controlled Inverters
• Utility Company: Xcel Energy (PSCo)

Case Study #4 – Colorado Convention
Center – Denver, CO, USA

Case Study #4 – Colorado Convention
Center – Denver, CO, USA

Network System Integration Approaches
• Maintain minimum load (MML)
• Reverse power relays (RPR)
• Minimum import relays (MIR)
• Dynamically controlled inverters (DCI)

Maintain Minimum Load Approach
• Study of historical load data – generally supplied by utility (interval recorder data)
• Evaluate minimum demand during peak PV generation hours (10 AM – 2 PM)
• Interval data estimates demand based on energy usage over 15 minutes (typical)
• Is an indicator that PV system will be sized smaller than minimum daytime load

Reverse Power Relay Approach
• Opens circuit breaker tied to PV system if power flows toward utility network
• Technology is well-known by utility protection engineers
• Advantages
– Fairly inexpensive, fast, reliable
• Disadvantages
– Manual reset, all-or-nothing

Minimum Import Relay Approach
• Opens circuit breaker tied to PV system if power into facility drops below threshold (e.g. 25kVA)
• Similar to reverse power relay – utility engineers are familiar with technology
• Advantages
– Inexpensive, fast, reliable
– Better than RPR for network reliability
• Disadvantages
– Manual reset, all-or-nothing
Dynamically Controlled Inverter Approach
• Reduces PV output by % based on actual load of facility (e.g. 25kVA)
• CTs tie to bus near utility metering
Features – Very fast response
– Programmable
– No resetting of breakers necessary
– Some loss of energy if activated
– Inexpensive (~$5k)
– May not be available on all inverters

DCI (Smart Inverter) Results

Case Study #4 – Colorado Convention
Center – Denver, CO, USA
NREL Technical Report
NREL/TP-550-45061

Gracias