Session 5 - Cost of Capital
49
Cost of Capital Spring / Summer 2007 BA 6323 Jeffrey Allen, Ph.D.
-
Upload
muhammad-hanafi -
Category
Documents
-
view
220 -
download
0
Transcript of Session 5 - Cost of Capital

8/4/2019 Session 5 - Cost of Capital
http://slidepdf.com/reader/full/session-5-cost-of-capital 1/49
Cost of Capital
Spring / Summer 2007
BA 6323
Jeffrey Allen, Ph.D.
8/4/2019 Session 5 - Cost of Capital
http://slidepdf.com/reader/full/session-5-cost-of-capital 2/49
Topics in this Section
Capital Market History
Measuring Risk in a Portfolio
Types of Risk Diversification & Portfolio Theory
Risk and Return Relationships
Measuring the Cost of Equity Capital Asset Pricing Model (CAPM) & Beta
Company-Specific Costs of Capital

8/4/2019 Session 5 - Cost of Capital
http://slidepdf.com/reader/full/session-5-cost-of-capital 3/49
A $1 Investment in 1900
$1
$10
$100
$1,000
$10,000
$100,000
1 9 0 0
1 9 1 0
1 9 2 0
1 9 3 0
1 9 4 0
1 9 5 0
1 9 6 0
1 9 7 0
1 9 8 0
1 9 9 0
2 0 0 0
D o l l a r s
Common Stock
US Govt Bonds
T-Bills
15,578
147
61
2 0 0 4

8/4/2019 Session 5 - Cost of Capital
http://slidepdf.com/reader/full/session-5-cost-of-capital 4/49
A $1 Investment in 1900
$1
$10
$100
$1,000
1 9 0 0
1 9 1 0
1 9 2 0
1 9 3 0
1 9 4 0
1 9 5 0
1 9 6 0
1 9 7 0
1 9 8 0
1 9 9 0
2 0 0 0
D o l l a r s
Equities
Bonds
Bills
719
6.81
2.80
2 0 0 4
Real Returns

8/4/2019 Session 5 - Cost of Capital
http://slidepdf.com/reader/full/session-5-cost-of-capital 5/49
Average Market Risk Premia
4.3 4.7 5.1 5.3 5.8 5.9 5.9 6.3 6.4 6.67.6 8.1 8.2 8.6
9.310
10.7
0
1
2
3
4
56
7
8
9
10
11
D e n m a r k
B e l g i u m
S w i t z e r l a n
d
S p a i n
C a n a d a
I r e l a n d
G e r m a n
y
U K
A v e r a g
e
N e t h e r l a n d
s
U S A
S w e d e n
S o u t h A f r i c
a
A u s t r a l i
a
F r a n c
e
J a p a n
I t a l
y
Risk premium, %
Country

8/4/2019 Session 5 - Cost of Capital
http://slidepdf.com/reader/full/session-5-cost-of-capital 6/49
Rates of Return 1900-2003
Source: Ibbotson Associates
-60%
-40%
-20%
0%
20%
40%
60%
80%
1900 1920 1940 1960 1980 2000
Year
P e r c e n t a g e R e t u r n
Stock Market Index Returns

8/4/2019 Session 5 - Cost of Capital
http://slidepdf.com/reader/full/session-5-cost-of-capital 7/49
Market Performance
1 1
4
1012
19
15
24
13
32
0
4
8
12
16
20
24
- 5 0 %
t o - 4 0 %
- 4 0 %
t o - 3 0 %
- 3 0 %
t o - 2 0 %
- 2 0 %
t o - 1 0 %
- 1 0 %
t o 0 %
0 %
t o 1 0 %
1 0 %
t o 2 0 %
2 0 %
t o 3 0 %
3 0 %
t o 4 0 %
4 0 %
t o 5 0 %
5 0 %
t o 6 0 % Return %
# of Years Histogram of Annual Stock Market Returns

8/4/2019 Session 5 - Cost of Capital
http://slidepdf.com/reader/full/session-5-cost-of-capital 8/49
Types of risk
Unique Risk (also called “diversifiable risk”):
Unique risk associated with the assets owned by the company
Industry risks, e.g. competition, innovation, R&D dependence, etc.
Risk related to outstanding debt (financial leverage)
Age, size and stability of the organization
Market Risk (also called “systematic risk”):
Economic volatility
Inflation
Political or other events that impact stability or the value of assets
Changes in interest rates
8/4/2019 Session 5 - Cost of Capital
http://slidepdf.com/reader/full/session-5-cost-of-capital 9/49
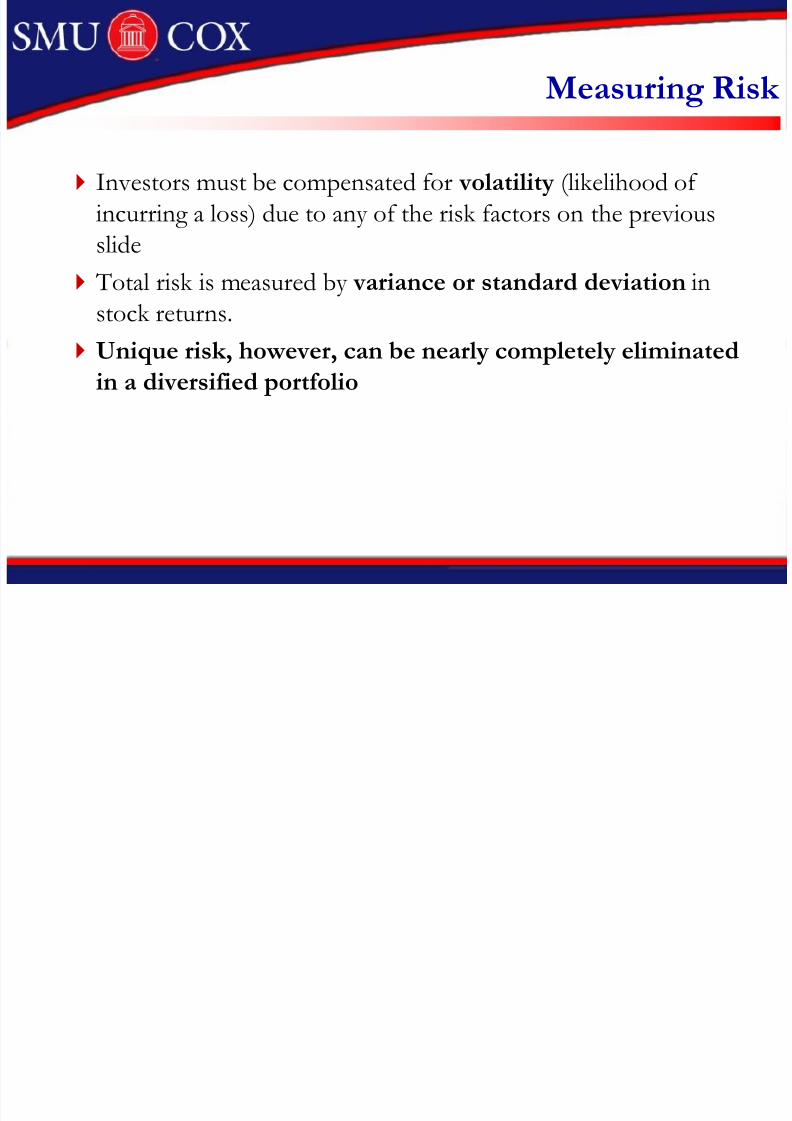
Measuring Risk
Investors must be compensated for volatility (likelihood of incurring a loss) due to any of the risk factors on the previousslide
Total risk is measured by variance or standard deviation instock returns.
Unique risk, however, can be nearly completely eliminated
in a diversified portfolio

8/4/2019 Session 5 - Cost of Capital
http://slidepdf.com/reader/full/session-5-cost-of-capital 10/49
Portfolio Theory
Price changes vs. Normal distribution
Coca Cola - Daily % change 1987-2004
0
0.02
0.04
0.06
0.08
0.1
0.12
0.14
-9 -7 -5 -3 -1 0 2 4 6 7
P r o p o r t i o n o f D
a y s
% daily change
8/4/2019 Session 5 - Cost of Capital
http://slidepdf.com/reader/full/session-5-cost-of-capital 11/49
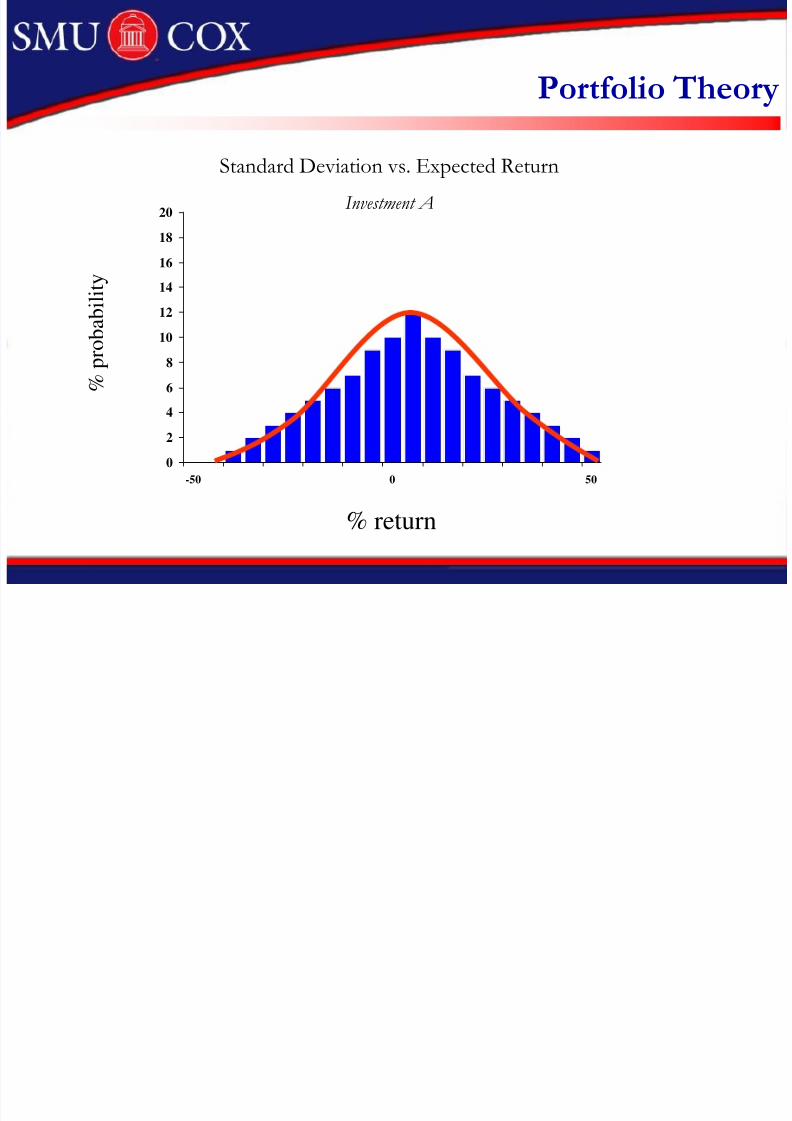
Portfolio Theory
Standard Deviation vs. Expected Return
Investment A
0
2
4
6
8
10
12
14
16
18
20
-50 0 50
% p
r o b a b i l i t y
% return
8/4/2019 Session 5 - Cost of Capital
http://slidepdf.com/reader/full/session-5-cost-of-capital 12/49
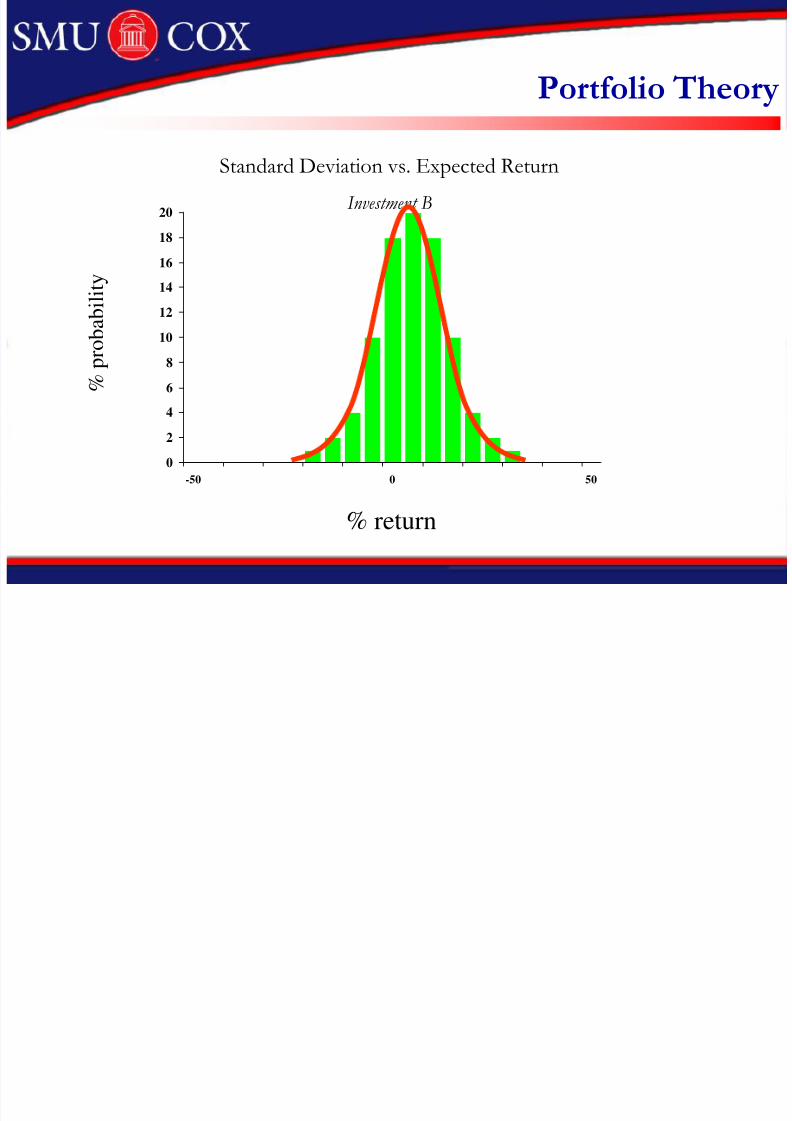
Portfolio Theory
Standard Deviation vs. Expected Return
Investment B
0
2
4
6
8
10
12
14
16
18
20
-50 0 50
% p
r o b a b i l i t y
% return

8/4/2019 Session 5 - Cost of Capital
http://slidepdf.com/reader/full/session-5-cost-of-capital 13/49
Portfolio Theory
Standard Deviation vs. Expected Return
Investment C
0
2
4
6
8
10
12
14
16
18
20
-50 0 50
% p
r o b a b i l i t y
% return

8/4/2019 Session 5 - Cost of Capital
http://slidepdf.com/reader/full/session-5-cost-of-capital 14/49
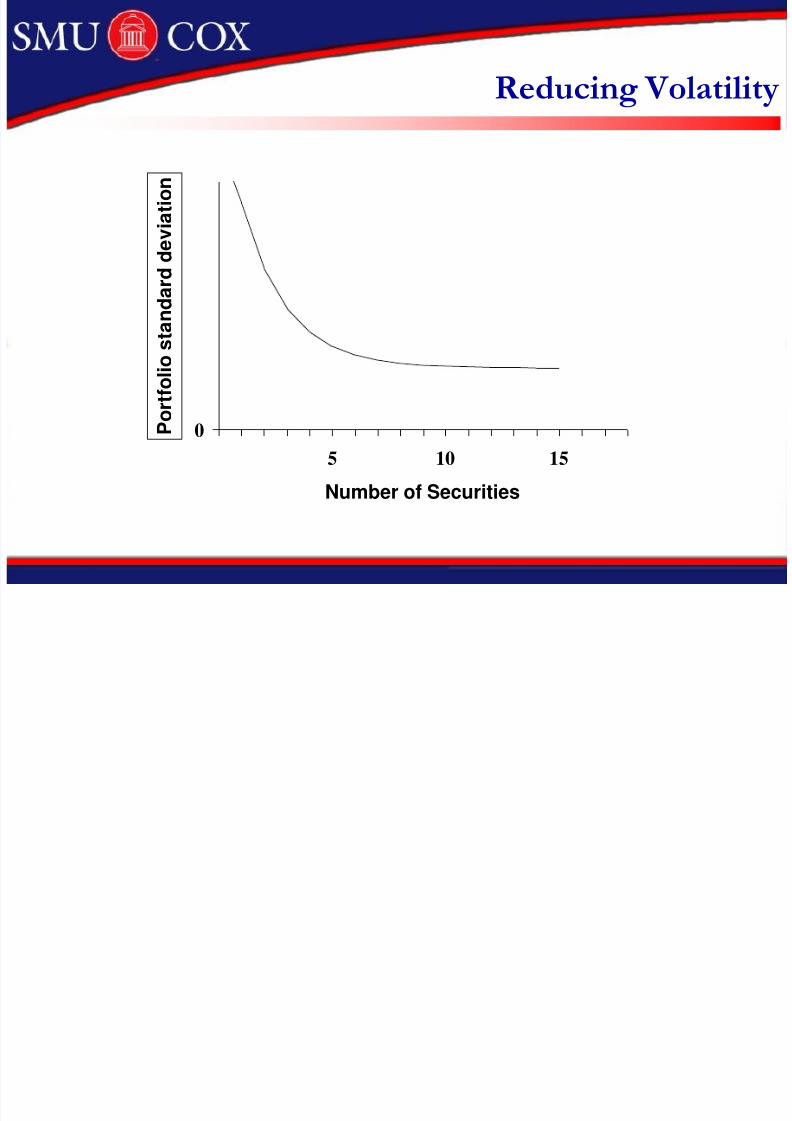
Portfolio Theory
Combining stocks into portfolios reduces the portfoliostandard deviation below the weighted average of theindividual stocks.
Covariance (also measured by correlation coefficient)between assets makes this possible.
The various weighted combinations of stocks that create
this standard deviations constitute the set of “efficientportfolios” or efficient frontier.

8/4/2019 Session 5 - Cost of Capital
http://slidepdf.com/reader/full/session-5-cost-of-capital 15/49
Expected Return on a Portfolio
22
11
rasset,secondon
returnof ratex
wasset,secondin
portfolioof fraction+
rasset,firston
returnof ratex
wasset,firstin
portfolioof fraction=
returnof
rate Portfolio
((
(
()) ))

8/4/2019 Session 5 - Cost of Capital
http://slidepdf.com/reader/full/session-5-cost-of-capital 16/49
Measuring Risk
Calculating variance and standard deviation
Excel formulas: = var(…), =stdev(…)
21.2%=450=varianceof rootsquare=deviationStandard
450=1800/4=deviationssquaredof average=Variance
90030-20-
0010+
0010+
90030+40+
DeviationSquaredMeanfromDeviationReturnof tePercent Ra
(3)(2)(1)
8/4/2019 Session 5 - Cost of Capital
http://slidepdf.com/reader/full/session-5-cost-of-capital 17/49
Reducing Volatility
0
5 10 15
Number of Securities
P o r t f o l i o
s t a n d a r d
d e v i a t i o n

8/4/2019 Session 5 - Cost of Capital
http://slidepdf.com/reader/full/session-5-cost-of-capital 18/49
Diversification
0
5 10 15
P o
r t f o l i o
s t a n d a r d
d e v i a t i o n
Market risk
Unique
risk
Number of Securities

8/4/2019 Session 5 - Cost of Capital
http://slidepdf.com/reader/full/session-5-cost-of-capital 19/49
Portfolio Risk
2
2
2
2211221
1221
211221
12212
1
2
1
σwσσρww
σww2Stock
σσρww
σwwσw1Stock
2Stock 1Stock
The total variance of a two stock portfolio is the sum of
these four boxes

8/4/2019 Session 5 - Cost of Capital
http://slidepdf.com/reader/full/session-5-cost-of-capital 20/49
Portfolio Risk
)rw()r(wReturnPortfolioExpected 2211
)σσρww(2σwσwVariancePortfolio211221
2
2
2
2
2
1
2
1
Weighted average of expected returns

8/4/2019 Session 5 - Cost of Capital
http://slidepdf.com/reader/full/session-5-cost-of-capital 21/49
Portfolio Risk Example
Example
Suppose you invest 40% of your portfolio in
Exxon Mobil and 60% in Coca Cola. The
expected return on your Exxon Mobil stock is 15%
and 10% on Coca Cola. Your portfolio expected
return is:
%0.12)10.60(.)15.40(.ReturnExpected

8/4/2019 Session 5 - Cost of Capital
http://slidepdf.com/reader/full/session-5-cost-of-capital 22/49
Portfolio Risk
222
2
2
2
211221
211221222
1
2
1
)167(.)60(.σw167.224.6.
60.40.σσρwwCola-Coca
167.224.6.x
60.40.σσρww)224(.)40(.σwMobil-Exxon
KOXOM
Example
Suppose you invest 40% of your portfolio in Exxon Mobil (XOM) and 60% in
Coca Cola (KO). The expected return on XOM is 15% and 10% on KO. The
historical standard deviation of their annualized daily returns are 22.4%
and 16.7%, respectively. Assume a correlation coefficient of 0.6 and
calculate the portfolio variance (see XL solution).

8/4/2019 Session 5 - Cost of Capital
http://slidepdf.com/reader/full/session-5-cost-of-capital 23/49
Efficient Frontier
Return
Risk
Low Risk
High Return
High Risk
High Return
Low Risk
Low Return
High Risk
Low Return

8/4/2019 Session 5 - Cost of Capital
http://slidepdf.com/reader/full/session-5-cost-of-capital 24/49
Efficient Frontier
Standard Deviation
Expected Return (%)
•Each half egg shell represents the possible weighted combinations for twostocks.
•The composite of all stock sets constitutes the efficient frontier
Efficient Frontier
8/4/2019 Session 5 - Cost of Capital
http://slidepdf.com/reader/full/session-5-cost-of-capital 25/49
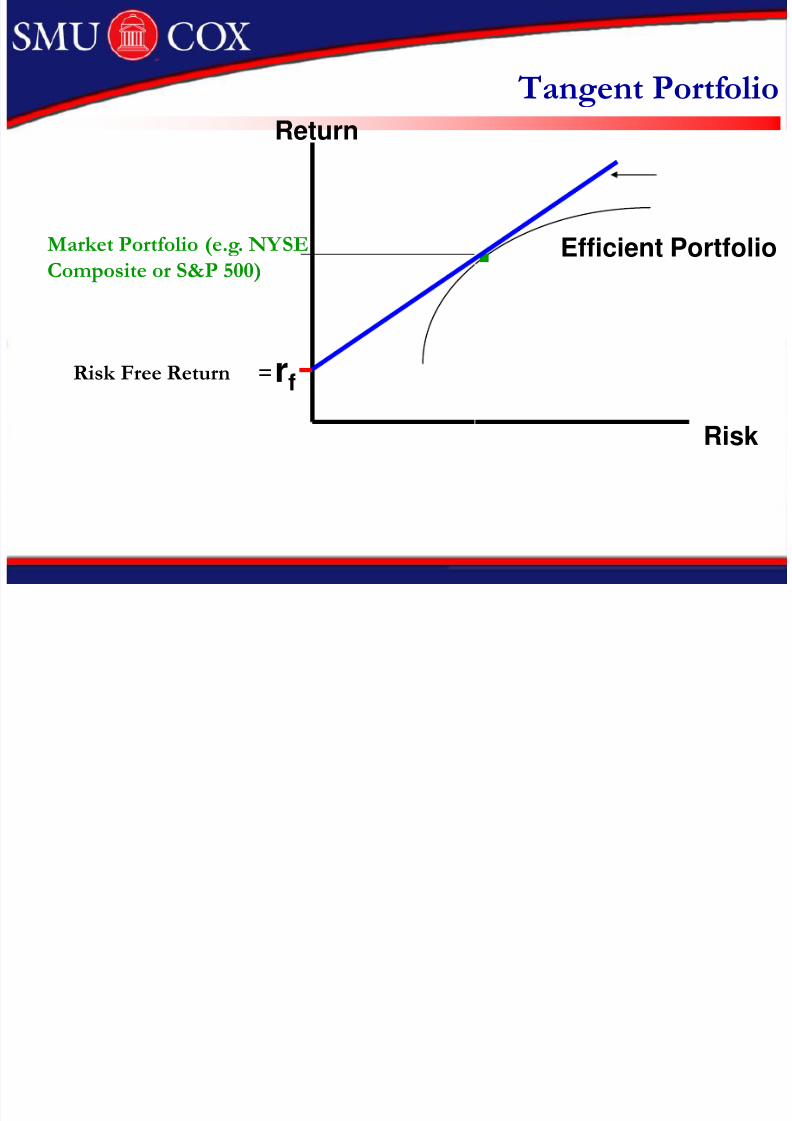
Tangent Portfolio
Return
Risk
.
rfRisk Free Return =
Efficient PortfolioMarket Portfolio (e.g. NYSE
Composite or S&P 500)

8/4/2019 Session 5 - Cost of Capital
http://slidepdf.com/reader/full/session-5-cost-of-capital 26/49
New Efficient Frontier
Standard Deviation
Expected Return (%)
Lending or Borrowing at the risk free rate (rf ) allows us to exist outside the
efficient frontier.
rf
T
T = tangent point to the market portfolio
“New” Efficient Frontier (SML)

8/4/2019 Session 5 - Cost of Capital
http://slidepdf.com/reader/full/session-5-cost-of-capital 27/49
Lending vs. Borrowing
The optimal investment (highest risk / reward ratio) lieson the security market line – a combination of the risk-
free asset and the market portfolio.
An investor can invest more than 100 percent of his or her wealth by borrowing (margin) and increasing both risk andexpected return.
An investor wanting less risk would split his or herinvestments between risk-free assets and the marketportfolio (lending portion of SML).

8/4/2019 Session 5 - Cost of Capital
http://slidepdf.com/reader/full/session-5-cost-of-capital 28/49
Security Market LineReturn
BETA
rf
1.0 = market
SML
SML Equation = rf + B ( rm - rf )
Slope = Beta
8/4/2019 Session 5 - Cost of Capital
http://slidepdf.com/reader/full/session-5-cost-of-capital 29/49
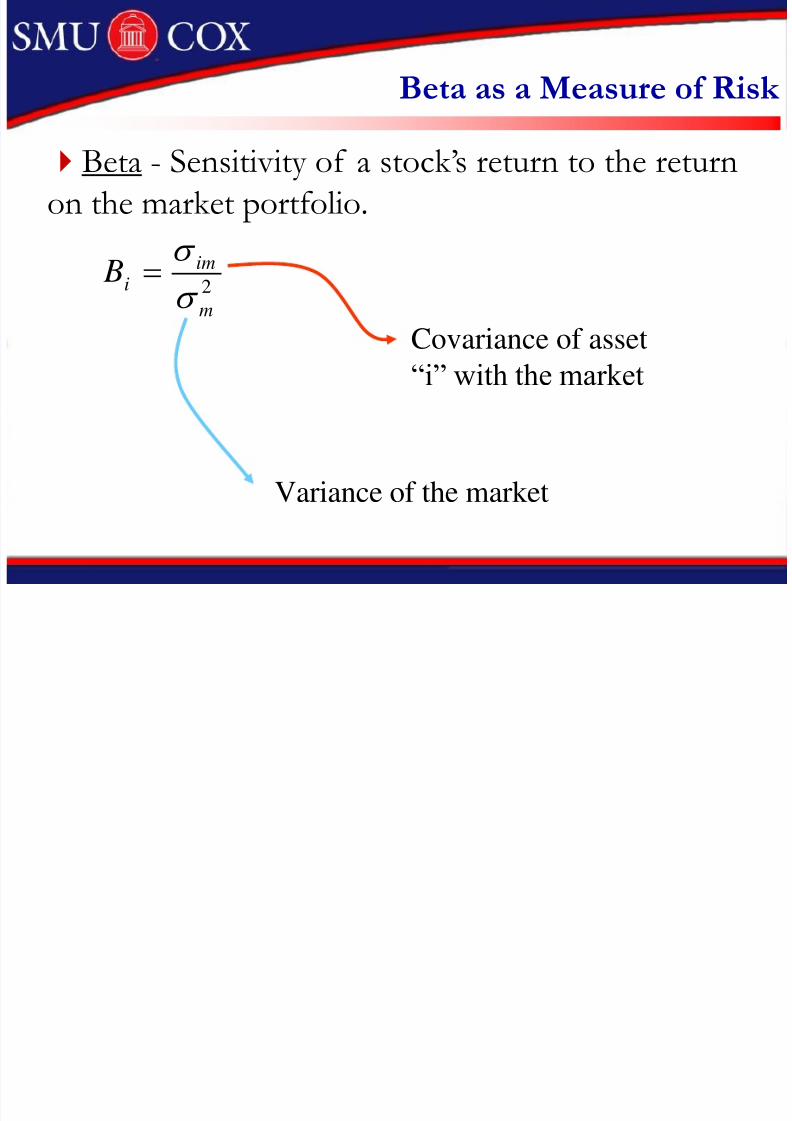
Beta as a Measure of Risk
2
m
im
i B
Covariance of asset
“i” with the market
Variance of the market
Beta - Sensitivity of a stock’s return to the return
on the market portfolio.

8/4/2019 Session 5 - Cost of Capital
http://slidepdf.com/reader/full/session-5-cost-of-capital 30/49
Measuring Beta
Dell Computer
Slope determined from plotting the
line of best fit.
Price data: May 91- Nov 97
Market return (%)
D e l l r e t u
r n ( % ) R2 = .10
B = 1.87
8/4/2019 Session 5 - Cost of Capital
http://slidepdf.com/reader/full/session-5-cost-of-capital 31/49
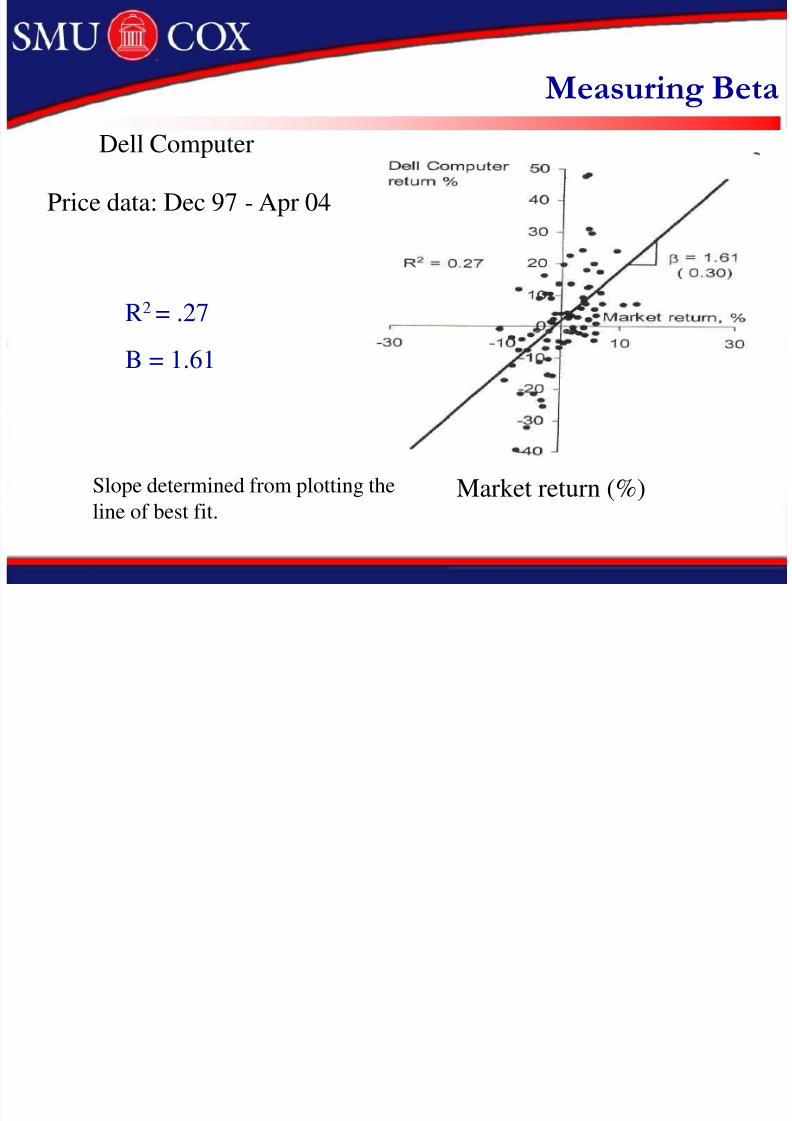
Measuring Beta
Dell Computer
Slope determined from plotting the
line of best fit.
Price data: Dec 97 - Apr 04
Market return (%)
D e l l r e t u
r n ( % ) R2 = .27
B = 1.61

8/4/2019 Session 5 - Cost of Capital
http://slidepdf.com/reader/full/session-5-cost-of-capital 32/49

8/4/2019 Session 5 - Cost of Capital
http://slidepdf.com/reader/full/session-5-cost-of-capital 33/49
Measuring Beta
General Motors
Slope determined from plotting the
line of best fit.Market return (%)
GM r e t u
r n ( % ) R2 = .29
B = 1.21
Price data: Dec 97 - Apr 04

8/4/2019 Session 5 - Cost of Capital
http://slidepdf.com/reader/full/session-5-cost-of-capital 34/49
Measuring Beta
Exxon Mobil
Slope determined from plotting the
line of best fit.Market return (%)
E xx onM
o b i l r e t ur n ( % )
R2 = .23
B = 0.57
Price data: May 91- Nov 97

8/4/2019 Session 5 - Cost of Capital
http://slidepdf.com/reader/full/session-5-cost-of-capital 35/49
Measuring Beta
Exxon Mobil
Slope determined from plotting the
line of best fit.Market return (%)
E xx onM
o b i l r e t ur n ( % )
R2 = .18
B = 0.51
Price data: Dec 97 - Apr 04

8/4/2019 Session 5 - Cost of Capital
http://slidepdf.com/reader/full/session-5-cost-of-capital 36/49
Security Market LineReturn
BETA
rf
1.0 = market
SML
SML Equation = rf + B ( rm - rf )
Slope = Beta
rm
“Market Risk Premium”

8/4/2019 Session 5 - Cost of Capital
http://slidepdf.com/reader/full/session-5-cost-of-capital 37/49
Capital Asset Pricing Model
R = rf + B ( rm - rf )
Capital Asset Pricing Model
(CAPM)

8/4/2019 Session 5 - Cost of Capital
http://slidepdf.com/reader/full/session-5-cost-of-capital 38/49
Market Risk Premium
The market risk premium is the expected return on themarket portfolio less the expected risk-free rate (rm – rf ).
The expected premium at this point in time (Jeff Allen’s
number..) is 6.0 percent.

8/4/2019 Session 5 - Cost of Capital
http://slidepdf.com/reader/full/session-5-cost-of-capital 39/49
Testing the CAPM
Avg Risk Premium1931-2002
Portfolio Beta1.0
SML30
20
10
rf
Investor
returns
MarketPortfolio
beta vs. average risk premium

8/4/2019 Session 5 - Cost of Capital
http://slidepdf.com/reader/full/session-5-cost-of-capital 40/49
Testing the CAPM
Avg Risk Premium1931-65
Portfolio Beta1.0
SML
30
20
10
rf
Investor
Returns
Market
Portfolio
beta vs. average risk premium

8/4/2019 Session 5 - Cost of Capital
http://slidepdf.com/reader/full/session-5-cost-of-capital 41/49
Testing the CAPM
Avg Risk Premium1966-2002
Portfolio Beta1.0
SML
30
20
10
rf
Investorreturns
Market
Portfolio
beta vs. average risk premium
8/4/2019 Session 5 - Cost of Capital
http://slidepdf.com/reader/full/session-5-cost-of-capital 42/49
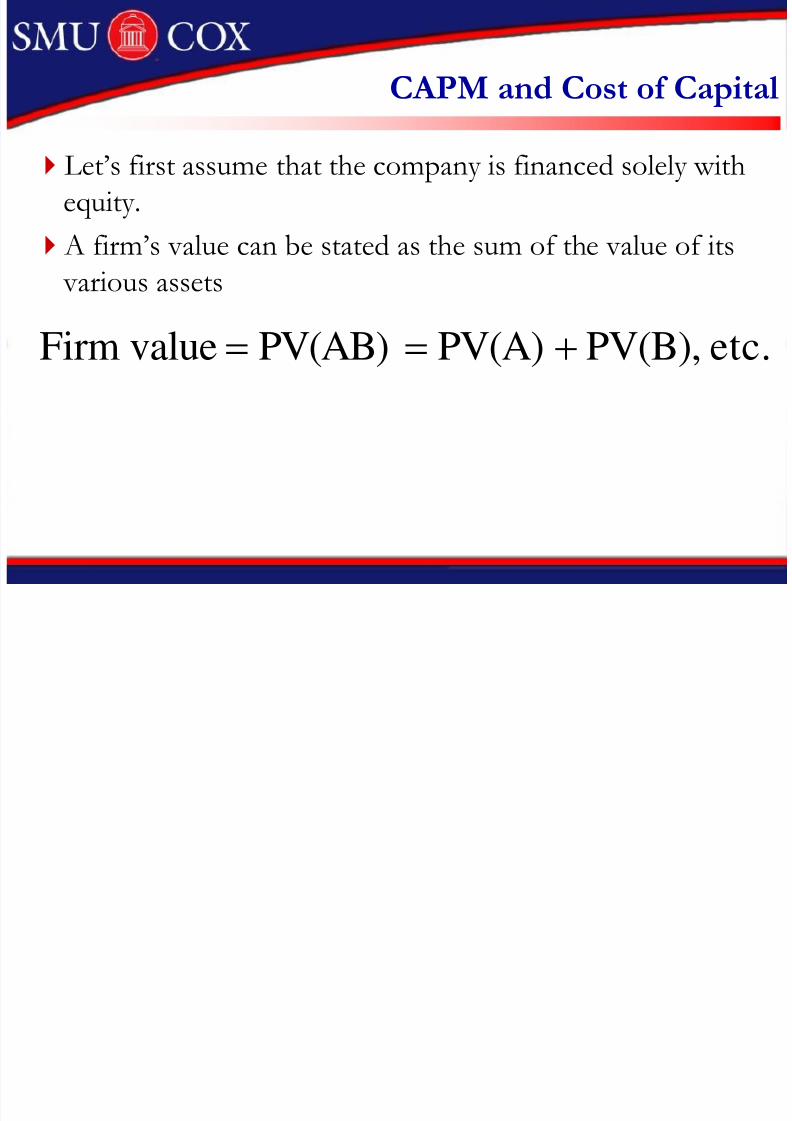
CAPM and Cost of Capital
Let’s first assume that the company is financed solely with
equity.
A firm’s value can be stated as the sum of the value of its
various assets
etc.PV(B),PV(A)PV(AB)valueFirm
8/4/2019 Session 5 - Cost of Capital
http://slidepdf.com/reader/full/session-5-cost-of-capital 43/49
Cost of Capital
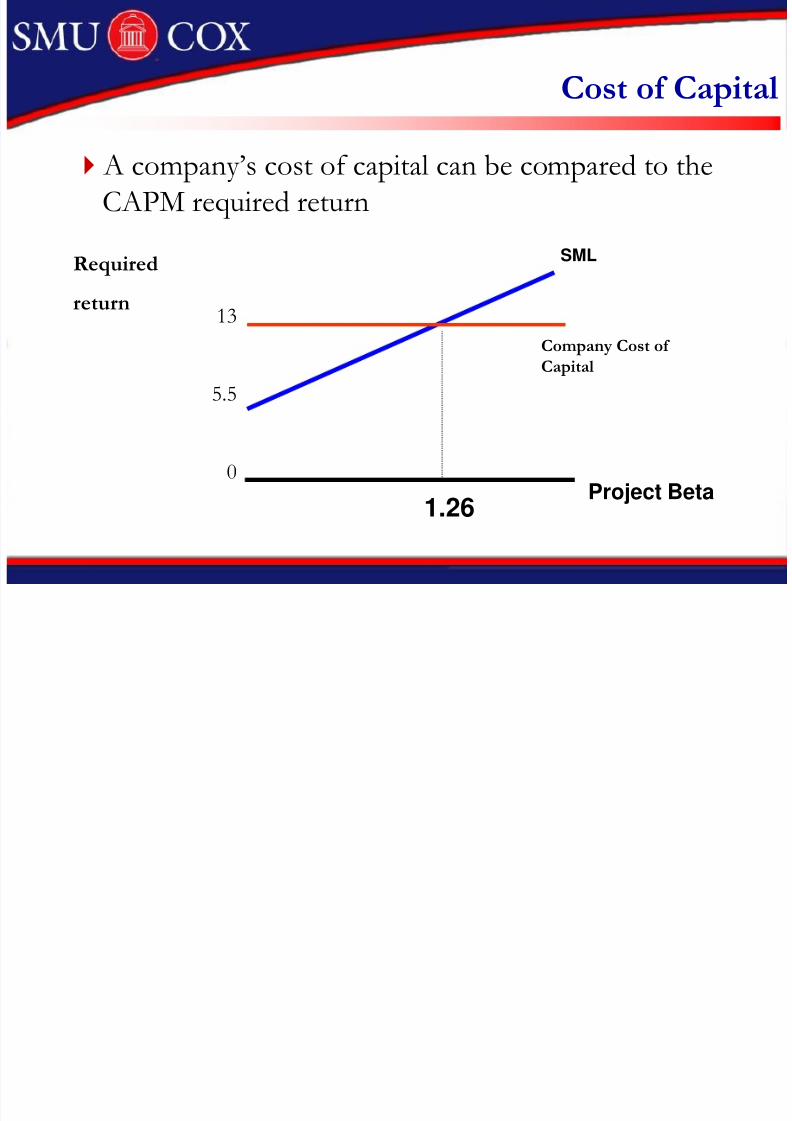
A company’s cost of capital can be compared to the
CAPM required return
Required
return
Project Beta1.26
Company Cost of
Capital
13
5.5
0
SML

8/4/2019 Session 5 - Cost of Capital
http://slidepdf.com/reader/full/session-5-cost-of-capital 44/49
Cost of Capital
10%ytechnologknownt,improvemenCost
COC)(Company12.5%businessexistingof Expansion
20%productsNew
30%VentureseSpeculativ
RateDiscountEst.Category
Adjustments to the required return areoften ad hoc…we can do better

8/4/2019 Session 5 - Cost of Capital
http://slidepdf.com/reader/full/session-5-cost-of-capital 45/49
Calculating the cost of capital
Cost of Debt: After-tax yield of outstanding debt
rdebt = avg. yield to maturity
Cost of Equity: Risk-free rate + risk premium
requity = risk-free rate + beta (market risk premium)
WACC: rdebt (1-t)(D/V) + requity (E/V) where V = D (total value of debt) + E (market value of equity)
(we use market values for the weights if available)

8/4/2019 Session 5 - Cost of Capital
http://slidepdf.com/reader/full/session-5-cost-of-capital 46/49
Cost of capital (example)
Suppose a firm has $3M debt outstanding yielding 8.5percent. The stock price is $35 and the firm has 200,000shares outstanding. The equity beta of the firm is 1.25,
the current risk-free rate is 5 percent. Assume the risk premium for holding the market portfolio is expected tobe 6 percent. At a tax rate of 34 percent, what is thecost of capital?
8/4/2019 Session 5 - Cost of Capital
http://slidepdf.com/reader/full/session-5-cost-of-capital 47/49
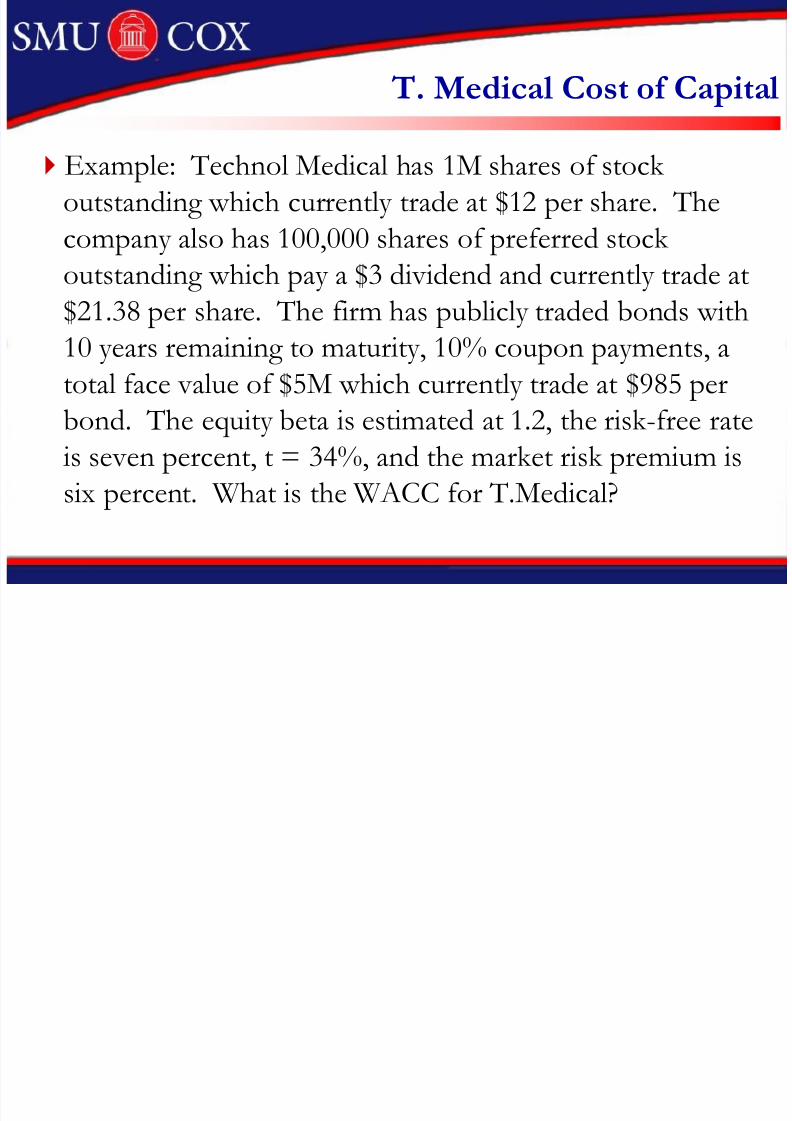
T. Medical Cost of Capital
Example: Technol Medical has 1M shares of stock outstanding which currently trade at $12 per share. Thecompany also has 100,000 shares of preferred stock
outstanding which pay a $3 dividend and currently trade at$21.38 per share. The firm has publicly traded bonds with10 years remaining to maturity, 10% coupon payments, atotal face value of $5M which currently trade at $985 per
bond. The equity beta is estimated at 1.2, the risk-free rateis seven percent, t = 34%, and the market risk premium issix percent. What is the WACC for T.Medical?

8/4/2019 Session 5 - Cost of Capital
http://slidepdf.com/reader/full/session-5-cost-of-capital 48/49
Nike, Inc. : Cost of Capital Case
Read through Exhibits 1-5 in the case
In groups of two, calculate the WACC for Nikeindependently of the analysis by Ms. Cohen
Note any improvements you would make to Ms. Cohen’sanalysis

8/4/2019 Session 5 - Cost of Capital
http://slidepdf.com/reader/full/session-5-cost-of-capital 49/49
PepsiCo Inc.: Cost of Capital
How has the company performed over the past 10 years?
How have the segments performed?
What is your estimate of the cost of capital for eachdivision of the company (soft drinks, restaurants & snack foods)