Session 29: Integration of Clinical Improvement and ... · Integration of Clinical Improvement and...
32
Integration of Clinical Improvement and Activity-Based Costing Identifies Pathway to Healthier Moms and Babies Hyagriv Simhan, MD, MS Executive Vice Chair, Obstetrical Services, UPMC Session 29: Beth Quinn, MSN, RNC-MNN Program Director, Women’s Health Services, UPMC Paula Lounder Director, Corporate Finance, and Women’s Health Service Line Finance Lead, UPMC
Transcript of Session 29: Integration of Clinical Improvement and ... · Integration of Clinical Improvement and...

Integration of Clinical Improvement and Activity-Based Costing Identifies Pathway to
Healthier Moms and Babies
Hyagriv Simhan, MD, MSExecutive Vice Chair,
Obstetrical Services, UPMC
Session 29:
Beth Quinn, MSN, RNC-MNNProgram Director,
Women’s Health Services, UPMC
Paula LounderDirector, Corporate Finance, and Women’s Health Service
Line Finance Lead, UPMC

Agenda• Learning objectives.• Impact of gestational diabetes mellitus (GDM) on women’s
health.• UPMC background.• Using data and analytics to identify and support meaningful
and effective interventions.• Results.• Lessons and next steps.• Questions and answers.

Learning Objectives
Importance of bringing cost and finance to a clinical
development project.
Initial project identifies future opportunities.
Recognize the benefits of a service line organizational structure and
interdisciplinary team approach to
improvements across an episode of care.
Demonstrate how clinical information can
be integrated with financial information
for a specific population episode of
care to identify opportunity.
Discuss barriers to optimal identification and management of Gestational Diabetes and use of innovative
strategies to overcome those barriers.

Poll Question # 1
What proportion of women with Gestational Diabetes Mellitus develop Type II Diabetes in the 10 years following pregnancy?
a) 5%
b) 15%
c) 25%
d) 50%
e) 70%

Gestational Diabetes
Ideal State: • Timely testing.• Proper diagnosis.• Referral to Maternal
Fetal Medicine (MFM) Management.
• Postpartum follow-up.
• Hyperglycemia first noted in pregnancy.• Affects ~5-10% of pregnant women (200,000-400,000
annually).• Combination of metabolic changes that pre-date pregnancy
and pregnancy-specific changes.• Insulin secretion increases, but not enough to “normalize”
glucose metabolism.• Adverse pregnancy outcomes compared to women with
normal glucose tolerance.

UPMC Snapshot
$16 billion world-renowned healthcare
provider.
4,600+ employed physicians.
30+ academic, community, and
specialty hospitals; 8,500+ licensed beds.
340,000 inpatient admissions and
observation cases; 220,000 surgeries
performed annually.
4.7 million outpatient visits 957,000
emergency visits.
60+ UPMC Hillman Cancer Center locations; 200+ affiliated medical, radiation and surgical
oncologists.
UPMC Health Plan: 3.4 million total
members; network of 125+ hospitals
11,500+ physicians.

Cesarean Rate among women with GDM
Macrosomia Rate Hyperbilirubinemia Rate
Neonatal Hypoglycemia Rate
National and UPMC Statistics
National Average
40-50%
UPMC 43% National Average6%UPMC 9% National
Average8%UPMC 13% National Average8%UPMC 6%
UPMC: 25,000 Annual Births
Gestational Diabetes:UPMC: 3% of deliveries.
National Average: 5% of deliveries.

GDM Initiative:
Project Planning and Implementation Framework
Statistical design.Quality
improvement methods and
tools.
Adaptive leadership
strategies for leading
transformation and managing
change.
Protocol development,
implementation and testing.
Clinical integration structure and
governance models to sustain and spread
improvement interventions.

Evidence-Based GDM Pathway
• This process map illustrates the recommended diagnostic pathway for management of GDM.
• Currently resides as a PDF document in outpatient EHR, but is underutilized.
• There is no IT support in best practice alerts and measurable metrics to encourage adherence.

(Minus women who are currently diabetic or have history of bariatric surgery)
ScreenedOn-time
<= 28 WksE
17,554
ScreenedLate
> 28 WksD
2,527
LateScore < 135
F1,764
Late Score
135-199G
369
LateScore >= 200
H84
No Dx Screening3Hr Test
M46
Yes Dx Screening 3Hr Test
L323
Glucose Tolerance
TestB
20,081
No Glucose Tolerance Test
C3,148
Eligible Cohort
A23,229
On-time Score< 135
I13,431
On-time Score
135-199J
2,913
On-time Score >=200
K219
Dx Screen Late 3Hr
TestP
152
Dx Screen On-time3Hr Test
Q171
Normal Test
ResultsT
114
Abnormal Test
ResultsU12
Normal Test
ResultsV
150
Abnormal Test
ResultsW17
No Dx Screening3Hr Test
N115
Dx Screening 3Hr Test
O2,798
Dx Screen Late 3Hr
TestR94
Dx Screen On-time 3Hr
TestS
2,704
Normal Test
ResultsX93
Abnormal Test
ResultsY1
Abnormal Test
ResultsAA
Normal Test
ResultsZ
2,377
Delivered Pregnancy Episodes for the
Period?Indicates Positive for Gestational Diabetes
Were not screened or tested properly
1. Glucose tolerance test2. Diagnostic screening test
Positive for Gestational
DMBB660
Pathway Adherence
CC546
Non-Adherence to Pathway
DD114
DeliveryPost-
partumEE179
BB=H+K+U+W+Y+AA
Diagram illustrates the process used to determine the data logic behind the GDM pathway. Definition
of “on-time”
Data Logic Map
Education for glucola testing.
Education for 3 hr diagnostic testing.
Communicate news of GDM diagnosis to patient
prior to MFM referral.
Videos for patient education on GDM.
Order glucometer (through script or HealthPlan).
Two methods:• Fax referral.• EHR referral.
Two methods:• Office places call.• Patient contacts
MFM office.Test Order: • Electronic.• Paper.
Lab Location:• Patient self-identifies
convenient location.• Office identifies closest lab
based on patient’s preference.
Process Map:Testing & Diagnosis Standardize
scripting (timing & importance).
Streamline test order options.
Establish timeline for test result reading
& communication.
EHR Documentation
build-out.
EHR reports to track appropriate referral to MFM.
5X/day supply for glucometer.
Order Prescription for Wellness.
Magee OP Clinic Patients: Separate
process for CDE referral.
Completion of IDEA
Questionnaire.
1st Prenatal visit
Glucose tolerance test between 24 and
28 weeks
3hr glucose tolerance test between 28 and
32 weeks GDM diagnosis Referral to MFMAppointment scheduling

Process Map: GDM Management
6 week post-partum check with PCP.
Referral to dietician.
Blood sugar data
collection.
CDE appointment within 48 hours of
result communication.
1 week after CDE) consult. Bluetooth glucometer.
Remote monitoring.
Prescription for Wellness Case
Manager.
Initial Appointment w/Clinical Diabetes
Educator (CDE)Appointment with
MFM docGDM
Management
Post-partum type 2 diabetes
mellitus(T2DM) testing and
management
CDE Appointment• Group:
• Telemedicine.• In-person.
• One-on-One:• Telemedicine.• In-person.

Stakeholders
• Multiple levels of frontline staff.
• Variation of practice by providers.
• Ability to pull data/manage metrics.
• Need for operational work team.
• Finding champions.
• Balance of ongoing project workload & team day to day operations.
Poll Question # 2
Does your organization provide Women’s Services in an organized service line approach that includes clinical, finance, quality, and IT team members?
a) Yes
b) No
c) Unsure or not applicable

Cost Accounting Used for Service Line Performance Improvement
Utilized activity-based costing (ABC) system • Attributes costs to individual patients based on “activity drivers.”
• Identifies granular sources of variation.
• Captures cost of pregnancy episode.
Aligned Cost and Quality • Utilizes standardized data warehouse platform for cost and quality.
• Provides structured means to access a variety of health system data.
• Converts large amount of data into usable information for reporting, analysis, and metrics.
Prenatal Care $ + IP Stay $ (Mom & Baby) + Post-Partum $ = Episode $

Data Source Approach for GDM Project
Inpt EHR
Outpt EHR
SUBJECT AREA MART (SAM)
OutpatientInpatient Physician Services
Prenatal Postnatal
Labs, Procedures,
etc.
Delivery
Total Bundle Cost of Care
EDW
Clinical and Quality data
UPMC Wolff Center(quality, safety and innovation team)
Service Line Finance

Baseline Metrics: Process and Outcome Measures
GDM Prevalence: 3%Cesarean section rate in GDM patients: 43% vs. 30% in all deliveries
CL 0.2983
UCL 0.3424
LCL 0.2542
0.235
0.255
0.275
0.295
0.315
0.335
0.355
C-S
ectio
ns -
Del
iver
ies
(ALL
)
2016-01 - 2017-12
Frequency of Cesarean in OB Population
CL 0.4317
UCL 0.7077
LCL 0.1558
0.000
0.100
0.200
0.300
0.400
0.500
0.600
0.700
0.800
0.900
2016
-01
2016
-02
2016
-03
2016
-04
2016
-05
2016
-06
2016
-07
2016
-08
2016
-09
2016
-10
2016
-11
2016
-12
2017
-01
2017
-02
2017
-03
2017
-04
2017
-05
2017
-06
2017
-07
2017
-08
2017
-09
2017
-10
2017
-11
2017
-12
C-S
ectio
ns -
Del
iver
ies
(GD
M)
2016-01 - 2017-12
Frequency of Cesarean in GDM

Aligning Cost and Quality: GDM Cost Overview
Delivery Type Non-GDM GDM
Vaginal 70% 57%
Cesarean 30% 43%On average, Cesareans are more costly by
approximately $12,000 per episode.
Data suggest there is potential opportunity to reduce costs by better managing GDM patients.
Potential opportunity: Reducing the Cesarean rate for GDM patients from 43% to 37% is associated with a cost savings up to $240k annually.
On average, GDM pregnancy episodes are more costly by approximately $4,000 per episode.

Baseline Metrics: Process Measures
• 75% population ordered 1 hour glucose tolerance test.
• 67% completed by 28 weeks (Best Practice).
• Opportunity: 33% population of women not ordered by 28 weeks.Screening
Diagnosis
• 87% eligible population ordered 3 hr glucose timely (≤32 weeks).
• 79% completed 3 hr glucose ≤32 weeks.
• Opportunity: 8% completed ≥32 weeks.

Aligning Cost With Quality: Diagnostic Screening Ordered Timely vs Not Timely32% of GDM positive mothers did not have diagnostic tests ordered timely, and, on average, were more costly.
Other Considerations (Excluded):
• Preterm births, representing 6% of the patients with untimely testing (not likely modifiable).
• Outlier cases with significant costs for care unrelated to GDM, such as cardiac treatment.
$0
$2
$4
$6
$8
$10
$12
$14
$16
$18
$20
C-Section Mother C-Section Baby Vaginal Mother Vaginal Baby
GDM Episode Cost Comparison
Timely Not Timely
Higher costs: $1K delivery admission; $1K 3rd trimester
Aver
age
cost
in 0
00’s

Baseline Metrics: Neonatal Outcomes*
Outcome GDM No GDM
Neonatal Hypoglycemia 38% 6%
Macrosomia 13% 9%
Neonatal Jaundice 17% 13%
*Excludes preterm births

3% Macrosomia Only 2% of expenses
20% Hypoglycemia Only
23% of expenses
7% Jaundice Only
8% of expenses
18% have two or more conditions;
21% of expense
Aligning Cost with Quality: GDM Neonatal OutcomesBabies born to GDM positive mothers with one or more neonatal outcomes are more costly.
Jaundice & Hypoglycemia cases are ~$5k more costly per episode, with longer LOS.
Among these babies, those born to GDM mothers with untimely testing, had a slightly higher LOS.
% of GDM Population with Neonatal Outcomes vs. % of Expense
48%52%
% of Babies Born to Mothers with GDM
With NeonatalOutcomesNo NeonatalOutcomes
48% of population incurs 54% of episode expenses

Aligning Cost with Quality: Improved Analytics
Simplicity
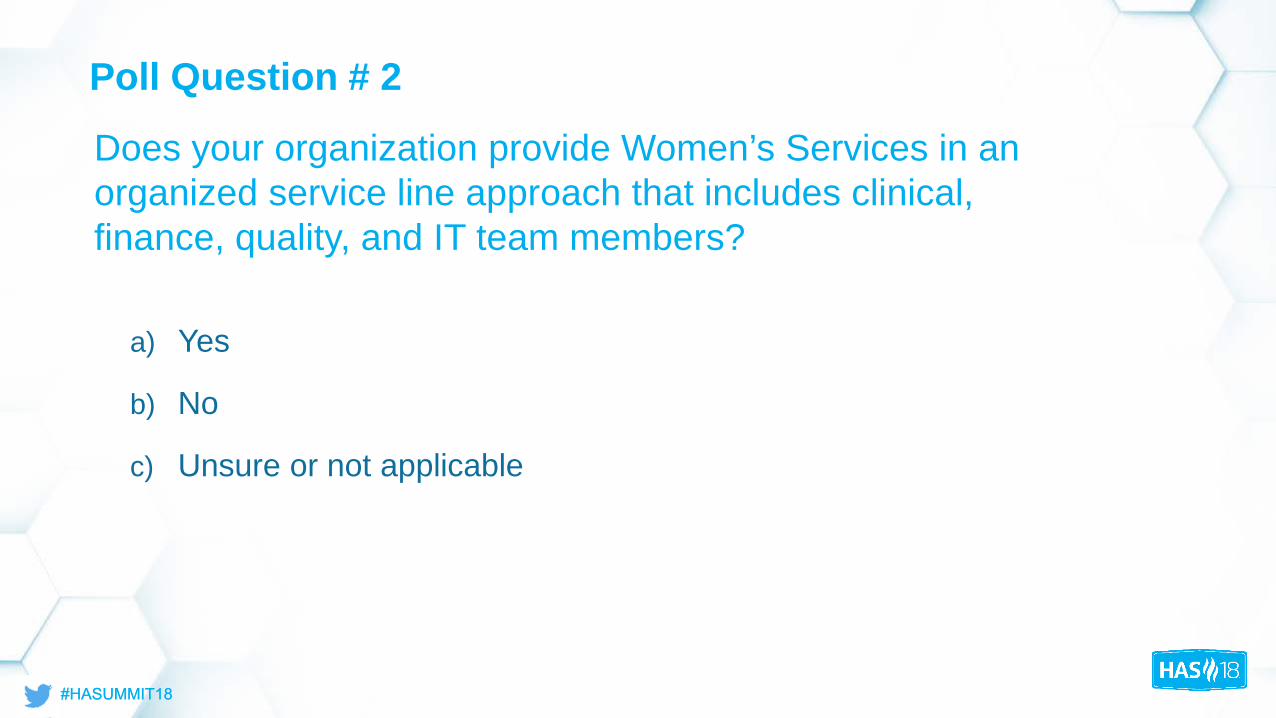
Appeal to Leadership for Ongoing Support
Executive buy-in for
roll-out plan.
Executive direction to
providers to adopt new practices.
Potential tie to dollars to increase
pathway adherence.
Identify champions for
process change.

Interventions and Results

• Source of referral:o 24% fax.o 16% OB office phone call.o 58% patient phone call.o 0% electronic referral.
• 96% seen within 7 days of referral by CDE.
• Scheduling conflicts cause patient to decline 1st available.
• 78% enrolled and active in MyUPMC.
Technology Supported Questionnaire and Preliminary Findings

Preliminary Results of Screening: • Distribution of CDE visits:
o 4% group telemed.o 5% 1:1 telemed.o 49% group FTF.o 38% 1:1 FTF.
• Only 20% had glucometer & supplies at 1st education appointment.
• One out of 164 patients screened saw an educational video prior to visit.
Technology Supported Questionnaire and Preliminary Findings

Remote Monitoring Portal

Early Results• Identified best practice for lab ordering.
• Reaffirmed that appointments with CDE are timely within one week.
• Identified areas of opportunity to improve patient engagement with education materials prior to MFM consult.
• Developed best practice alert in the EHR, combining glucometer ordering, MFM referral, and patient education.
• Identified remote monitoring as a means to collect patient data in a standardized method, (e.g. patient behaviors), track patterns, and provide appropriate interventions.
• Improved insights by integrating quality and cost data.

Additional Interventions
Create standardized education rollout plan
to all providers and hospitals serving OB
population within UPMC.
Recommend referral to
MFM as best practice for all GDM patients.
Patient Supply ordering prior
to CDE appointment.
Collect and monitor data via OB Dashboard to
measure progress. Case
management team
engagement for transition of care
team post pregnancy.
Key Takeaways
The importance of bringing cost and finance to a clinical
improvement project.
Initial project identifies future opportunities. The approach
taken can be applied to other
projects.
The importance of disease
management during pregnancy
in relation to population health.
Engage stakeholders
early for assistance with
multiple levels of interventions.

Questions and Answers
Hyagriv Simhan, MD, [email protected]
Beth Quinn, MSN, RNC-MNN Paula [email protected]