Session 2 - How Distillation works - Dublin Institute of …eleceng.dit.ie/gavin/Distillation/McCabe...
37
Distillation 0.0 0.1 0.2 0.3 0.4 0.5 0.6 0.7 0.8 0.9 1.0 0.0 0.1 0.2 0.3 0.4 0.5 0.6 0.7 0.8 0.9 1.0 Xa Ya The McCabe Thiele Graphical Design Method Gavin Duffy School of Electrical Engineering
Transcript of Session 2 - How Distillation works - Dublin Institute of …eleceng.dit.ie/gavin/Distillation/McCabe...
Distillation
0.0
0.1
0.2
0.3
0.4
0.5
0.6
0.7
0.8
0.9
1.0
0.0 0.1 0.2 0.3 0.4 0.5 0.6 0.7 0.8 0.9 1.0
Xa
Ya
The McCabe Thiele Graphical Design
Method
Gavin DuffySchool of Electrical Engineering Systems
DIT Kevin St
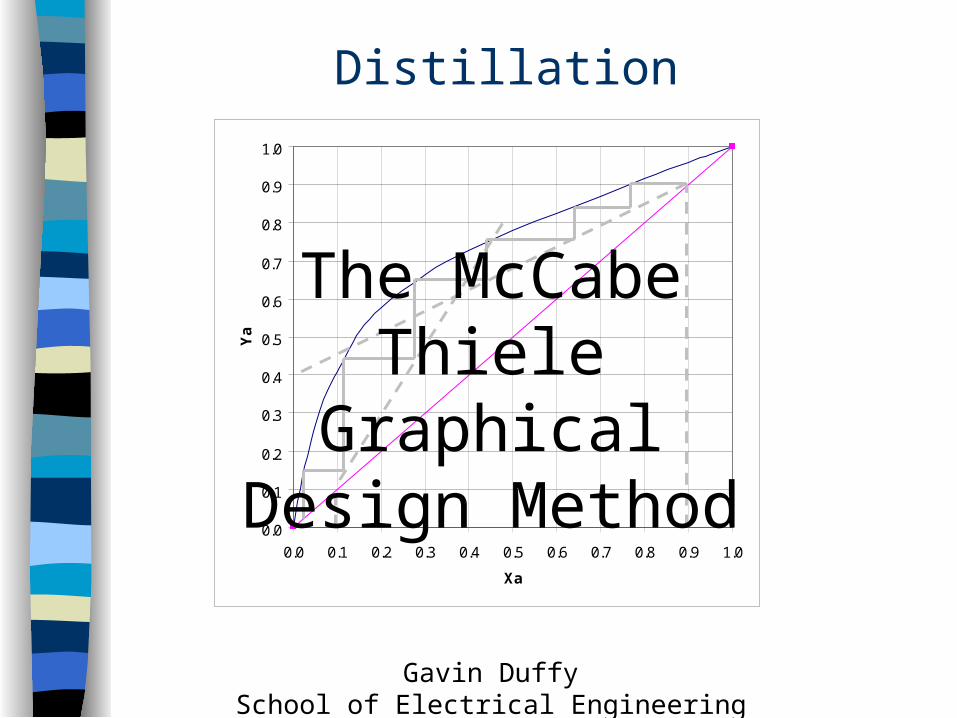
Learning OutcomesAfter this lecture you should be able to…..
•Explain the importance of Reflux
•Apply the McCabe Thiele graphical design method to determine the number of equilibrium stages in a column
•Describe column internals (trays and packing)
•Define tray efficiency
•Explain the height of packing equivalent to a theoretical plate
Thanks to Ming Tham’s website for pictures and information. An excellent presentation on distillation:
http://lorien.ncl.ac.uk/ming/distil/copydist.htm

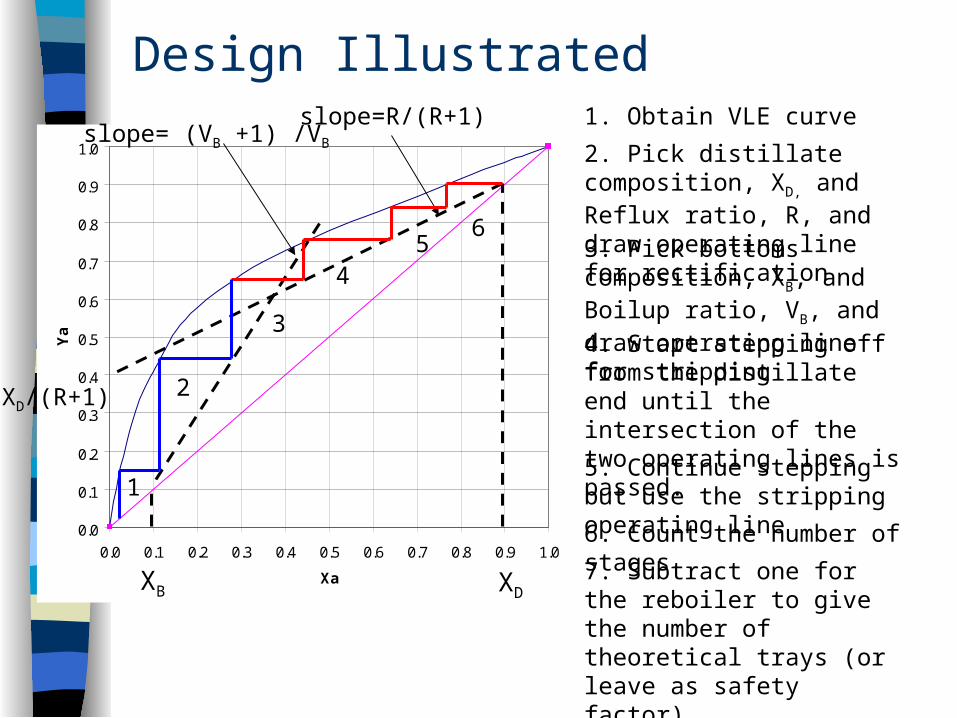
1. Obtain VLE curve
0.0
0.1
0.2
0.3
0.4
0.5
0.6
0.7
0.8
0.9
1.0
0.0 0.1 0.2 0.3 0.4 0.5 0.6 0.7 0.8 0.9 1.0
Xa
Ya
XD
slope=R/(R+1)
XD/(R+1)
slope= (VB +1) /VB 2. Pick distillate composition, XD, and Reflux ratio, R, and draw operating line for rectification3. Pick bottoms composition, XB, and Boilup ratio, VB, and draw operating line for stripping
XB
4. Start stepping off from the distillate end until the intersection of the two operating lines is passed.5. Continue stepping but use the stripping operating line6. Count the number of stages
1
2
3
45
6
7. Subtract one for the reboiler to give the number of theoretical trays (or leave as safety factor)
Design Illustrated
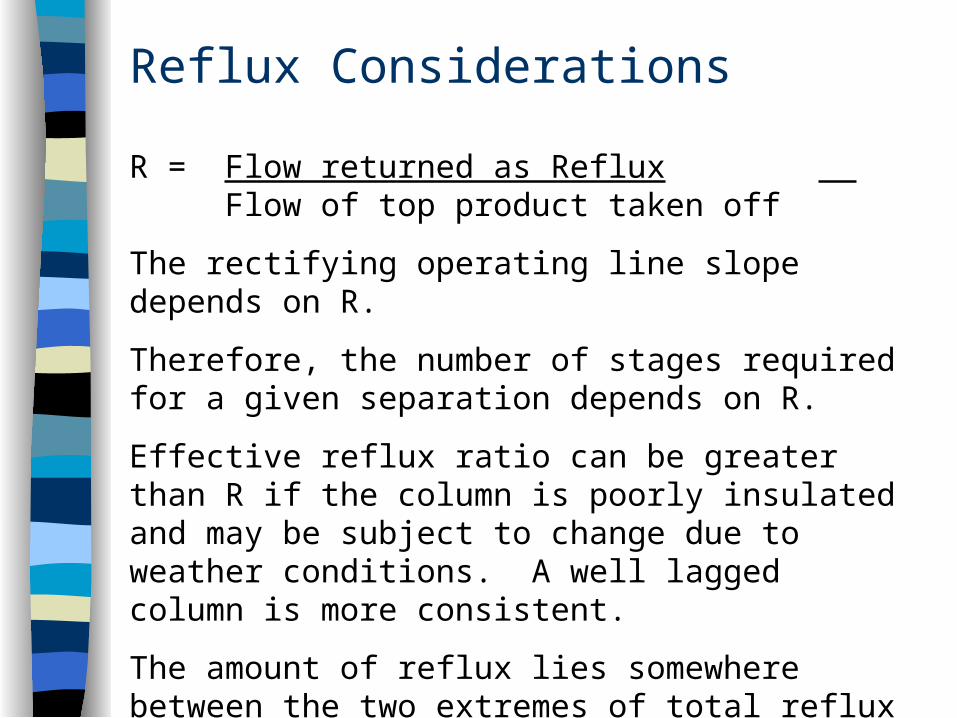
R = Flow returned as Reflux Flow of top product taken off
The rectifying operating line slope depends on R.
Therefore, the number of stages required for a given separation depends on R.
Effective reflux ratio can be greater than R if the column is poorly insulated and may be subject to change due to weather conditions. A well lagged column is more consistent.
The amount of reflux lies somewhere between the two extremes of total reflux and minimum reflux
Reflux Considerations
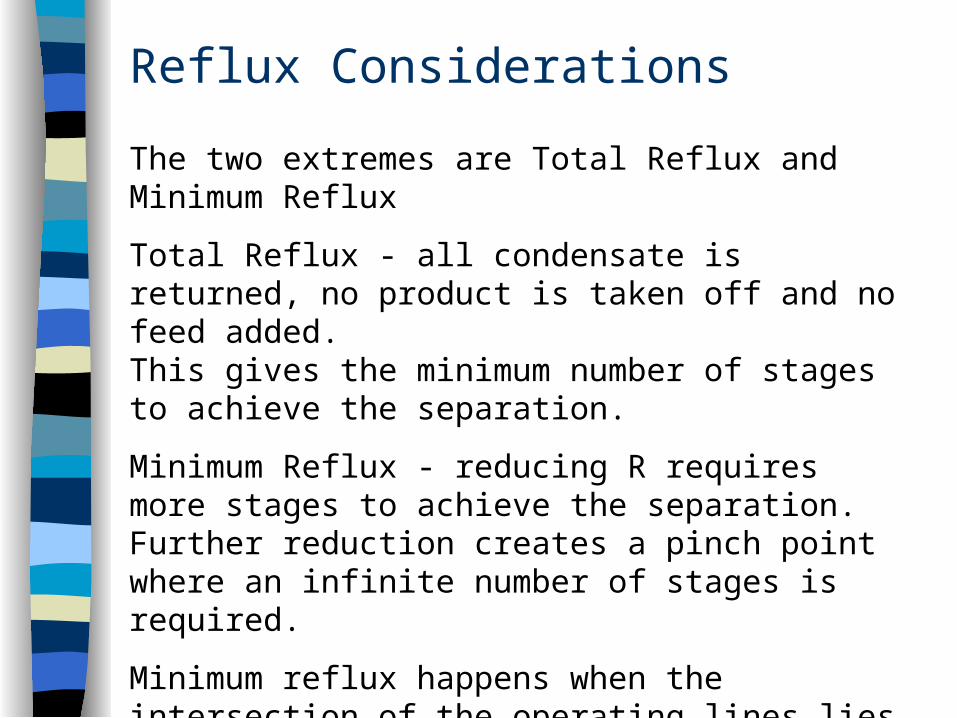
The two extremes are Total Reflux and Minimum Reflux
Total Reflux - all condensate is returned, no product is taken off and no feed added.This gives the minimum number of stages to achieve the separation.
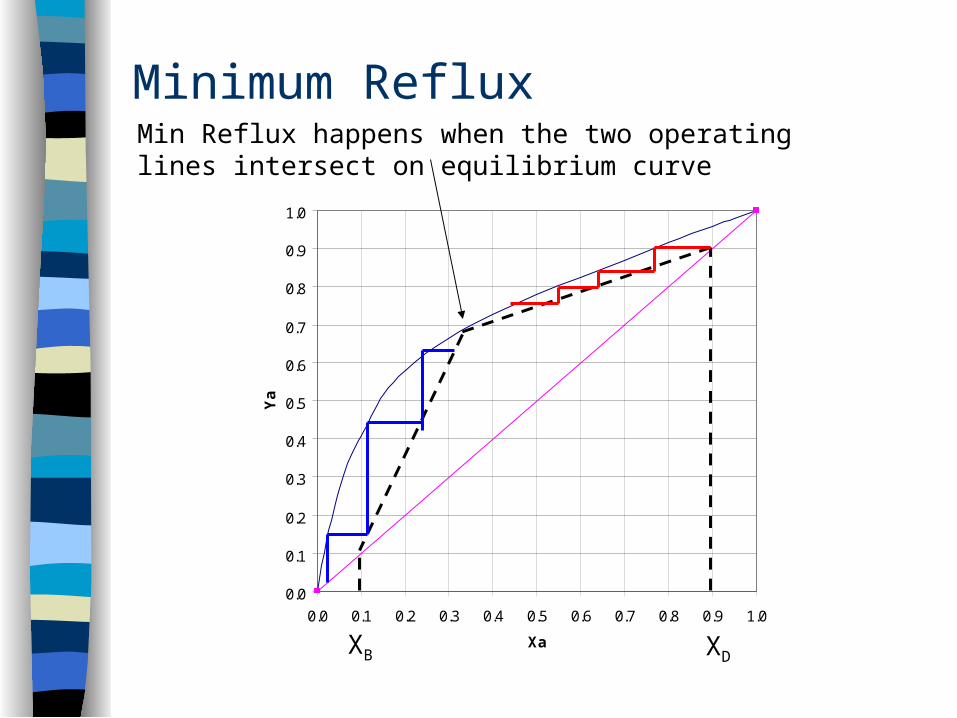
Minimum Reflux - reducing R requires more stages to achieve the separation. Further reduction creates a pinch point where an infinite number of stages is required.
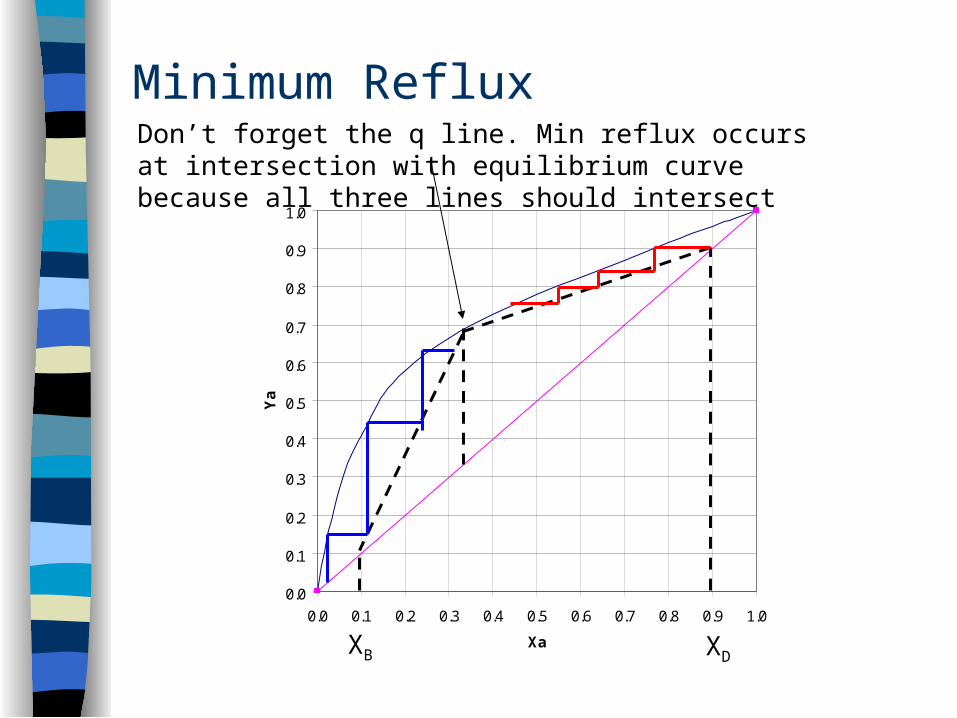
Minimum reflux happens when the intersection of the operating lines lies on the equilibrium curve
Reflux Considerations
Total Reflux
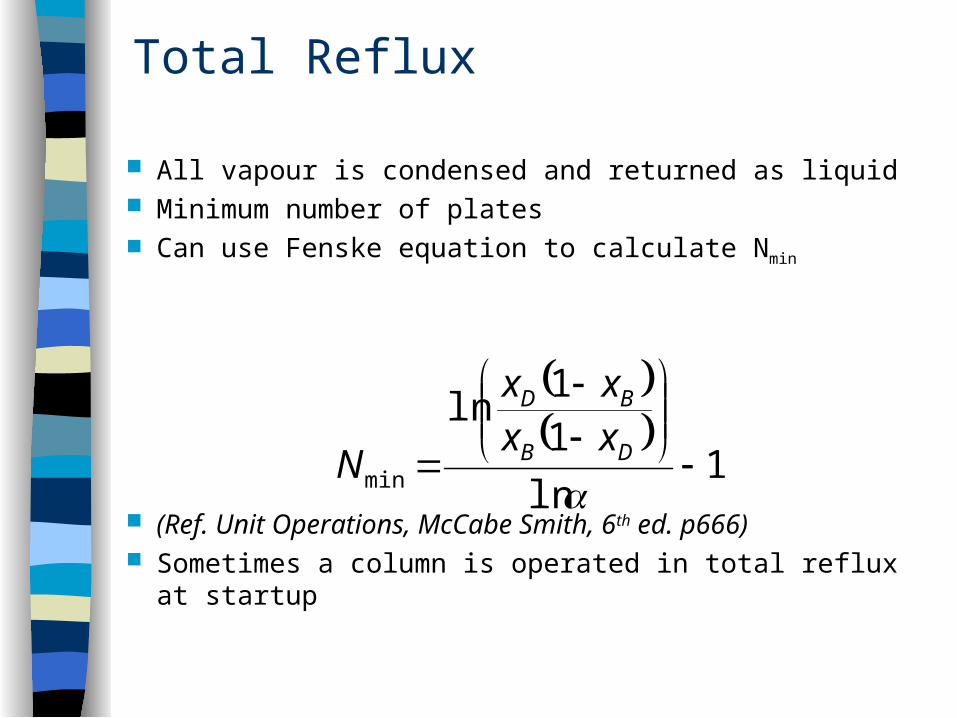
All vapour is condensed and returned as liquid Minimum number of plates Can use Fenske equation to calculate Nmin
(Ref. Unit Operations, McCabe Smith, 6th ed. p666) Sometimes a column is operated in total reflux at startup
1ln11ln
min
DB
BD
xxxx
N
Minimum Reflux
0.0
0.1
0.2
0.3
0.4
0.5
0.6
0.7
0.8
0.9
1.0
0.0 0.1 0.2 0.3 0.4 0.5 0.6 0.7 0.8 0.9 1.0
Xa
Ya
XD
Min Reflux happens when the two operating lines intersect on equilibrium curve
XB
Minimum Reflux
0.0
0.1
0.2
0.3
0.4
0.5
0.6
0.7
0.8
0.9
1.0
0.0 0.1 0.2 0.3 0.4 0.5 0.6 0.7 0.8 0.9 1.0
Xa
Ya
XD
Don’t forget the q line. Min reflux occurs at intersection with equilibrium curve because all three lines should intersect
XB
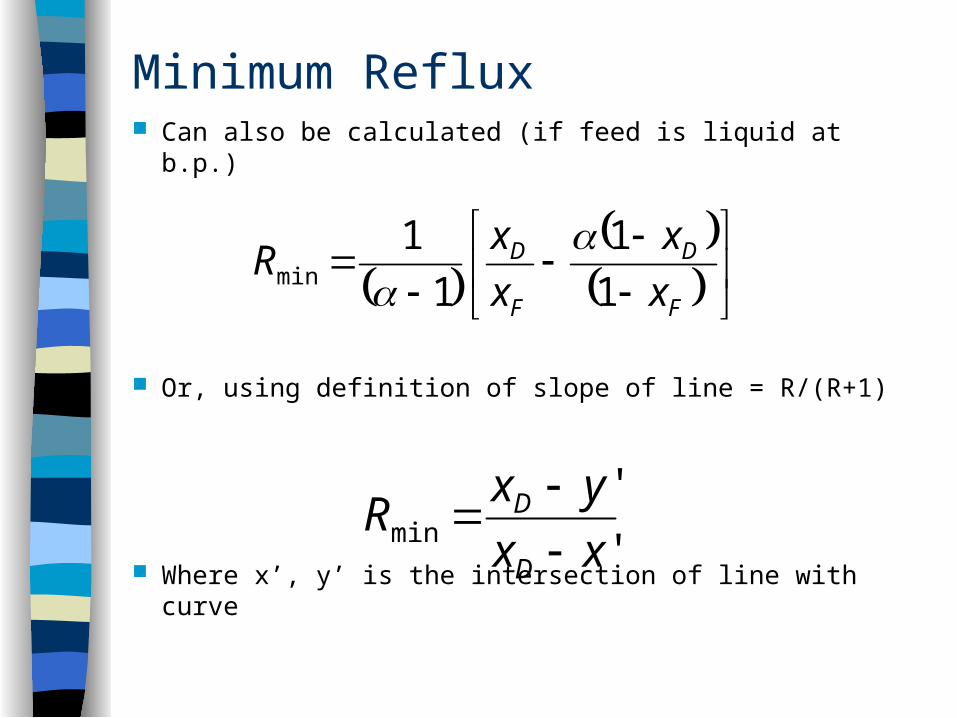
Minimum Reflux Can also be calculated (if feed is liquid at b.p.)
Or, using definition of slope of line = R/(R+1)
Where x’, y’ is the intersection of line with curve
F
D
F
D
xx
xxR
11
11
min
''
min xxyxR
D
D
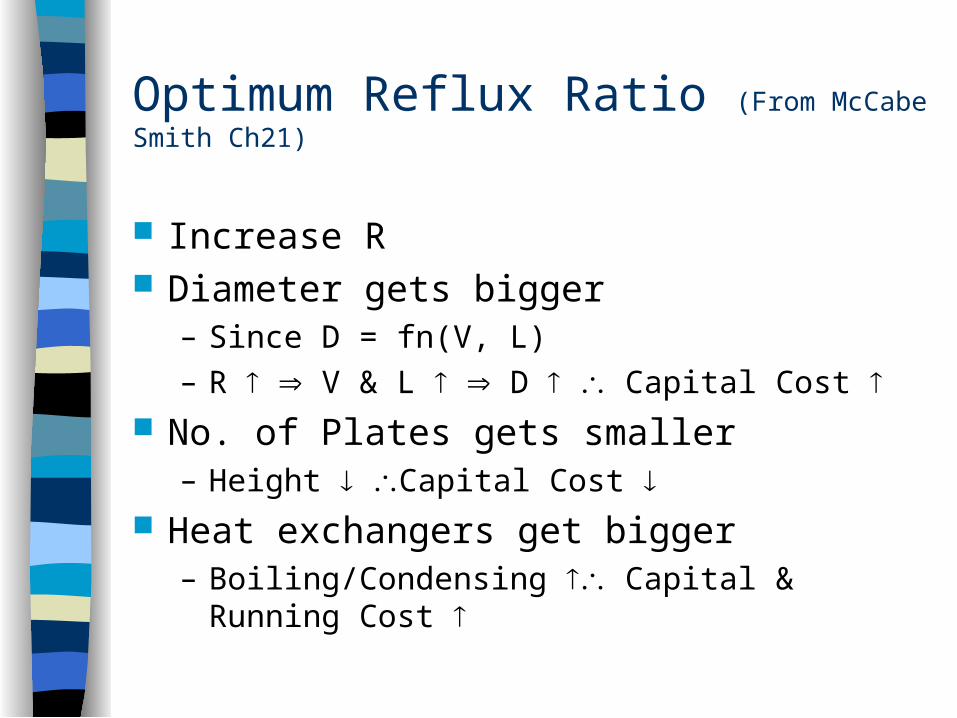
Optimum Reflux Ratio (From McCabe Smith Ch21)
Increase R Diameter gets bigger
– Since D = fn(V, L)– R V & L D Capital Cost
No. of Plates gets smaller– Height Capital Cost
Heat exchangers get bigger– Boiling/Condensing Capital & Running Cost
Optimum Reflux Ratio
Reflux Ratio
Ann
ual C
ost
Total Cost
Operating Cost
Captial/FixedCost
1.0
Min
Ref
lux
Rat
io
1.2 1.4 1.6 1.8 2.0
Opt
imum
Ref
lux
Rat
io
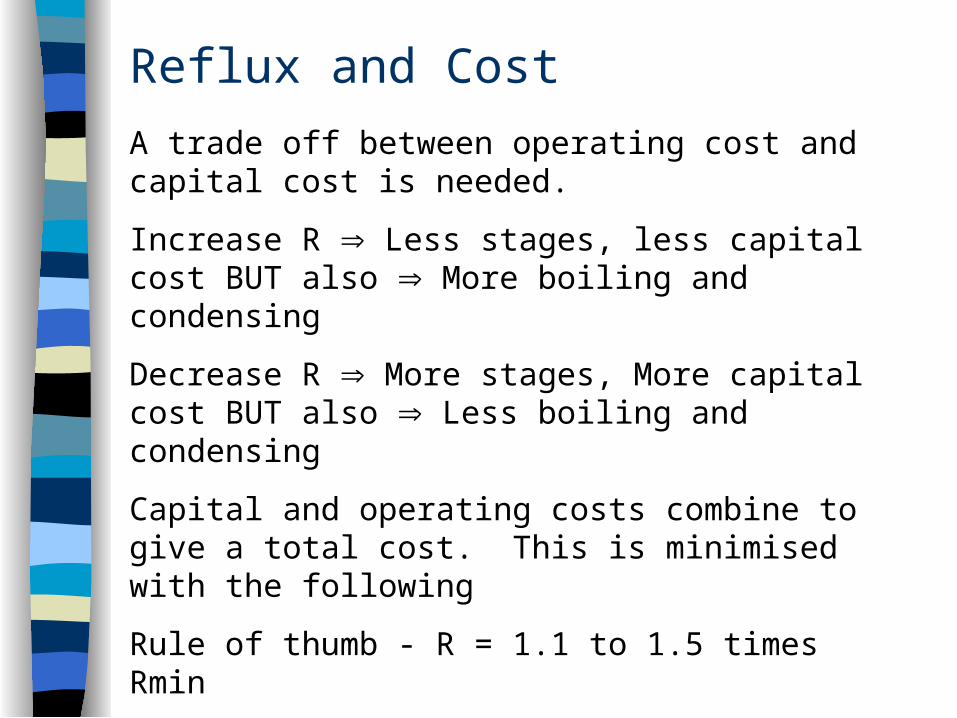
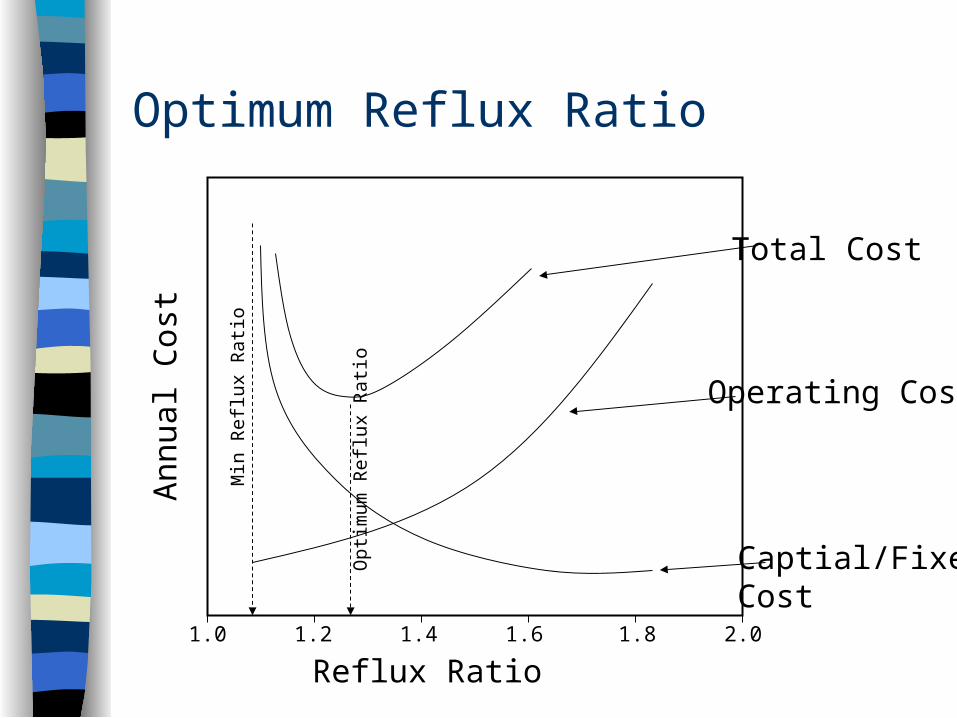
A trade off between operating cost and capital cost is needed.
Increase R Less stages, less capital cost BUT also More boiling and condensing
Decrease R More stages, More capital cost BUT also Less boiling and condensing
Capital and operating costs combine to give a total cost. This is minimised with the following
Rule of thumb - R = 1.1 to 1.5 times Rmin
Reflux and Cost
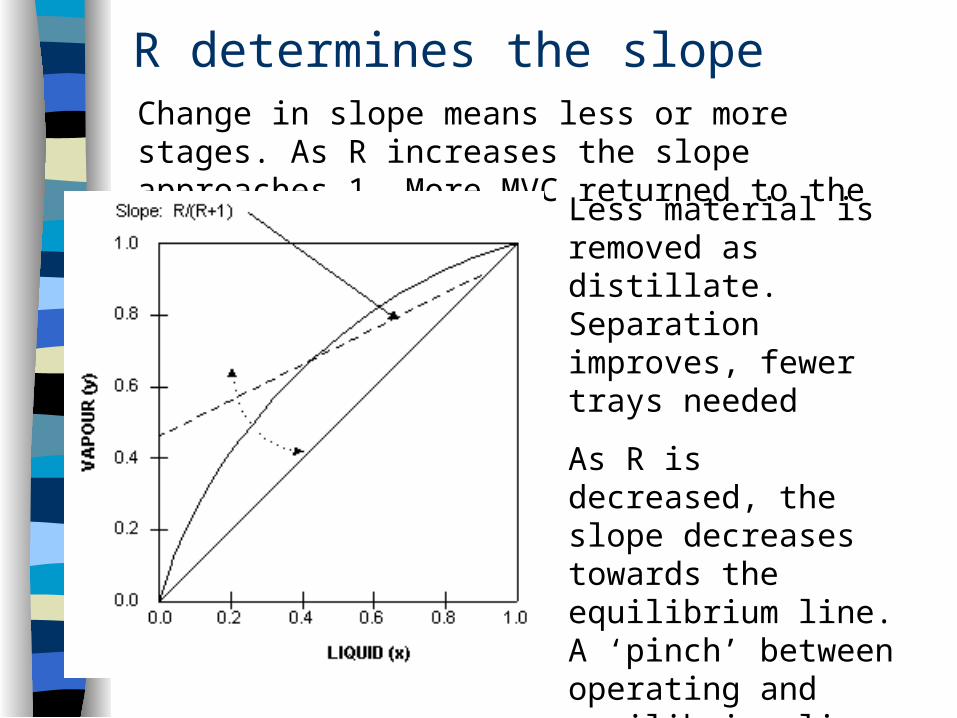
Change in slope means less or more stages. As R increases the slope approaches 1. More MVC returned to the column.
Less material is removed as distillate. Separation improves, fewer trays needed
As R is decreased, the slope decreases towards the equilibrium line.A ‘pinch’ between operating and equilibrium lines becomes more pronounced and more and more trays are required
R determines the slope
Activity – Reflux Ratio
Think, Pair, Share the following:
Calculate R for the Acetic Acid/Acetic Anhydride system from last week.
Reflux Control
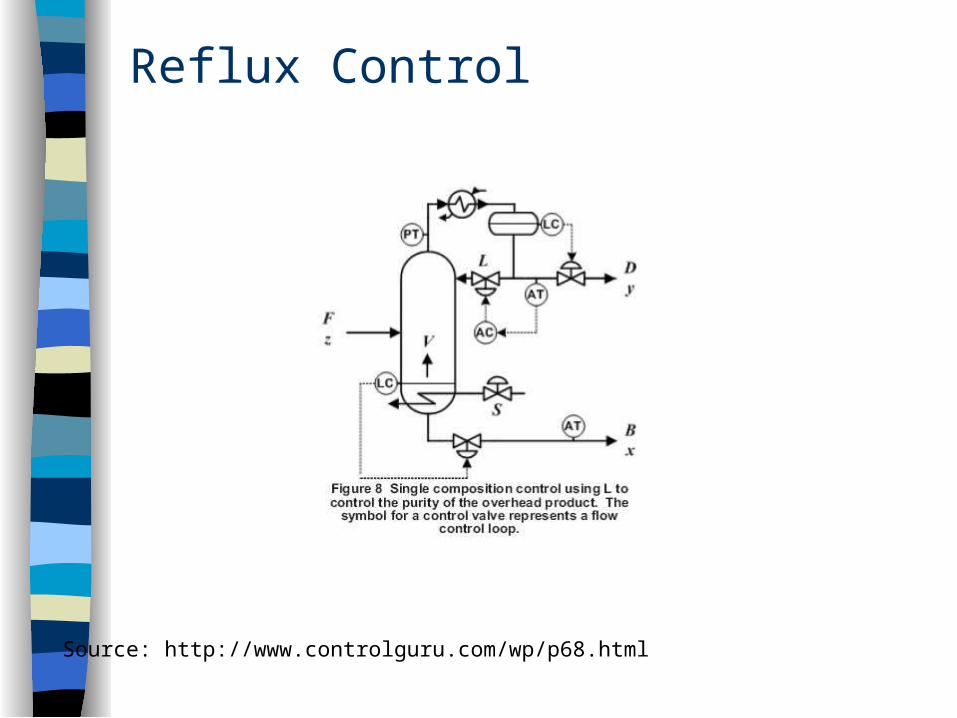
Source: http://www.controlguru.com/wp/p68.html
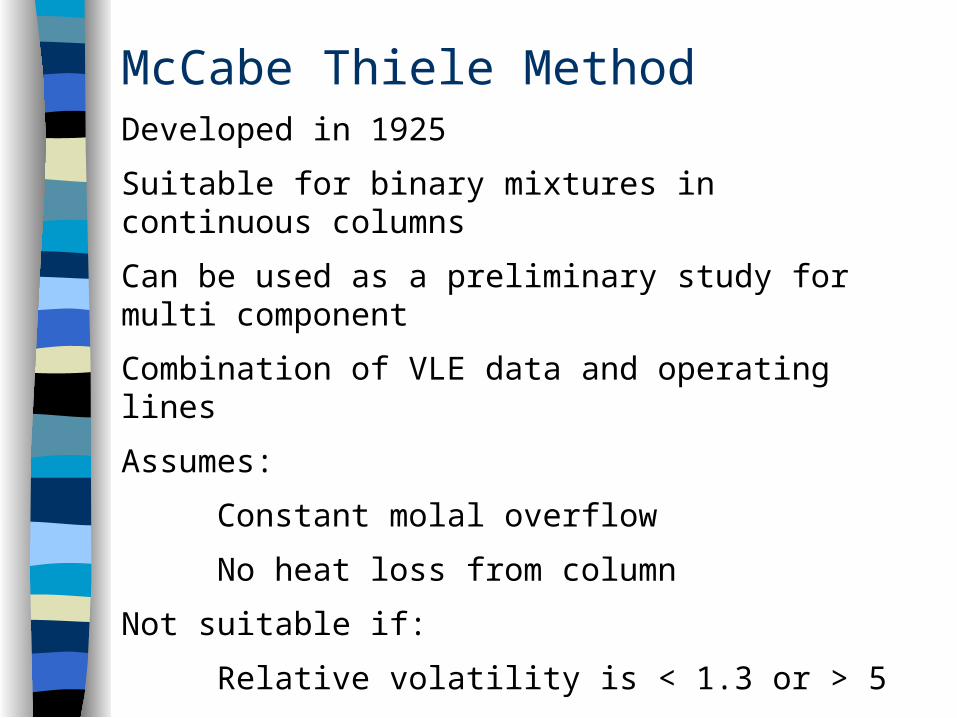
McCabe Thiele MethodDeveloped in 1925
Suitable for binary mixtures in continuous columns
Can be used as a preliminary study for multi component
Combination of VLE data and operating lines
Assumes:
Constant molal overflow
No heat loss from column
Not suitable if:
Relative volatility is < 1.3 or > 5
Reflux ratio < 1.1 Rmin
More than 25 theoretical stages needed
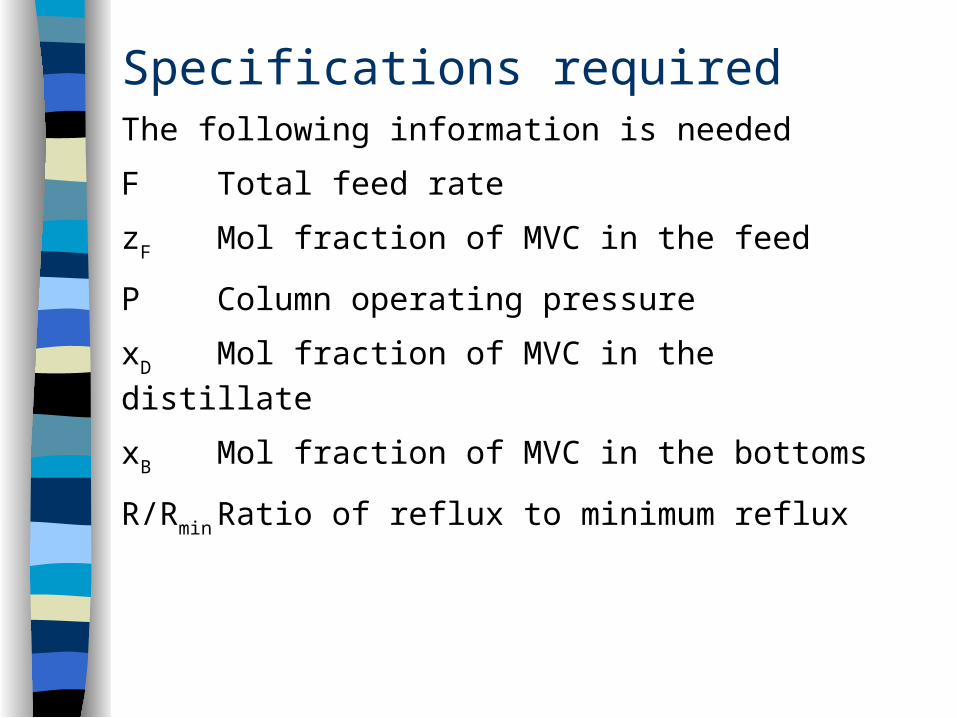
Specifications requiredThe following information is needed
F Total feed rate
zF Mol fraction of MVC in the feed
P Column operating pressure
xD Mol fraction of MVC in the distillate
xB Mol fraction of MVC in the bottoms
R/Rmin Ratio of reflux to minimum reflux
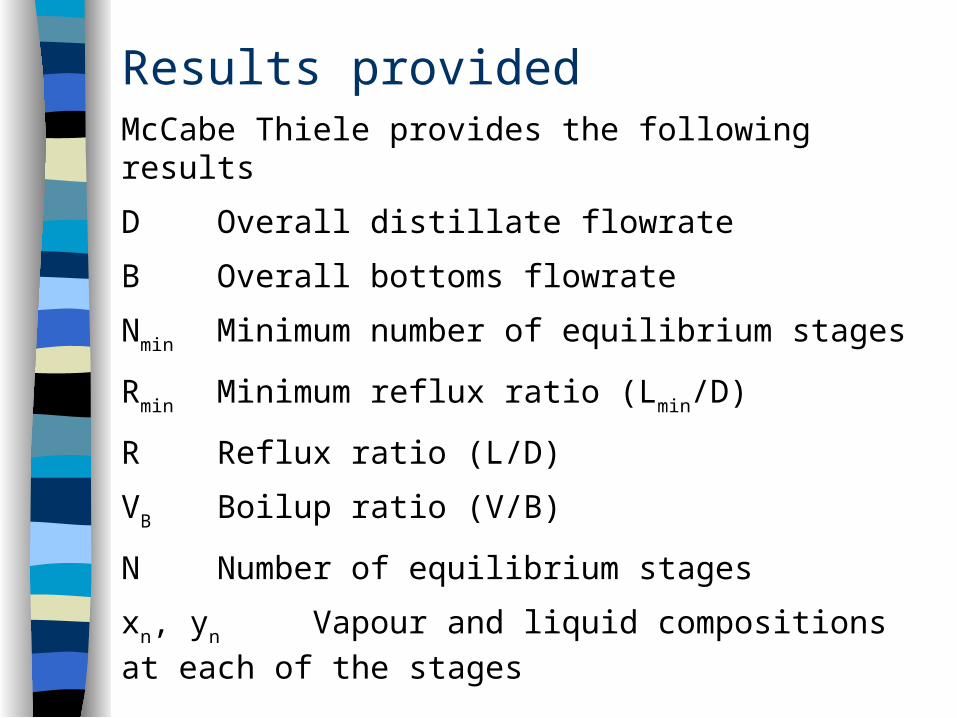
Results providedMcCabe Thiele provides the following results
D Overall distillate flowrate
B Overall bottoms flowrate
Nmin Minimum number of equilibrium stages
Rmin Minimum reflux ratio (Lmin/D)
R Reflux ratio (L/D)
VB Boilup ratio (V/B)
N Number of equilibrium stages
xn, yn Vapour and liquid compositions at each of the stages
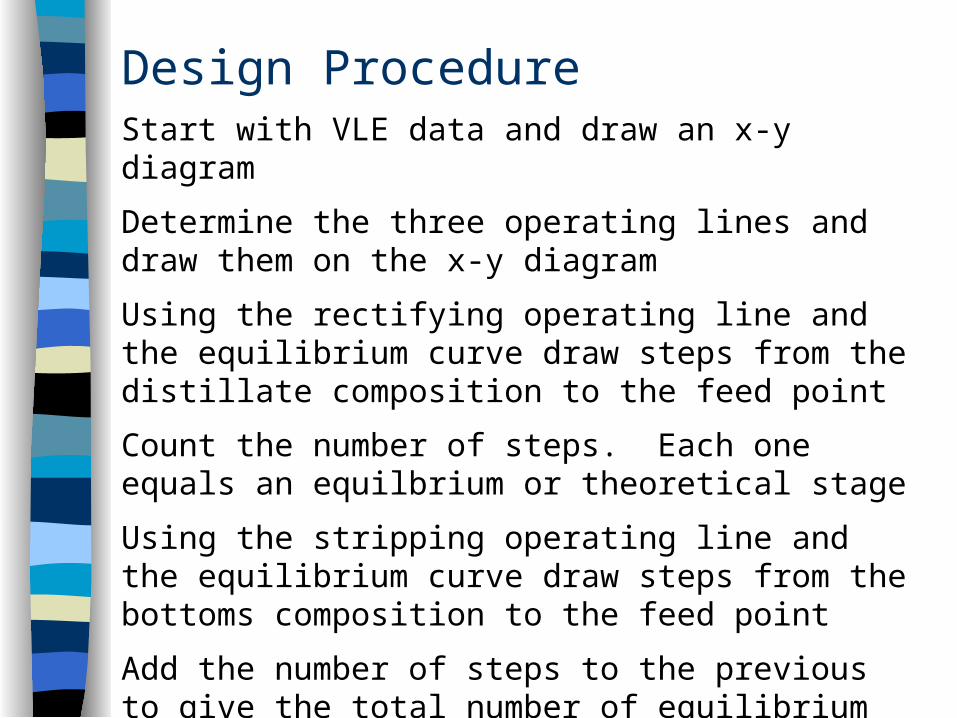
Design ProcedureStart with VLE data and draw an x-y diagram
Determine the three operating lines and draw them on the x-y diagram
Using the rectifying operating line and the equilibrium curve draw steps from the distillate composition to the feed point
Count the number of steps. Each one equals an equilbrium or theoretical stage
Using the stripping operating line and the equilibrium curve draw steps from the bottoms composition to the feed point
Add the number of steps to the previous to give the total number of equilibrium stages
Convert this to a number of plates by dividing by the plate efficiency.
1. Obtain VLE curve
0.0
0.1
0.2
0.3
0.4
0.5
0.6
0.7
0.8
0.9
1.0
0.0 0.1 0.2 0.3 0.4 0.5 0.6 0.7 0.8 0.9 1.0
Xa
Ya
XD
slope=R/(R+1)
XD/(R+1)
slope= (VB +1) /VB 2. Pick distillate composition, XD, and Reflux ratio, R, and draw operating line for rectification3. Pick bottoms composition, XB, and Boilup ratio, VB, and draw operating line for stripping
XB
4. Start stepping off from the distillate end until the intersection of the two operating lines is passed.5. Continue stepping but use the stripping operating line6. Count the number of stages
1
2
3
45
6
7. Subtract one for the reboiler to give the number of theoretical trays (or leave as safety factor)
Design Illustrated
Activity – Count no. of stagesThink, Pair, Share the following:
Determine the number of equilibrium stages needed to effect the specified separation for the Acetic Acid/Acetic Anhydride system
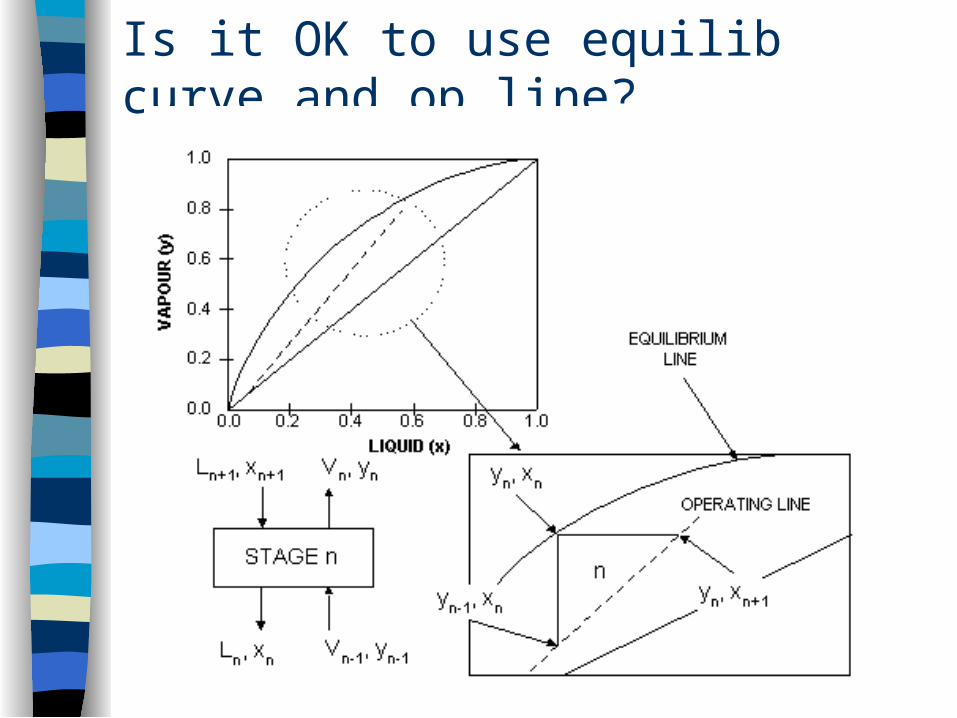
Is it OK to use equilib curve and op line?
I know the no. of equilibrium stagesThe hard work is done at this point. The no. of equilibrium stages must be converted to a number of actual real plates.
Typical values for tray efficiency are 0.5 to 0.75, I.e. they are 0.5 to 0.75 times as effective as an ideal stage.
Divide the number of ideal stages by the efficiency.
Don’t forget the boiler. This counts as one ideal stage. Delete 1 or leave it in as a safety factor.
Add 10% extra trays.
Trays and PlatesTrays and plates encourage vapour liquid contact so that falling liquid partially vaporises and rising vapor partially condenses to create more equilibrium stages.
This involves heat transfer which takes time. The plate provides an environment in which this can happen.
Trays should aim to minimise pressure drop.
The main designs are….
Bubble cap
Sieve tray
Valve tray
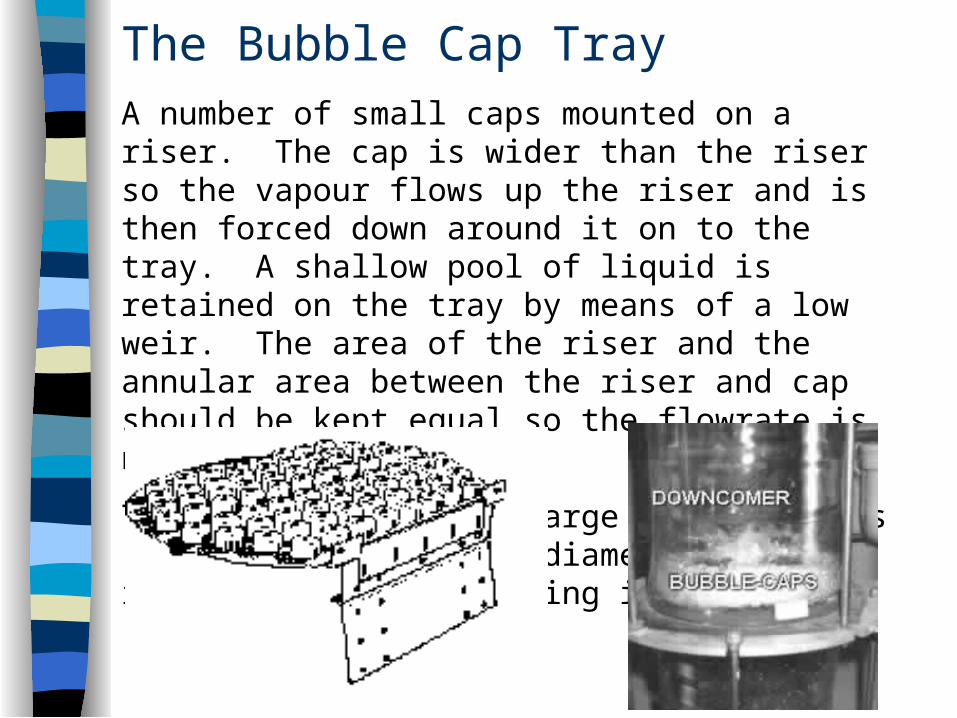
The Bubble Cap TrayA number of small caps mounted on a riser. The cap is wider than the riser so the vapour flows up the riser and is then forced down around it on to the tray. A shallow pool of liquid is retained on the tray by means of a low weir. The area of the riser and the annular area between the riser and cap should be kept equal so the flowrate is not restricted.
Trays suit medium to large sized columns (0.3 to 5m). On small diameter columns, installation and cleaning is difficult
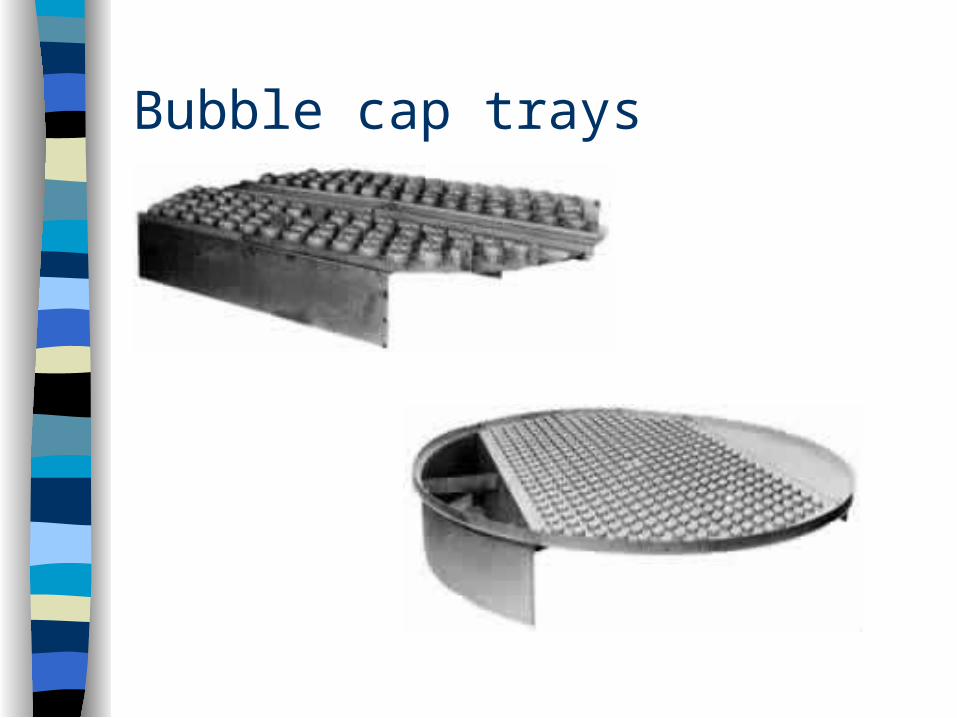
Bubble cap trays
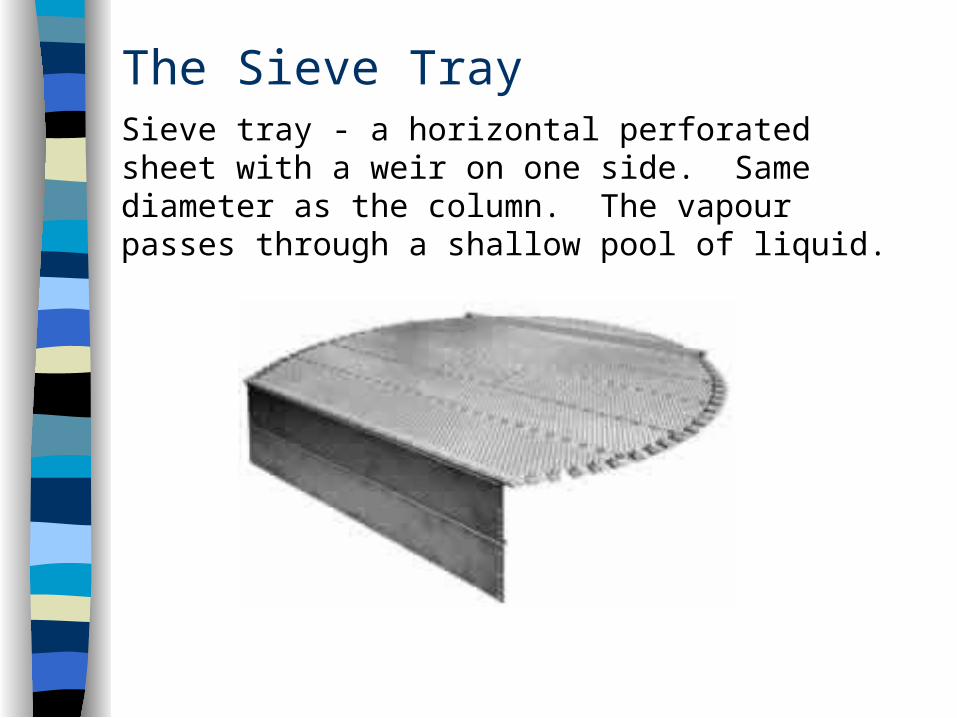
The Sieve TraySieve tray - a horizontal perforated sheet with a weir on one side. Same diameter as the column. The vapour passes through a shallow pool of liquid.
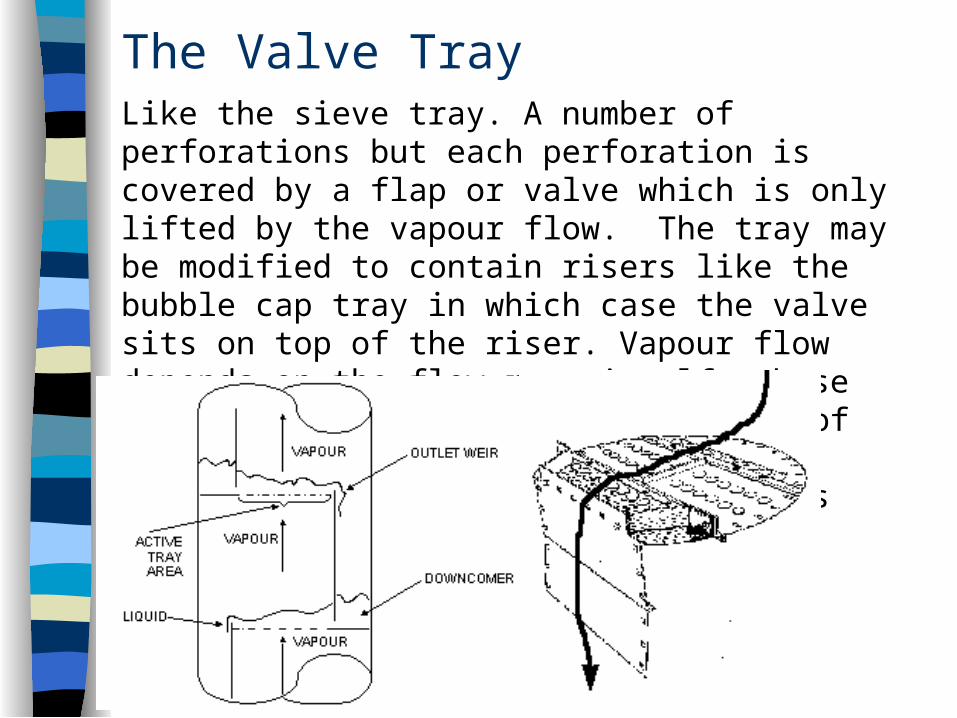
The Valve TrayLike the sieve tray. A number of perforations but each perforation is covered by a flap or valve which is only lifted by the vapour flow. The tray may be modified to contain risers like the bubble cap tray in which case the valve sits on top of the riser. Vapour flow depends on the flow rate itself, these trays can operate over a wide range of flow rates. It is not necessary to replace the trays if the flow rate is changed.
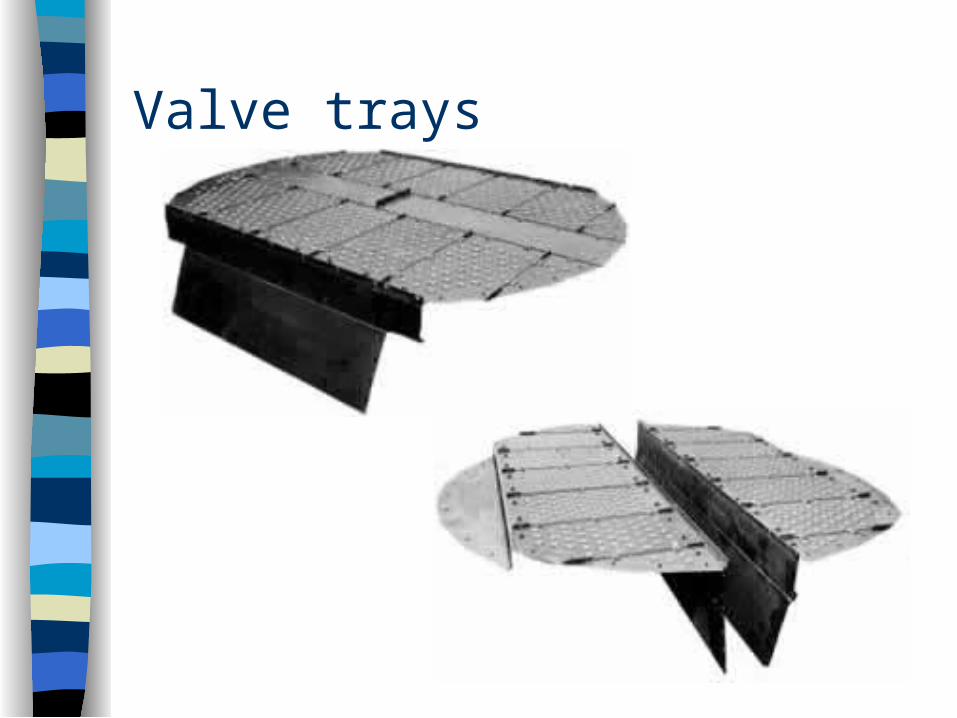
Valve trays
Problems with TraysAdverse vapour flow conditions can cause….
Coning - liquid rate too low. Vapour forces liquid away from slots and passes through as a continuous stream. No mixing
Dumping - vapour rate too low. Some slots dump liquid and don’t pass vapour. Vapour accumulates and eventually passes as a pulse.
Weeping - combination of pulsating vapour flow and dumping.
Problems with Trays contd…Flooding - vapour rate too high. This creates hold-up of liquid on the plate. Creates an increase in column pressure drop.
Entrainment - high vapour flow carries liquid back up the column to the previous tray.
Foaming - liquid expands due to passage of vapour. Although a large vapour liquid interfacial area is created, foaming can cause severe hold up of liquid on a tray.
The vapour rate must be adjustable to get it right
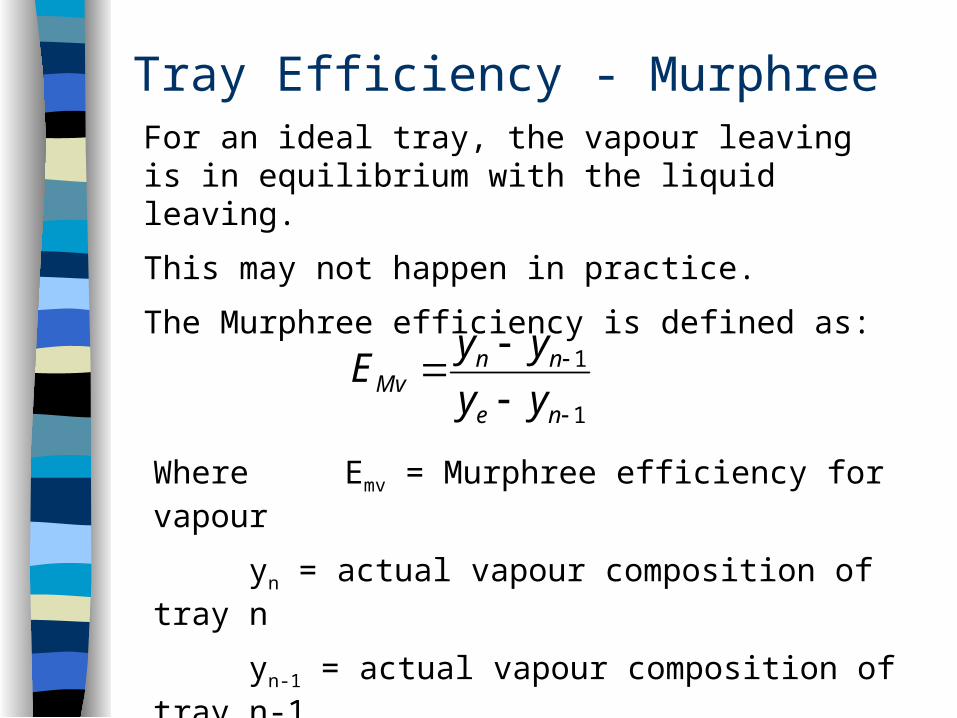
Tray Efficiency - MurphreeFor an ideal tray, the vapour leaving is in equilibrium with the liquid leaving.
This may not happen in practice.
The Murphree efficiency is defined as:
1
1
ne
nnMv yy
yyE
Where Emv = Murphree efficiency for vapour
yn = actual vapour composition of tray n
yn-1 = actual vapour composition of tray n-1
ye = vapour composition in equilibrium with liquid on tray n
PackingCan be used instead of trays
Very useful for small columns where installation of trays is difficult
Packing typically has a lower pressure drop than trays which makes it favourable for vacuum columns
Vapour liquid contact may not be as good. The liquid moves towards the walls and vapour flows more readily in the areas free of liquid.
Redistributors may be necessary
Quantity of height of packing = no. of stages x HETP
HETP = height equivalent to a theoretical plate
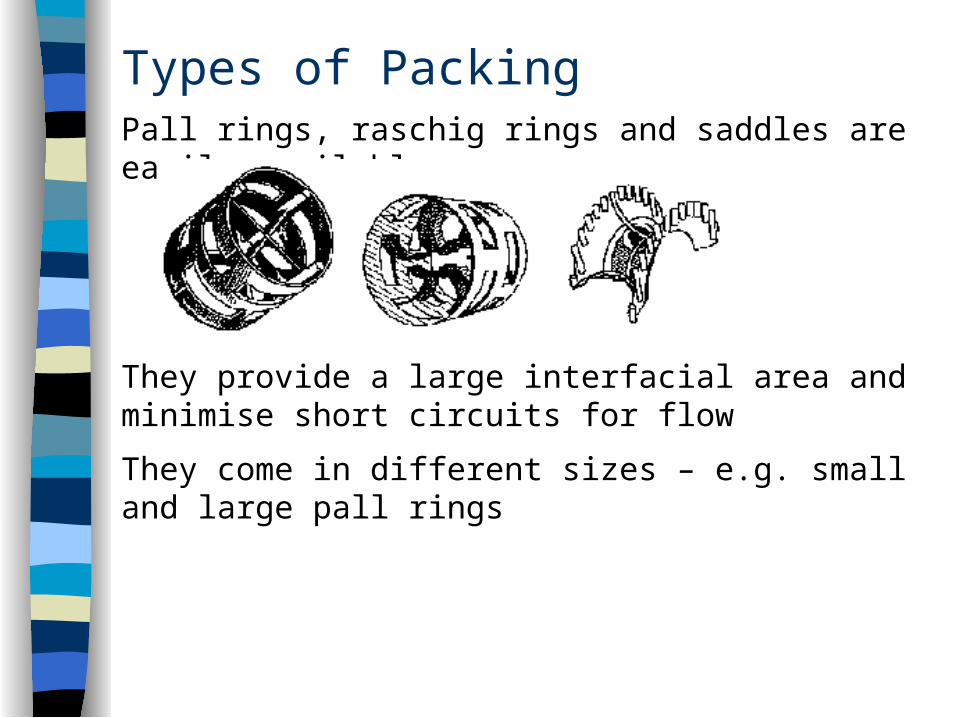
Types of PackingPall rings, raschig rings and saddles are easily available
They provide a large interfacial area and minimise short circuits for flow
They come in different sizes – e.g. small and large pall rings
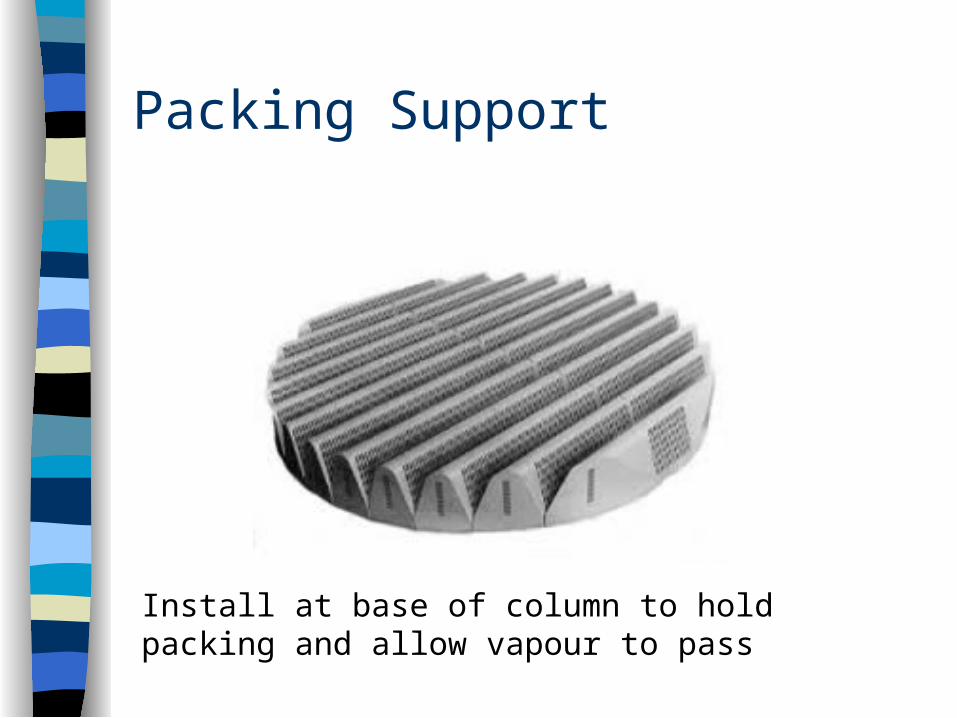
Packing Support
Install at base of column to hold packing and allow vapour to pass
HETPThe height of a particular packing that is equivalent to a theoretical plate does not just depend on its physical shape.
The vapour flow rate up the column also affects this number.
1.5 to 2” sizes of common packings allow the same vapour velocity as a sieve tray and have a HETP of 0.3 to 0.6 m (Unit Ops, McCabe Smith, 6th Ed., p699)
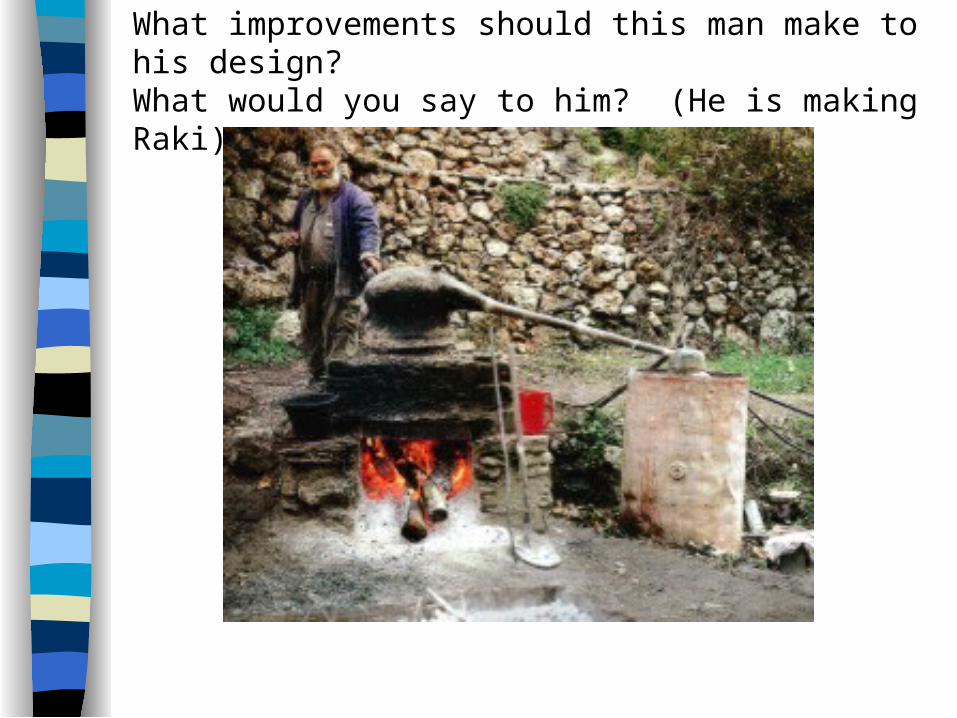
What improvements should this man make to his design?What would you say to him? (He is making Raki)