Session 186 PD, Individual Payout Annuity and Structured ... · Session 186 PD, Individual Payout...
35
Session 186 PD, Individual Payout Annuity and Structured Settlement Update Moderator: Korrel Rosenberg Presenters: Michel Desmarais, FSA, FCIA Christopher Almer Whitney, FSA, MAAA SOA Antitrust Disclaimer SOA Presentation Disclaimer
Transcript of Session 186 PD, Individual Payout Annuity and Structured ... · Session 186 PD, Individual Payout...

Session 186 PD, Individual Payout Annuity and Structured Settlement Update
Moderator:
Korrel Rosenberg
Presenters: Michel Desmarais, FSA, FCIA
Christopher Almer Whitney, FSA, MAAA
SOA Antitrust Disclaimer SOA Presentation Disclaimer
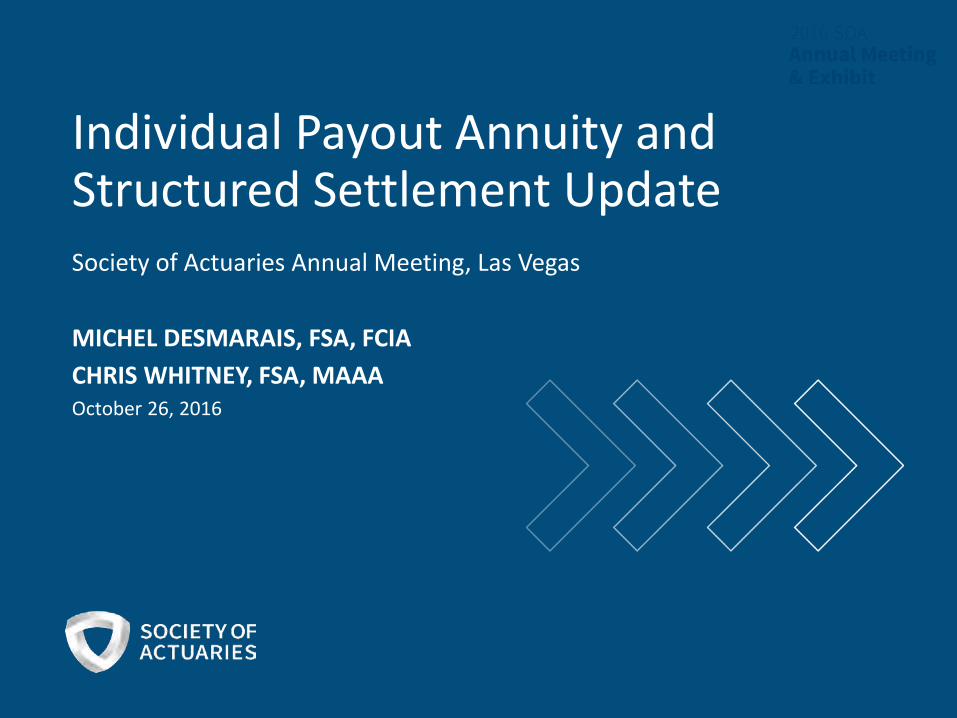
Individual Payout Annuity and Structured Settlement UpdateSociety of Actuaries Annual Meeting, Las Vegas
MICHEL DESMARAIS, FSA, FCIACHRIS WHITNEY, FSA, MAAAOctober 26, 2016

2
Agenda
1 Background
2 2000-08 Study Results
3 Next Steps

3
AcknowledgementsThis presentation would not have been possible without the support of the following individuals from the Society of Actuaries and the Structured Settlement Experience Subcommittee of the Individual Annuity Experience Committee
Society of Actuaries• Jack Luff• Patrick Nolan• Korrel Rosenberg
Committee Members
• Joel Sklar (Chair)• Zachary Granovetter• Craig Likkel• Danny Solorzano• Sean Souders• Mike Straus• Jacqueline Wetcher• Chris Whitney

Section 1 | Background

5
BackgroundA Structured Settlement Annuity is a stream of payments arising from court proceeds
Background
Common uses: Common goals are to:
• Workmen’s compensation• Individual long-term disability claims• Lawsuit settlements providing life-
contingent income• Medicare Set Asides (MSA’s)
• Control costs under malpractice claims• Ensure monies will be available in future
years• Structure payments based on the needs
of the individual

6
Structured Settlements Mortality StudiesHistorical SOA activity is shown in the timeline below
Background
1990 1995 2000 2005 2010 2015
1999
Mortality Experience Study
• Covers experience for 1966-97
• Includes 5,854 deaths
1993
TSA 1991-92 Reports
• Covers experience for 1966-89
• Includes 1,391 deaths
1997
TSA 1995-96 Reports
• Covers experience for 1966-93
• Includes 3,033 deaths
Feb. 2016
Mortality Experience Report & Associated Tables
• Covers experience for 2000-08
• Includes 7,749 deaths
[Dec. 2016]
Mortality Experience Report & Associated Tables
• Covers experience for 2009-13
• Includes 11,112 deaths
A report covering mortality experience for 2000-08 was released earlier this year and there are plans to release a report covering experience for 2009-13 later this year

7
Background
2000-08 StudyPurposes
1 To compare emerging SS experience to that assumed in currently-used valuation tables
2 For substandard business, develop A/E ratios using the ”true age + CED” method as well as the rated age method
3 To provide a credible basis for actuaries to assess mortality in this unique line of business
8
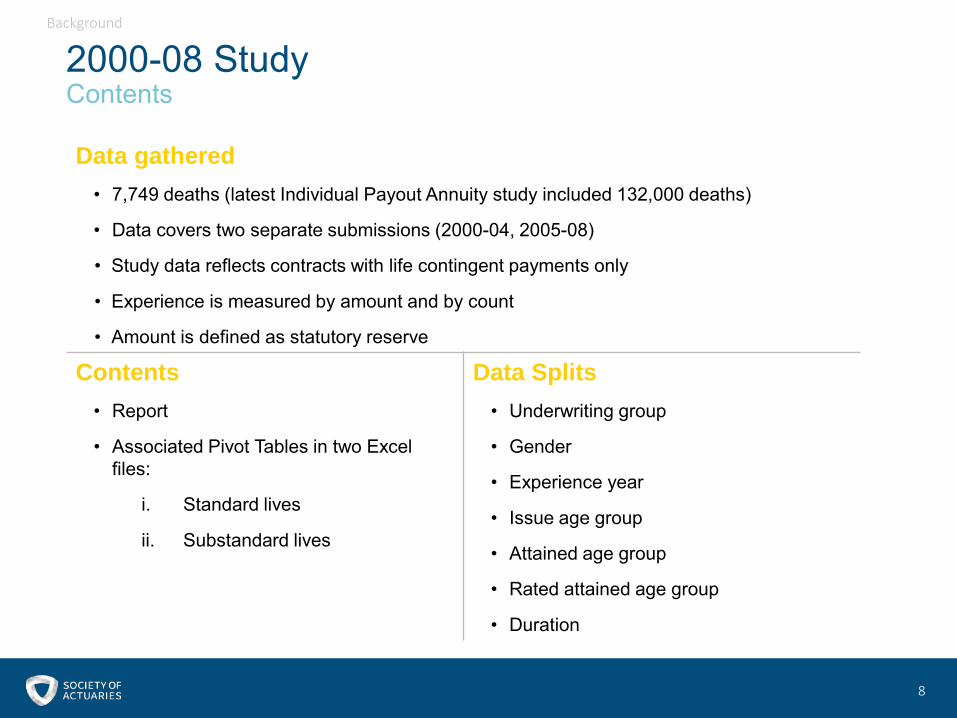
2000-08 StudyContents
Background
Data gathered • 7,749 deaths (latest Individual Payout Annuity study included 132,000 deaths)
• Data covers two separate submissions (2000-04, 2005-08)
• Study data reflects contracts with life contingent payments only
• Experience is measured by amount and by count
• Amount is defined as statutory reserve
Contents• Report
• Associated Pivot Tables in two Excel files:
i. Standard lives
ii. Substandard lives
Data Splits• Underwriting group
• Gender
• Experience year
• Issue age group
• Attained age group
• Rated attained age group
• Duration
9
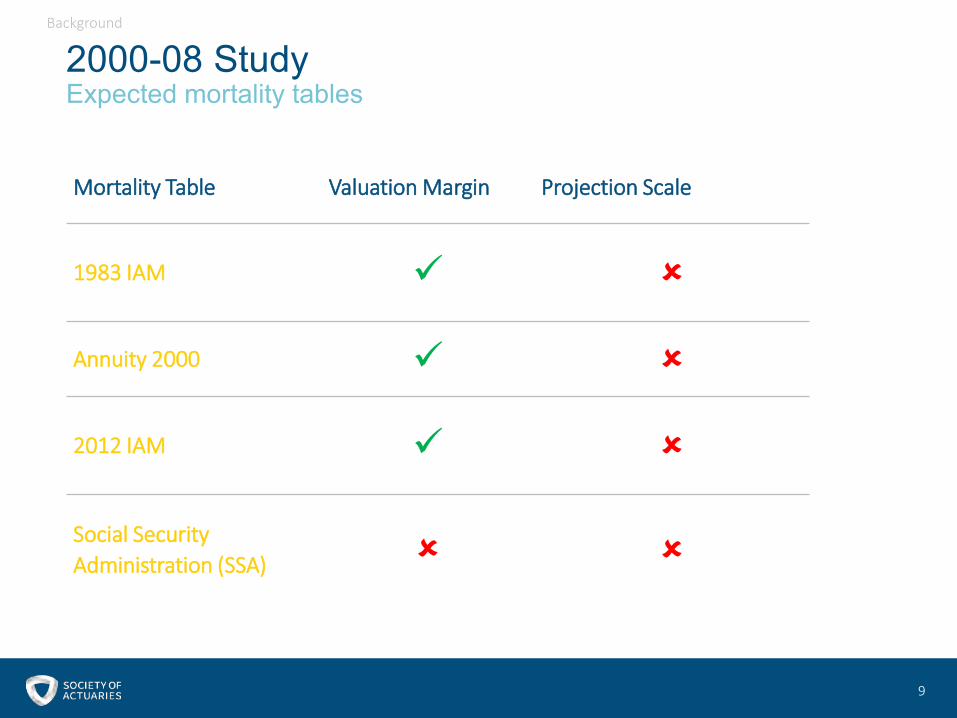
Mortality Table Valuation Margin Projection Scale
1983 IAM
Annuity 2000
2012 IAM
Social Security Administration (SSA)
Background
2000-08 StudyExpected mortality tables
10
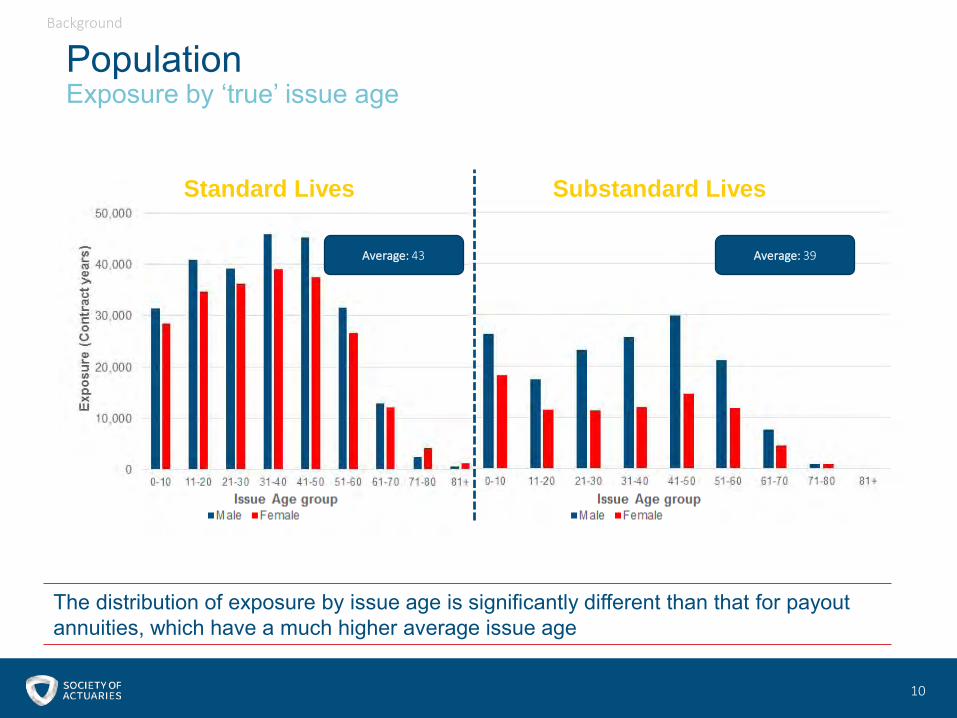
PopulationExposure by ‘true’ issue age
Background
Standard Lives Substandard Lives
Average: 43 Average: 39
The distribution of exposure by issue age is significantly different than that for payout annuities, which have a much higher average issue age
Section 2 | 2000-08 Study ResultsStandard Lives

12
Full Summary 2000-08 Study Results | Standard Lives

13
GenderA/E ratios by contract and by amount
2000-08 Study Results | Standard Lives

14
Study YearA/E ratios by contract and by amount
The decline between the 2 study periods indicates some mortality improvement but it also reflects:
• Random fluctuation• Differences in company mix between periods• Evolving changes in SS annuitant population
2000-08 Study Results | Standard Lives

15
Issue AgeA/E ratios by contract and by amount
2000-08 Study Results | Standard Lives

16
Attained AgeA/E ratios by contract and by amount
• Results mirror those by issue age• Steady decline after attained age 35• Overall A/E Ratios exceed 100%• A/E Ratios drop below 100% at higher ages
Ages at which expected deaths > actual
By contract By amount
1983 IAM 96+ 76+
2012 IAM 96+ 86+
2000-08 Study Results | Standard Lives

17
DurationA/E ratios by contract and by amount
• 4 duration groups:− to make output more manageable− to reduce random fluctuation
• A/E Ratios increase with early durations− There is some selection− Selection wears off after 10 years
2000-08 Study Results | Standard Lives

Section 2 | 2000-08 Study ResultsSubstandard Lives

1919
Approach Description
1 Non-Rated • Mortality is based off the natural age of the annuitant• This approach is not commonly used in practice
2 Rated Age
• A rated age is determined at issue such that the life expectancy of the rated age is equal to the reduced life expectancy of the annuitant
• Mortality is based on this rated age• It is common to price structured settlement contracts using the rated
age of the annuitant
3 Constant Extra Deaths (CED)
• A constant addition to mortality rates is determined at issue as an amount such that the life expectancy is equal to the reduced life expectancy of the annuitant
• This approach is permitted as a minimum for Statutory reserving purposes under Actuarial Guideline IX-A
BackgroundRated mortality approaches
2000-08 Study Results | Substandard Lives

2020
BackgroundComparison of approaches
The extra mortality is front-loaded under the CED approach and more level under Rated Age
2000-08 Study Results | Substandard Lives
Mortality: 1983 IAMGender: MaleIssue Age: 35Rated Age: 65CED: 44 per 1,000
2121
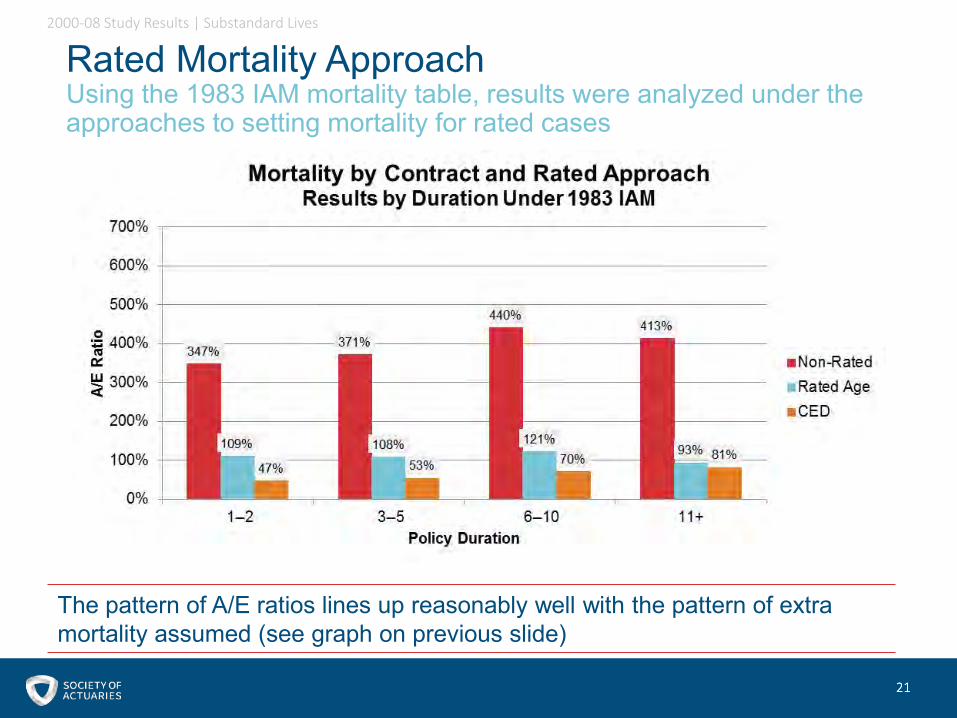
Rated Mortality ApproachUsing the 1983 IAM mortality table, results were analyzed under the approaches to setting mortality for rated cases
The pattern of A/E ratios lines up reasonably well with the pattern of extra mortality assumed (see graph on previous slide)
2000-08 Study Results | Substandard Lives

2222
Rated Mortality ApproachUsing the 2012 IAM mortality table, results were analyzed under the approaches to setting mortality for rated cases
The 2012 IAM table assumes mortality lower than structured settlement experience
2000-08 Study Results | Substandard Lives
2323
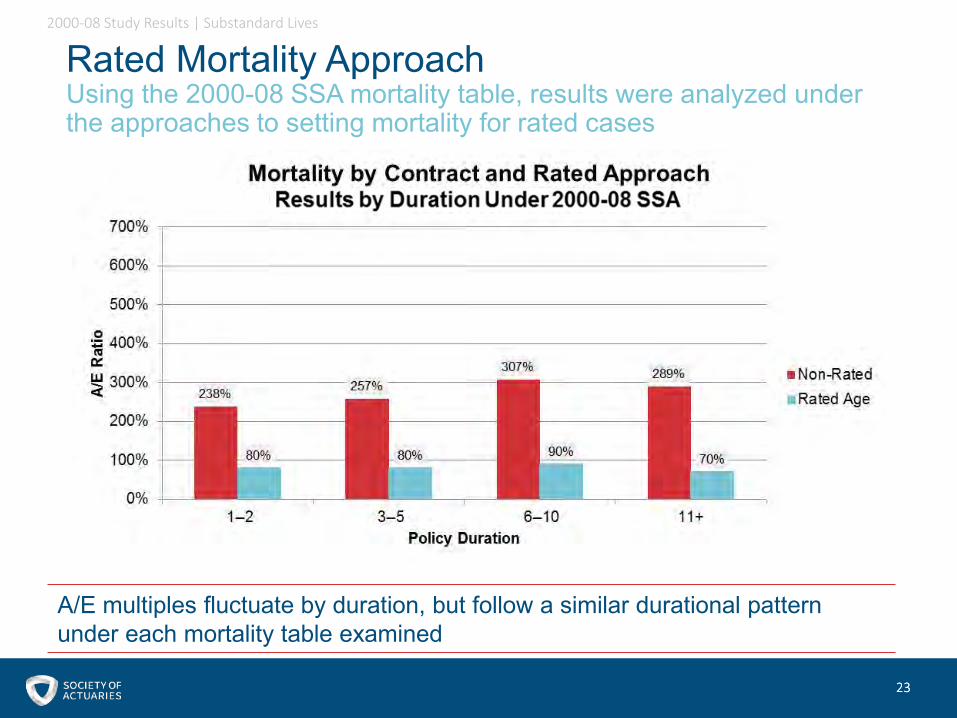
Rated Mortality ApproachUsing the 2000-08 SSA mortality table, results were analyzed under the approaches to setting mortality for rated cases
A/E multiples fluctuate by duration, but follow a similar durational pattern under each mortality table examined
2000-08 Study Results | Substandard Lives

2424
Expected Mortality TableRated age A/E’s weighted by contract are shown below by duration under each of the three mortality tables
A/E multiples fluctuate by duration, but follow a similar durational pattern under each mortality table examined
2000-08 Study Results | Substandard Lives

2525
Study YearRated age A/E’s weighted by contract are shown below by study year under the 1983 IAM and 2000-08 SSA mortality tables
The study compiles two sets of experience data. The split is indicated by the dotted line in the chart above
2000-08 Study Results | Substandard Lives

2626
Exposure BasisRated age A/E’s weighted by contract and amount are shown below by duration under the 1983 IAM mortality table
Results fluctuate by count and amount. More ‘count’ data was submitted and results by count are less prone to large case bias
2000-08 Study Results | Substandard Lives

2727
GenderRated age A/E’s weighted by contract are shown below by duration split by gender under the 1983 IAM mortality table
A/E’s for females are higher than males. This is the case under the various mortality tables examined
2000-08 Study Results | Substandard Lives

2828
AgeA/E’s by contract under the 1983 IAM mortality table are shown below, split by rated attained age and rated issue age
Although A/E’s exhibit a durational pattern, there is a downward trend by rated issue age and attained age
2000-08 Study Results | Substandard Lives

Section 2 | 2000-08 Study ResultsKey Findings

3030
Findings Standard Rated
1 The business mix differs greatly from retirement annuities
2 Available mortality tables do not provide a good fit for experience
3 Structured settlement business exhibits true age mortality levels well in excess of rates in annuity valuation tables
Key FindingsThe following table summarizes findings from this study for rated and non-rated cases
2000-08 Study Results | Key Findings

Section 3 | Next Steps
3232
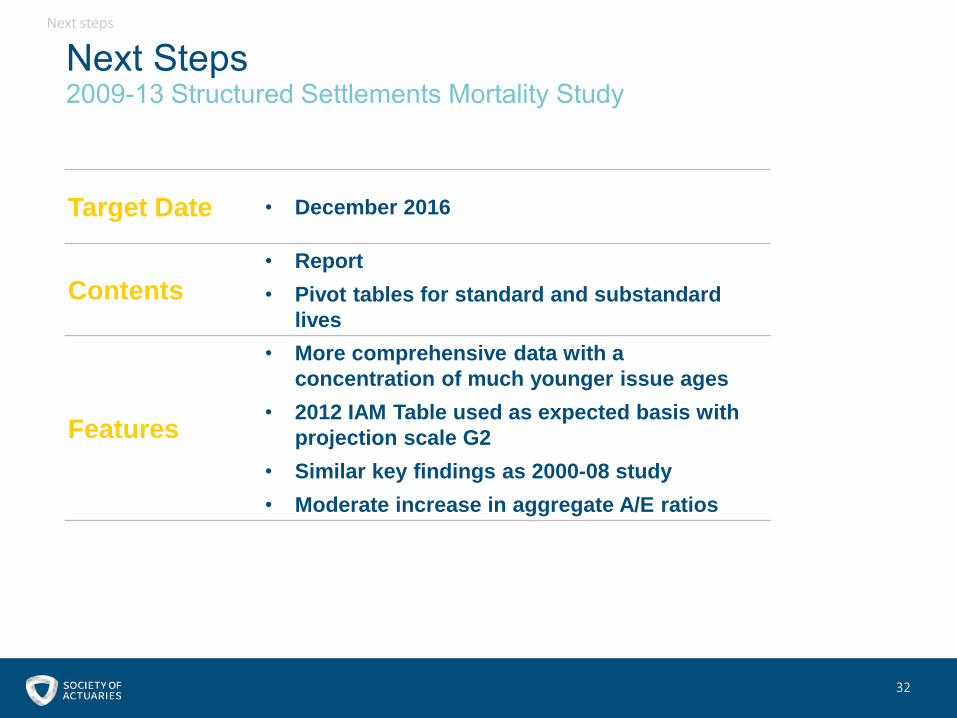
Target Date • December 2016
Contents• Report • Pivot tables for standard and substandard
lives
Features
• More comprehensive data with a concentration of much younger issue ages
• 2012 IAM Table used as expected basis with projection scale G2
• Similar key findings as 2000-08 study• Moderate increase in aggregate A/E ratios
Next steps
Next Steps2009-13 Structured Settlements Mortality Study
3333
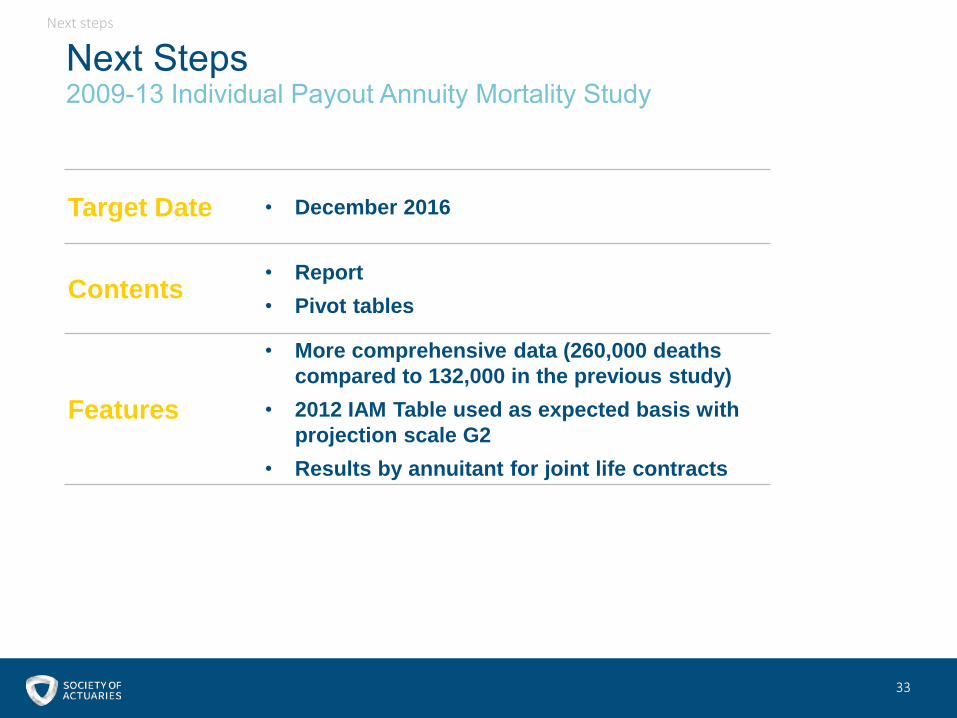
Target Date • December 2016
Contents• Report • Pivot tables
Features
• More comprehensive data (260,000 deaths compared to 132,000 in the previous study)
• 2012 IAM Table used as expected basis with projection scale G2
• Results by annuitant for joint life contracts
Next steps
Next Steps2009-13 Individual Payout Annuity Mortality Study