Session 16
76
Stepwise Table of Results for Forward Selection X Variable 3 entered. df SS MS F Regression 1 319210727.6174 319210727.6174 257.1256 Residual 30 37243748.6014 1241458.2867 Total 31 356454476.2188 Coefficients Standard Error t Stat P-value Intercept 331.0258 229.0539 1.4452 0.1588 X Variable 3 5.5128 0.3438 16.0351 0.0000 X Variable 1 entered. df SS MS F Regression 2 337383009.0217 168691504.5109 256.5117 Residual 29 19071467.1970 657636.7999 Total 31 356454476.2188 Coefficients Standard Error t Stat P-value Intercept 36.2780 175.8880 0.2063 0.8380 X Variable 3 12.1075 1.2792 9.4646 0.0000 X Variable 1 -0.0021 0.0004 -5.2567 0.0000 X Variable 2 entered. df SS MS F Regression 3 340969314.2090 113656438.0697 205.5116 Residual 28 15485162.0098 553041.5003 Total 31 356454476.2188 Coefficients Standard Error t Stat P-value Intercept -127.5137 173.6470 -0.7343 0.4689 X Variable 3 13.7195 1.3330 10.2922 0.0000 X Variable 1 -0.0028 0.0005 -6.0669 0.0000 X Variable 2 1.9760 0.7760 2.5465 0.0167
-
Upload
hiteshsharma -
Category
Documents
-
view
10 -
download
0
description
Session 16
Transcript of Session 16

StepwiseTable of Results for Forward Selection
X Variable 3 entered.
df SS MS FRegression 1 319210727.6174 319210727.6174 257.1256Residual 30 37243748.6014 1241458.2867Total 31 356454476.2188
Coefficients Standard Error t Stat P-valueIntercept 331.0258 229.0539 1.4452 0.1588X Variable 3 5.5128 0.3438 16.0351 0.0000
X Variable 1 entered.
df SS MS FRegression 2 337383009.0217 168691504.5109 256.5117Residual 29 19071467.1970 657636.7999Total 31 356454476.2188
Coefficients Standard Error t Stat P-valueIntercept 36.2780 175.8880 0.2063 0.8380X Variable 3 12.1075 1.2792 9.4646 0.0000X Variable 1 -0.0021 0.0004 -5.2567 0.0000
X Variable 2 entered.
df SS MS FRegression 3 340969314.2090 113656438.0697 205.5116Residual 28 15485162.0098 553041.5003Total 31 356454476.2188
Coefficients Standard Error t Stat P-valueIntercept -127.5137 173.6470 -0.7343 0.4689X Variable 3 13.7195 1.3330 10.2922 0.0000X Variable 1 -0.0028 0.0005 -6.0669 0.0000X Variable 2 1.9760 0.7760 2.5465 0.0167

Significance F0.0000
Lower 95% Upper 95%-136.7647 798.8164
4.8107 6.2149
Significance F0.0000
Lower 95% Upper 95%-323.4533 396.0094
9.4911 14.7239-0.0029 -0.0013
Significance F0.0000
Lower 95% Upper 95%-483.2136 228.1861
10.9889 16.4500-0.0038 -0.00190.3865 3.5655

Y Var X Variable X Variable X Variable 312261 9700000 1361.24 2735.216244 5420000 317.13 2208.8
4716 1970000 1236.84 563.52486 1830000 143.6 694.24575 1240000 127.29 478.23167 810000 80.55 311.71622 610000 50.22 271.11446 560000 35.16 328.81212 490000 237.64 159.42312 470000 63.71 203.6
741 460000 30 222.22330 450000 201.03 274.71758 450000 118.4 187.7
961 430000 23.26 125.7988 410000 77.08 234.2
1813 410000 59.83 162.5579 360000 52.98 123.8
2252 360000 65.81 245.4802 350000 38.5 97.6335 320000 45.46 125.3492 310429.3 29.79 76.3
1407 300000 46.7 144.81125 278866.3 75.63 119.2
902 270000 23.36 109.4646 230000 65.93 117.6232 222990.6 17.1 58.1538 208864.6 83.66 87.1747 195212.2 40.12 82.1402 178217.2 29.28 86.8515 174912.1 184.88 69.3271 170376.4 8.26 89.3710 160000 16.81 89.1

Stepwise
Regression StatisticsMultiple R 0.9780R Square 0.9566Adjusted R Square 0.9519Standard Error 743.6676Observations 32
ANOVAdf SS MS F
Regression 3 340969314.2090 ### 205.5116Residual 28 15485162.0098 553041.5003Total 31 356454476.2188
Coefficients Standard Error t Stat P-valueIntercept -127.5137 173.6470 -0.7343 0.4689X Variable 1 -0.0028 0.0005 -6.0669 #NAME?X Variable 2 1.9760 0.7760 2.5465 #NAME?X Variable 3 13.7195 1.3330 10.2922 #NAME?

Significance F0.0000
Lower 95% Upper 95% Lower 95% Upper 95%-483.2136 228.1861 -483.2136 228.1861
-0.0038 -0.0019 -0.0038 -0.00190.3865 3.5655 0.3865 3.5655
10.9889 16.4500 10.9889 16.4500

Calculationsb3 through b0 intercepts 13.7195 1.9760 -0.0028 -127.5137b3 through b0 Standard Error 1.3330 0.7760 0.0005 173.64704R Square, Standard Error 0.9566 743.6676 #N/A #N/A
205.5116 28 #N/A #N/A340969314.21 15485162.01 #N/A #N/A
Confidence level 95%2.0484
355.69980.00101.58952.7305
F, Residual dfRegression SS, Residual SS
t Critical ValueHalf Width b0Half Width b1Half Width b2Half Width b3

Subset-model buildX Variable 3 (X3)
Regression Statistics Note:Multiple R 0.9463 This worksheet does not recalculate.R Square 0.8955 If regression data changes, rerun procedureAdjusted R Square 0.8920 to create an updated version of this worksheet.Standard Error 1114.2075Observations 32
ANOVAdf SS MS F
Regression 1 319210727.6174 ### 257.1256Residual 30 37243748.6014 ###Total 31 356454476.2188
Coefficients Standard Error t Stat P-valueIntercept 331.0258 229.0539 1.4452 0.1588X Variable 3 5.5128 0.3438 16.0351 0.0000

This worksheet does not recalculate.If regression data changes, rerun procedureto create an updated version of this worksheet.
Significance F0.0000
Lower 95% Upper 95% Lower 95% Upper 95%-136.7647 798.8164 -136.7647 798.81638
4.8107 6.2149 4.8107 6.21493
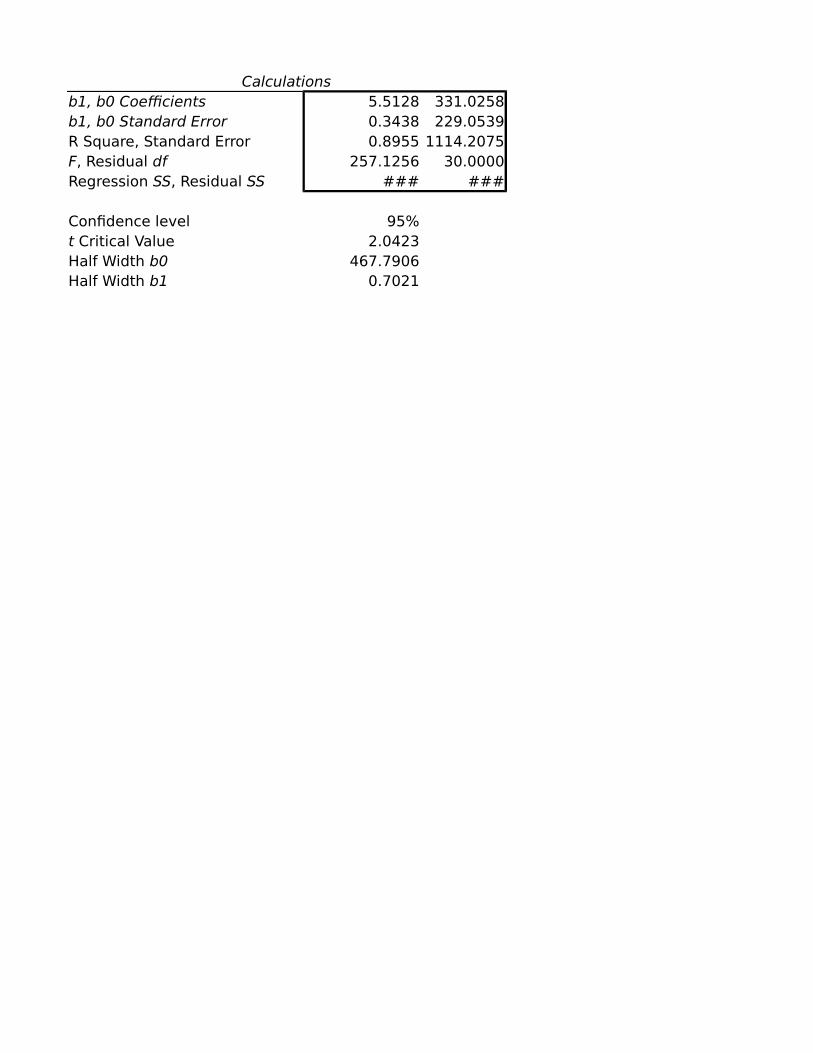
Calculationsb1, b0 Coefficients 5.5128 331.0258b1, b0 Standard Error 0.3438 229.0539R Square, Standard Error 0.8955 1114.2075
257.1256 30.0000### ###
Confidence level 95%2.0423
467.79060.7021
F, Residual dfRegression SS, Residual SS
t Critical ValueHalf Width b0Half Width b1

Subset-model buildX2 X3
Regression Statistics Note:Multiple R 0.9484 This worksheet does not recalculate.R Square 0.8995 If regression data changes, rerun procedureAdjusted R Square 0.8925 to create an updated version of this worksheet.Standard Error 1111.7068Observations 32
ANOVAdf SS MS F
Regression 2 320613611.0821 ### 129.7094Residual 29 35840865.1367 1235891.9013Total 31 356454476.2188
Coefficients Standard Error t Stat P-valueIntercept 359.8549 230.1361 1.5637 0.1287X Variable 2 -0.9650 0.9058 -1.0654 0.2955X Variable 3 5.8703 0.4798 12.2340 0.0000

This worksheet does not recalculate.If regression data changes, rerun procedureto create an updated version of this worksheet.
Significance F0.0000
Lower 95% Upper 95% Lower 95% Upper 95%-110.8264 830.5362 -110.8264 830.5362
-2.8175 0.8875 -2.8175 0.88754.8889 6.8516 4.8889 6.8516

Calculations5.8703 -0.9650 359.85490.4798 0.9058 230.1361
R Square, Standard Error 0.8995 1111.7068 Err:512129.7094 29 Err:512
320613611.08 35840865.137 Err:512
Confidence level 95%2.0452
470.68131.85250.9814
b2, b1, b0 interceptsb2, b1, b0 Standard Error
F, Residual dfRegression SS, Residual SS
t Critical ValueHalf Width b0Half Width b1Half Width b2

Subset-model buildX Variable 2 (X2)
Regression Statistics Note:Multiple R 0.6169 This worksheet does not recalculate.R Square 0.3805 If regression data changes, rerun procedureAdjusted R Square 0.3599 to create an updated version of this worksheet.Standard Error 2713.0354Observations 32
ANOVAdf SS MS F
Regression 1 135637639.2832 ### 18.4276Residual 30 220816836.9356 ###Total 31 356454476.2188
Coefficients Standard Error t Stat P-valueIntercept 1148.6379 539.1384 2.1305 0.0414X Variable 2 6.7834 1.5802 4.2927 0.0002

This worksheet does not recalculate.If regression data changes, rerun procedureto create an updated version of this worksheet.
Significance F0.0002
Lower 95% Upper 95% Lower 95% Upper 95%47.5704 2249.7054 47.5704 2249.70537
3.5562 10.0106 3.5562 10.01063

Calculationsb1, b0 Coefficients 6.7834 1148.6379b1, b0 Standard Error 1.5802 539.1384R Square, Standard Error 0.3805 2713.0354
18.4276 30.0000### ###
Confidence level 95%2.0423
1101.06753.2272
F, Residual dfRegression SS, Residual SS
t Critical ValueHalf Width b0Half Width b1

Subset-model buildX1 X3
Regression Statistics Note:Multiple R 0.9729 This worksheet does not recalculate.R Square 0.9465 If regression data changes, rerun procedureAdjusted R Square 0.9428 to create an updated version of this worksheet.Standard Error 810.9481Observations 32
ANOVAdf SS MS F
Regression 2 337383009.0217 ### 256.5117Residual 29 19071467.1970 657636.7999Total 31 356454476.2188
Coefficients Standard Error t Stat P-valueIntercept 36.2780 175.8880 0.2063 0.8380X Variable 1 -0.0021 0.0004 -5.2567 0.0000X Variable 3 12.1075 1.2792 9.4646 0.0000

This worksheet does not recalculate.If regression data changes, rerun procedureto create an updated version of this worksheet.
Significance F0.0000
Lower 95% Upper 95% Lower 95% Upper 95%-323.4533 396.0094 -323.4533 396.0094
-0.0029 -0.0013 -0.0029 -0.00139.4911 14.7239 9.4911 14.7239

Calculations12.1075 -0.0021 36.2780
1.2792 0.0004 175.8880R Square, Standard Error 0.9465 810.9481 Err:512
256.5117 29 Err:512337383009 19071467.197 Err:512
Confidence level 95%2.0452
359.73130.00082.6164
b2, b1, b0 interceptsb2, b1, b0 Standard Error
F, Residual dfRegression SS, Residual SS
t Critical ValueHalf Width b0Half Width b1Half Width b2

Subset-model build
Regression Statistics Note:Multiple R 0.9780 This worksheet does not recalculate.R Square 0.9566 If regression data changes, rerun procedureAdjusted R Square 0.9519 to create an updated version of this worksheet.Standard Error 743.6676Observations 32
ANOVAdf SS MS F
Regression 3 340969314.2090 ### 205.5116Residual 28 15485162.0098 553041.5003Total 31 356454476.2188
Coefficients Standard Error t Stat P-valueIntercept -127.5137 173.6470 -0.7343 0.4689X Variable 1 -0.0028 0.0005 -6.0669 0.0000X Variable 2 1.9760 0.7760 2.5465 0.0167X Variable 3 13.7195 1.3330 10.2922 0.0000

This worksheet does not recalculate.If regression data changes, rerun procedureto create an updated version of this worksheet.
Significance F0.0000
Lower 95% Upper 95% Lower 95% Upper 95%-483.2136 228.1861 -483.2136 228.1861
-0.0038 -0.0019 -0.0038 -0.00190.3865 3.5655 0.3865 3.5655
10.9889 16.4500 10.9889 16.4500

Calculationsb3 through b0 intercepts 13.7195 1.9760 -0.0028 -127.5137b3 through b0 Standard Error 1.3330 0.7760 0.0005 173.64704R Square, Standard Error 0.9566 743.6676 Err:512 Err:512
205.5116 28 Err:512 Err:512340969314.21 15485162.01 Err:512 Err:512
Confidence level 95%2.0484
355.69980.00101.58952.7305
F, Residual dfRegression SS, Residual SS
t Critical ValueHalf Width b0Half Width b1Half Width b2Half Width b3

Subset-model buildX1 X2
Regression Statistics Note:Multiple R 0.8901 This worksheet does not recalculate.R Square 0.7922 If regression data changes, rerun procedureAdjusted R Square 0.7779 to create an updated version of this worksheet.Standard Error 1598.1450Observations 32
ANOVAdf SS MS F
Regression 2 282386519.8279 ### 55.2817Residual 29 74067956.3908 2554067.4618Total 31 356454476.2188
Coefficients Standard Error t Stat P-valueIntercept 781.8458 321.2510 2.4338 0.0213X Variable 1 0.0018 0.0002 7.5800 0.0000X Variable 2 -1.8165 1.4675 -1.2378 0.2257

This worksheet does not recalculate.If regression data changes, rerun procedureto create an updated version of this worksheet.
Significance F0.0000
Lower 95% Upper 95% Lower 95% Upper 95%124.8138 1438.8779 124.8138 1438.8779
0.0013 0.0023 0.0013 0.0023-4.8179 1.1850 -4.8179 1.1850

Calculations-1.8165 0.0018 781.84581.4675 0.0002 321.2510
R Square, Standard Error 0.7922 1598.1450 Err:51255.2817 29 Err:512
282386519.83 74067956.391 Err:512
Confidence level 95%2.0452
657.03210.00053.0014
b2, b1, b0 interceptsb2, b1, b0 Standard Error
F, Residual dfRegression SS, Residual SS
t Critical ValueHalf Width b0Half Width b1Half Width b2

Subset-model buildX Variable 1 (X1)
Regression Statistics Note:Multiple R 0.8839 This worksheet does not recalculate.R Square 0.7812 If regression data changes, rerun procedureAdjusted R Square 0.7739 to create an updated version of this worksheet.Standard Error 1612.2559Observations 32
ANOVAdf SS MS F
Regression 1 278473403.4319 ### 107.1312Residual 30 77981072.7869 ###Total 31 356454476.2188
Coefficients Standard Error t Stat P-valueIntercept 714.2526 319.3709 2.2364 0.0329X Variable 1 0.0016 0.0002 10.3504 0.0000

This worksheet does not recalculate.If regression data changes, rerun procedureto create an updated version of this worksheet.
Significance F0.0000
Lower 95% Upper 95% Lower 95% Upper 95%62.0103 1366.4950 62.0103 1366.49501
0.0013 0.0019 0.0013 0.00192

Calculationsb1, b0 Coefficients 0.0016 714.2526b1, b0 Standard Error 0.0002 319.3709R Square, Standard Error 0.7812 1612.2559
107.1312 30.0000### ###
Confidence level 95%2.0423
652.24240.0003
F, Residual dfRegression SS, Residual SS
t Critical ValueHalf Width b0Half Width b1

Y Var X Variable X Variable X Variable 312261 9700000 1361.24 2735.216244 5420000 317.13 2208.8
4716 1970000 1236.84 563.52486 1830000 143.6 694.24575 1240000 127.29 478.23167 810000 80.55 311.71622 610000 50.22 271.11446 560000 35.16 328.81212 490000 237.64 159.42312 470000 63.71 203.6
741 460000 30 222.22330 450000 201.03 274.71758 450000 118.4 187.7
961 430000 23.26 125.7988 410000 77.08 234.2
1813 410000 59.83 162.5579 360000 52.98 123.8
2252 360000 65.81 245.4802 350000 38.5 97.6335 320000 45.46 125.3492 310429.3 29.79 76.3
1407 300000 46.7 144.81125 278866.3 75.63 119.2
902 270000 23.36 109.4646 230000 65.93 117.6232 222990.6 17.1 58.1538 208864.6 83.66 87.1747 195212.2 40.12 82.1402 178217.2 29.28 86.8515 174912.1 184.88 69.3271 170376.4 8.26 89.3710 160000 16.81 89.1

Subset-model build
Regression StatisticsMultiple R 0.9780R Square 0.9566Adjusted R Square 0.9519Standard Error 743.6676Observations 32
ANOVAdf SS MS F
Regression 3 340969314.2090 ### 205.5116Residual 28 15485162.0098 553041.5003Total 31 356454476.2188
Coefficients Standard Error t Stat P-valueIntercept -127.5137 173.6470 -0.7343 0.4689X Variable 1 -0.0028 0.0005 -6.0669 0.0000X Variable 2 1.9760 0.7760 2.5465 0.0167X Variable 3 13.7195 1.3330 10.2922 0.0000

Significance F0.0000
Lower 95% Upper 95% Lower 95% Upper 95%-483.2136 228.1861 -483.2136 228.1861
-0.0038 -0.0019 -0.0038 -0.00190.3865 3.5655 0.3865 3.5655
10.9889 16.4500 10.9889 16.4500

Calculationsb3 through b0 intercepts 13.7195 1.9760 -0.0028 -127.5137b3 through b0 Standard Error 1.3330 0.7760 0.0005 173.64704R Square, Standard Error 0.9566 743.6676 #N/A #N/A
205.5116 28 #N/A #N/A340969314.21 15485162.01 #N/A #N/A
Confidence level 95%2.0484
355.69980.00101.58952.7305
F, Residual dfRegression SS, Residual SS
t Critical ValueHalf Width b0Half Width b1Half Width b2Half Width b3

Subset-model build
Intermediate Calculations0.95655780.0434422
n 32T 4n - T 28
Model Cp k+1 R Square Adj. R Square Std. ErrorX1 113.0040 2 0.7812 0.7739 1612.2559X2 371.2772 2 0.3805 0.3599 2713.0354X3 39.3435 2 0.8955 0.8920 1114.2075X1X2 107.9284 3 0.7922 0.7779 1598.1450X1X3 8.4847 3 0.9465 0.9428 810.9481X2X3 38.8068 3 0.8995 0.8925 1111.7068X1X2X3 4.0000 4 0.9566 0.9519 743.6676
R2T1 - R2T

Regression AnalysisX2 and all other X
Regression Statistics Note:Multiple R 0.6992 This worksheet does not recalculate.R Square 0.4889 If regression data changes, rerun procedureAdjusted R Square 0.4719 to create an updated version of this worksheet.Standard Error 422.9983Observations 32VIF 1.9567

This worksheet does not recalculate.If regression data changes, rerun procedureto create an updated version of this worksheet.

Calculations1.3199 134.36900.2464 84.0588
R Square, Standard Error 0.4889 422.998328.7023 30
5135639.7379 5367826.5043
Confidence level 95%2.0423
b2, b1, b0 interceptsb2, b1, b0 Standard Error
F, Residual dfRegression SS, Residual SS
t Critical Value

Regression AnalysisX1 and all other X
Regression Statistics Note:Multiple R 0.6992 This worksheet does not recalculate.R Square 0.4889 If regression data changes, rerun procedureAdjusted R Square 0.4719 to create an updated version of this worksheet.Standard Error 224.0856Observations 32VIF 1.9567

This worksheet does not recalculate.If regression data changes, rerun procedureto create an updated version of this worksheet.

Calculations0.3704 29.87410.0691 46.0666
R Square, Standard Error 0.4889 224.085628.7023 30
1441269.9684 1506431.0448
Confidence level 95%2.0423
b2, b1, b0 interceptsb2, b1, b0 Standard Error
F, Residual dfRegression SS, Residual SS
t Critical Value

Regression AnalysisCoefficients of Partial Determination
Intermediate CalculationsSSR(X1,X2) 320613611.08SST 356454476.22SSR(X2) 319210727.62 SSR(X1 | X2) 1402883.4647SSR(X1) 135637639.28 SSR(X2 | X1) 184975971.8
Coefficientsr2 Y1.2 0.037667623r2 Y2.1 0.837689618

Regression AnalysisAll but X2
Regression Statistics Note:Multiple R 0.6169 This worksheet does not recalculate.R Square 0.3805 If regression data changes, rerun procedureAdjusted R Square 0.3599 to create an updated version of this worksheet.Standard Error 2713.0354Observations 32
ANOVAdf SS MS F
Regression 1 135637639.2832 ### 18.4276Residual 30 220816836.9356 7360561.2312Total 31 356454476.2188
Coefficients Standard Error t Stat P-valueIntercept 1148.6379 539.1384 2.1305 0.0414X1 6.7834 1.5802 4.2927 0.0002

This worksheet does not recalculate.If regression data changes, rerun procedureto create an updated version of this worksheet.
Significance F0.0002
Lower 95% Upper 95% Lower 95% Upper 95%47.5704 2249.7054 47.5704 2249.7054
3.5562 10.0106 3.5562 10.0106

Calculations6.7834 1148.63791.5802 539.1384
R Square, Standard Error 0.3805 2713.035418.4276 30
135637639.28 220816836.94
Confidence level 95%2.0423
1101.06753.2272
Err:512
b2, b1, b0 interceptsb2, b1, b0 Standard Error
F, Residual dfRegression SS, Residual SS
t Critical ValueHalf Width b0Half Width b1Half Width b2

Regression AnalysisAll but X1
Regression Statistics Note:Multiple R 0.9463 This worksheet does not recalculate.R Square 0.8955 If regression data changes, rerun procedureAdjusted R Square 0.8920 to create an updated version of this worksheet.Standard Error 1114.2075Observations 32
ANOVAdf SS MS F
Regression 1 319210727.6174 ### 257.1256Residual 30 37243748.6014 1241458.2867Total 31 356454476.2188
Coefficients Standard Error t Stat P-valueIntercept 331.0258 229.0539 1.4452 0.1588X2 5.5128 0.3438 16.0351 0.0000

This worksheet does not recalculate.If regression data changes, rerun procedureto create an updated version of this worksheet.
Significance F0.0000
Lower 95% Upper 95% Lower 95% Upper 95%-136.7647 798.8164 -136.7647 798.8164
4.8107 6.2149 4.8107 6.2149

Calculations5.5128 331.02580.3438 229.0539
R Square, Standard Error 0.8955 1114.2075257.1256 30
319210727.62 37243748.601
Confidence level 95%2.0423
467.79060.7021
Err:512
b2, b1, b0 interceptsb2, b1, b0 Standard Error
F, Residual dfRegression SS, Residual SS
t Critical ValueHalf Width b0Half Width b1Half Width b2

Y Var X Variable X Variable 212261 1361.24 2735.216244 317.13 2208.8
4716 1236.84 563.52486 143.6 694.24575 127.29 478.23167 80.55 311.71622 50.22 271.11446 35.16 328.81212 237.64 159.42312 63.71 203.6
741 30 222.22330 201.03 274.71758 118.4 187.7
961 23.26 125.7988 77.08 234.2
1813 59.83 162.5579 52.98 123.8
2252 65.81 245.4802 38.5 97.6335 45.46 125.3492 29.79 76.3
1407 46.7 144.81125 75.63 119.2
902 23.36 109.4646 65.93 117.6232 17.1 58.1538 83.66 87.1747 40.12 82.1402 29.28 86.8515 184.88 69.3271 8.26 89.3710 16.81 89.1

Regression Analysis
Regression StatisticsMultiple R 0.9484R Square 0.8995Adjusted R Square 0.8925Standard Error 1111.7068Observations 32
ANOVAdf SS MS F
Regression 2 320613611.0821 160306805.5410 129.7094Residual 29 35840865.1367 1235891.9013Total 31 356454476.2188
Coefficients Standard Error t Stat P-valueIntercept 359.8549 230.1361 1.5637 0.1287X Variable 1 -0.9650 0.9058 -1.0654 0.2955X Variable 2 5.8703 0.4798 12.2340 0.0000

Significance F0.0000
Lower 95% Upper 95% Lower 95% Upper 95%-110.8264 830.5362 -110.8264 830.5362
-2.8175 0.8875 -2.8175 0.88754.8889 6.8516 4.8889 6.8516

Calculations5.8703 -0.9650 359.85490.4798 0.9058 230.1361
R Square, Standard Error 0.8995 1111.7068 #N/A129.7094 29 #N/A
320613611.08 35840865.137 #N/A
Confidence level 95%2.0452
470.68131.85250.9814
b2, b1, b0 interceptsb2, b1, b0 Standard Error
F, Residual dfRegression SS, Residual SS
t Critical ValueHalf Width b0Half Width b1Half Width b2

Regression AnalysisX3 and all other X
Regression Statistics Note:Multiple R 0.9851 This worksheet does not recalculate.R Square 0.9704 If regression data changes, rerun procedureAdjusted R Square 0.9683 to create an updated version of this worksheet.Standard Error 103.5975Observations 32VIF 33.7471

This worksheet does not recalculate.If regression data changes, rerun procedureto create an updated version of this worksheet.

Calculations-0.2764 0.0003 66.28250.0951 0.0000 20.8246
R Square, Standard Error 0.9704 103.5975 Err:512474.8328 29 Err:512
10192225.602 311240.64049 Err:512
Confidence level 95%2.0452
b2, b1, b0 interceptsb2, b1, b0 Standard Error
F, Residual dfRegression SS, Residual SS
t Critical Value

Regression AnalysisX2 and all other X
Regression Statistics Note:Multiple R 0.8297 This worksheet does not recalculate.R Square 0.6884 If regression data changes, rerun procedureAdjusted R Square 0.6669 to create an updated version of this worksheet.Standard Error 177.9666Observations 32VIF 3.2093

This worksheet does not recalculate.If regression data changes, rerun procedureto create an updated version of this worksheet.

Calculations0.0004 -0.8158 82.89070.0001 0.2807 38.5995
R Square, Standard Error 0.6884 177.9666 Err:51232.0346 29 Err:512
2029209.8321 918491.18116 Err:512
Confidence level 95%2.0452
b2, b1, b0 interceptsb2, b1, b0 Standard Error
F, Residual dfRegression SS, Residual SS
t Critical Value

Regression AnalysisX1 and all other X
Regression Statistics Note:Multiple R 0.9883 This worksheet does not recalculate.R Square 0.9767 If regression data changes, rerun procedureAdjusted R Square 0.9751 to create an updated version of this worksheet.Standard Error 295489.7666Observations 32VIF 42.8677

This worksheet does not recalculate.If regression data changes, rerun procedureto create an updated version of this worksheet.

Calculations2768.3612 1037.2794 ###
127.5391 240.7508 ###R Square, Standard Error 0.9767 295489.7666 Err:512
607.0814 29 Err:5126014E+014 3211E+012 Err:512
Confidence level 95%2.0452
b2, b1, b0 interceptsb2, b1, b0 Standard Error
F, Residual dfRegression SS, Residual SS
t Critical Value

Regression AnalysisCoefficients of Partial Determination
Intermediate CalculationsSSR(X1,X2,X3) 340969314.21SST 356454476.22SSR(X2,X3) 320613611.08 SSR(X1 | X2,X3) 20355703.127SSR(X1,X3) 337383009 SSR(X2 | X1,X3) 3586305.1873SSR(X1,X2) 282386519.83 SSR(X3 | X1,X2) 58582794.381
Coefficientsr2 Y1.23 0.567946757r2 Y2.13 0.188045584r2 Y3.12 0.790933046

Regression AnalysisAll but X3
Regression Statistics Note:Multiple R 0.8901 This worksheet does not recalculate.R Square 0.7922 If regression data changes, rerun procedureAdjusted R Square 0.7779 to create an updated version of this worksheet.Standard Error 1598.1450Observations 32
ANOVAdf SS MS F
Regression 2 282386519.8279 ### 55.2817Residual 29 74067956.3908 2554067.4618Total 31 356454476.2188
Coefficients Standard Error t Stat P-valueIntercept 781.8458 321.2510 2.4338 0.0213X1 0.0018 0.0002 7.5800 0.0000X2 -1.8165 1.4675 -1.2378 0.2257

This worksheet does not recalculate.If regression data changes, rerun procedureto create an updated version of this worksheet.
Significance F0.0000
Lower 95% Upper 95% Lower 95% Upper 95%124.8138 1438.8779 124.8138 1438.8779
0.0013 0.0023 0.0013 0.0023-4.8179 1.1850 -4.8179 1.1850

Calculations-1.8165 0.0018 781.84581.4675 0.0002 321.2510
R Square, Standard Error 0.7922 1598.1450 Err:51255.2817 29 Err:512
282386519.83 74067956.391 Err:512
Confidence level 95%2.0452
657.03210.00053.0014
b2, b1, b0 interceptsb2, b1, b0 Standard Error
F, Residual dfRegression SS, Residual SS
t Critical ValueHalf Width b0Half Width b1Half Width b2

Regression AnalysisAll but X2
Regression Statistics Note:Multiple R 0.9729 This worksheet does not recalculate.R Square 0.9465 If regression data changes, rerun procedureAdjusted R Square 0.9428 to create an updated version of this worksheet.Standard Error 810.9481Observations 32
ANOVAdf SS MS F
Regression 2 337383009.0217 ### 256.5117Residual 29 19071467.1970 657636.7999Total 31 356454476.2188
Coefficients Standard Error t Stat P-valueIntercept 36.2780 175.8880 0.2063 0.8380X3 12.1075 1.2792 9.4646 0.0000X1 -0.0021 0.0004 -5.2567 0.0000

This worksheet does not recalculate.If regression data changes, rerun procedureto create an updated version of this worksheet.
Significance F0.0000
Lower 95% Upper 95% Lower 95% Upper 95%-323.4533 396.0094 -323.4533 396.0094
9.4911 14.7239 9.4911 14.7239-0.0029 -0.0013 -0.0029 -0.0013

Calculations-0.0021 12.1075 36.27800.0004 1.2792 175.8880
R Square, Standard Error 0.9465 810.9481 Err:512256.5117 29 Err:512
337383009 19071467.197 Err:512
Confidence level 95%2.0452
359.73132.61640.0008
b2, b1, b0 interceptsb2, b1, b0 Standard Error
F, Residual dfRegression SS, Residual SS
t Critical ValueHalf Width b0Half Width b1Half Width b2

Regression AnalysisAll but X1
Regression Statistics Note:Multiple R 0.9484 This worksheet does not recalculate.R Square 0.8995 If regression data changes, rerun procedureAdjusted R Square 0.8925 to create an updated version of this worksheet.Standard Error 1111.7068Observations 32
ANOVAdf SS MS F
Regression 2 320613611.0821 ### 129.7094Residual 29 35840865.1367 1235891.9013Total 31 356454476.2188
Coefficients Standard Error t Stat P-valueIntercept 359.8549 230.1361 1.5637 0.1287X2 -0.9650 0.9058 -1.0654 0.2955X3 5.8703 0.4798 12.2340 0.0000

This worksheet does not recalculate.If regression data changes, rerun procedureto create an updated version of this worksheet.
Significance F0.0000
Lower 95% Upper 95% Lower 95% Upper 95%-110.8264 830.5362 -110.8264 830.5362
-2.8175 0.8875 -2.8175 0.88754.8889 6.8516 4.8889 6.8516

Calculations5.8703 -0.9650 359.85490.4798 0.9058 230.1361
R Square, Standard Error 0.8995 1111.7068 Err:512129.7094 29 Err:512
320613611.08 35840865.137 Err:512
Confidence level 95%2.0452
470.68131.85250.9814
b2, b1, b0 interceptsb2, b1, b0 Standard Error
F, Residual dfRegression SS, Residual SS
t Critical ValueHalf Width b0Half Width b1Half Width b2

Y Var X Variable 1 X Variable 2 X Variable 312261 9700000 1361.24 2735.216244 5420000 317.13 2208.8
4716 1970000 1236.84 563.52486 1830000 143.6 694.24575 1240000 127.29 478.23167 810000 80.55 311.71622 610000 50.22 271.11446 560000 35.16 328.81212 490000 237.64 159.42312 470000 63.71 203.6
741 460000 30 222.22330 450000 201.03 274.71758 450000 118.4 187.7
961 430000 23.26 125.7988 410000 77.08 234.2
1813 410000 59.83 162.5579 360000 52.98 123.8
2252 360000 65.81 245.4802 350000 38.5 97.6335 320000 45.46 125.3492 310429.33 29.79 76.3
1407 300000 46.7 144.81125 278866.33 75.63 119.2
902 270000 23.36 109.4646 230000 65.93 117.6232 222990.58 17.1 58.1538 208864.56 83.66 87.1747 195212.22 40.12 82.1402 178217.22 29.28 86.8515 174912.11 184.88 69.3271 170376.43 8.26 89.3710 160000 16.81 89.1

Observation X Variable 1 X Variable 2 X Variable 3 Predicted Y Var Y Var1 9700000 1361.24 2735.2 12585.17340102 122612 5420000 317.13 2208.8 15435.2506946 162443 1970000 1236.84 563.5 4461.816660044 47164 1830000 143.6 694.2 4491.655736576 24865 1240000 127.29 478.2 3168.861723264 45756 810000 80.55 311.7 2011.400507392 31677 610000 50.22 271.1 1961.522010307 16228 560000 35.16 328.8 2865.141964184 14469 490000 237.64 159.4 1139.638030858 1212
10 470000 63.71 203.6 1459.059288855 231211 460000 30 222.2 1675.983504701 74112 450000 201.03 274.7 2762.562761598 233013 450000 118.4 187.7 1405.69351431 175814 430000 23.26 125.7 423.7972921232 96115 410000 77.08 234.2 2075.412728798 98816 410000 59.83 162.5 1057.641796521 181317 360000 52.98 123.8 654.9291203717 57918 360000 65.81 245.4 2348.567004049 225219 350000 38.5 97.6 295.2201156672 80220 320000 45.46 125.3 774.0614891799 33521 310429.33 29.79 76.3 97.9801651717 49222 300000 46.7 144.8 1100.747455319 140723 278866.33 75.63 119.2 866.615606529 112524 270000 23.36 109.4 654.0184665669 90225 230000 65.93 117.6 964.0488452678 64626 222990.58 17.1 58.1 71.1272403853 23227 208864.56 83.66 87.1 640.5655219793 53828 195212.22 40.12 82.1 524.6420737182 74729 178217.22 29.28 86.8 615.8899282213 40230 174912.11 184.88 69.3 692.6355064071 51531 170376.43 8.26 89.3 630.8842506365 27132 160000 16.81 89.1 674.4555953773 710

Residual-324.1734808.7493254.1833
-2005.6561406.1381155.599-339.522
-1419.14272.36197852.9407
-934.9835-432.5628352.3065537.2027
-1087.413755.3582
-75.92912-96.567
506.7799-439.0615394.0198306.2525258.3844247.9815
-318.0488160.8728
-102.5655222.3579
-213.8899-177.6355-359.8843
35.5444

Regression Analysis
Regression StatisticsMultiple R 0.9780R Square 0.9566Adjusted R Square 0.9519Standard Error 743.6676Observations 32
ANOVAdf SS MS F
Regression 3 340969314.2090 113656438.0697 205.5116Residual 28 15485162.0098 553041.5003Total 31 356454476.2188
Coefficients Standard Error t Stat P-valueIntercept -127.5137 173.6470 -0.7343 0.4689X Variable 1 -0.0028 0.0005 -6.0669 0.0000X Variable 2 1.9760 0.7760 2.5465 0.0167X Variable 3 13.7195 1.3330 10.2922 0.0000

Significance F0.0000
Lower 95% Upper 95% Lower 95% Upper 95%-483.2136 228.1861 -483.2136 228.1861
-0.0038 -0.0019 -0.0038 -0.00190.3865 3.5655 0.3865 3.5655
10.9889 16.4500 10.9889 16.4500

Calculationsb3 through b0 intercepts 13.7195 1.9760 -0.0028 -127.5137b3 through b0 Standard Error 1.3330 0.7760 0.0005 173.64704R Square, Standard Error 0.9566 743.6676 #N/A #N/A
205.5116 28 #N/A #N/A340969314.21 15485162.01 #N/A #N/A
Confidence level 95%2.0484
355.69980.00101.58952.7305
F, Residual dfRegression SS, Residual SS
t Critical ValueHalf Width b0Half Width b1Half Width b2Half Width b3

CO2 emissions Pop. Energy used(thou ton) (mil) (mil ton oil)
China 9700000 1361.24 2735.2USA 5420000 317.13 2208.8India 1970000 1236.84 563.5Russian 1830000 143.6 694.2Japan 1240000 127.29 478.2Germany 810000 80.55 311.7South Korea 610000 50.22 271.1Canada 560000 35.16 328.8Indonesia 490000 237.64 159.4United Kingdom 470000 63.71 203.6Saudi Arabia 460000 30 222.2Brazil 450000 201.03 274.7Mexico 450000 118.4 187.7Australia 430000 23.26 125.7Iran 410000 77.08 234.2Italy 410000 59.83 162.5South Africa 360000 52.98 123.8France 360000 65.81 245.4Poland 350000 38.5 97.6Ukraine 320000 45.46 125.3Malaysia 310429.3 29.79 76.3Spain 300000 46.7 144.8Turkey 278866.3 75.63 119.2Taiwan 270000 23.36 109.4Thailand 230000 65.93 117.6Kazakhstan 222990.6 17.1 58.1Egypt 208864.6 83.66 87.1Argentina 195212.2 40.12 82.1Venezuela 178217.2 29.28 86.8Pakistan 174912.1 184.88 69.3UAE 170376.4 8.26 89.3Netherlands 160000 16.81 89.1

GDP(PPP)($ Billion)
1226116244
47162486457531671622144612122312
74123301758
961988
1813579
2252802335492
14071125
902646232538747402515271710