Serving Britain’s shoppers a little better every day. 4 ... · Dividend Targeting cover of around...
53
Serving Britain’s shoppers a little better every day. 11 April 2018 Dave Lewis – CEO Alan Stewart – CFO
Transcript of Serving Britain’s shoppers a little better every day. 4 ... · Dividend Targeting cover of around...

Serving Britain’s shoppers a little better every day.11 April 2018
Dave Lewis – CEOAlan Stewart – CFO
2
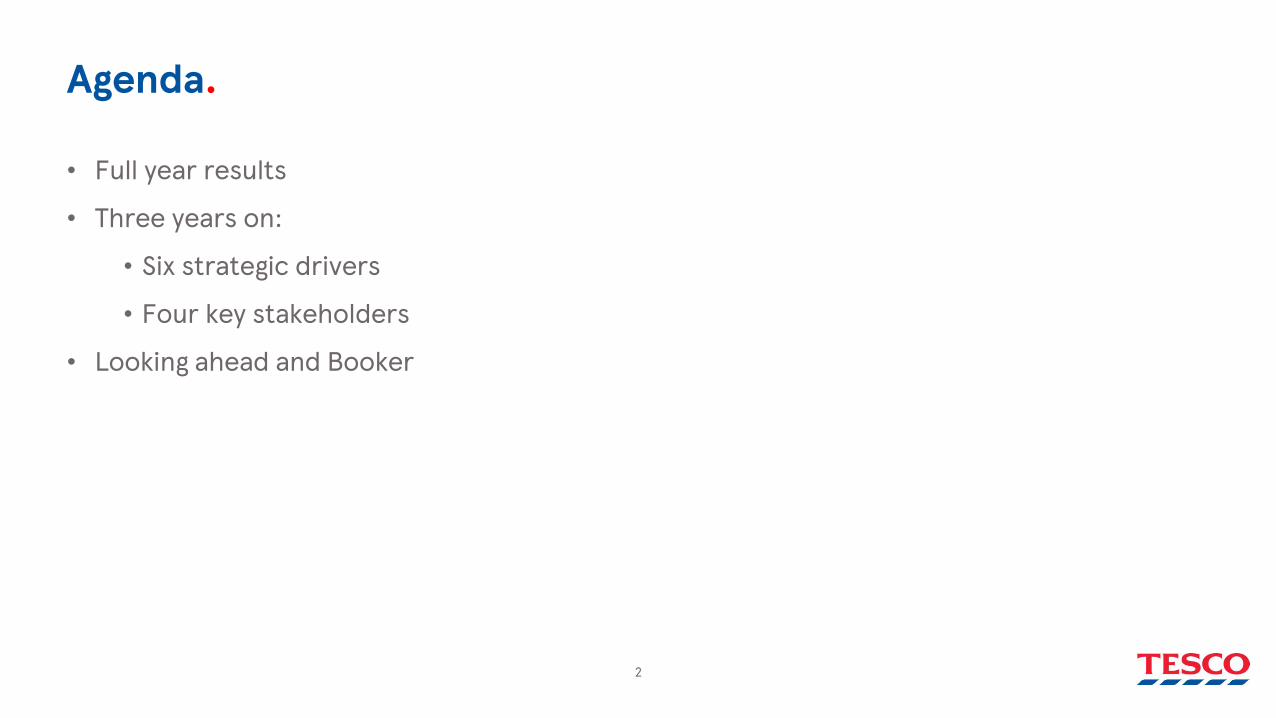
Agenda.
• Full year results
• Three years on:
• Six strategic drivers
• Four key stakeholders
• Looking ahead and Booker

FY results.

4
Positive sales growth1 Strong profit growth2 Strong retail cash generation3
A year of progress
£49.9bn£51.0bn
FY 16/17 FY 17/18
+2.3%
£2,773m
FY 16/17 FY 17/18
+21.7%
1. Group sales growth at actual rates on a comparable days and a continuing operations basis.2. Group operating profit before exceptional items on a continuing operations basis.3. Retail cash generated from operations on a continuing operations basis.
FY 16/17 FY 17/18
+28.4%
£1,280m£1,644m £2,279m

5
Emphasis on fresh food volumes
More customers shopping with us1
Improved profitability
UK performance
1.9%
2.3%
1.9%
2.5%
16/17 17/18FY 2H
+50 bps YoY
1. Kantar data for the 52 weeks to 25 February 2018.
+260,000

6
£803m
UK & ROIFY 16/17
Price Volume and mix
Costreduction
programme
Cost inflation/other
UK & ROIFY 17/18
1. Before exceptional items.2. Data is for the 52-weeks ending 25 February and is sourced from IRI Retail AdvantageTM, global insight providers to the retail industry. IRI market definition excludes Aldi and Lidl.
UK & ROI
• Strong sales:
– >2% LFL in every quarter; 2.4% in 4Q
– UK fresh food volume up 0.7%, outperforming the market by 1.7%2
– Own Brand increased to 51% of sales• Improved profitability:
– £404m saved through cost savings plan
– 2H operating margin strengthened to 2.5%• £1.9bn cash generated from operations
Operating profit and margin1
1.8% 2.3%
£1,053m

7
Central EuropeFY 16/17
Price Volume andmix
Costreduction
programme
Costinflation/other
Central EuropeFY 17/18
Central Europe
£119m
£58m
1. Before exceptional items.
0.9%
1.8%
• Focused sales growth:
– Food like-for-like sales growth +1.2%
– Small store like-for-like sales growth +3.2% • Profit more than doubled to £119m
– £70m saved through cost savings plan• £389m cash generated from operations
Operating profit and margin1

8
AsiaFY 16/17
Price Volume andmix
Costreduction
programme
Cost inflation/other
Asia1H 17/18
Asia
£262m
£299m
Operating profit and margin1
5.0% 6.0%
1. Before exceptional items.
• Strategic actions to focus on sustainable, profitable sales growth
– Bulk sales impact of c.(6)%
– 44% reduction in short-term couponing• Further improvement in profitability
despite full year deflation of c.(1)%
– Operating margin up 99b.p.
– £120m saved through cost savings plan• £490m cash generated from operations
FY

9
Tesco Bank
• 4.1% growth in active customer accounts• Operating profit before exceptional items up 10%• 16% growth in lending balances, driven by secured lending
– Mortgage lending growth of 39%
– Proportion of secured lending increased to 26%• Balance sheet remains strong with a Risk Asset Ratio of 19.3%• IFRS 9 Financial instruments applied from 25 February 2018
– £166m impact on opening retained earnings for FY 18/19

10
Tesco Bank
1. FY 17/18 adjusted for £(23.8)m customer redress and FY 16/17 adjusted for £(45)m customer redress and £(21.8)m in restructuring; Statutory cost: income ratio FY 17/18 61.6% and FY 16/17 71.4%.
FY 17/18 Change
Lending to customers £11,522m 15.7%
Secured lending £3,001m 39.2%
Unsecured lending £8,522m 9.2%
Bad debt: asset ratio 1.3% (0.2)%
Operating profit pre exceptional items £173m 10.2%
Cost: income ratio1 59.7% 2.6% improvement
Net interest margin 3.9% (0.1)%
Tier 1 capital ratio 16.1% (0.6)%
Total capital ratio 19.3% (0.7)%

11
Sources and uses of cash
£2,466m
£2,965m£499m£2,773m
£(1,190)m
£(428)m £(140)m
£362m £1,377m
Retail cashgenerated
fromoperations
excl. workingcapital
Underlyingworkingcapital
Retail cashgenerated
fromoperations
beforeexceptional
items
Exceptionalcash items
Retailoperating cash
flow
Cash capex Netinterest
& tax
Net propertytransactions
Disposals anddividendsreceived
Retail freecash flow
£(192)m
1. Exceptional cash items includes £(120)m of restructuring payments, £(92)m utilisation of onerous leases, £(149)m for payments in relation to the Deferred Prosecution Agreement with the SFO and shareholder compensation payments, offset by a £160m VAT refund and £9m of other items.
1

12
£701m
£227m
£171m
Maintenance/refresh IT/productivityNew space/business
Capital expenditure
£677m£133m
£239m
£50m
UK & ROI Central Europe Asia Bank
£1.1bnby region
£1.1bnby type
FY 18/19 onwards capex guidance: between £1.1bn and £1.4bn

13
FY 16/17deficit
Gains onassets
Principalfinancial
assumptions
Mortalityassumptions
Schemeexperience
FY 17/18deficit
Deferred taxasset
FY 17/18post-taxdeficit
Pension
• Triennial pension review concluded
– Small increase in annual contributions to £285m p.a. from April 2018
– Actuarial deficit as at March 2017: £3.0bn• IAS 19 pension deficit reduced to £2.7bn• Discount rate more appropriately reflects
corporate bond yields over life of liabilities
Movement in IAS 19 deficit
£2.7bn
£6.6bn
£3.2bn
14
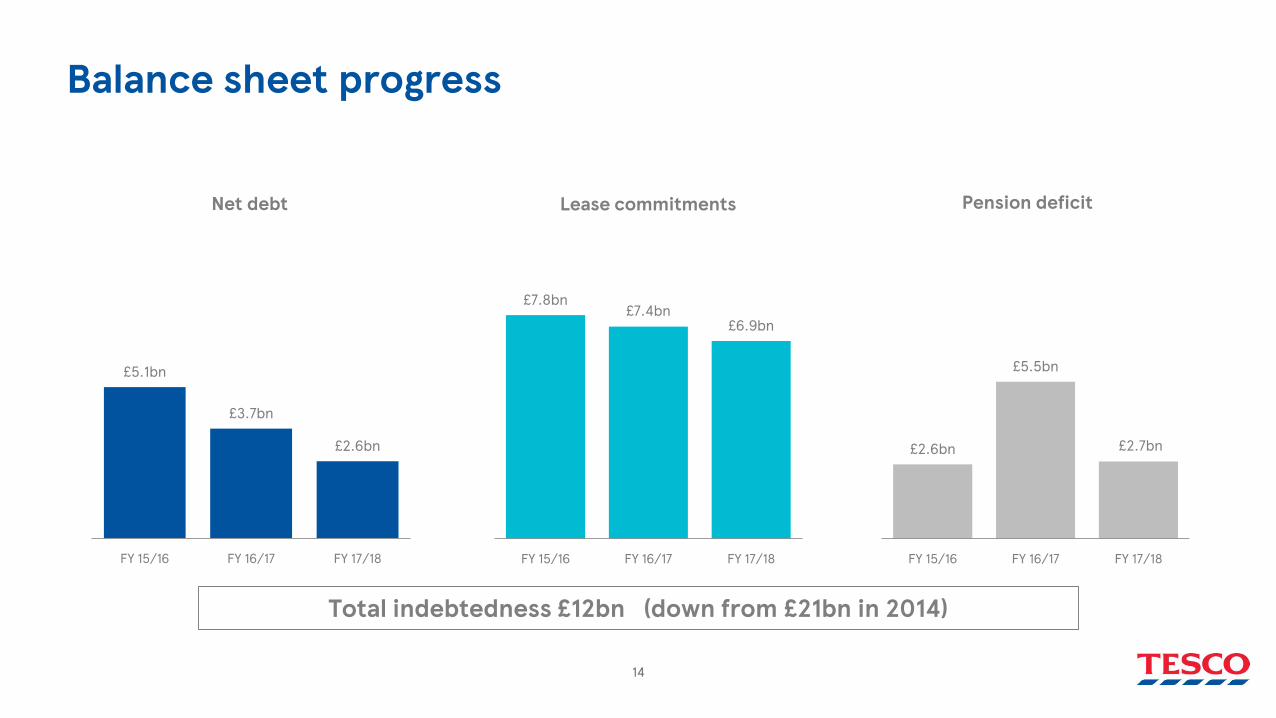
Balance sheet progress
£5.1bn
£3.7bn
£2.6bn
FY 15/16 FY 16/17 FY 17/18
Net debt
£7.8bn£7.4bn
£6.9bn
FY 15/16 FY 16/17 FY 17/18
Lease commitments
£2.6bn
£5.5bn
£2.7bn
FY 15/16 FY 16/17 FY 17/18
Pension deficit
Total indebtedness £12bn (down from £21bn in 2014)

15
-
0.50
1.00
1.50
Remaining Debt Maturities Paid off within FY 17/18
5.5%1.38%
6.15%5.13%5.0%
6.0% 5.13% 4.88%5.2%
Debt reduction• Repayment of £2.7bn of outstanding debt during FY 17/18:
– £1.4bn maturities
– Tender offers in July (£500m) and October (£800m)
– c.£50m annualised interest savings

16
Improving debt metrics
6.0x
5.1x 5.0x
3.3x
2.0x
2.5x
3.0x
3.5x
4.0x
4.5x
5.0x
5.5x
6.0x
6.5x
7.0x
FY 14/15 FY 15/16 FY 16/17 FY 17/18
Total indebtedness ratio1
1.9x 1.9x
2.2x
2.7x
0.0x
1.0x
2.0x
3.0x
4.0x
FY 14/15 FY 15/16 FY 16/17 FY 17/18
Fixed charge cover2
THRESHOLD > 3.0x
THRESHOLD < 3.0x
1. Net Debt + defined pension deficit (net of tax) + discounted operating lease commitments / EBITDAR2. EBITDAR / (Net finance costs (before exceptional charges, IAS 19 net pension finance costs and IAS 30 fair value remeasurements) + Retail operating lease expense)
17
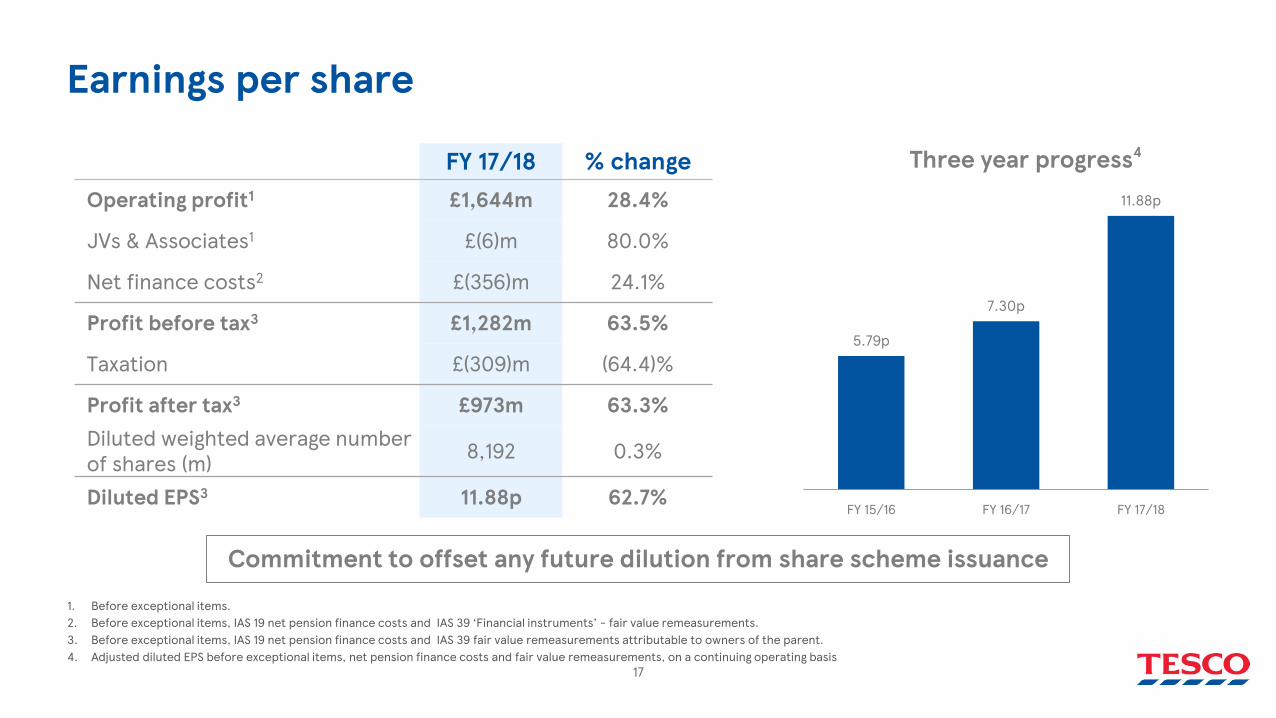
Earnings per share
FY 17/18 % changeOperating profit1 £1,644m 28.4%
JVs & Associates1 £(6)m 80.0%
Net finance costs2 £(356)m 24.1%
Profit before tax3 £1,282m 63.5%
Taxation £(309)m (64.4)%
Profit after tax3 £973m 63.3%Diluted weighted average number of shares (m) 8,192 0.3%
Diluted EPS3 11.88p 62.7%
1. Before exceptional items.2. Before exceptional items, IAS 19 net pension finance costs and IAS 39 ‘Financial instruments’ - fair value remeasurements.3. Before exceptional items, IAS 19 net pension finance costs and IAS 39 fair value remeasurements attributable to owners of the parent.4. Adjusted diluted EPS before exceptional items, net pension finance costs and fair value remeasurements, on a continuing operating basis
5.79p
7.30p
11.88p
FY 15/16 FY 16/17 FY 17/18
Three year progress4
Commitment to offset any future dilution from share scheme issuance

18
Final dividend
• 2p final dividend• Ex-dividend date 17 May 2018; Payment date 22 June 2018• Total cash cost of c.£164m (payable in FY18/19)• Targeting cover of around two times earnings in medium term

19
GuidanceOperating margin 3.5% to 4.0% Group operating margin by 19/20
Operating costs Reduce operating costs by a further £1.5bn by 19/20
Retail cash generation Generate £9bn of cash from operations by 18/19
Working capital Underlying decrease of around £0.2bn per annum
Pension deficit contribution £285m per annum from April 2018 (previously £270m)
Capex £1.1bn - £1.4bn per annum
Net finance costs1 c.4% of long-term debt per annum
Effective tax rate Decreasing to c.20% over medium term
Dividend Targeting cover of around 2 times EPS in medium termBroadly one-third : two-thirds split between interim and final
Debt metrics Total indebtedness less than 3.0x EBITDARFixed charge cover greater than 3.0x
Booker Consolidated from 5 March 20181. Before exceptional charges, IAS 19 net pension finance costs and IAS 39 fair value remeasurements.

20
Financial summary.
• Continued strong growth in sales (+2.3%), profit (+28.4%), cash (+21.7%) and earnings (+62.7%)
• Increased profitability 3.0% Group operating margin in second half
• £594m cost savings in year; £820m savings to date
• £2.7bn debt repaid in year
• Total indebtedness down £4.4bn to £12.3bn
• Dividend reinstated: interim 1.0p + final 2.0p

Three years on.
21

Six strategic drivers.
22

23
0.0
5.0
10.0
15.0
20.0
25.0
30.0
2014-01-01 2015-01-01 2016-01-01 2017-01-01 2018-01-01
Tesco Other UK supermarkets
A differentiated brand
Jan 2014 – Feb 2018
Jan 2014 Feb 2018
1. Reflects % of Fans minus Critics answering the question “Based on your visit, how likely is it that you would recommend the following to a friend or colleague?” for large stores.2. Reflects YouGov Brand perception measures of quality and value.
BrandIndex Score
NPS1
14/15 17/18
38.7 53.7
12.5 24.7
6.5 18.8
+15.0
+12.2
+12.3
Change
Quality perception2
Value perception2

24
£226m
£485m
£820m
0.0
0.5
1.0
1.5
1H16/17
FY16/17
1H17/18
FY17/18
1H18/19
FY18/19
1H19/20
FY19/20
Reduce operating costs by £1.5bn
Cumulative cost savings
£174m of
£500m
Store operatingmodel
Logistics and distribution
Goods not for resale
£541m of
£550m£541m £104m £174m
Cost savings towards £1.5bn target

25
Sources of cash – three years to Feb 2018
Generate £9bn cash from operations
£2.5bn
£5.6bn
£9.0bn
FY 16/17 FY 17/18 FY 18/19
1. Cumulative retail cash generated from operations excluding pension deficit repayments.
Feb 2016 – Feb 2018
Cumulative retail cash generated from operations1
£6.2bn81%
£1.4bn19%
Improved profitability Working capital inflow

26
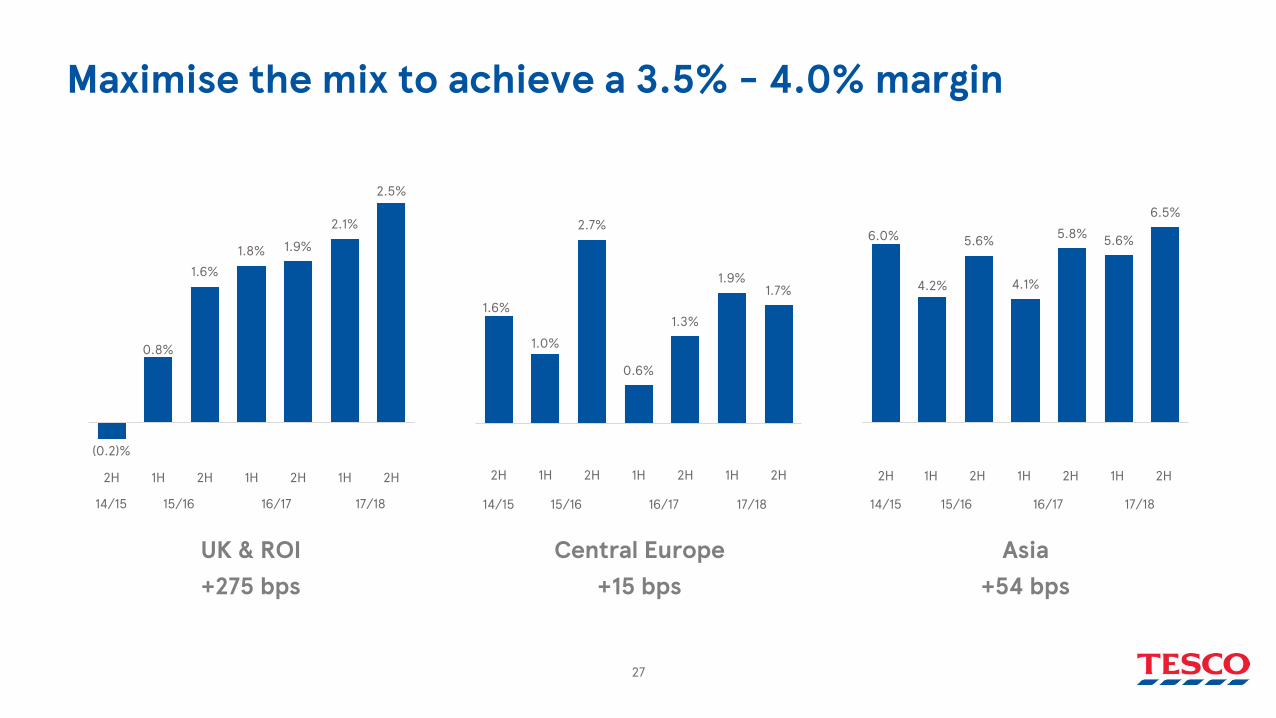
Maximise the mix to achieve a 3.5% - 4.0% margin
Fresh Packaged GM Clothing Total
Large stores
Small stores
Online
Total X%
Matrix as shared in October 2016. Colour of boxes illustrates indicative margin percentage relative to total (blue – above average, green – at average, red - below average).
FY 17/18: 2.9%
FY 16/17: 2.3%
FY 15/16: 1.8%
FY 14/15: 1.8%
27
6.0%
4.2%
5.6%
4.1%
5.8% 5.6%
6.5%
2H 1H 2H 1H 2H 1H 2H
14/15 15/16 16/17 17/18
Maximise the mix to achieve a 3.5% - 4.0% margin
(0.2)%
0.8%
1.6%1.8% 1.9%
2.1%
2.5%
2H 1H 2H 1H 2H 1H 2H
14/15 15/16 16/17 17/18
UK & ROI Central Europe
1.6%
1.0%
2.7%
0.6%
1.3%
1.9%1.7%
2H 1H 2H 1H 2H 1H 2H
14/15 15/16 16/17 17/18
Asia+275 bps +15 bps +54 bps
28
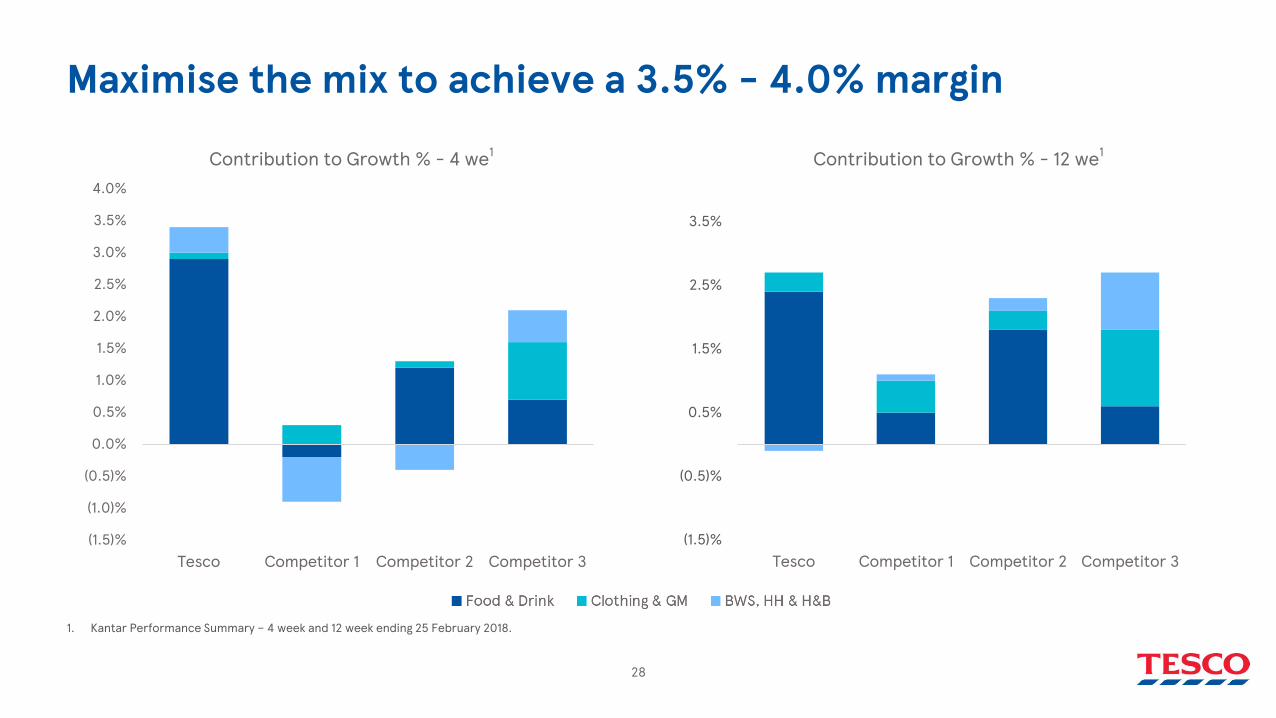
Maximise the mix to achieve a 3.5% - 4.0% margin
(1.5)%
(0.5)%
0.5%
1.5%
2.5%
3.5%
Tesco Competitor 1 Competitor 2 Competitor 3(1.5)%
(1.0)%
(0.5)%
0.0%
0.5%
1.0%
1.5%
2.0%
2.5%
3.0%
3.5%
4.0%
Tesco Competitor 1 Competitor 2 Competitor 3
Contribution to Growth % - 4 we1 Contribution to Growth % - 12 we1
1. Kantar Performance Summary – 4 week and 12 week ending 25 February 2018.

29
Feb 2015 – Feb 2018
Maximise value from property
Three year progress
• Freehold proportion2: 41% to 52%
• Proceeds released: £1.4bn
• Space repurposed: 2.6m sq.ft£568m
£1,113m
£1,404m
FY 15/16 FY 16/17 FY 17/18
Cumulative value from property proceeds1
1. Proceeds from sale of property, plant and equipment, investment property, intangible assets and non-current assets classified as held for sale and development stock.2. Represents freehold proportion for the UK & ROI.

30
Innovation
Ideas Feasibility Capability Pre-launchprep
Launch Execution

31
Innovation
Own Brand Clubcard Pay+

Our four key stakeholders.
32

33
Three years on: Customers
Net promoter score1 Food market share2 Loyalty3 Brand perception4
38.7 53.7
1. Reflects % of Fans minus Critics answering the question “Based on your visit, how likely is it that you would recommend the following to a friend or colleague?” for large stores.2. Year on year growth in Food & Drink market share per Kantar 4 week data for August 2014 and February 2018.3. Reflects % increased in customers who are now (>50%) loyal to Tesco per Kantar.4. Based on YouGov Brand Index which is a score based upon 6 component questions covering quality, value, reputation and satisfaction.
6.8 22.72.4%(1.5)%
+0.4%
Aug 14 Feb 18

34
Three years on: Colleagues
70% 83%
Great place to work1
23 46
Great place to shop2
Investment in colleagues4
Transformation3
Customer-facing colleagues
18,443
Management roles5,900
+10.5%
+3.1%
0%
1. Reflects % of colleagues recommending Tesco as a great place to work as part of our ‘What Matters To You?’ survey undertaken every January and August for the Group.2. Reflects the net promoter score on recommending Tesco as a great place to shop as part of our ‘What Matters To You?’ survey undertaken every January and August for the UK.3. Increase in customer facing hourly paid colleagues from September 2014 to February 2018; reduction in manager roles within store and office structures.4. Based on pay investment from 2015 to 2018 for our circa 250,000 customer facing hourly store colleagues.

35
Three years on: Suppliers
Supplier Viewpoint1
0 10,500users
Supplier Network Supplier Advantage survey2
Growing volumes3
51% 78%
1. Reflects % of UK suppliers responding positively when asked ‘Overall how satisfied are you with your experience of working with Tesco?’ as part of the annual Supplier Viewpoint survey.2. Third party organisation, Advantage, run an annual report to capture feedback on supplier and retailer performance. 3. Represents like-for-like UK food volumes.
17/18: 1st
16/17: 1st
15/16: 4th
14/15: 4th
Food LFL Volume
Q1 10/11
Q4 17/18
(7.0)%
4.0%

36
Three years on: Shareholders
£1.4bnfree cash flowNegative free
cash flow£(8.5)bnNet debt
Loss-making in UK
Losing shareto all
Gaining share in Food
£1.4bnfree cash flow
£(2.6)bnnet debt
FY 15/16 FY 16/17 FY 17/18
3.0% Group operating margin
2H14/15
2H15/16
2H16/17
2H17/18

37
11.88pEPS
£12bntotal
indebtedness
Three years on: Shareholders
DividendReinstated:3.0p/share
Capital discipline
£1.1bn - £1.4bn/yr
5.70pEPS
Dividendcut
Significantcapital expenditure£21bn
totalindebtedness £0bn
£5bn
08/09 10/11 12/13 14/15

In the UK, creating the leading food business.
38
39
Booker results (unaudited)
• Q4 customer satisfaction up further 0.3% on Q3, to 85.7%
• Q4 like-for-like sales up 9.9%
• c.£195m FY 17/18 operating profit before exceptional items
• c.£120m FY 17/18 net cash

40
Joining forces
On time, as proposed Significant costsynergy potential
At least £25m
Significant revenuegrowth potential
ProcurementDistribution &
fulfilment
Central
At least £175m
41
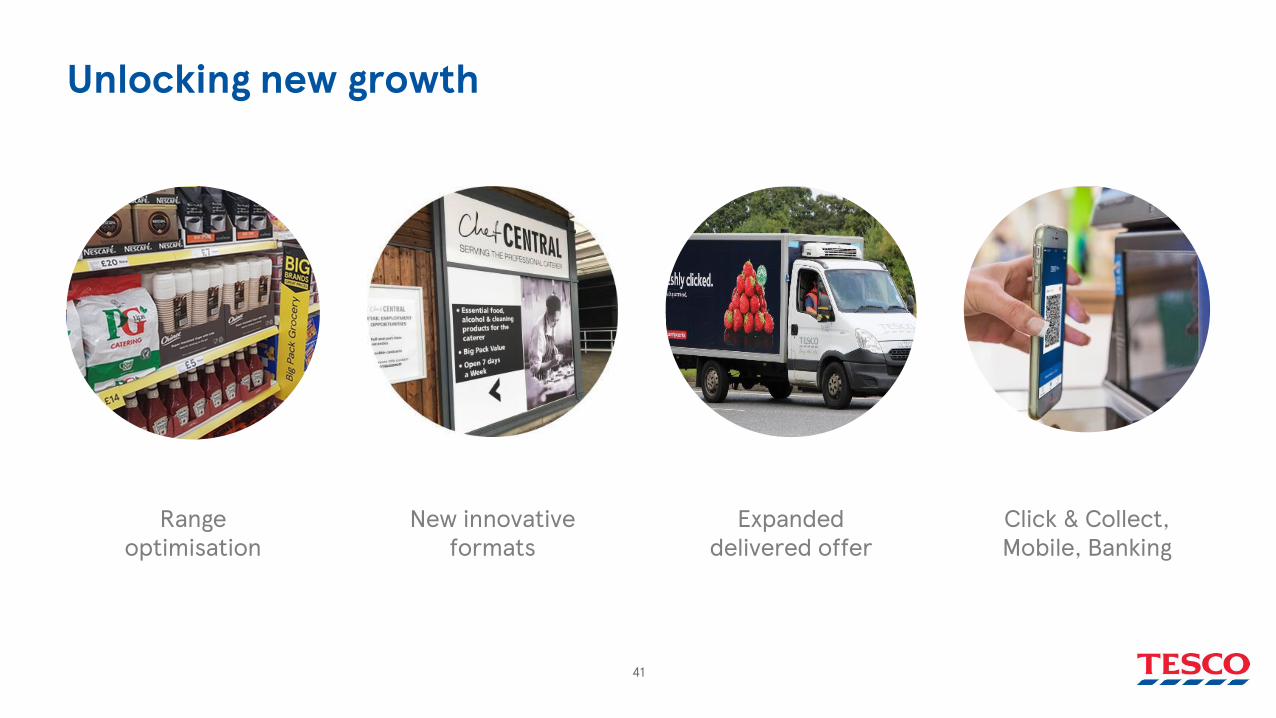
Unlocking new growth
Range optimisation
New innovative formats
Click & Collect, Mobile, Banking
Expanded delivered offer

42
Synergies
Revenue aspirationExceptional costs
Procurement
Central
£2.5bn
Synergies
£200mover 3 years
< £145mover 3 years
c.£60m
c.£140m
c.£200m
18/19 19/20 20/21

43
Minimum change, maximum impact
Purpose ‘Serving Britain’s Customers a little better every day’
Values 1. No one tries harder for customers2. We treat people how they want to be treated3. Every little help makes a big difference
Operating Principles Health Safe + LegalCustomer satisfactionCash profitability20/80: Minimise change for maximum benefit‘One Team’ with specialised channel expertise (Retail, Wholesale, Online)YCDBSOYA - Speed

44
Sustainable value creation for shareholders
3.5% to 4.0%
£9bn £1.5bn
Tesco medium-term ambitions Underlying philosophy
Cash profitability
Free cash flow
Earnings growth
45
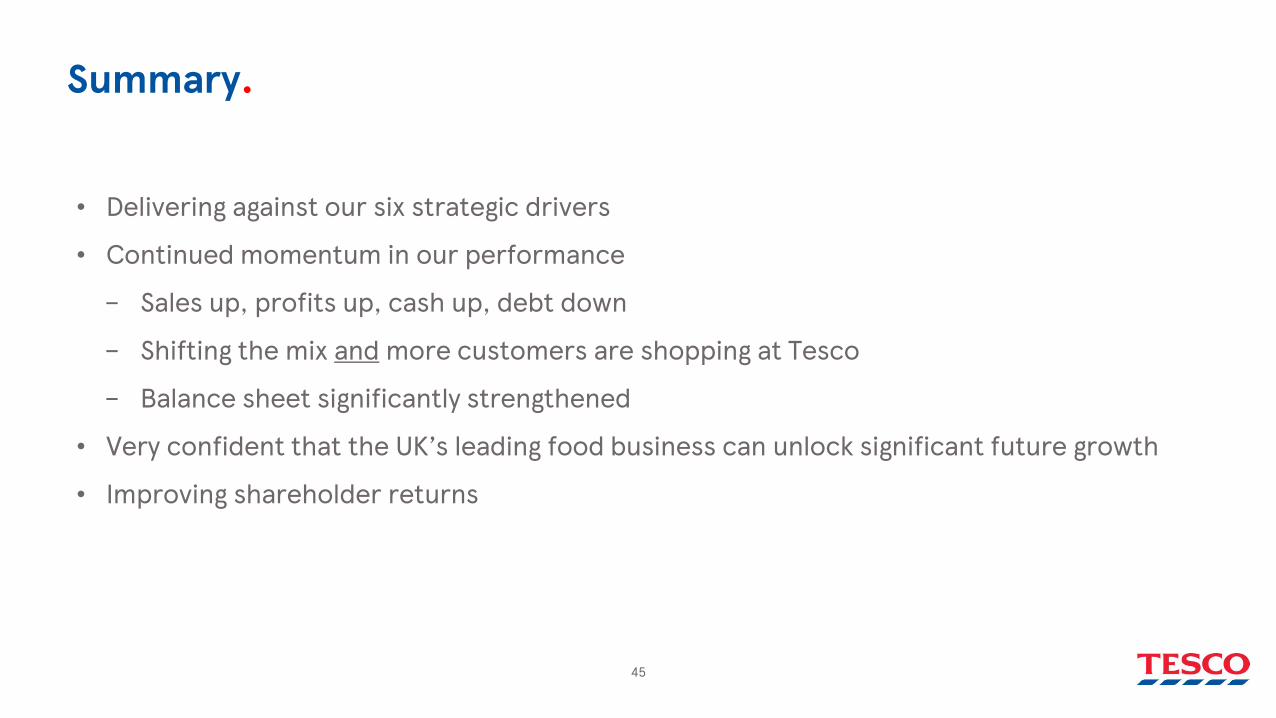
Summary.
• Delivering against our six strategic drivers
• Continued momentum in our performance
– Sales up, profits up, cash up, debt down
– Shifting the mix and more customers are shopping at Tesco
– Balance sheet significantly strengthened
• Very confident that the UK’s leading food business can unlock significant future growth
• Improving shareholder returns

Q&A.
46

Appendix.

48
Segmental performance
1. Change shown on a comparable days basis.
Sales Operating profit before exceptional items
FY 17/18 FY 16/17Change
constantrates1
Change actual rates1
FY 17/18 FY 16/17Change
constant rates
Change actual rates
UK & ROI £38.7bn £37.7bn 2.2% 2.5% £1,053m £803m 30.3% 31.1%
Central Europe
£6.3bn £6.0bn (1.6)% 6.1% £119m £58m 89.7% 105.2%
Asia £4.9bn £5.2bn (9.4)% (4.4)% £299m £262m 7.6% 14.1%
Bank £1.1bn £1.0bn 3.9% 3.9% £173m £157m 10.2% 10.2%
Group £51.0bn £49.9bn 0.6% 2.3% £1,644m £1,280m 25.9% 28.4%

49
Margin progression
1.4%
2.3%1.8%
2.2% 2.4% 2.3%2.7%
3.0% 2.9%
1H 2H FY 1H 2H FY 1H 2H FY
Group
0.8%
1.6%1.2%
1.8% 1.9% 1.9%2.1%
2.5% 2.3%
1H 2H FY 1H 2H FY 1H 2H FY
UK & ROI
1.0%
2.7%
1.9%
0.6%
1.3%0.9%
1.9% 1.7% 1.8%
1H 2H FY 1H 2H FY 1H 2H FY
Central Europe
4.2%
5.6%
4.9%
4.1%
5.8%
5.0%5.6%
6.5%6.0%
1H 2H FY 1H 2H FY 1H 2H FY
Asia
Operating margin shown before exceptional items.
FY 15/16 FY 16/17 FY 17/18 FY 15/16 FY 16/17 FY 17/18
FY 15/16 FY 16/17 FY 17/18 FY 15/16 FY 16/17 FY 17/18
50
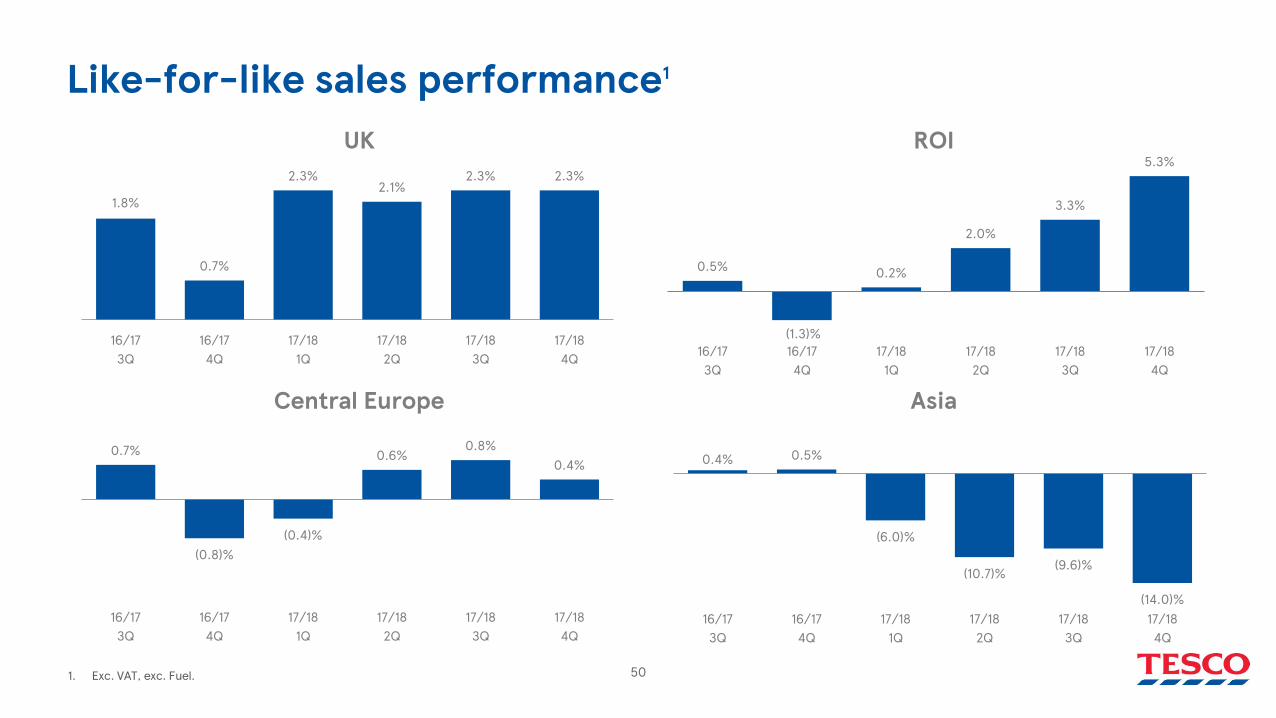
Like-for-like sales performance1
1. Exc. VAT, exc. Fuel.
1.8%
0.7%
2.3%2.1%
2.3% 2.3%
16/173Q
16/174Q
17/181Q
17/182Q
17/183Q
17/184Q
UK
0.7%
(0.8)%(0.4)%
0.6%0.8%
0.4%
16/173Q
16/174Q
17/181Q
17/182Q
17/183Q
17/184Q
Central Europe
0.4% 0.5%
(6.0)%
(10.7)% (9.6)%
(14.0)%16/173Q
16/174Q
17/181Q
17/182Q
17/183Q
17/184Q
ROI
Asia
0.5%
(1.3)%
0.2%
2.0%
3.3%
5.3%
16/173Q
16/174Q
17/181Q
17/182Q
17/183Q
17/184Q
51
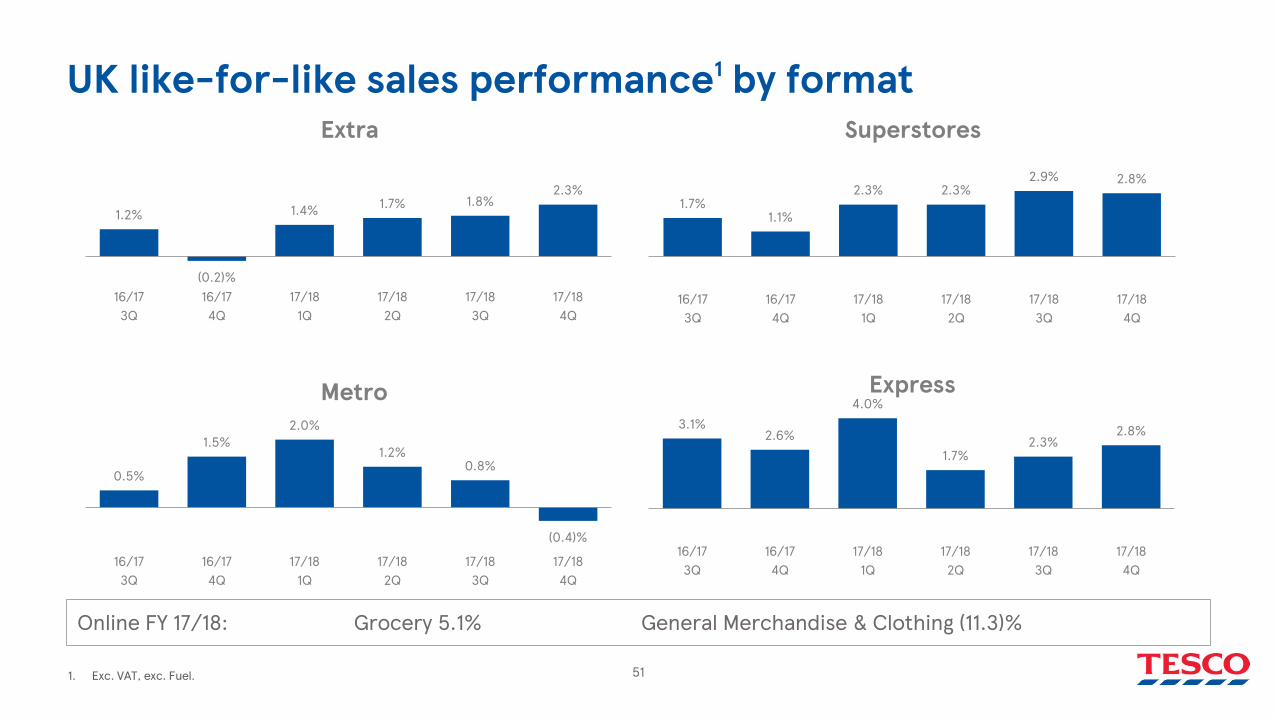
UK like-for-like sales performance1 by format
1. Exc. VAT, exc. Fuel.
1.2%
(0.2)%
1.4% 1.7% 1.8%2.3%
16/173Q
16/174Q
17/181Q
17/182Q
17/183Q
17/184Q
Extra
1.7%1.1%
2.3% 2.3%2.9% 2.8%
16/173Q
16/174Q
17/181Q
17/182Q
17/183Q
17/184Q
Superstores
0.5%
1.5%2.0%
1.2%0.8%
(0.4)%
16/173Q
16/174Q
17/181Q
17/182Q
17/183Q
17/184Q
Metro3.1%
2.6%
4.0%
1.7%2.3%
2.8%
16/173Q
16/174Q
17/181Q
17/182Q
17/183Q
17/184Q
Express
Online FY 17/18: Grocery 5.1% General Merchandise & Clothing (11.3)%

52
Exceptional itemsFY 17/18 FY 16/17
Restructuring and redundancy £(102)m £(199)m
Property transactions £79m £165m
Disposal of opticians business £38m -
Interchange legal settlement - £57mAmounts (provided)/released in relation to SFO and FCA obligations £25m £(235)m
Profit on the sale of Lazada £124m -
Tesco Bank customer redress £(24)m £(45)mNet impairment (loss)/reversal of non-current assets and onerous lease provisions £53m £(6)m
Total exceptional items in operating profit £193m £(263)m

53
Disclaimer.
This document may contain forward-looking statements that may or may not prove accurate. Forward-looking statements are statements that are not historical facts; they include statements about Tesco’s beliefs and expectations and the assumptions underlying them. For example, statements regarding expected revenue growth and operating margins, market trends and our product pipeline are forward-looking statements. Phrases such as "aim", "plan", "intend", "anticipate", "well-placed", "believe", "estimate", "expect", "target", "consider" and similar expressions are generally intended to identify forward-looking statements. Forward-looking statements involve known and unknown risks, uncertainties and other factors that could cause actual results to differ materially from what is expressed or implied by the statements. Any forward- looking statement is based on information available to Tesco as of the date of the statement. All written or oral forward-looking statements attributable to Tesco are qualified by this caution. Tesco does not undertake any obligation to update or revise any forward-looking statement to reflect any change in circumstances or in Tesco’s expectations.