SERVICIO METEOROLÓGICO NACIONAL (SMN) ARGENTINA · PDF fileNATIONAL METEOROLOGICAL...
72
NATIONAL METEOROLOGICAL SERVICE NATIONAL METEOROLOGICAL SERVICE SERVICIO METEOROLÓGICO NACIONAL (SMN) SERVICIO METEOROLÓGICO NACIONAL (SMN) ARGENTINA ARGENTINA Liliana N. Núñez Liliana N. Núñez . . www.smn.gov.ar www.smn.gov.ar [email protected] [email protected]
Transcript of SERVICIO METEOROLÓGICO NACIONAL (SMN) ARGENTINA · PDF fileNATIONAL METEOROLOGICAL...

NATIONAL METEOROLOGICAL SERVICENATIONAL METEOROLOGICAL SERVICE
SERVICIO METEOROLÓGICO NACIONAL (SMN)SERVICIO METEOROLÓGICO NACIONAL (SMN)
ARGENTINAARGENTINA
Liliana N. NúñezLiliana N. Núñez
..www.smn.gov.arwww.smn.gov.ar
[email protected]@smn.gov.ar

SMN
At the Argentine National Meteorological Service (SMN)

SMN
At the Argentine National Meteorological Service (SMN in Spanish)
We use the mean and the statistics
1961-1990 that are our “normal
values”.
SMN
In all the statistics for the temperature, mean,
maximum or minimum, is presented the monthly
mean value, and their extremes; and the extremes
occurred on any day of the month.

SMN
In all the statistics for the temperature, mean, maximum or minimum, is presented the monthly mean value, and their extremes; and the extremes occurred on any day of the month.
For the precipitation is presented the mean and the
extremes of the precipitation accumulated along the
month, but nothing is said about what happened
during the month .

SMN
In all the statistics for the temperature, mean, maximum or minimum, is presented the monthly mean value, and their extremes; and the extremes occurred on any day of the month.For the precipitation is presented the mean and the extremes of the precipitation accumulated along the month, but nothing is said about what happened during the month .
This way of the precipitation evaluation can lead to great
errors at the monitoring of what is happening or of what had
happened with the past extremes and with the tendencies.

SMN
In all the statistics for the temperature, mean, maximum or minimum, is presented the monthly mean value, and their extremes; and the extremes occurred on any day of the month.
For the precipitation is presented the mean and the extremes of the precipitation accumulated along the month, but nothing is said about what happened during the month .
This way of the precipitation evaluating can lead to great errors at the monitoring of what is happening or of what had happened with the past extremes and with the tendencies.
I'll try to explain what I'm saying with an example.

SMN Monthly precipitation – MovN (1)
Month 1, day 31= 15mm, Month 2, day 1= 15mm, Month 3, day 31=15mm
The monthly precipitation is
Month 1 = 15 mm Month 2 = 15 mm Month 3 = 15 mm

SMN Monthly precipitation - MovN
Month 1, day 31= 15mm, Month 2, day 1= 15mm, Month 3, day 31=15mm
The precipitation of the day 31 plus of the 1rst day, is 30 mm: a “humid“ period, then without precipitation between the second and the 30 of the next month: a “dry” period.

SMN Precipitation daily, monthly and MovN
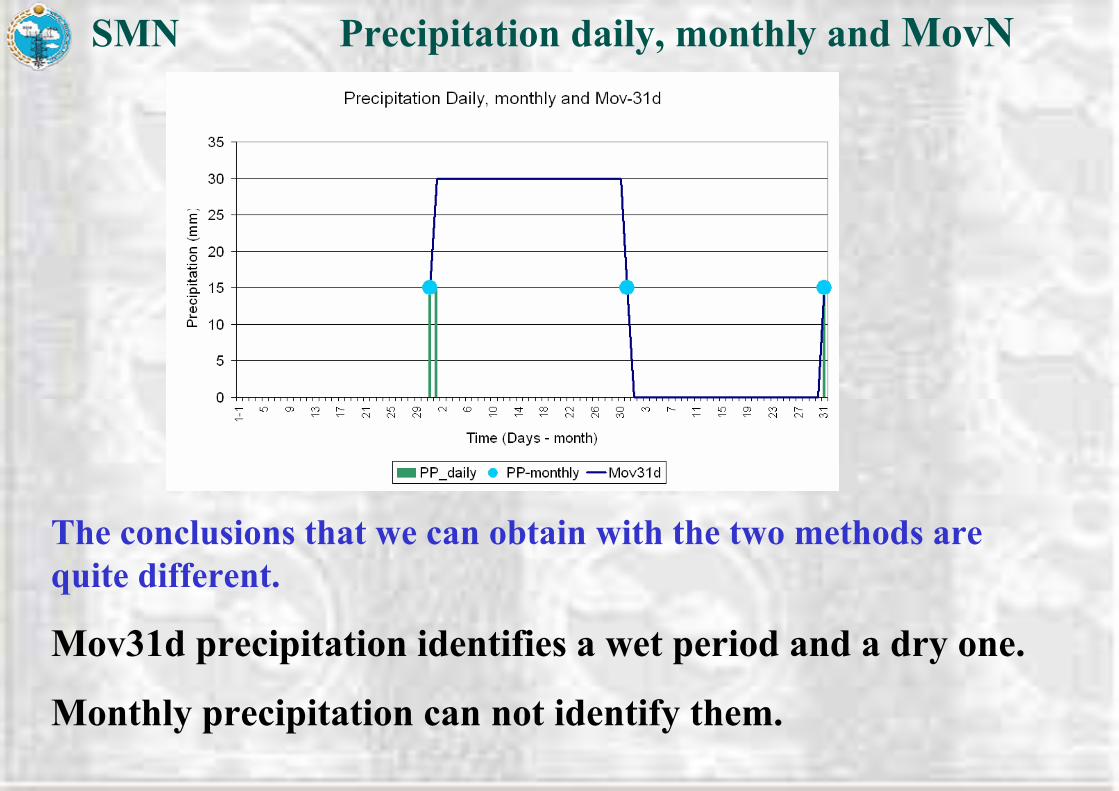
If now are considered, for each day, the precipitation
that is accumulated at 31 days (Mov31d), it is possible
identified a wet period and a dry one.

SMN Precipitation daily, monthly and MovN
If now are considered, for each day, the precipitation that is accumulated at 31 days (Mov31d), it is possible identified a wetperiod and a dry one.
The conclusions that we can obtain with the two methods are quite different.
SMN Precipitation daily, monthly and MovN
The conclusions that we can obtain with the two methods are quite different.
Mov31d precipitation identifies a wet period and a dry one.
Monthly precipitation can not identify them.

SMN
Here it can be seen that there is a lot of extreme values (Mov31d) greater than the corresponding monthly values. The same occurs with the minimum values, but in this figure is not so easily to see.
Mov31d (accumulated rainfall in 31 days mobile )

SMN Annual precipitation - Mov365d (1 year)
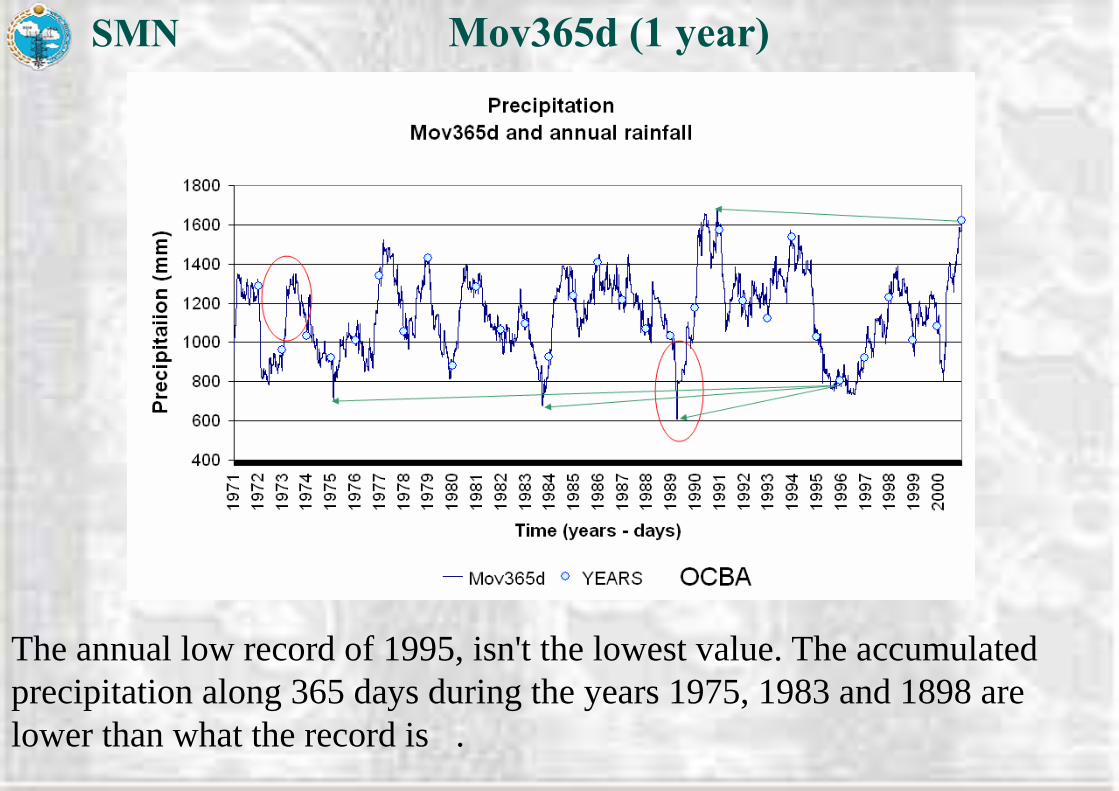
Here, it's interesting see what happened between 1972 and 1973, and between 1988 and 1989. Annual precipitation ignore a wet period at the first and a dry one at the second.
SMN Mov365d (1 year)
The annual low record of 1995, isn't the lowest value. The accumulated precipitation along 365 days during the years 1975, 1983 and 1898 are lower than what the record is .

SMN Mov365d (1 year)
The high record of the year 2000, isn't the highest value.
The accumulated precipitation along 365 days during the year 1990 is higher than the highest value of the year 2000.
SMN MovNd
This happen at all periods of time.
The extremes of:
Mov6h (6 hours) are greater than the daily precipitation,
Mov31d are greater than the monthly precipitation,
……..
Mov30y are greater than de 30 years precipitation.
SMN MovNd
This happen at all periods of time.
Mov6h is greater than the daily precipitation,
Mov31d is greater than the monthly precipitation,
……..
Mov30y is greater than de 30 years precipitation.
The records are more extremes and the tendencies are different.

SMN returning to the monitoring of the Drought, we use daily a 10 days
Hydrological balance
and related with it

SMN
Hydrological balance, ETP, precipitation less ETP and balance difference with the previous decade
ETP precipitation balance, difference (Potential less ETP between two evapotranspiration consecutive periods

SMN
Related with the precipitation, the SMN produce daily, decadal and monthly bulletins, that include: Hydrological balanceNeeds of water in the coming 10 days to be:
Not with drought Not at the beginning of drought

SMN
Related with the precipitation, the SMN produce daily, decadal and monthly bulletins, that include: Hydrological balanceNeeds of water at the following ten 10 days to be: Not with drought, Not at the beginning of drought
in good conditions beginning to have excesses

SMN for the monitoring of the Drought, we use a
for the monitoring of the Drought, we use a Hydrological balance
Evolution of the balance along three years
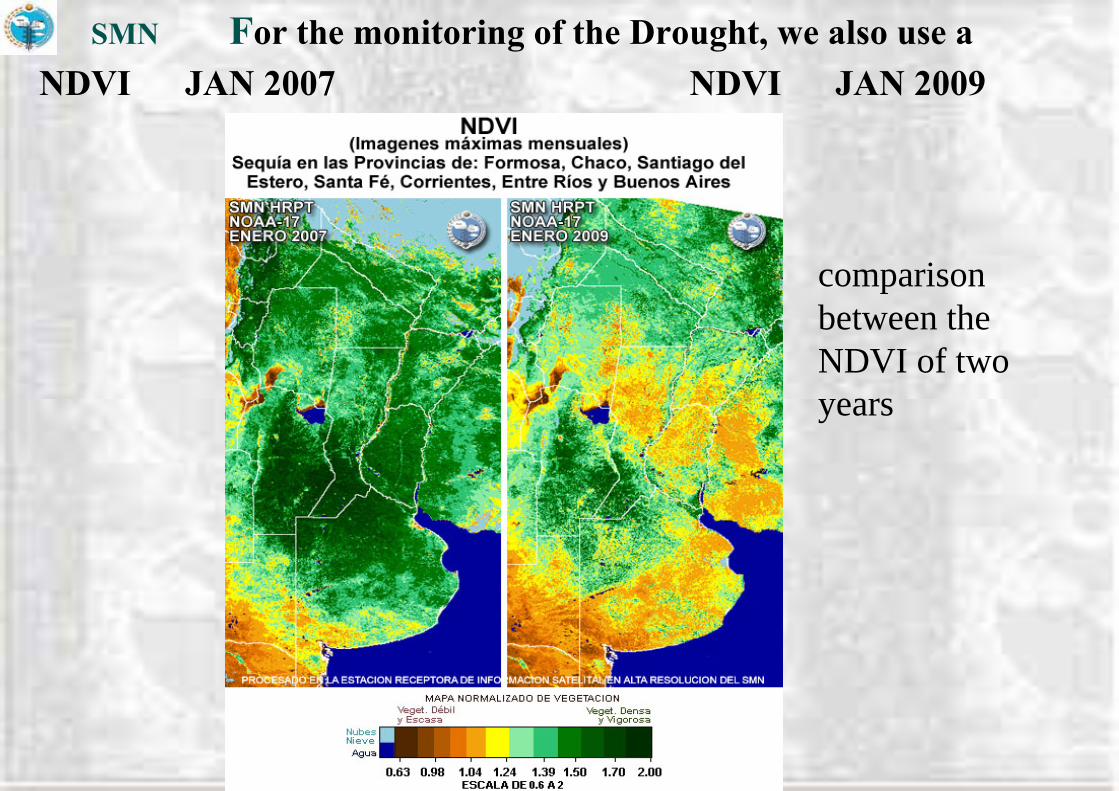
NDVI JAN 2007 NDVI JAN 2009SMN For the monitoring of the Drought, we also use a
comparison between the NDVI of two years
SMN
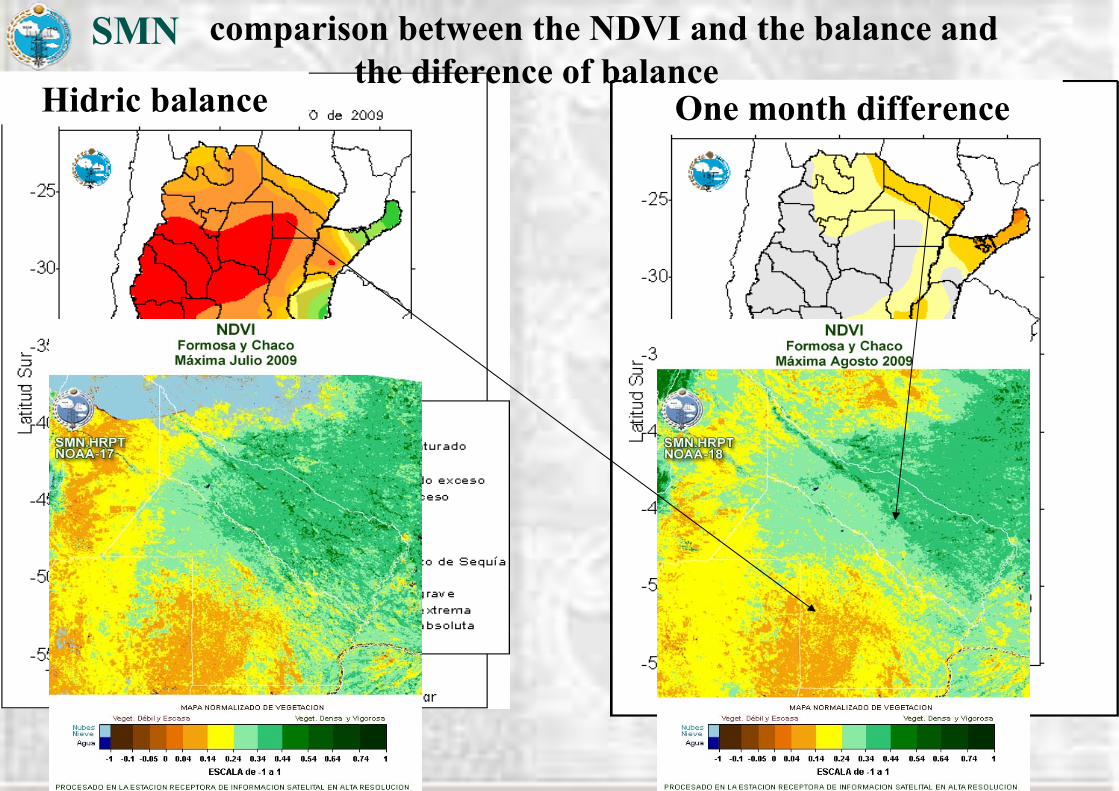
Hidric balance One month difference
comparison between the NDVI and the balance and the diference of balance

SMN We also use Indices to qualify the precipitation
The MEAN
The mathematics says that MEAN should be used with normal series.
When the distribution is abnormal, the mean may not be a representative statistic.
The MEDIAN
It is nearly always representative, and usually gives a better measure of expectation than the mean, since half the observations fall either side of it.
SMN Indices to qualify the precipitation
The MEAN
The mathematics says that MEAN should be used with normal series.When the distribution is abnormal, the mean may not be a representative statistic.
The MEDIANIt is nearly always representative, and usually gives a better measure of expectation than the mean, since half the observations fall either side of it.
Daily and monthly precipitation have an abnormal distribution.

SMN Indices to qualify the precipitation
The MEAN
The mathematics says that MEAN should be used with normal series.
Daily and monthly precipitation have an abnormal distribution.
Normal is a mathematical construct that does not necessarily
correspond with what we expect the weather to be (2).

SMN Indices to qualify the precipitation
The MEAN
Then
We can use the mean with the precipitation
Or
We should not use the mean with the precipitation
SMN Indices to qualify the precipitationWe can use mean with the precipitation
OrWe should not use mean with the precipitation
To select one, I qualify the MEDIAN with the MEAN
I’ve calculated the difference (media - mean) to the
accumulated precipitation values on Mov31d
all along the period 1971-2000, and the result is

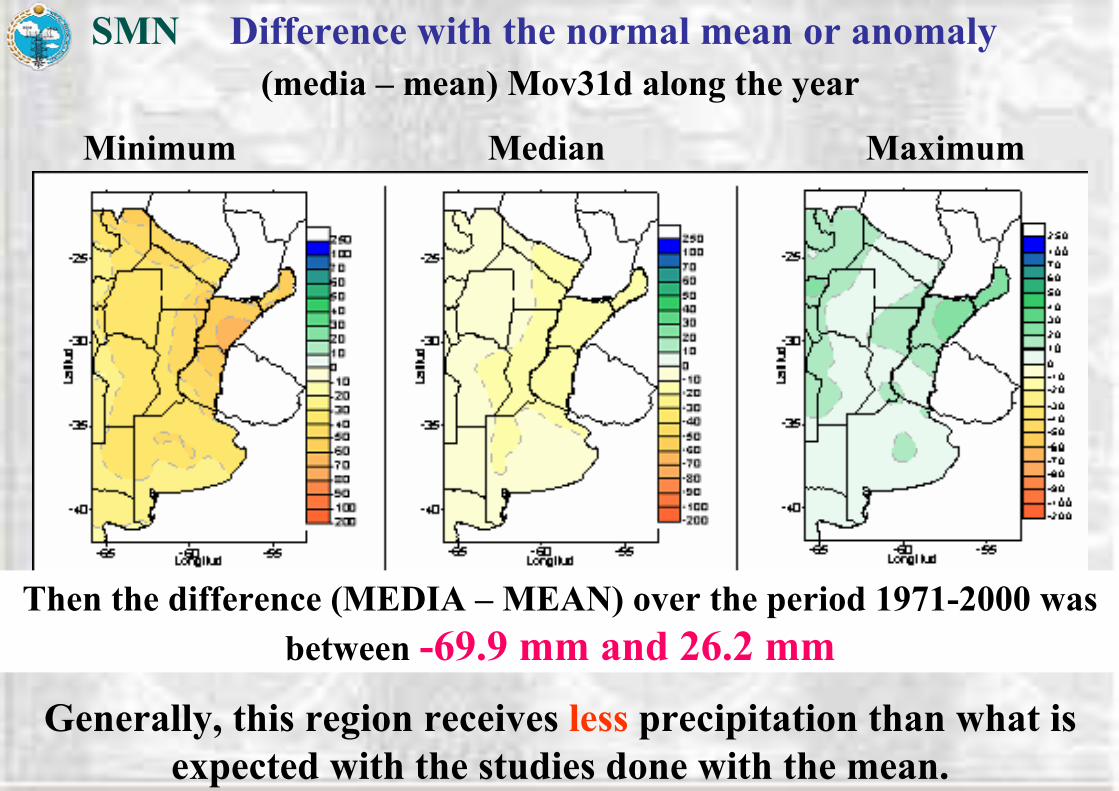
SMN Difference with the normal mean or anomaly (3)(media – mean) Mov31d along the year
Minimum Median Maximum
Max.: -19.3 mm Max; -2.8 mm Max: 26.2mm
Median: -34.3mm Median= -9.4 mm Median= 8.4 mm
Min.: -69.9 mm Min: -17.3 mm Min: 2.1mm
SMN Difference with the normal mean or anomaly(media – mean) Mov31d along the year
Minimum Median Maximum
Then the difference (MEDIA – MEAN) over the period 1971-2000 was between -69.9 mm and 26.2 mm
Generally, this region receives less precipitation than what is expected with the studies done with the mean.

SMN
For this Argentine region the anomaly (media – mean)
over the period 1971-2000 was between
-69.9 mm and 26.2 mm
Then when we qualify the monthly precipitation with the anomaly (precipitation - normal mean) and we obtain
-20 mm or +20 mm
physically, what does it mean?
is over or below the media?
It's humid or it's dry?

SMN
For this Argentine region the anomaly (media – mean)
over the period 1971-2000 was between
-69.9 mm and 26.2 mmThen when we qualify the monthly precipitation with the anomaly (precipitation - normal mean) and we obtain
-20 mm or +20 mm
fisically, this what does it mean?
is over or below the media?
It's humid or it's dry?
With this index we can't know

Anomaly (precipitation – mean) is a simple calculation index
But very frequently does not
correspond with what we expect the weather to be.
So, If I have another index,
I try not to use the “anomaly of the precipitation”
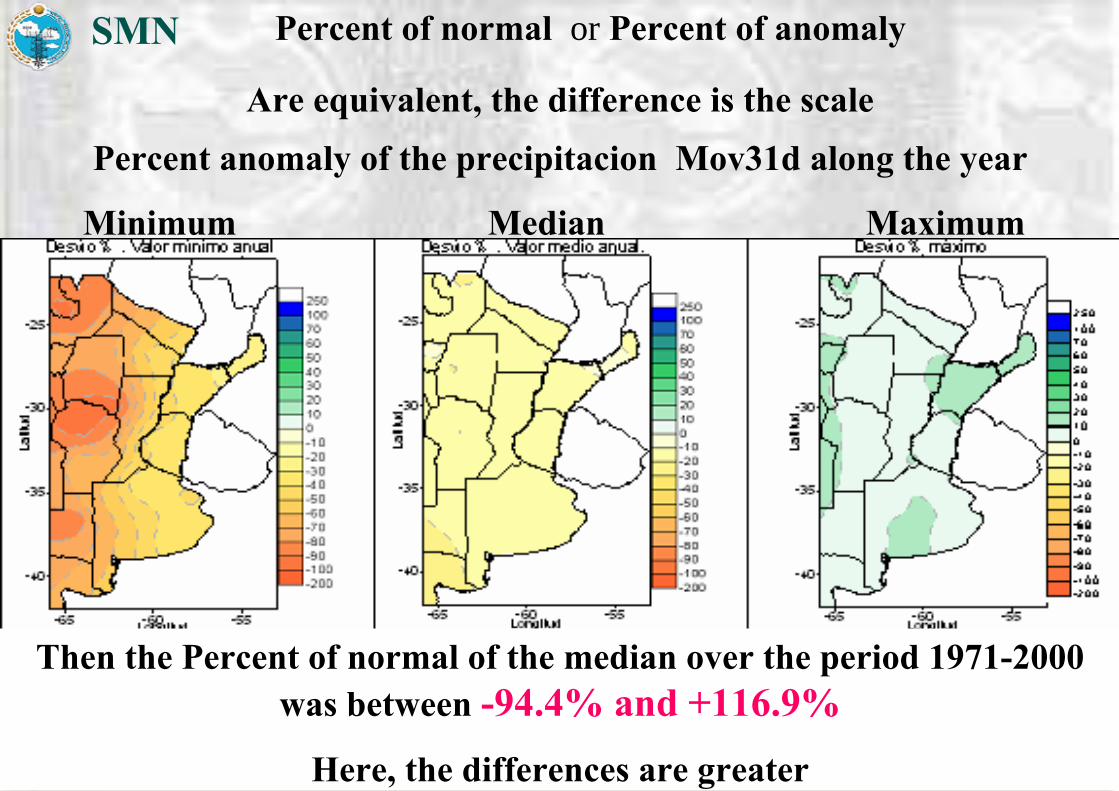
SMN Percent of normal or Percent of anomaly
Are equivalent, the difference is the scalePercent anomaly of the precipitacion Mov31d along the year
Minimum Median Maximum
Then the Percent of normal of the median over the period 1971-2000 was between -94.4% and +116.9%
Here, the differences are greater
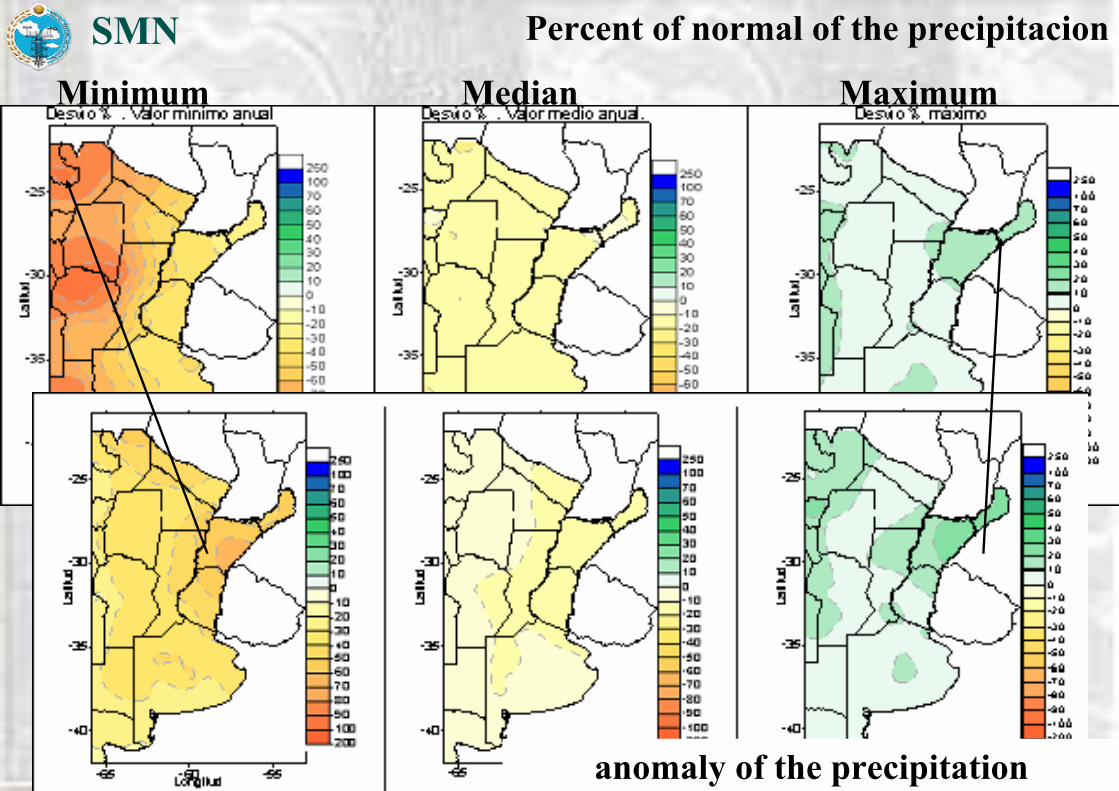
SMN Percent of normal of the precipitacion
Minimum Median Maximum
anomaly of the precipitation

SMN
Percent of Normal or
Percent of anomaly of the precipitation
are simple calculation indexes
But more frequently than the anomaly does not correspond with what we expect the weather to be.
So, I NEVER use these indices

SMN Indices to qualify the precipitation
As in Argentina, rainfall doesn't have a normal behavior.
The mean is not a representative statistic.
Then the Anomaly and the Percent of Normal
are bad indices for the Argentina precipitation.
What about SPI , the Decil and PROBn?
SMN Indices to qualify the precipitation
As in Argentina, rainfall doesn't have a normal behavior.
The mean is not a representative statistic.
Then the Anomaly and the Percent of Normal
are bad indices for the Argentina precipitation.
What about SPI , the Decil and PROBn?
John Keyantash and John A. Dracup (2002)(6) have done an evaluation of Drought Indices
They found that the Rainfall Deciles (7) is better than the SPI
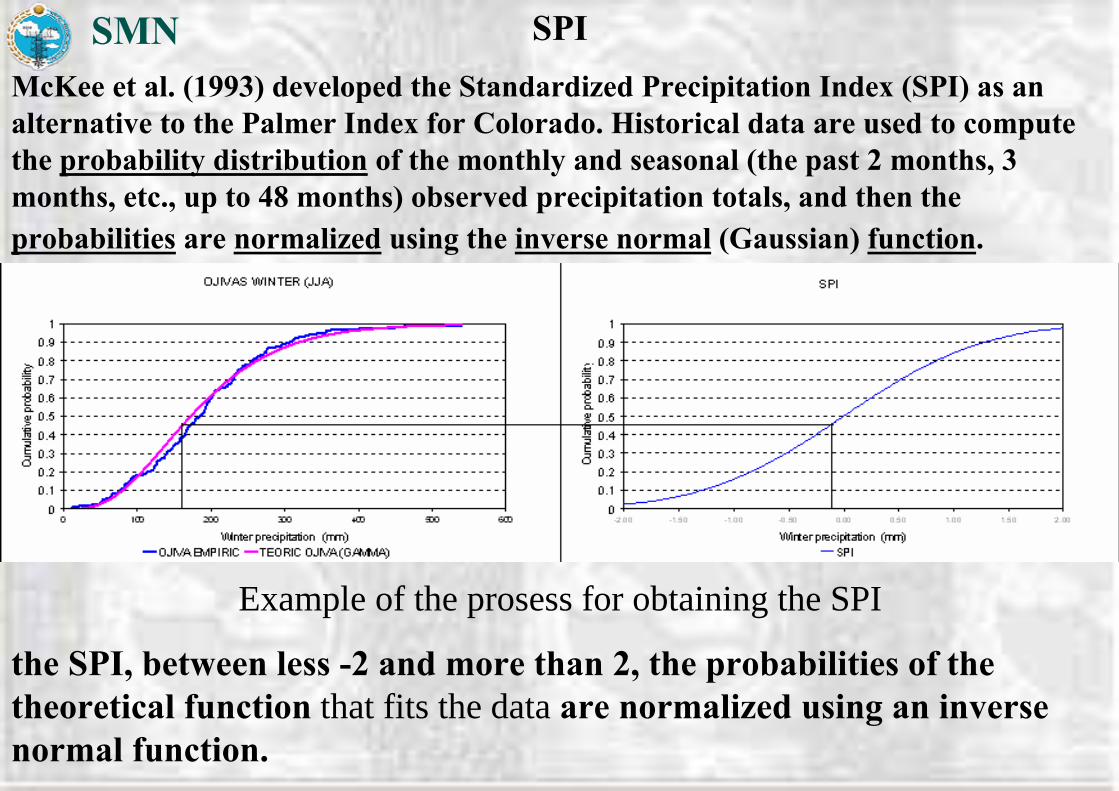
SMN SPIMcKee et al. (1993) developed the Standardized Precipitation Index (SPI) as an alternative to the Palmer Index for Colorado. Historical data are used to compute the probability distribution of the monthly and seasonal (the past 2 months, 3 months, etc., up to 48 months) observed precipitation totals, and then the probabilities are normalized using the inverse normal (Gaussian) function.
Example of the prosess for obtaining the SPI
the SPI, between less -2 and more than 2, the probabilities of the theoretical function that fits the data are normalized using an inverse normal function.

SPI - DECILSMN
2.0+ ( 2%) extremely wet 1.5 to 1.99 ( 7%) very wet 1.0 to 1.49 (17%) moderately wet -.99 to .99 (66%) near normal -1.0 to -1.49 (17%) moderately dry -1.5 to -1.99 ( 7%) severely dry -2.0- ( 2%) extremely dry
SPI: the probabilities of the theoretical function are normalized using an inverse normal function
Deciles: directly divides the record into tenths of the distribution.
Both are probability of occurrence
0: record dry1-2: lowest 20% much below normal 3-4: next lowest 20% below normal 5-6: middle 20% near normal 7-8: next highest 20% above normal 9-10:highest20% much above normal 11: record wet
SMN
We have begun to use the index we call
Probability of occurrence (PROBn )
As SPI, Decil and PROBn are probability of occurrence, I'll
do a comparison between the three.

SMN comparison
DECILES PROBn
choose the intervals between those who wants to study the series, and then determines the probability
each 10% probability determines the value that corresponds, the deciles

SMN
.- divides the record into fixed intervals, with physic meaning, and obtain their probability.
.- all the series has the samelimits
.- Divides the record into tenths of the distribution.
.- each series has his own limits(like the SPI )
.- uses historical data.- uses historical data (like the SPI )
PROBnDeciles

SMN
.- The series is ordered from lowest to highest and the extreme values are established
.-establish the percentage of eachinterval
.- Determine the interval to which each data belongs and the probability of it is = PROBn
.- The series is ordered from lowest to highest and the extreme values are established
.- establish the interval of eachdecil
.- Determine the decil to which each data belongs, and the probability of it is = 10%
PROBnDECIL

SMN
Establish the qualification of the data.- absolute qualification.- qualification independent on
the series .- with physical meaning.-percentage of data in the interval= PROBn.-percentage dependent of the series. Each interval has a probability of occurrence = PROBn
Establish the qualification of the data
.- relative qualification 1
.- qualification dependent on the
series 1
.- without physical meaning
.- percentage of data in the decile= 10% 2
.- percentage independent of the series. Each interval has the same probability of occurrence= 10% 2
PROBnDECIL
1 Idem for the SPI 2 (SPI probability of 2, 7, 17, 66, 17, 7, 2)

SMN
.-Percentage of data that are below: Defined the interval is variable the percentage of data that are exceeded.
Percentage of data that are aboveDefined the interval is variable the percentage of data that are above.
The PROBn of different time periods are combinable
.-Percentage of data that are below: Defined the interval is always the same percentage of data that are exceeded. 1
Percentage of data that are aboveDefined the interval is always the same percentage of data that are above. 1
The deciles of different time periods are not combinable 1
PROBnDECIL
1 the same for the SPI

SMNExample
For the limits of the intervals for PROBn in this example it's used a modification of the Blair CLASIFICATION BY RAINFALL (Blair,1942)
Climatic type annual rainfall (mm)Extreme arid ≤ 100Arid ≤ 250 Semiarid ≤ 500Dry subhumid ≤ 600Mid subhumid ≤ 800Subhumid ≤ 1000Humid-12 ≤ 1200Humid-14 ≤ 1400Humid-17 ≤ 1700Humid-20 ≤ 2000Hiperhumid > 2000

SMN
Annual precipitation at stations Est-1, Est-2 and Est-3:

SMN DECIL - PROBn
50 mm is for SPI= -2 (extremely Dry), Decil= limit for record Dry, PROBn= AE
200 mm is for SPI= 2 (extremely Wet), Decil= limit for record Wet, PROBn= A

SMN DECIL - PROBn
1800 mm is for SPI= -2(extremely Dry), Decil= limit for record Dry, PROBn= H-20 2100 mm is for SPI= 2 (extremely Wet), Decil= limit for record Wet, PROBn= Hh

SMN DECIL - PROBn
200 mm is for SPI= -2 (extremely Dry), Decil= limit for record Dry, PROBn= SA
1800 mm is for SPI= 2 (extremely Wet), Decil= limit for record Wet, PROBn= H-20

SMN SPI - DECIL - PROBn
At this example
200 mm for PROBn is always ARID,
while 200 mm is for
For the Est-1Deciles= "extremely above average, limit of the record wet"SPI= 2 (extremely Wet)
And for Est-3Deciles= "extremely below average, limit of the record dry"SPI= -2 (extremely Dry)

SMN SPI - DECIL - PROBn
At this example
1800 mm for PROBn is always HUMID-18,
while 1800 mm is
for Est-3
Deciles= "extremely above average, limit of the record wet"SPI= 2 (extremely Wet)
And for Est-2
Deciles= "extremely below average, limit of the record dry"SPI= -2 (extremely Dry)

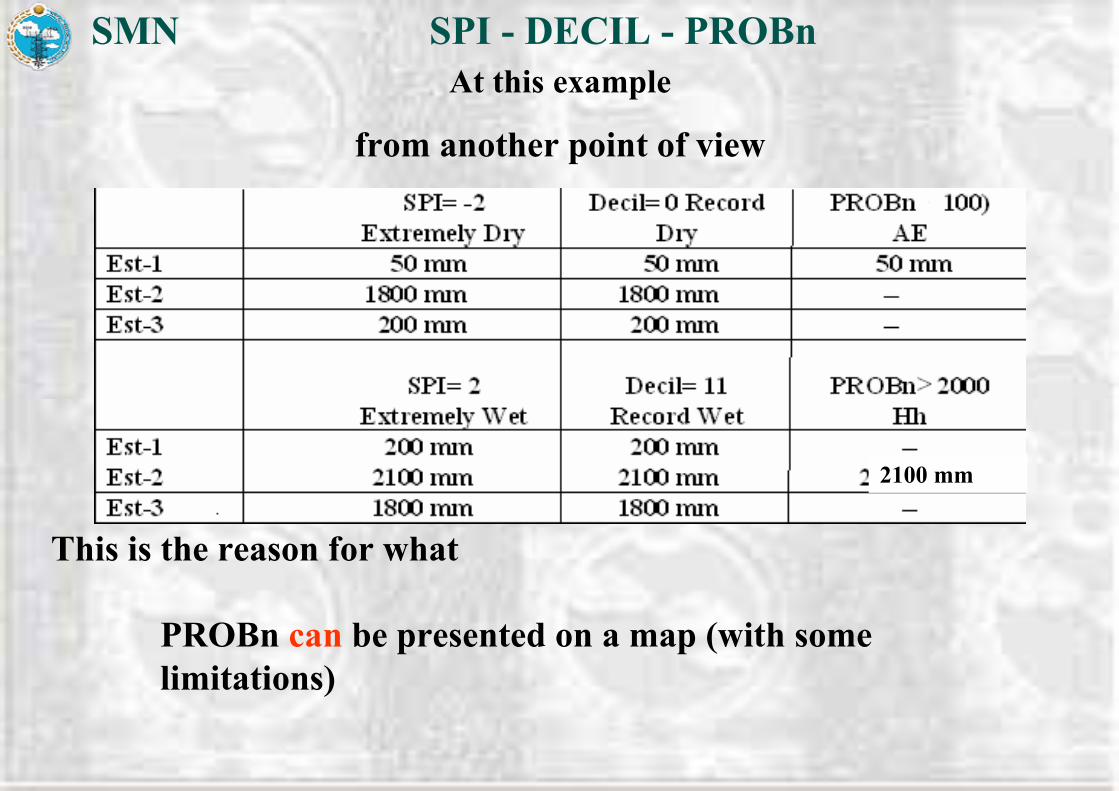
SMN SPI - DECIL - PROBnAt this example
from another point of view
When the policy communities, decision makers, the farmers, etc.,see an SPI -2, or a decil 0, and the corresponding precipitations values are 50 mm, 200, and 1800 mm, could generate a great confusion.
2100 mm
SMN SPI - DECIL - PROBnAt this example
from another point of view
This is the reason for what
PROBn can be presented on a map (with some limitations)
2100 mm

SMN SPI - DECIL - PROBnAt this example, from another point of view
2100 mm
SPI, Decil and PROBn are related with the probability of
occurrence of a precipitation but
SPI and Decil do not have any relation with the intensity or severity of a drought,
while PROBn have it.

SMN SPI - DECIL - PROBnSPI, Decil and PROBn are related with the probability of
occurrence of a precipitation but
SPI and Decil do not have any relation with the intensity or severity of a drought,
It is not the same preparedness and mitigation for a
Drought with SPI -2 (50 mm) or a Decil 0 (50 mm) than for a
drought with SPI -2 (1800 mm) or a Decil 0 (1800 mm)
PROBn has relation with intensity or severity of a drought
PROBn(50 mm) = AE
PROBn(1800 mm)= Humid-20
The preparedness for mitigation for lack of precipitation when it's near 50 mm or near 1800 mm is very different, the damage is completely different.

SMN SPI - DECIL - PROBn
8) Drought is considered by many to be the most but least
understood of all natural hazards…Here remains much
confusion within the scientific and policy communities about it
characteristics… this confusion explain, to some extent, the luck
of progress in drought preparedness in most parts of the world.
SMN SPI - DECIL - PROBn8) Drought is considered by many to be the most but least understood of all natural hazards…Here remains much confusion within the scientific and policy communities about it characteristics… this confusion explain, to some extent, the luck of progress in drought preparedness in most parts of the world.
Drought onset and end are often difficult to determine, as is
its severity. The impact of drought can be reduced thought
preparedness and mitigation.

SMN SPI - DECIL - PROBnDrought is considered by many to be the most but least understood of all natural hazards…Here remains much confusion within the scientific and policy communities about it characteristics… this confusion explain, to some extent, the luck of progress in drought preparedness in most parts of the world.
Drought onset and end are often difficult to determine, as is its severityThe impact of drought can be reduced thought preparedness and mitigation.
If nations and regions are to make progress in reducing the
serious consequences of the drought, or other extreme event,
they must improve their understanding of the hazard
SMN SPI - DECIL - PROBnDrought is considered by many to be the most but least understood of all natural hazards…Here remains much confusion within the scientific and policy communities about it characteristics… this confusion explain, to some extent, the luck of progress in drought preparedness in most parts of the world.
Drought onset and end are often difficult to determine, as is its severityThe impact of drought can be reduced thought preparedness and mitigation.If nations and regions are to make progress in reducing the serious consequences of the drought, or other extreme event, they must improve their understanding of the hazard
Then, it's necessary methologies that don't generate
confusion on to the decision makers.

SMN PROBn
With this methology it's possible to obtain 4 indices
PROBn: the probability in the interval
PROBnb: the probability below the interval
PROBna: the probability above the interval
And
PROBnd: the probability in the interval and below it
(the equivalent to the Decil)
It provides a complete description of the distribution of the series

SMN January Mean 1971-200 - PROBnd
PROB1d = Precipitation, January, Mean 1971-2000 and the probability of the interval in which it is located more the probability below this range (n = 1 month)

SMN PROB31d-d - Mov31d 2008 values
Prob31d-d for some of the values of the monthly precipitation and for the Mov31d 2008 values

SMN PROBn-A and Mov31d 2008
Probability above the interval and above the registered 2008 precipitation

SMN
1) Núñez, L.N. 2005. MovN, a different vision. SMN. Internal report. Unpublished.
Núñez L.N., G.P. Podestá. 2006: Precipitación anual, estacional y mensual vsperíodos móviles. XI Reunión Argentina de Agrometeorología: La Agrometeorología y el desarrollo local., La Plata. Argentina. 169-170.
2) Hayes, Michael J 2006: What is Drought?, Drought Indices 2006 National Drought Mitigation Center http://www.drought.unl.edu/whatis/indices.htm)
3) Núñez, L.N. 2008. Mean versus median. SMN. Internal report. Unpublished.
4) Núñez, L.N. 2009. ProbN, a new index. SMN. Internal report. Unpublished.
Núñez, Liliana. 2009. Overview of drought indices at Argentine national meteorological Service. Inter.-Regional Workshop on Indices and Early Warning Systems for Drought. Lincoln, Nebrasca. 8 al 11 de diciembre de 2009. Núñez L.N., G.P. Podestá. 2006: Precipitación anual, estacional y mensual vs períodos móviles. XI Reunión Argentina de Agrometeorología: La Agrometeorología y el desarrollo local., La Plata. Argentina. 169-170.

SMN
5) McKee, T. B., N. J. Doesken, and J. Kleist, 1993. The relationship of drought frequency and duration to time scales. Preprints, 8th Conference on Applied
Climatology, 17-22 January, Anaheim, CA, pp. 179-184.
6) Keyantash, J and Dracup, J.A. 2002. The quantification of drought: an evaluation of drought indices. AMS.
7) Gibbs, W. J. and J. V. Maher, 1967. Rainfall deciles as drought indicators. Bureau of Meteorology Bulletin, No. 48, Commonwealth of Australia, Melbourne.
8) Wilhite, D.A., 2005. The Role of disaster preparedness in national planning with specific reference to droughts. Natural isasters and extreme events in agriculture. Impacts and Mitigation. Chapter 2. Springer. 2005.

Thanks !!!
Liliana Núñez
Agrometeorology Department
National Meteorological Service
Argentine

SERVICIO METEOROLÓGICO NACIONALSERVICIO METEOROLÓGICO NACIONALSERVICIO METEOROLÓGICO NACIONAL
www.smn.gov.arwww.smn.gov.arwww.smn.gov.ar