Services presentation, minerals
41
© Terra Energy & Resource Technologies, Inc Terra Services Presentation - Minerals STeP and NAGS September, 2013 Terra Energy & Resource Technologies, Inc. Natural Resources – Step by STeP®
-
Upload
george-barber -
Category
Services
-
view
64 -
download
0
Transcript of Services presentation, minerals
© Terra Energy & Resource Technologies, Inc
Terra Services Presentation - Minerals STeP and NAGS
September, 2013
Terra Energy & Resource Technologies, Inc.
Natural Resources – Step by STeP®

© Terra Energy & Resource Technologies, Inc 2
Terra Background
Breakthrough Technologies
Terra Energy & Resource Technologies, Inc. [PINK:TEGR] formed - 2005
Three (3) innovative exploration service offerings which feature multiple proprietary technologies with superior predictive capabilities and easy data acquisition.
Finds mineral anomalies and depth in early exploration stages.
Geological/Geoscience basis supported by sophisticated algorithms and interpretation by skilled, experienced geoscience professionals.
Each tested/refined in hundreds of applications over the past 30 years (originally academic/military/government sponsored and then later many commercial apps).
Company Ideology: Integrate multiple, independent methods/data sets
and reduce time, costs & risk. January 14

January 14 © Terra Energy & Resource Technologies, Inc 3
Terra Statistics
Minerals
Predicted Presence:
Confirmed by Drilling/
Excavating
Predicted Absence:
Confirmed by Drilling/
Excavating
Predicted Structure:
Agrees with Seismic but Not
Drilled Yet
Confirmation of Terra Analysis is
Pending
Delivered Results: Drilled
& FailedTotals
Success Rate on Drilled or
Excavated Prospects (Pending Projects
Excluded)
Success Rate on Drilled or Excavated Prospects (Assumes Pending
projects Failed 100%)
Oil and Gas 44 13 4 25 2 88 97% 68%Gold 4 0 0 1 0 5 100% 80%
Gems 13 0 2 0 2 17 87% 87%Industrial
Metals0 0 0 4 0 4 N/A 0%
Water/other 1 0 0 0 0 1 100% 100%All Types 62 13 6 30 4 115 95% 69%
4. Terra has good results in metals, gems and others but these success rates should be discounted because there is not yet a statistically credible sample-set of projects.
3. There are enough projects done in oil and gas to provide meaningful representation of Terra's Capabilities.
1. Historically, not for lack of potential efficacy, more work has been done in the oil and gas sector than in minerals and gems.Notes:
2. Success rates in last the two columns are based on projects which have been drilled or excavated (1st two columns); while Terra's technologies were a part of the overall work program for these projects, and commercial success owes to many factors, inputs and exploration team members, Terra's early stage predictions were confirmed by drilling or excavation. In far right column, statistics assume all pending projects will be failures, a conservative though unlikely assumption with these results being unknown presently.

January 14 © Terra Energy & Resource Technologies, Inc 4
Service Offerings
STeP®- Sub-Terrain Prospecting (Multiple Components) Remote sensing technology (Two Service Offerings) 1. STeP Express Analysis 2. Full STeP Analysis
Naturally Adsorbed Gas Survey (NAGS) 3. NAGS Survey (Service Offering) - Geochemical study of ADS gases which accurately find mineral anomalies

Terra Technologies
STeP®- Sub-Terrain Prospecting Innovative Remote Sensing - Detects Mineral anomalies, Structures & Depth Surface pattern recognition from multi-spectral satellite images, digital
elevation maps, topographical maps and public domain geological information, other information and, if available, information provided by client (geological / geophysical / geochemical / rock samples / cores, etc.)
STeP Express Analysis – 2D modeling / large area / general prospectivity
Full Step Analysis – Subsurface modeling, cross-sections, structure, targets ranking, depth, detect mineral presence and optimal drilling/excavation locations
Naturally Adsorbed Gas Survey Geochemical study of adsorbed gases – Direct detection of Minerals Adsorbed gas anomalies indicate mineralized deposits in subsurface Contour delineation and great confirmation of STeP Results
January 14 © Terra Energy & Resource Technologies, Inc 5

January 14 © Terra Energy & Resource Technologies, Inc 6
Application (Regional and local study): High-grade large, under-explored areas cost-effectively and remotely Evaluate license / lease acquisition, farm-in/ or JV decision-making Evaluate blocks when other methods are time and cost prohibitive Explore environmentally sensitive and/or inaccessible areas without limitation Value Proposition: Predict prospectivity remotely, non-invasively & cost-effectively Results Delivered: Prospective structures and anomalies contours map (-s) in 2D. Scale: 1:300,000 up to 1:100,000, depending on the territory size Customer’s Benefits: Better understand geology of any size area, quickly, remotely cost-effectively Reduce risk and wasteful spending and focus spending on high-potential areas Plan license retention and discard with solid early-stage understanding Dramatic savings in time (70%+) and money (50%+)
STeP Express Analysis

January 14 © Terra Energy & Resource Technologies, Inc 7
Application (Detailed study of target areas of interest): Delineate & model high-potential targets Rank / select prospect & depth Handle complex and puzzling geology Value Proposition: Large-scale mapping of priority targets “Virtual-3D” modeling of subsurface faults, folds, structure delineation, anomalies and depth Ranking of anomalies and structures Results Delivered: Structures contours map (-s), scale up to 1:5,000 Cross section(s) through the structure where applicable Target depth(s) and/or changes of major formations Structure contours, depth, mineral volume estimates & mineral assessment Customer’s Benefits: Drill or excavation-ready deposit model, complements and improves the operator’s model Investment quality report on the deposit value Direct mineral detection Dramatic savings in time (70%+) and money (50%+)
Full STeP Analysis

January 14 © Terra Energy & Resource Technologies, Inc 8
STeP® - A Suite of Independent Remote Methods
Geodynamic analysis Geomorphological studies Conventional remote sensing Paleo-reconstruction Morphometry Structuremetric analysis Geoinformatics - artificial neural nets Proprietary spectrometric analysis
Sophisticated data mining techniques
and algorithms Neural nets Pattern recognition and fuzzy logic Fourier analysis
January 14 © Terra Energy & Resource Technologies Inc 8

January 14 © Terra Energy & Resource Technologies, Inc 9
Geodynamic Analysis
Earth’s Mineragenic Systems are Confined to Specific, Calculable Zones
Is a geotectonic / mathematical model verified through decades of field testing and application.
Based on regularities in the divisibility of the Earth’s lithosphere from which a geometrical framework can be constructed of the subsurface.
Stems from Mantle Plume Theory, and is based on the priority ranking of “geodynamic systems” formed as a result of concentric discharge of deep energy and fluid fluxes coming from the Earth’s crust to the upper horizons.
Surface structures (circular, polyhedral, other) are identified from satellite images and model is “fit onto” area aligning with such features & known deposits
Applicable anywhere in the world as “overlay” aligned to surface features.
Most of the known mineral deposits of deep genesis are confined to nodes of intersections of concentric fluid-supply zones with radii, characterized by a universal discreetness ranging from just a few kms to thousands.
Surface features (large zooming to small) lead to area’s “mineral kitchen”.

© Terra Energy & Resource Technologies, Inc 10
Geodynamic Analysis Results
1 2
3
4
5
Continental Scale
Regional Scale
Sub-regional Scale
Local Scale
January 14

Morphometric Analysis
Terra’s Morphometric Method Connects Relief-Forming Processes with Tectonics – a Virtual Paleo Geography that IDs anticlines
Known “old-school” tool not used widely today and often overlooked with its value underestimated for resource exploration.
Terra has developed Morphometry to be relevant in the modern era using high-powered, computerized inputs and outputs.
It translates all surface relief into ranked systems which have a relational connection to tectonic events and subsurface structure
Uses Digital Elevation data to derive paleo features Builds erosion-based, summit and catchment basin maps Enables the chronological stacking of paleo horizons and tracks
tectonic movements (know if the target horizon is with HC window)
Provides quick, cost-effective and reliable model of subsurface
January 14 © Terra Energy & Resource Technologies, Inc 11
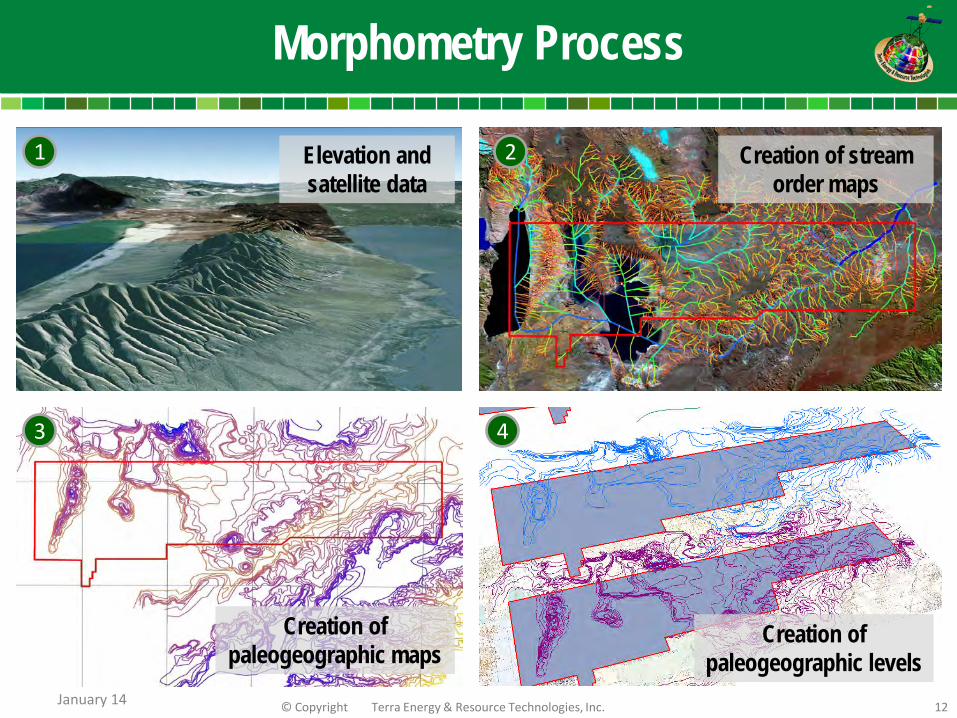
Morphometry Process
1 2
3
12 © Copyright Terra Energy & Resource Technologies, Inc.
4
Elevation and satellite data
Creation of stream order maps
Creation of paleogeographic maps
Creation of paleogeographic levels
January 14

Paleo-reconstruction Analysis
Understanding Subsurface Via Geomedium Movement Analysis
Earth’s geomedium is subject to tectonic & exogenous (paleo erosion /denudation) events resulting in what we call relief plasticity.
2nd-Derivative-based model connects the zero-curvature points (intersection of topo convex & concave) of a topo / paleo geographic map via an algorithm to create a 2D map of geomedium flows
Paleo flow maps help distinguish hidden paleo geological features of different geological periods / depths
Amoeba-like patterns show the nature of movements and help see important features (deltas / depressions / faults) in movement
Informs on deposition areas prospective for mineral accumulation
January 14 © Terra Energy & Resource Technologies, Inc 13

© Terra Energy & Resource Technologies, Inc 14
Paleo-reconstruction Analysis + MAPS
Reconstructed Paleo Relief
+ MODELS
January 14

Paleo-reconstruction – Procedure
15 © Copyright Terra Energy & Resource Technologies, Inc.
1 2
3 4
Regional relief plasticity Paleo-flows of the license block
Circular structures and accumulations Most probable accumulation areas
Cambodia Rubies and Gold January 14

© Terra Energy & Resource Technologies, Inc 16
Paleo-reconstruction Results
Jordan uranium and gold
January 14

© Terra Energy & Resource Technologies, Inc 17
Paleo-reconstruction – Project
January 14
Arizona Placer gold

Geoinformatics – Artificial Neural Nets
Mathematical “classification” of any area into prospective and non-prospective zones Creation of “training sets” based on known geological, geophysical and spectral data to identify mineral prospectivity Terra developed consistent & universal criteria used to train neural nets for any new area Non-prospective
Prospective Known mineral accumulations
January 14 © Terra Energy & Resource Technologies, Inc 18
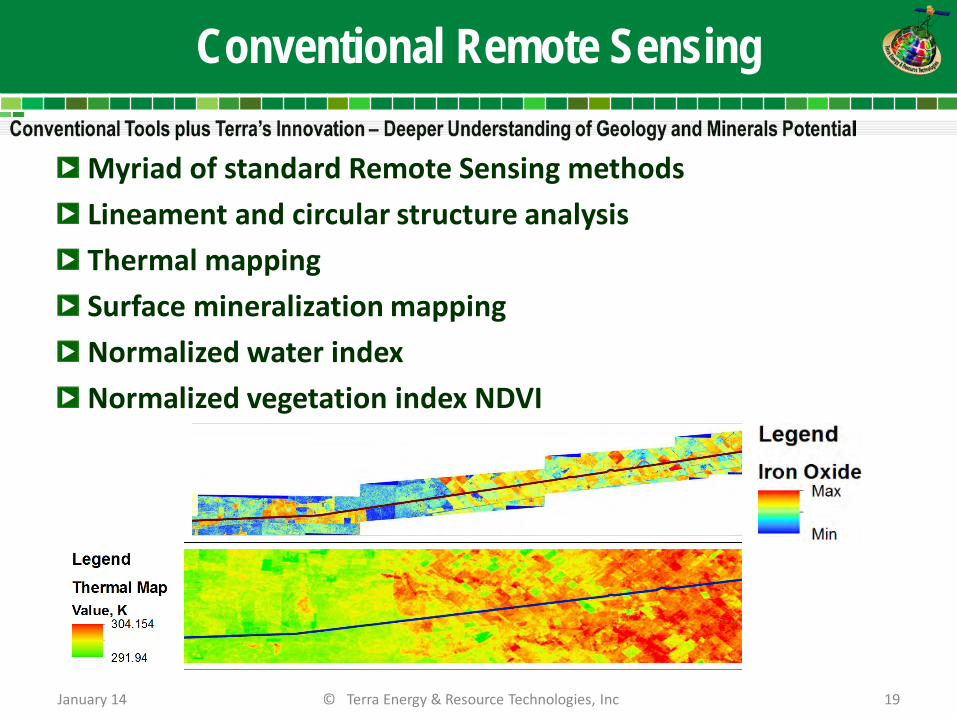
Conventional Remote Sensing
Myriad of standard Remote Sensing methods Lineament and circular structure analysis Thermal mapping Surface mineralization mapping Normalized water index Normalized vegetation index NDVI
January 14 © Terra Energy & Resource Technologies, Inc 19

Structuremetric Analysis
Stress Fields in Sat Images Infer Mineral Body Boundaries & Depth
Stress occurs at contact of distinct, subsurface bodies interacting with each other due to normal mechanical and tectonic forces
Such stress appears in satellite images as a stress fields and vectors The method interprets all the stress manifest on the surface and
separates the sought-after paleo stress that is associated with geological bodies of interest
Locates HC-saturated or mineralized bodies Reveals subsurface structural components and faults
A cornerstone STeP method to indicate prospective areas and depth
January 14 © Terra Energy & Resource Technologies, Inc 20

Structuremetric Analysis
Deformation caused by target and host environment
Surface Projection
January 14 © Terra Energy & Resource Technologies, Inc 21

January 14 © Terra Energy & Resource Technologies, Inc 22
STeP® Structuremetric Analysis Results
Structuremetric analysis was performed as part of STeP in an analysis of alluvial gold deposits
Zones of
mineralization were delineated

January 14 © Terra Energy & Resource Technologies, Inc 23
STeP® Structuremetric Analysis Case Study
Structuremetric analysis was performed as part of STeP in an analysis of lode & alluvial gold and alluvial ruby deposits associated with an eroded paleo volcano and a paleo river bed
Zones of mineralization were
delineated
Excellent mineralization confirmed and project is in development

January 14 © Terra Energy & Resource Technologies, Inc 24
STeP® Structuremetric Analysis Results
Gold and Rubies Cambodia
Delineation of prospective areas

January 14 © Terra Energy & Resource Technologies, Inc 25
STeP® Case Study Cambodia Gold & Rubies
Gold flake samples found at Terra indicated GPS points in Cambodian project
All GPS points
recommended by Terra proved prospective after customer excavated with his geologist

January 14 © Terra Energy & Resource Technologies, Inc 26
STeP® Case Study Cambodia Gold & Rubies
Ruby samples
found at GPS points indicated by Terra in Cambodian project
All GPS points
recommended by Terra proved prospective after excavation by customer’s geologist

2012 © Terra Energy & Resource Technologies, Inc 27
Structuremetric Analysis Results Chile
Copper

Proprietary Spectrometric Analysis
Identifies the Presence/Depth of Minerals in the Subsurface
Received “State Award” highest scientific recognition in Russia
Finds circular structures (diameters - meters to KMs) manifest on surface in multi-spectral satellite images
Subsurface bodies absorb/re-emit the Earth core’s energy
This energy manifests in circular patterns on the surface detectable via images using a binary processing algorithm
Sophisticated algorithm filters the “noise” to identify the specific patterns of circular structures & calculates depth based on a 720 rule
Estimate Resource Type, Depth and Volume with Accuracy
January 14 © Terra Energy & Resource Technologies, Inc 28

2012 © Terra Energy & Resource Technologies, Inc 29
Spectrometric Analysis
Spectral Data
Computer Libraries Spectral Criteria
K Spectral Characteristic = K Circular Pattern Identified
Spectral Characteristic = K Circular Pattern Identified

2012 © Terra Energy & Resource Technologies, Inc 30
Spectrometry - Results
Cambodia Rubies and Gold

2012 © Terra Energy & Resource Technologies, Inc 31
Spectrometry - Results Chile
copper

2012 © Terra Energy & Resource Technologies, Inc 32
Spectrometry - Results
Chile Gold

NAGS is a powerful unconventional geochemical method based on adsorbed gas anomalies which is highly accurate in direct detection of minerals Value Proposition: Delineate and map prospects Determine & localize structural & non-structural traps Assess mineral presence, anomalies and structures Results Delivered: Structure(s) contour map(s), scale to 1:5,000 Maps and graphs of various gases values, ratios and other parameters Table outlining parameters in collected sample points Report with results, interpretation and conclusions on mineral presence Structure contours Client’s Benefits: Directly determine/detect HC/mineral presence Save substantial time (5-7 times) and money (5-10 times) Reduce footprint / risk in environmentally sensitive areas (simple sample collection)
Naturally Adsorbed Gas Survey (NAGS)
January 14 © Terra Energy & Resource Technologies, Inc 33

Naturally Adsorbed Gas Survey
B B B B B
B B B
B +/- X X
B +/- X
Mineral Signature = B +/- X
Background Gases = B
Study of the GAS FIELD/FLUX of the Earth ….and of how deposits influence the Gas Flux/Gas Field of Earth
January 14 © Terra Energy & Resource Technologies, Inc 34
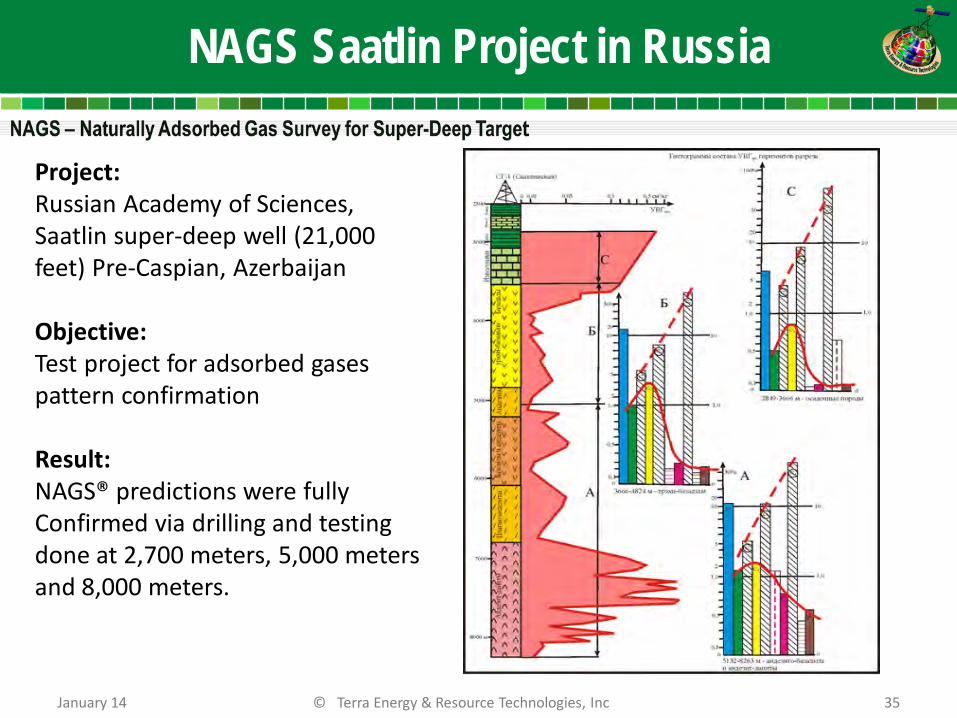
NAGS Saatlin Project in Russia
Project: Russian Academy of Sciences, Saatlin super-deep well (21,000 feet) Pre-Caspian, Azerbaijan Objective: Test project for adsorbed gases pattern confirmation Result: NAGS® predictions were fully Confirmed via drilling and testing done at 2,700 meters, 5,000 meters and 8,000 meters.
January 14 © Terra Energy & Resource Technologies, Inc 35
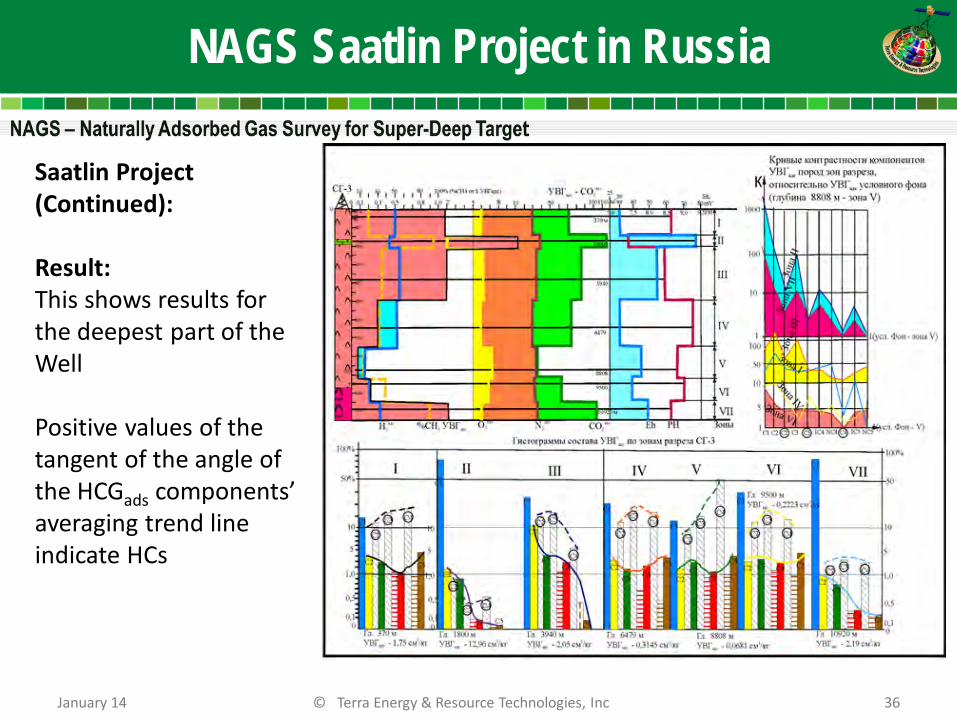
NAGS Saatlin Project in Russia
January 14 © Terra Energy & Resource Technologies, Inc 36
Saatlin Project (Continued): Result: This shows results for the deepest part of the Well Positive values of the tangent of the angle of the HCGads components’ averaging trend line indicate HCs

2012 © Terra Energy & Resource Technologies, Inc 37
NAGS Results
Parameters analyzed: CH4; C2H6; C2H4; C3H8; C3H6; iC4H10; nC4H10; C4H8; iC5H12; nC5H12; Σ HC heavy; HC total; CO2; H2; O2; N2; Σ non HC; Н2/HC; N2/O2; CO2/N2; рН; Eh.
Bes-Tube Au-deposit Legend
Concentration of HCads (n.10-4 cm3/kg)
Background Anomaly
Mineralization outline
Faults
AGS sampling points
Kazakhstan Gold

2012 © Terra Energy & Resource Technologies, Inc 38
NAGS Results
Russia Uranium

2012 © Terra Energy & Resource Technologies, Inc 39
NAGS Project in Niger
Niger Uranium NAGS project
Seven prospective areas were identified based on anomalous values of CO2, H2, Σт.у., CH4, Eh and pH
29 30 31 32 33 34
35363738394041
42 43 44 45
46474849505152
53 54 55 56 57 58
1 ARA5
10 ATA311 ATA3
12 ATA3
13 ATA4
14 ARA3
15 ARA4
16 ARA5
17 ARA5 18 ARA5 19 ARA5
2 ARA5
20 ARA421 ARA422 ARA4
23 ARA324 ARA325 ARA3
26 ATA427 ATA428 ATA4
3 ARA5
4 ARA5
5 ARA4
6 ARA3
7 ATA4
8 ATA3
9 ATA3
A ARA5 B ARA5
C ARA3 (B ATA4)
C ARA4 (B ARA3)
C ARA5 (B ARA4)
C ATA3
C ATA4 (B ATA3)
D ARA3 (A ATA4)
D ARA4 (A ARA3)
D ARA5 (A ARA4)
D ATA3
D ATA4 (A ATA3)
Eh
47.5 57.6 39.1 39.6 32.7 31.1
66.240.366.561.466.568.273.7
66.8 47.4 32.8 39.4
39.749.443.531.339.547.740.5
57.8 57.6 49.3 59.5 40.4 43.6
64.7
43.561.2
59.6
64.4
59.8
32.9
51.4
41.3 51.2 56.8
56.2
68.440.556.0
51.443.749.9
51.243.389.6
51.3
39.3
39.5
40.7
61.6
47.8
30.8 43.6
61.7
68.1
31.4
49.8
43.5
56.4
40.8
49.5
61.8
51.4
III
III
VII
VI
V
IV
29 30 31 32 33 34
35363738394041
42 43 44 45
46474849505152
53 54 55 56 57 58
1 ARA5
10 ATA311 ATA3
12 ATA3
13 ATA4
14 ARA3
15 ARA4
16 ARA5
17 ARA5 18 ARA5 19 ARA5
2 ARA5
20 ARA421 ARA422 ARA4
23 ARA324 ARA325 ARA3
26 ATA427 ATA428 ATA4
3 ARA5
4 ARA5
5 ARA4
6 ARA3
7 ATA4
8 ATA3
9 ATA3
A ARA5 B ARA5
C ARA3 (B ATA4)
C ARA4 (B ARA3)
C ARA5 (B ARA4)
C ATA3
C ATA4 (B ATA3)
D ARA3 (A ATA4)
D ARA4 (A ARA3)
D ARA5 (A ARA4)
D ATA3
D ATA4 (A ATA3)
рН
8.9 8.5 9.3 9.3 9.4 9.5
8.19.28.18.38.18.07.8
8.1 8.9 9.4 9.3
9.38.89.09.59.38.99.2
8.5 8.5 8.8 8.4 9.2 9.0
8.2
9.08.3
8.4
8.2
8.4
9.4
8.7
9.1 8.7 8.6
8.6
8.09.28.6
8.79.08.8
8.79.07.3
8.7
9.3
9.3
9.2
8.3
8.9
9.6 9.0
8.3
8.0
9.5
8.8
9.0
8.8
9.2
8.8
8.3
8.7
III
III
VI
V
IV
VII
29 30 31 32 33 34
35363738394041
42 43 44 45
46474849505152
53 54 55 56 57 58
1 ARA5
10 ATA311 ATA3
12 ATA3
13 ATA4
14 ARA3
15 ARA4
16 ARA5
17 ARA5 18 ARA5 19 ARA5
2 ARA5
20 ARA421 ARA422 ARA4
23 ARA324 ARA325 ARA3
26 ATA427 ATA428 ATA4
3 ARA5
4 ARA5
5 ARA4
6 ARA3
7 ATA4
8 ATA3
9 ATA3
A ARA5 B ARA5
C ARA3 (B ATA4)
C ARA4 (B ARA3)
C ARA5 (B ARA4)
C ATA3
C ATA4 (B ATA3)
D ARA3 (A ATA4)
D ARA4 (A ARA3)
D ARA5 (A ARA4)
D ATA3
D ATA4 (A ATA3)
СО2
12.3 12.3 18.4 23.0 20.0 24.6
23.012.343.047.627.623.018.4
23.0 27.6 27.6 38.4
30.730.723.015.427.623.027.6
23.0 18.4 23.0 24.6 27.6 27.6
12.3
20.023.0
20.0
23.0
23.0
30.7
15.4
18.4 23.0 27.6
12.3
46.132.323.0
20.023.015.4
23.032.323.0
18.4
33.8
23.0
18.4
23.0
18.4
15.4 18.4
12.3
26.1
15.4
20.0
15.4
15.4
23.0
23.0
18.4
20.0
I II
VII
V
IV
VI29 30 31 32 33 34
35363738394041
42 43 44 45
46474849505152
53 54 55 56 57 58
1 ARA5
10 ATA311 ATA3
12 ATA3
13 ATA4
14 ARA3
15 ARA4
16 ARA5
17 ARA5 18 ARA5 19 ARA5
2 ARA5
20 ARA421 ARA422 ARA4
23 ARA324 ARA325 ARA3
26 ATA427 ATA428 ATA4
3 ARA5
4 ARA5
5 ARA4
6 ARA3
7 ATA4
8 ATA3
9 ATA3
A ARA5 B ARA5
C ARA3 (B ATA4)
C ARA4 (B ARA3)
C ARA5 (B ARA4)
C ATA3
C ATA4 (B ATA3)
D ARA3 (A ATA4)
D ARA4 (A ARA3)
D ARA5 (A ARA4)
D ATA3
D ATA4 (A ATA3)
S т.у.
264 157 965 1055 562 600
5113274612918336681385
222 645 568 613
1232676399346284597753
311 570 567 766 806 569
1088
520539
530
555
539
931
1247
568 922 450
430
500454491
569703602
7341318738
456
987
589
445
818
665
540 359
748
576
422
440
368
622
412
683
534
224
I
II
III
VII
VI
V
IV

2012 © Terra Energy & Resource Technologies, Inc 40
NAGS Chile Copper Project
Chile Copper mentioned before; NAGS results confirmed STeP

2012 © Terra Energy & Resource Technologies, Inc 41
Thank you!
For more information contact: James Reardon [email protected] Direct: +1-203-202-7537 Skype: jmrrfg www.terrainsight.com
Put Terra’s Tools to Work for You