Service Region Design for Urban Electric Vehicle Sharing...
49
Service Region Design for Urban Electric Vehicle Sharing Systems Long He NUS Business School, National University of Singapore, Singapore, [email protected] Ho-Yin Mak Sa¨ ıd Business School, University of Oxford, United Kingdom, [email protected] Ying Rong Antai College of Economics and Management, Shanghai Jiao Tong University, Shanghai, China, [email protected] Zuo-Jun Max Shen Department of Industrial Engineering and Operations Research and Department of Civil and Environmental Engineering, University of California, Berkeley CA, USA, [email protected] Emerging collaborative consumption business models have shown promise in terms of both generating busi- ness opportunities and enhancing the efficient use of resources. In the transportation domain, car sharing models are being adopted on a mass scale in major metropolitan areas worldwide. This mode of servicized mobility bridges the resource efficiency of public transit and the flexibility of personal transportation. Beyond the significant potential to reduce car ownership, car sharing shows promise in supporting the adoption of fuel- efficient vehicles, such as electric vehicles (EVs), due to these vehicles special cost structure with high purchase but low operating costs. Recently, key players in the car sharing business, such as Autolib, Car2Go and DriveNow, have begun to employ EVs in an operations model that accommodates one-way trips. On the one hand (and particularly in free-floating car sharing), the one-way model results in significant improvements in coverage of travel needs and therefore in adoption potential compared with the conventional round-trip-only model (advocated by ZipCar, for example). On the other hand, this model poses tremendous planning and operational challenges. In this work, we study the planning problem faced by service providers in designing a geographical service region in which to operate the service. This decision entails trade-offs between maximizing customer catchment by covering travel needs and controlling fleet operations costs. We develop a mathematical programming model that incorporates details of both customer adoption behav- ior and fleet management (including EV repositioning and charging) under imbalanced travel patterns. To address inherent planning uncertainty with regard to adoption patterns, we employ a distributionally robust optimization framework that informs robust decisions to overcome possible ambiguity (or lacking) of data. Mathematically, the problem can be approximated by a mixed integer second-order cone program, which is computationally tractable with practical scale data. Applying this approach to the case of Car2Go’s service with real operations data, we address a number of planning questions and suggest that there is potential for the future development of this service. Key words : sustainable operations; car sharing; electric vehicles; robust optimization ; facility location History : This paper is accepted for publication in Manufacturing & Service Operations Management in October 2016. 1
Transcript of Service Region Design for Urban Electric Vehicle Sharing...

Service Region Design for Urban Electric VehicleSharing Systems
Long HeNUS Business School, National University of Singapore, Singapore, [email protected]
Ho-Yin MakSaıd Business School, University of Oxford, United Kingdom, [email protected]
Ying RongAntai College of Economics and Management, Shanghai Jiao Tong University, Shanghai, China, [email protected]
Zuo-Jun Max ShenDepartment of Industrial Engineering and Operations Research and Department of Civil and Environmental Engineering,
University of California, Berkeley CA, USA, [email protected]
Emerging collaborative consumption business models have shown promise in terms of both generating busi-
ness opportunities and enhancing the efficient use of resources. In the transportation domain, car sharing
models are being adopted on a mass scale in major metropolitan areas worldwide. This mode of servicized
mobility bridges the resource efficiency of public transit and the flexibility of personal transportation. Beyond
the significant potential to reduce car ownership, car sharing shows promise in supporting the adoption
of fuel- efficient vehicles, such as electric vehicles (EVs), due to these vehicles special cost structure with
high purchase but low operating costs. Recently, key players in the car sharing business, such as Autolib,
Car2Go and DriveNow, have begun to employ EVs in an operations model that accommodates one-way
trips. On the one hand (and particularly in free-floating car sharing), the one-way model results in significant
improvements in coverage of travel needs and therefore in adoption potential compared with the conventional
round-trip-only model (advocated by ZipCar, for example). On the other hand, this model poses tremendous
planning and operational challenges. In this work, we study the planning problem faced by service providers
in designing a geographical service region in which to operate the service. This decision entails trade-offs
between maximizing customer catchment by covering travel needs and controlling fleet operations costs. We
develop a mathematical programming model that incorporates details of both customer adoption behav-
ior and fleet management (including EV repositioning and charging) under imbalanced travel patterns. To
address inherent planning uncertainty with regard to adoption patterns, we employ a distributionally robust
optimization framework that informs robust decisions to overcome possible ambiguity (or lacking) of data.
Mathematically, the problem can be approximated by a mixed integer second-order cone program, which is
computationally tractable with practical scale data. Applying this approach to the case of Car2Go’s service
with real operations data, we address a number of planning questions and suggest that there is potential for
the future development of this service.
Key words : sustainable operations; car sharing; electric vehicles; robust optimization ; facility location
History : This paper is accepted for publication in Manufacturing & Service Operations Management in
October 2016.
1

2 Author: Service Region Design for Urban EV Sharing Systems
1. Introduction
The emerging sharing economy enables novel business models that aim to improve resource
utilization. From houses (Airbnb), to cars (ZipCar, Uber), to manpower for small tasks
(TaskRabbit) and even dog kennels (DogVacay), innovative business models allow users to
access and share resources without owning them. It is currently estimated that the sharing
economy market is worth $26 billion (The Economist 2013). Passenger cars make a prime
candidate for sharing business models because of their low utilization rates (idle 92% of the
time, on average (Atcheson and Green 2012)), high fixed costs to own ($6,500 per year, on
average) and relatively low variable costs to operate. Worldwide, the number of car sharing
users is forecast to grow from 2.3 million in 2013 to 12 million in 2020 (Reuters 2013). The
largest car sharing firms, Car2Go and ZipCar, operate in multiple cities with total fleet
sizes of over 10,000 each. The potential for improving efficiency is clear from reduced car
ownership - households are found to own 0.23 fewer cars, on average, after adopting car
sharing (ACCESS 2011).
Car sharing has also been proposed as a viable solution to sustainable transportation
development, a topic drawing increasing attention in recent years as public awareness of
environmental issues has grown. In 2012, the transportation sector accounted for 28% of
total U.S. greenhouse gas (GHG) emissions (U.S. Environmental Protection Agency 2014).
Moreover, approximately 70% of U.S. oil consumption can be attributed to transportation
activities (Center for Climate and Energy Solutions 2014). Adoption of car models with
better fuel economy is a key factor in curbing GHG emissions. Car sharing fleets are
found to be more fuel efficient by 10 miles per gallon, on average, than vehicles owned
by households (ACCESS 2011). Because fuel-efficient cars are typically more expensive to
purchase and cheaper to operate (due to lower fuel costs), they are natural candidates for
car sharing operations.
To improve fuel economy, innovative alternative fuel vehicles, including electric vehicles
(EVs), have been commercialized by auto manufacturers as alternatives to conventional
internal combustion engine (ICE) vehicles. EVs have no tailpipe emissions, and they offer
significant improvements on well-to-wheel energy efficiency and emissions levels over their
ICE counterparts, when powered by efficient and more diverse sources of electricity (e.g.,
solar and wind power). The diversity of power sources also makes EVs less sensitive to fossil
fuel depletion and to supply uncertainty of crude oil. From the consumer’s perspective,

Author: Service Region Design for Urban EV Sharing Systems 3
EVs boast low operational costs: the fuel cost per mile for passenger EVs is approximately
4 cents in the U.S., compared with 12 cents for average ICE vehicles (U.S. Department
of Energy 2014b). Despite their potential, consumers are not ready to own EVs on a
massive scale due to several major hurdles, including their short driving ranges (coupled
with insufficient numbers and inadequate distribution of charging facilities), their high
upfront purchase cost and their potentially high depreciation rate due to rapid technology
development.
Notably, the combination of EVs with car sharing operations is emerging globally as a
viable alternative to EV ownership for urban dwellers. Car2Go, a subsidiary of Daimler
AG, operates a car sharing system with full EV fleets in San Diego (U.S.), Amsterdam
(Netherlands) and Stuttgart (Germany). DriveNow (rebranded as ReachNow in the U.S.),
operated by BMW, serves Copenhagen with all EVs (DriveNow 2016) and provides mixed
fleets of EVs and ICEs in several cities, including Seattle (U.S.), London (U.K.), Berlin
and Munich (Germany) (ReachNow 2016). Autolib has deployed over 2,000 EVs in Paris
(France) through its EV sharing service (Autolib 2016). This innovative operations model
can potentially help overcome the major barriers to EV adoption for a number of reasons.
First, concerns about EVs range limitation in sharing systems are alleviated because they
operate almost exclusively in well-defined urban service areas. The concentration of a siz-
able fleet within a dense urban area also makes the development of a charging infrastructure
more feasible. Second, car sharing effectively allows a pool of users to amortize the high
fixed costs of purchasing EVs (and maintaining them) into usage-based variable costs over
their collective consumption of the service. By pooling consumers driving needs, having
EVs in sharing fleets results in higher utilization, and average costs can thus be reduced
compared with the case of individual ownership. As a consequence of higher utilization,
the environmental benefits yielded by each EV also increases over the case of individual
ownership. Third, by retaining ownership, the firm effectively eases consumers’ concerns
about technological risks, future resale values, and maintenance.
In addition to introducing EVs to car sharing, Autolib, Car2Go and DriveNow differ
from early station-based car sharing systems, such as Zipcar, by allowing both round
trips and one-way trips in their free-floating car sharing systems. Specifically, Car2Go
and DriveNow allow customers to check out and return cars anywhere within the service
region at any street parking space, whereas Autolib allows customers to check out from

4 Author: Service Region Design for Urban EV Sharing Systems
and return to designated parking spots. This flexibility allows customers to use the service
for regular trips with long stopover times (e.g., commuting to office or school), which
are typically not economically feasible under round-trip only services. Figure 1 shows the
frequencies of trips classified by origin-destination distances, obtained from Car2Go’s one-
month operational data in San Diego. The destination is defined as the location at which a
rental trip is ended. We observe that in the majority of trips, origin-destination distances
extend beyond walking distance (e.g., ≥ 2km) and a substantial proportion may not be
served when round-trips are required (e.g., in ZipCar’s system).
Figure 1 Histogram of the Origin-Destination Distances (in meters) of One-month Car2Go Trips
Although allowing one-way trips opens up a broader potential customer base, it makes
fleet operations more difficult. Thus, a key strategic planning task in free-floating car
sharing systems is to determine the service region. On the one hand, expanding geograph-
ical coverage entails significant operational challenges, such as the repositioning of cars to
ensure availability under imbalanced demand and scheduling for recharging in the case of
EVs. On the other hand, customer adoption is ultimately dependent on service coverage,
as travel needs can only be covered when both the trip origin and destination are within
the service region. Hence, coverage of a more extensive service region encourages adoption
and improves potential revenue.
In this paper, we address the strategic planning problem of service region design for
one-way EV sharing systems, which entails several challenges. First, the travel pattern
and adoption behavior of potential customers are highly uncertain at the planning stage.

Author: Service Region Design for Urban EV Sharing Systems 5
Moreover, before entering a new city or considering a major service expansion, the firm may
not possess accurate data to describe the uncertainty in terms of probability distributions,
which exacerbates the planning challenge. Because strategic commitments (such as the
acquisition of land for stations and charging outlets) are often made in conjunction with
service region design, a robust planning methodology is imperative. Second, the operational
details of EV sharing, such as repositioning and recharging of EVs, depend on both the
size and shape of the service region. Hence, the firm must also conscientiously account for
operational cost drivers when determining the service region when only limited data are
available. In this paper, we model the service region design problem by taking these factors
into account. Our contributions can be summarized as follows.
• We formulate an integrated service region planning model that considers customers’
satisficing behavior in service adoption together with various operational characteristics
of a one-way EV sharing system. Our approach deliberately addresses data uncertainty
and ambiguity with regard to customers’ travel patterns. Using a distributionally robust
optimization framework, our model can be approximated by a computationally efficient
mixed integer second-order cone program (MISOCP).
• Using real operations data from Car2Go, data regarding travel characteristics from
the California Household Travel Survey and EV charging station deployment data from
the U.S. Department of Energy, we perform a case study of Car2Go’s service region design
in San Diego. We address several planning questions, and we make the following findings.
1. EV sharing systems deliver more environmental benefits, such as savings in CO2
emissions, than replacing individually owned gasoline cars with EVs.
2. While faster charging technologies help enhance profit and service coverage by improv-
ing fleet utilization, the benefits diminish as charging speed improves. Thus, it is sufficient
for the car sharing system to deploy moderately fast, but not necessarily the fastest, charg-
ing equipment.
3. The optimal service region tends to be larger when customers’ valuation of the avail-
ability of cars is lower and when customers’ valuation of service coverage is higher.
The remainder of this paper is organized as follows. In Section 2, we review several
related streams in the literature. In Section 3, we first present our model, which considers
both the customer adoption and fleet operations aspects of the EV sharing system. Next,
in Section 4, we demonstrate the model using a case study with real data and discuss our
findings based on the computational results. Finally, we conclude the paper in Section 5.

6 Author: Service Region Design for Urban EV Sharing Systems
2. Literature Review
Our work contributes to the expanding research on sustainable operations management,
which covers a wide range of topics (Kleindorfer et al. 2005, Plambeck 2013). A stream in
the literature addresses sustainable operations related to EV business models. Lim et al.
(2015) evaluate business practices aiming at the goal of mass adoption by studying the
impact of range and resale anxieties. Similarly, Avci et al. (2014) highlight the key mecha-
nisms driving the adoption and use of EVs in a battery swapping system. In particular, the
build a behavioral model of motorist use and adoption; calibrating their model to real data,
they find that such a system may not always be beneficial to the environment. In addition
to the insights from their business model analysis, they also study infrastructure plan-
ning and charging coordination issues. Mak et al. (2013) develop distributionally robust
optimization models that assist in the planning process for deploying battery swapping
infrastructure for EVs. Moreover, a few papers in transportation optimize the operations
of charging station networks and coordinate recharging schemes by means of area pricing
or routing (Flath et al. 2013, Schneider et al. 2014). In the present study, we consider
EV charging operations together with customer adoption of the service instead of EV
ownership all in the context of an EV sharing system.
Although there are several major hurdles to achieving mass EV adoption, EV sharing
is an alternative for customers to enjoy the benefits of EVs without ownership. There are
several prevalent shared transport service models, such as peer-to-peer sharing (e.g., Turo),
ride sharing (e.g., Uber) and car sharing (e.g., Car2Go), in the emerging sharing economy.
A number of papers have studied various peer-to-peer platforms where customers decide
to buy or rent the products (Benjaafar et al. 2015, Fraiberger and Sundararajan 2015,
Jiang and Tian 2016). Recent developments of ride-sharing platforms have also motivated
research in the matching mechanism, wage and price of on-demand services (Banerjee et al.
2015, Cachon et al. 2015, Hu and Zhou 2016, Tang et al. 2016, Taylor 2016). In an EV shar-
ing system, the high fixed costs of EV ownership are transformed into a usage-based cost of
service. Researchers have used the term servicizing to describe a business model that offers
the functionality of the products instead of selling the product itself. Agrawal and Bellos
(2016) assess the potential of servicizing business models as an environmentally sustainable
strategy and draw insights into when and how servicizing is environmentally beneficial.
Related to this study, Bellos et al. (2015) determine an OEM’s optimal pricing strategy

Author: Service Region Design for Urban EV Sharing Systems 7
and the optimal fleet size when it offers car sharing in conjunction with conventional sales,
revealing the discrepancy between profitability and environmental sustainability. Because
the car-sharing system in their model allows for only round trips, they can focus on the
fleet operations of each station individually as a single server, whereas in our model, the
EV sharing system is designed to support one-way trips, and fleet repositioning is necessary
to accommodate imbalanced trip flows.
One-way vehicle sharing systems are also studied by both the operations management
and the transportation communities. Using high-frequency system-use data from a bicycle
sharing system, Kabra et al. (2015) measure the accessibility of stations and the availability
of bicycles. They then estimate the effects of accessibility and availability on ridership
through a novel transformation technique and reveal a potential opportunity for service
improvement in Paris using a calibrated counterfactual simulation. Several works from
the transportation domain investigate planning and vehicle relocation problems in one-
way station-based car-sharing systems, e.g., (Bruglieri et al. 2014, de Almeida Correia and
Antunes 2012, Nourinejad et al. 2015, Febbraro et al. 2012, Boyacı et al. 2015), and free-
floating car sharing systems, e.g., (Weikl and Bogenberger 2013). However, the main focus
of these models is on operations, such as the optimization of repositioning schedules under
known demand patterns (or scenarios). By contrast, we focus on the strategic decisions
of service region design and consider demand adoption uncertainty as well as the fleet
operations issues, including repositioning and time-varying demand patterns.
Shu et al. (2013) consider detailed bicycle sharing operations in a network context.
Whereas their work focuses on operational admission control, we consider strategic region
design with consumer adoption behavior. Shu et al. (2013) develop a network flow model
with proportionality constraints to characterize the flow of bicycles within the network
and the number of trips supported. Using transit data from the transit rail operator in
Singapore, they examine bicycles deployment, utilization, and (the value of) redistribution.
Due to bicycles short range, they restrict their consideration to trips within two transit
stops and assume that bicycles are immediately available for the next customers upon
arrival. However, in EV sharing systems, there is a risk that the arriving EVs will have
a low battery level and must be placed out for recharging. Moreover, our work models
the repositioning of the fleet as a stochastic process, whereas Shu et al. (2013) consider
a system that restores the bicycles distribution among all locations on a regular basis.
8 Author: Service Region Design for Urban EV Sharing Systems
Furthermore, their model assumes that the bicycle sharing station locations are given and
that the demands follow known Poisson processes. In our study, we aim to design a service
region under incomplete information regarding consumer adoption and travel behaviors.
Because service providers must determine the service region before the system is in opera-
tion and before customers sign up for membership, demand uncertainty is a major concern.
It is therefore critical to obtain a service region design that is robust with regard to various
adoption scenarios. The literature on robust optimization (Ben-Tal and Nemirovski 1998,
1999, Bertsimas and Sim 2003, 2004) has developed approaches to prescribe solutions that
are robust with respect to perturbations in model parameters. For problems in which some
limited distributional information (such as the means and covariances of key parameters)
may be available at the planning stage, it is possible to utilize the distributionally robust
optimization approaches discussed in El Ghaoui et al. (2003), Chen et al. (2007, 2010),
Goh and Sim (2010), Delage and Ye (2010) and Natarajan et al. (2011). An advantage of
this methodology is that it is often possible to preserve computational tractability using
conic programming formulations. A recent application in EV infrastructure planning can
be found in Mak et al. (2013). With some limited information, such as the moments of
demand parameters, they develop distributionally robust models for deployment with EV
battery swapping stations. Their formulations are tightly approximated by mixed integer
second-order cone programs (MISOCPs), which are readily solvable by commercial solvers.
Other recent applications include appointment scheduling in healthcare (Kong et al. 2013,
Mak et al. 2014), warehouse operations (Ang et al. 2012), supply chain management (Mak
and Shen 2014), inventory control (See and Sim 2010) and portfolio management (Natara-
jan et al. 2010).
3. The Model
We consider an urban EV sharing service provider (or the firm) that designs its service
region to serve a metropolitan area. A one-way free-floating car sharing service is typically
operated within a well-defined service region. An overview of the current service region
of Car2Go San Diego is shown in Figure 2. A feature that differentiates free-floating car
sharing systems from station-based systems is that one-way trips and free street parking
are allowed in the former. Customers can begin trips anywhere inside the service region
and can end trips wherever there are legal parking spaces (for detailed parking rules, please

Author: Service Region Design for Urban EV Sharing Systems 9
refer to (Car2Go 2016)). Moreover, customers can drive and make stopovers outside the
service region during reservations but are required to return the car to any point within
the service region by the end of a trip (Car2Go 2016).
Figure 2 Service Region of Car2Go San Diego as of February 2015 (Car2Go 2015)
Due to the free-floating nature of the service, a well-planned service region balances the
goals of encouraging customers to adopt the service and maintaining cost-effective fleet
operations. From the customers’ perspective, it is more favorable to adopt and use an EV
sharing service if the service region covers more of their preferred destinations. Neverthe-
less, a larger service region may result in more complex operations and higher operational
costs to the service provider, as a result. Hence, it is crucial to model the interrelation-
ships among customer adoption, fleet operations, and service region design. However, it is
difficult in practice to obtain accurate estimations of individual valuations on destination
coverage. In the model, we attempt to depict the aggregate customer adoption levels of
the EV sharing service, and we propose an optimization model that strategically supports
service region design under uncertainty of customer travel patterns and preferences.
We consider an urban area consisting of a set I of non-overlapping geographical locations
(e.g., districts). The firm designs its service region by selecting a subset of I to cover.
Mathematically, we define binary decision variables xi for each i ∈ I to indicate whether

10 Author: Service Region Design for Urban EV Sharing Systems
location j is covered in the service region (xi = 1) or not (xi = 0). Throughout this paper,
unless otherwise specified, we use boldface letters to denote matrices or vectors consisting
of scalar parameters or variables denoted by the same letter. Thus, x is the vector whose
components are xi for i∈ I. We also define the inner product 〈A,B〉= trace(BA) for two
matrices A and B.
We consider the following satisficing behavior of service adoption. Let aij represent the
utility that a customer who resides in location i potentially derives from being able to
travel from i to j, which depends on both the frequency of making these trips and the value
of such trips to the customer. Therefore, as long as the origin i is covered by the service,
the customer could enjoy a potential utility of∑
j∈I aijxj by adopting the service. Under
the satisficing behavior in service adoption (e.g., Simon 1957), the customer would adopt
the service when the total utility from the service coverage of the destinations exceeds his
or her aspirational level. Customers are categorized into K groups and the customers in
group k have the same aspirational level bk. Thus, given that the origin i is served, the
adoption decision of a customer in group k can be described by the following indicator
function:
1(∑j∈I
aijxj ≥ bk)
=
1, if∑
j∈I aijxj ≥ bk0, otherwise.
Let anij be the utility value associated with an i − j trip for a customer indexed by n.
Naturally, the utility values are heterogeneous among individual customers. From the plan-
ner’s perspective, one may view the values of anij as independent realizations drawn from a
probabilistic distribution p of a random variable aij. Therefore, we consider the adoption
rate at the aggregate level, defined as the probability of customer adoption. By taking
expectation over aij in the indicator function, the adoption rate qik is given by:
qik =E[1(∑j∈I
aijxj ≥ bk)]
= Prob(∑j∈I
aijxj ≥ bk).
The firm’s profit consists of membership revenue and operational profit. Each customer
who signs up for the service pays an annual membership fee f and is then charged per unit
time of usage. To serve region i ∈ I, the firm incurs a fixed cost, gi, which may include

Author: Service Region Design for Urban EV Sharing Systems 11
investments in charging infrastructure or payments to charging service providers and city
parking permit costs. Our model maximizes the expected total profit, which is defined
as total revenue less fixed and operational costs (including charging cost, repositioning
cost and fleet investment), as formulated in Equation (1) below. For notational brevity,
operational profit is represented by a function Θ(q,x) with service region x and realized
adoption rates q. We provide an explicit formulation for Θ(·) in Section 3.2. The service
region design problem is formulated as:
maxq,x
∑i∈I
∑k∈K
fQikqik−∑i∈I
gixi + Θ(q,x) (1)
s.t.
qik ≤Prob(∑j∈I
aijxj ≥ bk),∀i∈ I,∀k ∈K (2)
qik ≤ xi,∀i∈ I,∀k ∈K (3)
xi ∈ {0,1},∀i∈ I.
With adoption rates qik, the expected total membership fee revenue is given by∑i∈I∑
k∈K fQikqik, where Qik is the size of customer group k in region i. Constraint (2)
expresses the adoption rate as a probability constraint. Furthermore, constraint (3) stipu-
lates that no customers will adopt the service if their origins are not served. Appendix A
summarizes the notation used throughout the paper.
3.1. Adoption Rate Model
In this section, we focus on addressing the probability constraint (2). To evaluate the
exact adoption rate, the firm requires complete information on the joint distribution of a.
However, in practice, perfect information is often unavailable when the problem is to be
solved. Specifically, as the firm is in the planning stage in which only limited operations
data may be available (e.g., from pilot studies or surveys), it is often difficult to fit the
joint distribution of travel patterns with confidence. Furthermore, from the tractability
standpoint, the term∑
j∈I aijxj is difficult to evaluate in general because of the need to
numerically compute convolutions, even when the distributions are known and the com-
ponents of a are independent. To this end, it is practical to consider a model that features
both distributional robustness and computational tractability under limited information.

12 Author: Service Region Design for Urban EV Sharing Systems
In particular, we relax the data requirement by assuming knowledge of only certain
descriptive statistics of a, i.e., their means and covariance matrices. We construct a robust
model that delivers the worst-case adoption rate, i.e., the lowest adoption rate among all
possible distributions P of the utility parameters a with the given means and covariance
matrices:
qik ≤ infp∈P
Ep[1(∑j∈I
aijxj ≥ bk)]. (4)
The utility parameter aij is a nonnegative random variable, as utility would not be
reduced by additional coverage. In the following, we use ai = (aij)j∈I to denote the random
vector of random utility parameters associated with the origin i. We assume that the mean
vector ai = (aij) and covariance matrix Γi = [cov(aij1, aij2)] of ai are known for each location
i∈ I. Then, the second moment matrix Σi is given by:
Σi :=E
ai
1
ai
1
T =
Si ai
aTi 1
, where Si := Γi + aiaTi .
We assume that the covariance matrix is positive definite, i.e., Γi � 0, which implies that
the second moment matrix is also positive definite, i.e., Σi � 0. With a given x, the worst-
case adoption rate can be obtained by solving a convex optimization formulation with
copositive constraints, as shown in Lemma 1. In other words, certain constraints in the
formulation take the form of requiring certain decision variable matrices to be in the cone
of copositive matrices. A symmetric matrix M is said to be copositive (denoted M�co 0)
if it satisfies vTMv ≥ 0,∀v ∈ Rn+. For more details on copositive matrices and copositive
programming, please refer to Burer (2009).
Constraint (2) in Problem (1) can be approximated by constraint (4). Furthermore,
given the mean vector ai and the covariance matrix Γi for each region i∈ I, we obtain the
following result.
Lemma 1. Under a service region design indicated by x, the worst-case adoption rate
constraint (4) is equivalent to the following set of inequalities with copositive constraints.
〈Mik,Σi〉 ≤ 1− qik
Mik �co 0

Author: Service Region Design for Urban EV Sharing Systems 13
Mik +
0 dik
dTik −1− 2τikbk
�co 0
− ρx≤ dik
dik ≤ ρx
τike + ρ(x− e)≤ dik
dik ≤ τike + ρ(e−x)
τik ≥ 0
where ρ is a large scalar and e is the vector of ones; Mik (symmetric matrix), dik (vector),
and τik (scalar) are auxiliary decision variables.
Proof of Lemma 1. Please see Appendix B.1. �
The formulation in Lemma 1 is not readily solvable by commercial solvers because of the
combination of copositive constraints and integer-valued decision variables x. A natural
approach to addressing copositive constraints is to approximate them by tractable convex
restrictions, particularly those involving a series of linear and semidefinite constraints.
Moreover, we show that the semidefinite restriction of the copositive constraints in Lemma
1 can be further transformed into a second-order cone program. In Proposition 1, we
provide a computationally tractable lower bound for the worst-case adoption rate in (4).
Proposition 1. Adoption rate qik satisfies the following set of inequalities, with second-
order cone constraints (5), if and only if it satisfies Lemma 1 and constraint (4).∥∥∥∥∥∥1− qik− vik2Γ
12i x
∥∥∥∥∥∥2
≤ 1− qik + vik,∀i∈ I,∀k ∈K (5)
vik = b2k +
∑(j1,j2)∈I×I
(aij1 aij2 +σij1j2)zj1j2 − 2bk∑j∈I
aijxj,∀i∈ I,∀k ∈K (6)
(x, qik)∈Xik,∀i∈ I,∀k ∈K (7)
(zj1j2, xj1 , xj2)∈Z,∀j1, j2 ∈ I (8)
where vik and zj1j2 are auxiliary decision variables, and Z and Xik are feasible regions
characterized by linear constraints provided in Appendix B.2, Equations (38) and (39).
Proof of Proposition 1. Please see proof in Appendix B.2. �

14 Author: Service Region Design for Urban EV Sharing Systems
3.2. Operational Profit Model
One of the key issues in one-way car sharing operations is to maintain service level. The
service level α is defined for each region as the probability that customers will find available
EVs at their origins when they intend to travel. While we set the same service level α
across regions for the ease of discussion, location-specific service level can be easily modeled
by introducing αi for region i. To maintain the service level, the firm frequently employs
“street teams” to reposition vehicles to ensure availability throughout the service region
(New York Magazine 2015).
Similar to the rail equipment repositioning model in Adelman (2007), we model fleet
operations as a closed queueing network in Figure 3(a). A key feature to note in our
modeling is that the EVs, rather than the customers, are the entities that flow within the
queueing network, unlike the case in typical models of call centers. In a closed network, the
total number of EVs is a constant. At any given time instant, an EV can be in one of four
states: (i) being idle at some area awaiting the next customer rental, (ii) traveling from
one idle node to another with a customer (i.e., in rental), (iii) traveling from one idle node
to another due to repositioning, or (iv) recharging at a charging station. Correspondingly,
we define four types of queues to characterize the time delays EVs undergo in these four
types of activities. In the following discussion, we use the terms “queue” and “node”
interchangeably, as both refer to individual queues in the queueing network.
(a) Closed Queueing Network (b) Open Queueing Network
Figure 3 EV Sharing Operations as Queueing Networks

Author: Service Region Design for Urban EV Sharing Systems 15
For ease of exposition, we first discuss the dynamics of the system as if EVs do not
need to be repositioned or recharged. After we describe the basic queueing dynamics cor-
responding to activities (i) and (ii), we will further discuss how activities (iii) and (iv) can
be incorporated into the queueuing system.
First, we model each idle node i in the service region as a queue in which EVs in state
(i) discussed above remain idle until rented by a customer (Figure 3(a)). We assume that
customer requests for trips occur following Poisson processes with origin- and destination-
specific rates. Thus, whenever there is at least one EV in the idle queue, the time until
the next rental service starts is exponentially distributed. Assuming that EVs are checked
out in a first-in-first-out manner, the total amount time that an EV spends in an idle
queue consists of two components: the waiting time until all EVs ahead of it in the queue
are checked out (equal to the sum of m independent exponentially-distributed random
variables if there are m other EVs ahead), plus the exponentially-distributed waiting time
for the rental to begin once reaching the first position in the queue. Because the number
of EVs in the queue, as long as it is non-zero, does not affect the rate of departure, the
dynamics of EV movements are analogous to a ·/M/1 queue in which EVs queue to enter
“service” (i.e., wait to reach the first position to be checked out by a customer). Note also
that the first-in-first-out assumption is not restrictive, as the EVs are all identical and
interchangeable, and we are only interested in the probability that there are no EVs in the
queue (and not, for example, the through time of an individual EV). When there are no
EVs in the queue, any customer requests (which still follow the same Poisson process) will
be lost. The service level, defined as the long-run proportion of customer requests that are
met at the idle queue, is thus equal to the probability that the queue is not empty.
When an EV departs from an idle queue i toward the customer’s chosen destination j, it
enters a transit node (i− j), where it remains for a duration (of the customer rental which
may depend on the distance between i and j) following a general distribution. Thus, the
transit node is a ·/G/∞ queue, in which capacity is considered infinite, as rental durations
are independent of one another. After the rental duration, the EV departs the transit node
and enters the idle queue j.
Note that under the dynamics discussed thus far, the flows of EVs among idle nodes
are not necessarily balanced. Thus, repositioning activities (iii) are required to maintain
availability of EVs at all locations. To model this, we consider that the EV in the first

16 Author: Service Region Design for Urban EV Sharing Systems
position of an idle queue i can be repositioned to idle queue j following another Poisson
process with a rate to be determined by the firm. To capture this, the “service” in the
idle queue is now interpreted as waiting for either the next customer rental or the next
repositioning trip, whichever occurs first. Because the waiting times (for the first EV in
line) for both follow independent exponential distributions, the “service” times at idle
queues remain exponentially distributed. If an EV enters a repositioning trip, it travels
from i to j while incurring some generally distributed travel time. Thus, the repositioning
nodes are also modeled as ·/G/∞ queues, with different (faster, as repositioning is to be
conducted economically) “service” rates than the corresponding transit queues.
Furthermore, when the battery level of an EV falls below a certain threshold, the EV
must be recharged. For tractability, we do not keep track of the battery level for individual
EVs. Instead, we assume that every time an EV departs a transit queue (completing a
rental), it is re-routed to a recharging queue with a certain probability Pc (an exogenous
parameter). For ease of discussion, the recharging queue is modeled as an ·/G/∞ queue,
assuming sufficient charging capacity and generally distributed charging time. Our model
can also be easily extended to the case in which there are a finite number of parallel
chargers at the recharging queue. Additionally, the travel time between an idle queue and a
recharging queue is omitted in the computation, as the fixed-cost infrastructure investment
incurred in covering a service area ensures sufficient accessibility of chargers in every service
area covered.
Having described the dynamics of the queuing network, we now proceed to model the
operational profit function Θ(·) mathematically. The first step is to characterize the rates
of the three classes of EV flows among nodes of the queueing network: transit flows,
repositioning flows and recharging flows. Consider the idle queue i. Let µi (an exogenous
parameter) be the maximum outbound trip demand rate, i.e., the demand rate when the
adoption rate is equal to one, and let Pij (an exogenous parameter) be the proportion
of trips with destination j when all areas are served, where∑
j∈I Pij = 1. With customer
adoption qik (a decision variable) realized, the trip rate from idle queue i to j, Ψij (an
auxiliary decision variable) can be written as:
Ψij = Pijµi∑k∈K
wikqik,∀i, j ∈ I (9)
where wik is the weight of customer group k in trip requests.

Author: Service Region Design for Urban EV Sharing Systems 17
Such demand for trips, however, is not necessarily fully satisfied for two reasons. First,
those trips with destinations not covered within the service region will not be realized.
Second, because the availability of EVs is stochastic, a certain proportion of demand (one
minus the service level) will be lost. Let ψij (an auxiliary decision variable) be the realized
transit flow after accounting for these two factors. Under the service level guarantee, the
realized transit flow must be between α (an exogenous parameter) and one times Ψij, when
the destination j is covered in the service region. Therefore, the following constraint holds:
αΨijxj ≤ψij ≤Ψijxj,∀i, j ∈ I. (10)
Furthermore, in the long-run, the same service levels are seen by customers from the same
origin, regardless of their destinations. Thus, the proportion of realized transit trips for each
destination must equal the proportion of original trip demand for the same destination, as
stipulated by the following proportionality constraints (which also appear in the bicycle
sharing model of (Shu et al. 2013)):
ψij =Pijxj∑l∈I Pilxl
∑l∈I
ψil,∀i, j ∈ I. (11)
In (11), note that the fractionPij∑
l∈I Pilxlis the proportion of original trip demand to des-
tination j among the destinations covered in the service region, e.g. xj = 1. We also note
that constraints (10) and (11) are nonlinear. To linearize them, we introduce a further set
of auxiliary decision variables ψ′ij and require them to satisfy the proportionality propertyψ′ijψ′il
=PijPil
by imposing constraint (14) below. Intuitively, ψ′ij gives the potential realized
transit trip rate assuming all destinations are covered. With the new set of auxiliary vari-
ables, we can replace (10) and (11) with:
ψ′ij ≥ αΨij,∀i, j ∈ I (12)
ψ′ij ≤Ψij,∀i, j ∈ I (13)
ψ′ij = Pij∑l∈I
ψ′il,∀i, j ∈ I (14)
ψij =ψ′ijxj,∀i, j ∈ I (15)
The nonlinear constraints (15) can further be linearized as the following:
ψij ≤ψ′ij,∀i, j ∈ I (16)
ψij ≤ Pijµixj,∀i, j ∈ I (17)
ψ′ij +Pijµi(xj − 1)≤ψij,∀i, j ∈ I (18)

18 Author: Service Region Design for Urban EV Sharing Systems
Recall that an EV is sent to recharge with probability Pc when it completes a rental.
Thus, the flow rate of an EV to the recharging queue associated with idle queue i, λi (an
auxiliary decision variable) is given in the following constraint:
λi = Pc∑j∈I
ψji,∀i∈ I. (19)
Because the realized transit trip rates are not necessarily balanced, repositioning trips
are required to maintain availability. Recall that we assume that repositioning trips follow
Poisson processes. In particular, we define the decision variable φij as the rate of repo-
sitioning trips from i to j. Then, the flows of EVs in and out of each idle queue i must
satisfy the following flow balance constraint:∑j∈I
ψij +∑j∈I
φij = (1−Pc)∑j∈I
ψji +∑j∈I
φji +λi
=∑j∈I
ψji +∑j∈I
φji,∀i∈ I (20)
After relating the rates of different types of flows, the next step is to obtain the fleet
size required to ensure the guaranteed service level. Recall that at any time instant, an EV
can be at any of the four types of nodes (idle, transit, repositioning, recharging) and that
the total fleet size thus equals the sum of EVs being held at all these nodes in the closed
queueing network. Therefore, relating the rates of flow through each node, which we have
just modeled previously, with the number of EVs being held at the same node would allow
us to formulate the fleet size requirement. Unfortunately, for a closed queueing network,
the relationship between population (fleet) size and flow rates is not straightforward, due
to interdependence among flows of different nodes. We apply the fixed population mean
(FPM) approximation introduced in Whitt (1984, 2002) to circumvent this difficulty. In
particular, we approximate the EV population in the closed queueing network by the
steady state expected population in a closely-related open queueing network. The open
network used for this approximation is illustrated in Figure 3(b). In particular, the idle
queues work as M/M/1 queues, and the transit, repositioning and recharging queues work
as M/G/∞ queues. The network is open because the recharging queues are disconnected
from the rest of the network. Thus, at every idle queue i, instead of requiring EVs to move
to the corresponding recharging queue with rate λi, we require that EVs leave the system

Author: Service Region Design for Urban EV Sharing Systems 19
at the same rate. Correspondingly, at the standalone recharging queue, we assume that
external arrivals occur at rate λi. Intuitively, this approximation corresponds to relaxing
the sample path dependence between the recharging queues with the rest of the system to
the case of dependence in expectation.
The open network approximation allows us to relate the fleet size to the flow rate for
each node. In particular, with service level α, the expected number of EVs awaiting in idle
queue i (the queue length) is α1−α . Let tij and τij (exogenous parameters) be the expected
trip durations from i to j for customer rental and repositioning trips, respectively, and tc be
the expected time to recharge an EV. By applying Little’s law for each queue, the expected
fleet size also constitutes the expected values of∑
j∈I∑
i∈I tijψij EVs in transit nodes,∑i∈I∑
j∈I τijφij EVs in repositioning nodes, and∑
i∈I tcλi EVs in recharging queues. Thus,
the fleet size N must be no less than the following sum:
∑i∈I
α
1−αxi +
∑j∈I
∑i∈I
tijψij +∑i∈I
∑j∈I
τijφij +∑i∈I
tcλi ≤N. (21)
Finally, the last step in formulating our fleet operations submodel is to characterize the
operational profit Θ(q,x), which consists of four parts: operational revenue, repositioning
cost, charging cost, and fleet investment. To ensure consistency in cost accounting, the
scaling factor ξ (an exogenous parameter) is applied to unify the time unit, i.e., ξ = 365 to
convert daily rates into yearly rates. The annual operational revenue ξ∑
j∈I∑
i∈I rtijψij is
obtained from EV usage for customer trips between all origin-destination pairs, where r
(an exogenous parameter) is the per unit time usage price of an EV. Similarly, the annual
repositioning cost is given by ξ∑
i∈I∑
j∈I ητijφij, where η (an exogenous parameter) is the
repositioning cost per unit time. Using c (an exogenous parameter) to denote the average
cost to fully recharge an EV, the total charging cost is given by ξ∑
i∈I cλi. Lastly, we use
h (an exogenous parameter) to denote the annually amortized EV purchase cost, which
is based on the price and typical life span in the EV sharing fleet. Therefore, the annual
operational profit is formulated as:
Θ(q,x) = ξ
(∑j∈I
∑i∈I
rtijψij −∑i∈I
∑j∈I
ητijφij −∑i∈I
cλi
)−hN

20 Author: Service Region Design for Urban EV Sharing Systems
Combining the adoption rate and operational profit submodels, the service region design
problem is formulated as a mixed integer second-order cone program (MISOCP):
maxxi,qik,N,Ψijψij ,ψ
′ij ,φij ,λi
∑i∈I
∑k∈K
fQikqik−∑i∈I
gixi + ξ
(∑j∈I
∑i∈I
rtijψij −∑i∈I
∑j∈I
ητijφij −∑i∈I
cλi
)−hN
(22)
s.t.
Constraint (3), (5)− (9), (12)− (14), (16)− (21)
qik,N,Ψij,ψij,ψ′ij, φij, λi ≥ 0
xi ∈ {0,1}
The detailed MISOCP formulation to (22) is shown in Appendix B.3. The above formula-
tion is readily solvable by optimization solvers, such as CPLEX, that can handle MISOCPs.
In practice, the customer travel patterns, including both the trip distribution Pij and
outbound trip demand rates µi, can be time-varying. The proposed model (22) can be
extended by incorporating the pointwise stationary approximation (Green and Kolesar
1991) approach as if the travel patterns are stationary at each point in time. The resulting
formulation in the presence of time-varying travel patterns is provided in Appendix B.4.
One further point that warrants discussion is the integration of the adoption rate and
operational profit submodels. Following Proposition 1, the worst-case adoption rate can be
represented by the qik variables, subject to a set of linear and second-order conic constraints
(5)-(7), in the absence of other constraints. However, when the constraints characterizing
the queueing network dynamics (which involve the qik variables) are added, there is no
theoretical guarantee that (5) is tight at the optimal solution. While, in practice, we note
that the adoption rate constraints (5) in the computational experiments presented in Sec 4
are tight, we also provide Proposition 2 below, which gives sufficient conditions for the
tightness of (5).
Proposition 2. For a given service region design I ′ ⊆ I, the second-order conic con-
straint (5) is tight for customer group k in candidate region i ∈ I ′ when the following
sufficient condition holds:
fQik +µiwikPiiuii +µiwik∑j∈I′j 6=i
Pij(uij − vji)> 0

Author: Service Region Design for Urban EV Sharing Systems 21
where uij = (ξr−h)tij −Pc(ξc+htc) is the expected usage revenue net of the fleet cost and
charging cost, and vji = (ξη+h)τji is the expected reposition cost. In other words, when the
expected profit from serving customer group k in candidate region i is positive, the adoption
rate constraint is tight.
Proof of Proposition 2. Please see the proof in Appendix B.5. �
4. Case Study: Car2Go in San Diego
We demonstrate the service region design optimization framework with a case study of
Car2Go in San Diego, the first city in North America in which Car2Go is operating an
all-EV fleet under the free-floating model. At the time of launch or major re-design, the
firm may have access to only limited operations data, such as from pilot studies (from other
cities or the current service region) or market surveys, to estimate customer preferences
and travel patterns. Our study simulates the case of a service region re-design, in which
partial information on travel patterns is available for locations covered in the incumbent
service region but not for places not covered currently. We begin by describing the sources
of data and the procedures for estimating the parameters for our optimization model.
4.1. Parameter Estimation
We consider the set of potential locations to cover, I, as the set of 61 zip codes in San
Diego county. The values for cost and revenue parameters are taken from Car2Go’s website.
Those fixed costs and revenue terms (e.g., the one-time membership fee) are amortized to
annual costs, assuming a 5-year planning horizon. In particular, the firm earns an annual
membership fee of f = $8 per customer and a trip revenue of r = $0.16/min of usage
(adjusted for variable costs). Based on the technical specifications of the Smart Electric
Drive, the EV model in the Car2Go fleet, the cost to recharge from a 20% battery level
to full is assumed to be c = $3, with a charging time of 6 hours. The probability that
an EV needs recharging after a trip is set to Pc = 0.2. In the case of imbalanced flows,
the street team must reposition the EVs at a cost of $0.32/min (of the duration of the
repositioning trip), which corresponds to twice the minimum wage in San Diego. The total
repositioning cost depends on the repositioning frequency and distance completed (thus,
the duration). Moreover, in our experiments, we assume that an α= 80% service level is
guaranteed throughout the service region.
To estimate the other parameters, particularly those related to travel patterns and fixed
costs of covering different candidate locations, we use the following data sets.

22 Author: Service Region Design for Urban EV Sharing Systems
1. Car2Go San Diego operations data. This data set is obtained through web crawling
of Car2Go’s website between March and April, 2014, and it contains a one-month time
stamp record of all idle EVs in the current service region of Car2Go in San Diego at five-
minute intervals. The record includes time, location, battery level and charging status of
every idle (available) car. By preprocessing the data, we identify 25,875 trips in total with
the current fleet size of 379 EVs. We also verify the Markovian assumption on customer
arrivals using the data set and testing procedures in Kim and Whitt (2014).
2. San Diego geographic information and census data. The travel distances and times
between all origin-destination pairs are computed using ArcGIS, a geographic information
system, with the road network map from the SanGIS data warehouse (SANDAG 2014).
The census data are from the 2010 American Community Survey (U.S. Census Bureau
2010), which provides information regarding the working population as well as the per
capita income for every zip code in San Diego County.
3. 2010 California Household Travel Survey (CHTS). The CHTS collects travel infor-
mation from sampled households in all 58 of California’s counties (California Department
of Transportation 2010). All participating households were first asked to record their travel
in a diary for a pre-assigned 24-hour period. For our purposes, we focus on households
in San Diego County. We use data from tables associated with households, persons and
places, which give the values of relevant attributes, including age, income level, zip codes
and modes of trips. In the sample of 1,999 working-age individuals in San Diego County,
we identify 6,562 trips, out of which 5,335 were by car.
4. EV charging station information. We use the EV charging station data from (U.S.
Department of Energy 2014a), which report attributes such as location, zip code, charger
number and EV network for every publicly available EV charging station. We focus on
the charging stations in San Diego County that are managed by the EV charging network
Blink, which provides charging services to Car2Go.
It is a standard approach in the transportation literature (e.g., Ortuzar and Willumsen
(2011, Ch5)) to model trip distribution using gravity models. Using the Car2Go operations
data, we fit gravity models for the travel patterns Pij and trip demand rates µi for all
the candidate regions using the per capita income and working-age population of the
respective origins and destinations as independent variables. For the utility parameters
ai, we consider their means ai and covariance matrices Γi (which are required for the
Author: Service Region Design for Urban EV Sharing Systems 23
distributionally robust model) to be given by the mean and covariances of Pij obtained
from the gravity model regression. Furthermore, to determine the aspirational level b, we
perform a clustering analysis and identify three groups of travelers based on modal choice
in the CHTS data. Excluding the two groups of travelers who mostly travel with their
own cars exclusively and those who use public transportation exclusively, we focus on
the intermediate group as the likely adopters of car sharing. We consider the aspirational
level to be the proportion of trips these travelers complete using their own cars (that can
potentially be replaced by car sharing), i.e., b= 0.53. Details of all estimation procedures
are provided in Appendix C.
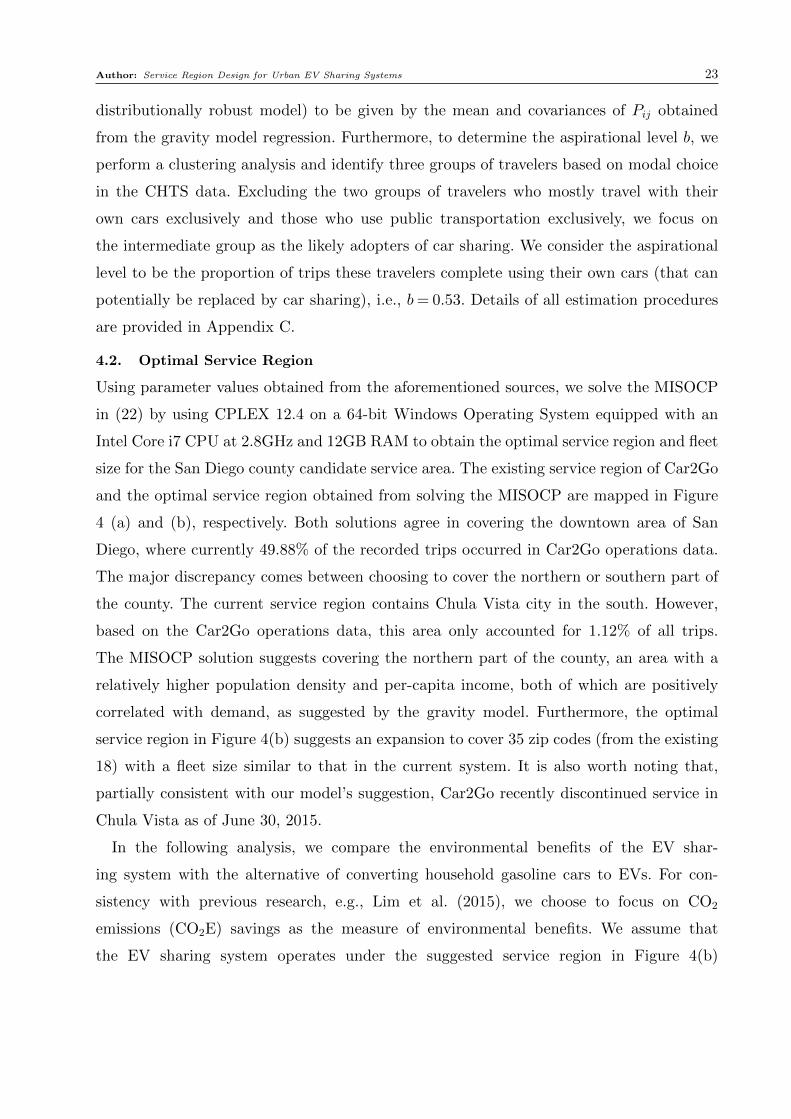
4.2. Optimal Service Region
Using parameter values obtained from the aforementioned sources, we solve the MISOCP
in (22) by using CPLEX 12.4 on a 64-bit Windows Operating System equipped with an
Intel Core i7 CPU at 2.8GHz and 12GB RAM to obtain the optimal service region and fleet
size for the San Diego county candidate service area. The existing service region of Car2Go
and the optimal service region obtained from solving the MISOCP are mapped in Figure
4 (a) and (b), respectively. Both solutions agree in covering the downtown area of San
Diego, where currently 49.88% of the recorded trips occurred in Car2Go operations data.
The major discrepancy comes between choosing to cover the northern or southern part of
the county. The current service region contains Chula Vista city in the south. However,
based on the Car2Go operations data, this area only accounted for 1.12% of all trips.
The MISOCP solution suggests covering the northern part of the county, an area with a
relatively higher population density and per-capita income, both of which are positively
correlated with demand, as suggested by the gravity model. Furthermore, the optimal
service region in Figure 4(b) suggests an expansion to cover 35 zip codes (from the existing
18) with a fleet size similar to that in the current system. It is also worth noting that,
partially consistent with our model’s suggestion, Car2Go recently discontinued service in
Chula Vista as of June 30, 2015.
In the following analysis, we compare the environmental benefits of the EV shar-
ing system with the alternative of converting household gasoline cars to EVs. For con-
sistency with previous research, e.g., Lim et al. (2015), we choose to focus on CO2
emissions (CO2E) savings as the measure of environmental benefits. We assume that
the EV sharing system operates under the suggested service region in Figure 4(b)

24 Author: Service Region Design for Urban EV Sharing Systems
(a) Current Service Region as of Feb, 2015 (b) Optimal Service Region
Figure 4 Service Region Designs
with 369 EVs. Considering the adoption rates, opened destinations and service level,
the EV sharing system supports∑
i
∑j ψij = 957,896.9 customer trips with a total of∑
i
∑j ψijdij = 13,919,178 vehicle miles traveled annually, where dij is the average travel
distance from location i to j. There are also∑
i
∑j φij = 21,664 trips with a total of∑
i
∑j φijdij = 139,879.6 vehicle miles traveled for fleet repositioning. U.S. Department
of Energy (2016) provides the California average well-to-wheel emissions as 0.27 pounds
CO2E/mile for an EV and 1.14 pounds CO2E/mile for a gasoline car, assuming an aver-
age annual mileage of 10,000 miles. Therefore, the average CO2 emissions savings from
an EV in a sharing fleet is given by [1.14(pounds CO2E/mile)× 13,919,178(miles/year)−
0.27(pounds CO2E/mile) × (13,919,178 + 139,879.6)(miles/year)]/369(EVs) = 32,715.22
pounds CO2E/EV/year. With individually owned cars, replacing a gasoline car with
an EV yields average CO2 emissions savings of (1.14 − 0.27)(pounds CO2E/mile) ×
10,000(miles/year) = 8,700 pounds CO2E/EV/year. Therefore, the environmental bene-
fit of an EV in the suggested sharing fleet is 32,715.22/8,700 = 3.76 times that of an
individually owned EV.
Observation 1. Under the optimal solution in Figure 4(b), each EV in the sharing
fleet, on average, yields 3.76 times the CO2 emissions savings of an average individually
owned EV.

Author: Service Region Design for Urban EV Sharing Systems 25
Such savings in emissions are mainly due to the higher vehicle utilization in the shar-
ing fleet. Therefore, the amount of savings depends on the geographical characteristics
of the service region, customer adoption, trip frequency and travel distances. Our finding
echoes the findings of the survey conducted by Firnkorn and Muller (2011), which sug-
gest that there are long-term environmental benefits and vehicle ownership reduction that
result from free-floating car sharing systems. Moreover, compared with purchasing EVs,
participation in EV sharing systems involves lower opportunity costs and eases consumers’
concern over barriers such as range and resale anxieties (Lim et al. (2015)). Thus, EV
sharing systems show the potential to deliver GHG emissions savings earlier and to deliver
greater cumulative environmental benefits through early adoption.
This finding may also have implications regarding the design of governmental support
programs for EVs. In California, car manufacturers are required to sell a certain number of
zero emissions vehicles (ZEVs, including EVs) for every conventional car sold or to purchase
an equivalent amount of credit from manufacturers who sell a surplus of ZEVs (California
Environmental Protection Agency 2014). By selling EVs to its subsidiary Car2Go, Daimler
may gain ZEV credits without directly cannibalizing its market for conventional cars (under
the Mercedes brand). Observation 1 suggests that such a strategy might help magnify
the environmental benefits for the same number of EVs. On the other hand, encouraging
travelers (particularly the green-minded population segment) to adopt car sharing might
slow down overall EV sales figures and the growth of this nascent segment of production.
Thus, it could be an interesting policy question in future studies to evaluate whether the
sale of EVs to individuals or to car sharing fleets should be stimulated equally or whether
more customized policies should be pursued.
4.3. Effectiveness of the Robust Solution
To evaluate the effectiveness of our proposed optimization model (22), we evaluate its per-
formance against three benchmark heuristics. In particular, to assess the value of incorpo-
rating customer adoption and fleet operation characteristics in service region optimization,
we design the three heuristics based on a more stylized view of the following features:
Assumption 1. The adoption rate at any covered location qs is equal to the aspirational
level b and is independent of the selection of other locations.
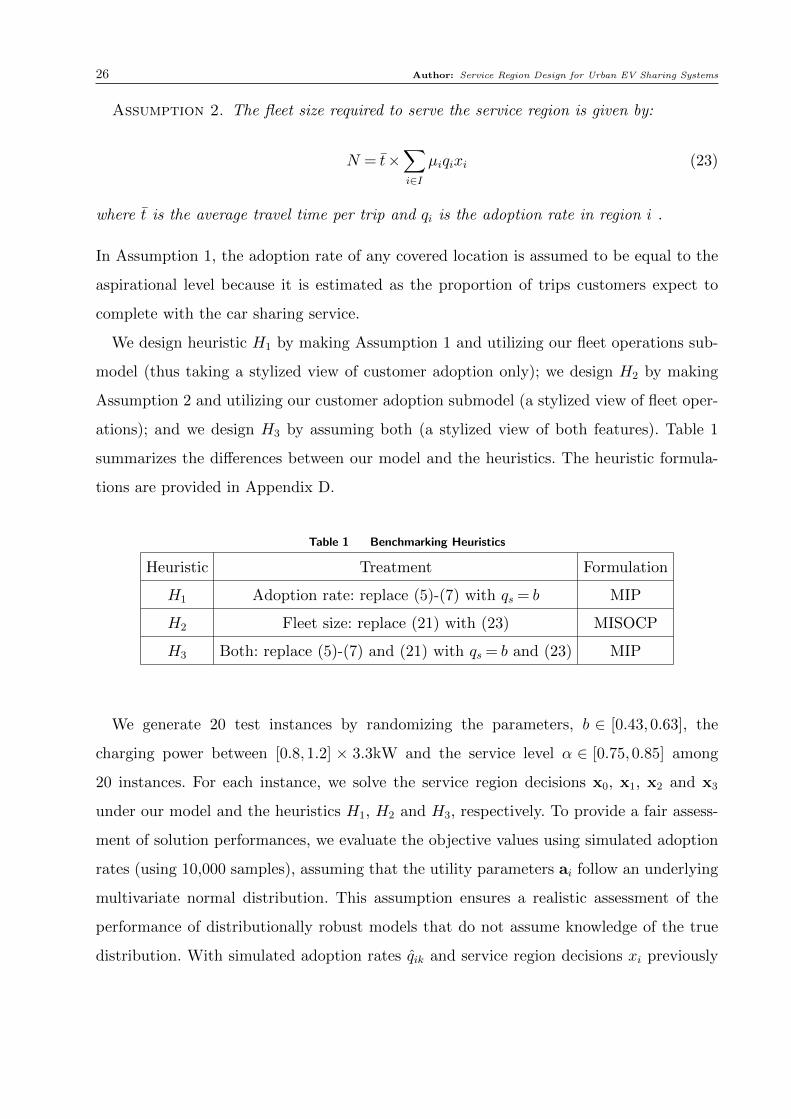
26 Author: Service Region Design for Urban EV Sharing Systems
Assumption 2. The fleet size required to serve the service region is given by:
N = t×∑i∈I
µiqixi (23)
where t is the average travel time per trip and qi is the adoption rate in region i .
In Assumption 1, the adoption rate of any covered location is assumed to be equal to the
aspirational level because it is estimated as the proportion of trips customers expect to
complete with the car sharing service.
We design heuristic H1 by making Assumption 1 and utilizing our fleet operations sub-
model (thus taking a stylized view of customer adoption only); we design H2 by making
Assumption 2 and utilizing our customer adoption submodel (a stylized view of fleet oper-
ations); and we design H3 by assuming both (a stylized view of both features). Table 1
summarizes the differences between our model and the heuristics. The heuristic formula-
tions are provided in Appendix D.
Table 1 Benchmarking Heuristics
Heuristic Treatment Formulation
H1 Adoption rate: replace (5)-(7) with qs = b MIP
H2 Fleet size: replace (21) with (23) MISOCP
H3 Both: replace (5)-(7) and (21) with qs = b and (23) MIP
We generate 20 test instances by randomizing the parameters, b ∈ [0.43,0.63], the
charging power between [0.8,1.2] × 3.3kW and the service level α ∈ [0.75,0.85] among
20 instances. For each instance, we solve the service region decisions x0, x1, x2 and x3
under our model and the heuristics H1, H2 and H3, respectively. To provide a fair assess-
ment of solution performances, we evaluate the objective values using simulated adoption
rates (using 10,000 samples), assuming that the utility parameters ai follow an underlying
multivariate normal distribution. This assumption ensures a realistic assessment of the
performance of distributionally robust models that do not assume knowledge of the true
distribution. With simulated adoption rates qik and service region decisions xi previously

Author: Service Region Design for Urban EV Sharing Systems 27
determined, the objective function (profit) for each solution can be evaluated with the
following model:
maxN,Ψij ,ψijψ′ij ,φij ,λi≥0
∑i∈I
∑k∈K
fQikqik−∑i∈I
gixi + ξ
(∑j∈I
∑i∈I
rtijψij −∑i∈I
∑j∈I
ητijφij −∑i∈I
cλi
)−hN
(24)
s.t.
Constraint (9), (12)− (14), (16)− (21)
Table 2 summarizes the performance of the approaches under the parameter setting in
Sec 4.2 and the randomized instances. Let Π(x) be the expected profit from (24) in service
region x. We report the percentage gaps between performances of x0 and xi, defined asΠ(x0)−Π(xi)
Π(x0).
Table 2 Benchmarking Performance
SolutionParameter Setting in Sec 4.2 Randomized Instances
Regions Selected Profit (×106$) Gap Avg. Gap Min Gap Max Gap
Our model 35 1.917 - - - -
H1 21 1.576 17.81% 22.19% 12.90% 30.56%
H2 56 1.647 14.09% 18.14% 7.78% 40.38%
H3 54 1.709 10.84% 14.78% 6.12% 37.23%
Under the parameter setting in Sec 4.2, H1 underestimates the adoption rates by assum-
ing a uniform system-wide adoption rate qs. Because this stylized view fails to account
for the fact that adoption rates increase in service region coverage, H1 tends to suggest
covering fewer locations than is optimal under our proposed model. On the other hand,
H2 underestimates the fleet size (and cost) required to cover the service region, as it does
not consider the fleet in terms of charging and repositioning. Thus, H2 tends to suggest
covering more regions than our model. Both H1 and H2 perform substantially worse than
our model in terms of simulated profit. Finally, because H3 combines the stylized views on
adoption rates and fleet operations, which impose counteracting forces on the size of the
service region, it is not surprising that its proposed service region agrees better with that
of our proposed model. Overall, by capturing both adoption and fleet operation features

28 Author: Service Region Design for Urban EV Sharing Systems
in detail, our proposed solution outperforms all three heuristics. These observations also
highlight the importance of capturing the details of both features, as taking a stylized view
on either could lead to significantly worse solutions.
4.4. Implications of Charging Power, Service Level and Aspirational Level Changes
In this section, we evaluate the effects of several key modeling parameters on the optimal
service region. In particular, we investigate the effects of charging power, service level
requirements and aspirational levels. These parameters carry important implications for the
key problem characteristics of fleet operations (for the former two) and customer adoption
(for the latter).
Due to continuous improvement of battery and charging technologies, the practical
charging speed for EVs has improved in recent years. Although the Smart Electric Drive
mode that Car2Go uses is only equipped with a 3.3 kW charger (requiring approximately 6
hours to fully recharge the car), newer models such as the BMW i3 (which DriveNow uses),
Renault ZoE, and the Nissan Leaf are compatible with faster chargers with power levels
ranging from 7 kW to 50 kW. Because charging speeds are roughly inversely proportional
to charging power (e.g., a 50 kW quick charger could recharge an EV in approximately 30
minutes), utilizing faster chargers directly reduces the recharging down time and improves
EV utilization. To investigate the potential gains from deploying faster chargers, we vary
the charging power (and thus, charging times) from our benchmark case and plot the
resulting profit, number of covered locations, and fleet density (i.e., fleet size per thousand
covered population) in Figure 5.
Observation 2. Enhancements in charging power from the status quo lead to improve-
ments in service coverage (larger service region) and cost efficiency (smaller fleet density),
but with diminishing returns as charging power increases.
Not surprisingly, Figure 5 shows that a faster charging technology enables the firm to
serve a larger region with lower fleet density. The major reduction in fleet size comes from
the downtime of recharging EVs. Although the general pattern shows that profit improves
as charging power increases, the service region size becomes stable when the charging power
reaches 20 kW and above. This finding suggests that, whereas the recharging down time is
indeed an obstacle against service region expansion in the status quo, other obstacles such
as fixed costs and demand imbalance will factor in to impede further expansion even if

Author: Service Region Design for Urban EV Sharing Systems 29
Figure 5 Service Region Design Under Different Charging Power Levels
the charging speed significantly improves. Furthermore, if charging time is interpreted as
the total duration of waiting and charging at a charging station, it can further be inferred
from Figure 5 that service region coverage and profitability heavily depend upon the devel-
opment and availability of chargers. When the charging infrastructure is underdeveloped,
the total charging and waiting times are long, which might lead to significant shrinkage in
service coverage.
Finally, it is also notable that improvements in charging power yield diminishing returns.
In practice, high-powered quick charging (e.g., 50 kW quick charging) is expensive to deploy
and may shorten battery life if used regularly. To balance this trade-off, our observation
suggests that it is sufficient to deploy medium-speed chargers, such as “Level 2” chargers
with 15-20 kW power output, as the potential gains from further improving charging speeds
are limited.
Next, we investigate the effects of the service level requirement. Because one primary
aim of car sharing services is to replace car ownership, it is of primary concern to ensure
high availability of cars such that customers do not encounter significant inconveniences
in forgoing (the purchase of) their own cars. On the one hand, a higher service level
requirement obviously leads to a larger fleet size and higher costs. On the other hand, it
ensures that a higher percentage of demand is satisfied and generates more revenue. In this
section, we vary the required service level α and plot the resulting profit, service region
size and fleet density in Figure 6.

30 Author: Service Region Design for Urban EV Sharing Systems
Figure 6 Service Region Design Under Different Service Levels
Observation 3. A higher service level leads to larger fleet investments and a smaller
service region with lower profits.
As shown in Figure 6, a higher service level requirement leads to a smaller service
region, as the profitability of each service region decreases due to the higher fleet size
requirement. Meanwhile, we also note that the profit gains from maintaining a lower service
level requirement diminish as α drops to 0.6 or below. Furthermore, in this exercise, we
hold the adoption parameter b constant while varying α, i.e., we assume that changes in
service level do not affect adoption decisions, to better focus on the operational effect of
service levels. Nevertheless, our observation indicates that maintaining a low service level
only yields marginal improvements in profits. In Section 4.5, we will further evaluate the
case in which the adoption threshold, b, is dependent on the service level.
Having discussed the impacts of charging power and service level requirements, both of
which are major components in the fleet operations submodel, we further test the effects
of the aspiration level, b, a key parameter in determining customer adoptions. As the
aspirational level increases, customers are less likely to adopt the service with the same
coverage. It is not immediately clear whether the firm should increase (to encourage more
adoptions) or decrease (as marginal revenue of coverage drops) coverage as b increases.
Observation 4. A higher aspirational level b leads to a larger service region and reduced
profit.

Author: Service Region Design for Urban EV Sharing Systems 31
Figure 7 Service Region Design Under Different Aspirational Levels
Figure 7 shows that when the aspirational level is relatively low (e.g., b≤ 0.5), the service
region size is relatively stable, which suggests that in this range, the counteracting forces of
expanding the service region to attract demand and shrinking it due to reduced marginal
revenue are more or less balanced. Because the aspirational level is medium to moderately
high (e.g., b≤ 0.7), it becomes important to grow the service region to induce adoption as b
increases, as the requirement to induce adoption becomes more important. However, as the
aspirational level further grows to a very high level (e.g., b≥ 0.8), customers become too
demanding in terms of service coverage, the marginal revenue of coverage becomes too low,
and the service thus cannot break even. Therefore, the optimal solution is to not enter the
market at all, which also suggests that free-floating car sharing might not be particularly
profitable in markets in which customers are completely reliant on driving and expect the
car sharing service to fulfill almost all their traveling demands.
4.5. Price- and Service Level-Sensitive Adoption
In our baseline optimization model, we model customer adoption behavior as a function
of service region coverage (see Section 3.1), assuming that the service level requirement
and price level are given constants set at appropriate levels based on market conditions
(e.g., a market-competitive price). In practice, there are cases in which these parameters
can vary and affect adoption behavior, as a result. In this section, we demonstrate how our
optimization model can be applied to tackle this more general case. In particular, to capture
the dependence between adoption behavior and these parameters, we allow the aspirational

32 Author: Service Region Design for Urban EV Sharing Systems
level b to be a decreasing function in service level α and an increasing function in price r. In
this manner, we capture the effects of higher service levels or lower prices attracting higher
adoption, holding other parameters constant. In our computational experiments, we assume
these functions to be linear, but we note that any general functional form can be easily
accommodated using the same approach. In particular, we consider b= 0.53 + sr(r− 0.16)
and b= 0.53 + sα(0.8−α), using the base case parameter values of b= 0.53, r = 0.16 and
α= 0.8 from Sec 4.2 as reference points. For each value of price or service level sensitivity
coefficients (sr or sα), we identify the price and service level that provide the highest
expected profits through numerical search. The resulting optimal service regions are plotted
in Figures 8(a)-(b).
30
40
50
60
1 3 5 7 9
Serv
ice R
egio
ns
Price Sensitivity
(a) Service Region in Price Sensitivity
30
40
50
60
0.5 1.5 2.5 3.5 4.5
Serv
ice R
egio
ns
Service Level Sensitivity
(b) Service Region in Service Level Sensitivity
Figure 8 Price- and Service Level-Sensitive Adoption
Figure 8(a) reports the service region size under optimized prices for price-sensitive
adoption. The aspirational level b is set to increase in r at rates sr ranges from 1 to 10.
Figure 8(a) shows that the service region coverage shrinks as the price sensitivity increases.
When customers are less price-sensitive, it is profitable to serve a large region to attract
more customers and revenue. When the customers are highly price-sensitive, the resulting
adoptions are not high enough for the firm to operate profitably in a large region. Therefore,
when demand elasticity is high, the price, r, should be determined cautiously.

Author: Service Region Design for Urban EV Sharing Systems 33
Figure 8(b) reports the results under service level-sensitive adoption. Because customers
are in favor of high service levels, the aspirational level b is decreasing in the service level α
at rates sα that range from 0.5 to 5. When customers are less sensitive to the service level,
it is profitable to operate in a large service region with moderate service level target, i.e.,
attract customers using extensive geographical coverage while offering modest availability
to save (fleet) costs. However, as customers’ sensitivity to service levels increases, it is
optimal to reduce service coverage and provide higher EV availability, and thus the opti-
mal service region tends to shrink. These observations highlight the substitution between
attracting customers through the scope (geographical coverage) and quality (availability)
of service.
5. Conclusion
In this paper, we study the service region design problem for free-floating EV sharing sys-
tems. Because customer adoption depends on service coverage at preferred destinations,
we explicitly model the adoption decision, which influences the firm’s revenue in a prob-
abilistic manner. Under limited information on the utility parameters of destinations, we
develop a distributionally robust optimization model to evaluate the adoption rate, aiming
to maximize expected profit. We further model the fleet operations, including repositioning
and recharging, and determine the fleet size to guarantee the service level in the service
region using queueing networks. We provide a lower bound on the expected profit by a
computationally tractable MISOCP formulation. Several computational experiments are
then conducted to demonstrate the model in a case study of Car2Go San Diego based on
real operations data.
Our proposed solutions suggest expansion opportunities under a properly selected service
region and optimized fleet size. Because of higher vehicle utilization, EV sharing systems
offer more environmental benefits, e.g., savings in CO2 emissions, than replacing personal
gasoline cars with EV ownership. The proposed approach also outperforms several heuris-
tics taking stylized views on adoption behavior and fleet size modeling, which suggests the
importance of modeling these features in detail. Moreover, our results show that deploy-
ment of faster charging equipment can reduce fleet size and expand the service region,
albeit with diminishing effects. Our results also suggest that a higher service level leads to
a smaller service region to control operating costs, whereas customers with higher aspira-
tional levels lead to a larger service region to induce customer adoption. Finally, we discuss

34 Author: Service Region Design for Urban EV Sharing Systems
how our optimization framework can be applied to identify the optimal price and service
levels through numerical experiments in cases in which customer adoption is sensitive to
these factors.
While our computational study is set up to simulate a setting in which the firm under-
goes a service expansion, we acknowledge that there remain gaps between our study and
actual implementation in practice. First, as our trip pattern data are obtained through
web crawling, they do not provide information regarding customer characteristics. Thus,
we resort to assuming the same trip pattern parameters (means and covariances of ai)
for all consumer groups residing in the same zip code. Furthermore, we estimate the aspi-
rational level (b) from the modal choice patterns reported for the generic population in
the county by the CHTS. In practice, the firm possesses more extensive data on the trip
patterns of specific consumers. Through clustering, it will be possible to identify groups
of consumers based on their geographical travel patterns and demographic characteristics.
Then, the firm may perform targeted surveys with these groups to obtain more accurate,
and segment-specific, assessments of their aspirational levels.
In our demonstration of joint price (service levels) and service region optimization in
Section 4.5, we note that the sensitivities of adoption with respect to price and service level
are not precisely modeled or estimated. In practice, the firm is in possession with more data
(e.g., from surveys or focus groups studies) that could be used to obtain better estimates.
Even if such data is not available, the firm could engage in small-scale experiments by
varying prices and service levels in certain areas and measuring the changes in adoption.
Therefore, we believe that our modeling framework has potential to be further enhanced
when equipped with more comprehensive data.
When the service region is well planned, the next challenge for car sharing systems is
to maintain efficient operations while providing a high-quality customer experience. One
particular focus in operations improvement is on the management of car availability and
reservations. For instance, Car2Go customers can reserve cars online up to 30 minutes
ahead of their trip(Car2Go 2014). It would be interesting to investigate whether such a
reservation policy facilitates efficient fleet management. Efficient reservation policies, e.g.,
allowing reservation terms and possibly fees to depend on time and the availability of
cars, may also help balance the customer trips and reduce repositioning efforts without
jeopardizing the service level. Therefore, a future research direction will be to explore the
effects of reservation policies on EV utilization, availability and profitability.

Author: Service Region Design for Urban EV Sharing Systems 35
References
ACCESS. 2011. The impact of carsharing on household vehicle ownership. http://www.uctc.net/access/
38/access38_carsharing_ownership.shtml.
Adelman, Daniel. 2007. Price-directed control of a closed logistics queueing network. Operations Research
55(6) 1022–1038.
Agrawal, Vishal, Ioannis Bellos. 2016. The potential of servicizing as a green business model. Management
Science Forthcoming.
Ang, Marcus, Yun Fong Lim, Melvyn Sim. 2012. Robust storage assignment in unit-load warehouses. Man-
agement Science 58(11) 2114–2130.
Atcheson, John, Logan Green. 2012. Car sharing and pooling: Reducing car over-population and collaborative
consumption. http://energyseminar.stanford.edu/node/425.
Autolib. 2016. https://www.autolib.eu/en/.
Avci, Buket, Karan Girotra, Serguei Netessine. 2014. Electric vehicles with a battery switching station:
Adoption and environmental impact. Management Science .
Banerjee, Siddhartha, Carlos Riquelme, Ramesh Johari. 2015. Pricing in ride-share platforms: A queueing-
theoretic approach. Working paper .
Bellos, Ioannis, Mark Ferguson, L Beril Toktay. 2015. To sell and to provide? the economic and environmental
implications of the auto manufacturer’s involvement in the Car Sharing Business. Working Paper .
Ben-Tal, Aharon, Arkadi Nemirovski. 1998. Robust convex optimization. Mathematics of Operations
Research 23(4) 769–805.
Ben-Tal, Aharon, Arkadi Nemirovski. 1999. Robust solutions of uncertain linear programs. Operations
research letters 25(1) 1–13.
Benjaafar, Saif, Guangwen Crystal Kong, Xiang Li, Costas Courcoubetis. 2015. Peer-to-peer product sharing:
Implications for ownership, usage and social welfare in the sharing economy. Working paper .
Bertsimas, Dimitris, Melvyn Sim. 2003. Robust discrete optimization and network flows. Mathematical
programming 98(1-3) 49–71.
Bertsimas, Dimitris, Melvyn Sim. 2004. The price of robustness. Operations research 52(1) 35–53.
Boyacı, Burak, Konstantinos G Zografos, Nikolas Geroliminis. 2015. An optimization framework for the
development of efficient one-way car-sharing systems. European Journal of Operational Research 240(3)
718–733.
Bruglieri, Maurizio, Alberto Colorni, Alessandro Lue. 2014. The vehicle relocation problem for the one-way
electric vehicle sharing: an application to the milan case. Procedia-Social and Behavioral Sciences 111
18–27.

36 Author: Service Region Design for Urban EV Sharing Systems
Burer, Samuel. 2009. On the copositive representation of binary and continuous nonconvex quadratic pro-
grams. Mathematical Programming 120(2) 479–495.
Cachon, Gerard P, Kaitlin M Daniels, Ruben Lobel. 2015. The role of surge pricing on a service platform
with self-scheduling capacity. Working paper .
California Department of Transportation. 2010. “California Household Travel Survey”. http://www.dot.
ca.gov/hq/tsip/otfa/tab/chts_travelsurvey.html.
California Environmental Protection Agency. 2014. “Zero Emission Vehicle (ZEV) Program”. http://www.
arb.ca.gov/msprog/zevprog/zevprog.htm.
California Plug-in Electric Vehicle Collaborative. 2016. Charging equipment costs. http://driveclean.
ca.gov/pev/Costs/Charging_Equipment.php.
Car2Go. 2014. Car2Go Trip Process Agreement (U.S.). https://www.car2go.com/global-tc/us/
us-en-fa.pdf.
Car2Go. 2015. Car2Go San Diego. https://www.car2go.com/en/sandiego/.
Car2Go. 2016. https://www.car2go.com/.
Center for Climate and Energy Solutions. 2014. U.S. Emissions. http://www.c2es.org/energy/use/
transportation.
Chen, Wenqing, Melvyn Sim, Jie Sun, Chung-Piaw Teo. 2010. From cvar to uncertainty set: Implications in
joint chance-constrained optimization. Operations research 58(2) 470–485.
Chen, Xin, Melvyn Sim, Peng Sun. 2007. A robust optimization perspective on stochastic programming.
Operations Research 55(6) 1058–1071.
de Almeida Correia, Goncalo Homem, Antonio Pais Antunes. 2012. Optimization approach to depot loca-
tion and trip selection in one-way carsharing systems. Transportation Research Part E: Logistics and
Transportation Review 48(1) 233–247.
Delage, Erick, Yinyu Ye. 2010. Distributionally robust optimization under moment uncertainty with appli-
cation to data-driven problems. Operations research 58(3) 595–612.
DriveNow. 2016. https://us.drive-now.com/en/.
El Ghaoui, Laurent, Maksim Oks, Francois Oustry. 2003. Worst-case value-at-risk and robust portfolio
optimization: A conic programming approach. Operations Research 51(4) 543–556.
Engadget. 2014. Car2go brings north america’s first all-electric carshar-
ing program to san diego. http://www.engadget.com/2011/07/14/
car2go-brings-north-americas-first-all-electric-carsharing-prog/.
Febbraro, Angela, Nicola Sacco, Mahnam Saeednia. 2012. One-way carsharing: solving the relocation prob-
lem. Transportation Research Record: Journal of the Transportation Research Board (2319) 113–120.
Author: Service Region Design for Urban EV Sharing Systems 37
Firnkorn, Jorg, Martin Muller. 2011. What will be the environmental effects of new free-floating car-sharing
systems? the case of car2go in ulm. Ecological Economics 70(8) 1519–1528.
Flath, Christoph M, Jens P Ilg, Sebastian Gottwalt, Hartmut Schmeck, Christof Weinhardt. 2013. Improving
electric vehicle charging coordination through area pricing. Transportation Science 48(4) 619–634.
Fraiberger, Samuel P, Arun Sundararajan. 2015. Peer-to-peer rental markets in the sharing economy. NYU
Stern School of Business Research Paper .
Goh, Joel, Melvyn Sim. 2010. Distributionally robust optimization and its tractable approximations. Oper-
ations Research 58(4-part-1) 902–917.
Green, Linda, Peter Kolesar. 1991. The pointwise stationary approximation for queues with nonstationary
arrivals. Management Science 37(1) 84–97.
Hartigan, John A, Manchek A Wong. 1979. Algorithm AS 136: A k-means clustering algorithm. Applied
statistics 100–108.
Hu, Ming, Yun Zhou. 2016. Dynamic type matching. Working Paper .
Jiang, Baojun, Lin Tian. 2016. Collaborative consumption: Strategic and economic implications of product
sharing. Management Science. Forthcoming .
John Kleint. 2016. Cityspeed - road network efficiency via online mapping. http://cityspeed.
sourceforge.net/.
Kabra, Ashish, Elena Belavina, Karan Girotra. 2015. Bike share systems: Accessibility and availability.
Working Paper .
Kim, Song-Hee, Ward Whitt. 2014. Are call center and hospital arrivals well modeled by nonhomogeneous
poisson processes? Manufacturing & Service Operations Management 16(3) 464–480.
Kleindorfer, Paul R, Kalyan Singhal, Luk N Wassenhove. 2005. Sustainable operations management. Pro-
duction and operations management 14(4) 482–492.
Kong, Qingxia, Chung-Yee Lee, Chung-Piaw Teo, Zhichao Zheng. 2013. Scheduling arrivals to a stochastic
service delivery system using copositive cones. Operations Research 61(3) 711–726.
Lim, Michael K, Ho-Yin Mak, Ying Rong. 2015. Toward mass adoption of electric vehicles: Impact of the
range and resale anxieties. Manufacturing & Service Operations Management 17(1) 101–119.
Mak, Ho-Yin, Ying Rong, Zuo-Jun Max Shen. 2013. Infrastructure planning for electric vehicles with battery
swapping. Management Science 59(7) 1557–1575.
Mak, Ho-Yin, Ying Rong, Jiawei Zhang. 2014. Appointment scheduling with limited distributional informa-
tion. Management Science 61(2) 316–334.
Mak, Ho-Yin, Zuo-Jun Max Shen. 2014. Pooling and dependence of demand and yield in multiple-location
inventory systems. Manufacturing & Service Operations Management 16(2) 263–269.

38 Author: Service Region Design for Urban EV Sharing Systems
Natarajan, Karthik, Melvyn Sim, Joline Uichanco. 2010. Tractable robust expected utility and risk models
for portfolio optimization. Mathematical Finance 20(4) 695–731.
Natarajan, Karthik, Chung Piaw Teo, Zhichao Zheng. 2011. Mixed 0-1 linear programs under objective
uncertainty: A completely positive representation. Operations research 59(3) 713–728.
New York Magazine. 2015. Can car2go transform new york into a city of drivers? http://nymag.com/
daily/intelligencer/2015/01/car2go-car-sharing-new-york.html.
Nourinejad, Mehdi, Sirui Zhu, Sina Bahrami, Matthew J Roorda. 2015. Vehicle relocation and staff rebal-
ancing in one-way carsharing systems. Transportation Research Part E: Logistics and Transportation
Review 81 98–113.
Ortuzar, Juan de Dios, Luis G Willumsen. 2011, Ch5. Modelling transport . John Wiley & Sons.
Plambeck, Erica L. 2013. Om forum-operations management challenges for some cleantech firms. Manufac-
turing & Service Operations Management 15(4) 527–536.
ReachNow. 2016. http://www.bmwcarsharing.com/.
Reuters. 2013. Carsharing services will surpass 12 million members worldwide by
2020, forecasts navigant research. http://www.reuters.com/article/2013/08/22/
co-navigant-research-idUSnBw225991a+100+BSW20130822.
SANDAG. 2014. SanGIS/SANDAG data warehouse”. http://www.sangis.org/Download_GIS_Data.htm.
Schneider, Michael, Andreas Stenger, Dominik Goeke. 2014. The electric vehicle-routing problem with time
windows and recharging stations. Transportation Science 48(4) 500–520.
See, Chuen-Teck, Melvyn Sim. 2010. Robust approximation to multiperiod inventory management. Opera-
tions research 58(3) 583–594.
Shu, Jia, Mabel C Chou, Qizhang Liu, Chung-Piaw Teo, I-Lin Wang. 2013. Models for effective deployment
and redistribution of bicycles within public bicycle-sharing systems. Operations Research 61(6) 1346–
1359.
Simon, Herbert A. 1957. Models of Man: Social and Rational . Wiley.
Tang, Christopher S, Jiaru Bai, Kut C So, Xiqun Michael Chen, Hai Wang. 2016. Coordinating supply and
demand on an on-demand platform: Price, wage, and payout ratio. Working paper .
Taylor, Terry. 2016. On-demand service platforms. Working paper .
The Economist. 2013. The rise of the sharing economy. http://www.economist.com/news/leaders/
21573104-internet-everything-hire-rise-sharing-economy.
U.S. Census Bureau. 2010. 2010 american community survey”. http://www.census.gov/acs.
U.S. Department of Energy. 2014a. Alternative Fuels Data Center. http://www.afdc.energy.gov/data_
download/.

Author: Service Region Design for Urban EV Sharing Systems 39
U.S. Department of Energy. 2014b. Charging Plug-In Electric Vehicles at Home. http://www.afdc.energy.
gov/fuels/electricity_charging_home.html.
U.S. Department of Energy. 2016. Emissions from hybrid and plug-in electric vehicles. http://www.afdc.
energy.gov/vehicles/electric_emissions.php.
U.S. Environmental Protection Agency. 2014. Sources of Greenhouse Gas Emissions. http://www.epa.gov/
climatechange/ghgemissions/sources/transportation.html.
Weikl, Simone, Klaus Bogenberger. 2013. Relocation strategies and algorithms for free-floating car sharing
systems. Intelligent Transportation Systems Magazine, IEEE 5(4) 100–111.
Whitt, Ward. 1984. Open and closed models for networks of queues. AT&T Bell Laboratories Technical
Journal 63(9) 1911–1979.
Whitt, Ward. 2002. Stochastic-Process Limits: An Introduction to Stochastic-Process Limits and Their
Application to Queues. Springer.
Wills, Michael J. 1986. A flexible gravity-opportunities model for trip distribution. Transportation Research
Part B: Methodological 20(2) 89–111.

Author: Service Region Design for Urban EV Sharing Systems 1
Online Supplement
Appendix A: Summary of the Notation
Table 3 Notation
Parameter Units Definitionf $ fixed (annual) membership feeQik Scalar Population of customer group k in area igi $ Fixed cost of serving area ir $ per unit time per EV Usage based price of the servicetij unit of time Expected travel time to destination j from origin ic $ Average charging cost each timeη $ per unit of time Repositioning costτij unit of time Expected reposition time to destination j from origin ih $ Annually amortized EV costaij Scalar random variable Utility of serving destination j for a customer in area iaij Scalar Expected value of aij
Γi Scalar Covariance matrix of aij for area ibk Scalar Aspirational level for a customer in group k to adopt the serviceµi Trips per unit of time Outbound trip rate from area iPij [0,1] Probability of trip destination j given the origin iwik [0,1] Weight (in trip) of customer group k in area iα (0,1) Service levelPc [0,1] Probability of an arrival EV needs rechargetc unit time per EV Average charging time per EV
Decision Variables Units Definitionxi {0,1} 1 if area i is served; 0 otherwise.qik [0,1] Adoption rate of customer group k in area iN EVs Fleet size
Ψij Trips per unit of time Trip demand rate from i to jψ′
ij Trips per unit of time Satisfied trip rate if j is servedψij Trips per unit of time Satisfied trip rate: ψij =ψ′
ijxj
φij Trips per unit of time Repositioning trip rate from i to jλi Trips per unit of time EV arrival rate at charging stations in area i
Appendix B: Proofs of Analytical Results
B.1. Proof of Lemma 1
We begin the proof with deriving the formulation for the worst-case adoption rate in (4) following a similar
approach as in El Ghaoui et al. (2003). For ease of exposition, it is safe to temporarily drop the index
i ∈ I and k ∈K. Given the service region decision x, solving the following optimization problem yields the
worst-case non-adoption rate V (x) = sup Prob(∑
j∈J aijxj ≤ bk):
maxE[I(a)]
s.t.∫Rn+
[a1
][a1
]Tp(a)da = Σ
where p is the probability density function and I(a) is the indicator function defined as
I(a) =
{1, if
∑j∈J ajxj ≤ b
0, otherwise

2 Author: Service Region Design for Urban EV Sharing Systems
We write the Lagrange function with symmetric multiplier matrix M ∈ Sn+1 as:
L(p,M) =
∫Rn+
I(a)p(a)da +
⟨M,Σ−
∫Rn+
[a1
][a1
]Tp(a)da
⟩= 〈M,Σ〉+
∫Rn+
(I(a)− l(a)
)p(a)da
where l(a) = [ a 1 ]M[ a 1 ]T . Since Σ� 0, strong duality holds. Therefore, we have
V (x) = infM=MT
supp
L(p,M)
where
supp
L(p,M) = 〈M,Σ〉+ supp∈P
∫Rn+
(I(a)− l(a)
)p(a)da
=
{〈M,Σ〉, if I(a)− l(a)≤ 0,∀a∈Rn++∞, otherwise.
V (x) is finite if and only if I(a)− l(a)≤ 0,∀a∈Rn+. There are two cases:
1. l(a)≥ 0,∀a∈Rn+.
2. l(a)≥ 1,∀a∈Rn+ such that∑
j∈J ajxj ≤ b.Case 1 is equivalent to M�co 0 and Case 2 holds if there exist a scalar τ ≥ 0 such that, l(a)≥ 1−2τ(aTx−b).In addition, the Slater’s condition is satisfied as there exist an a such that
∑j∈J ajxj < b. As a result, the
above constraint for Case 2 is also sufficient. Equivalently, it can be written as M +
[0 τxτxT −1− 2τb
]�co 0.
V (x) is then the solution to the following copositive program (CP):
V (x) = min〈M,Σ〉
s.t.
τ ≥ 0
M�co 0
M +
[0 τxτxT −1− 2τb
]�co 0.
We then complete the proof by restoring the indices i∈ I and k ∈K and replacing V (x)≤ 1− q (as V (x)
is the non-adoption rate) with the above CP:
〈Mik,Σi〉 ≤ 1− q
τik ≥ 0
Mik �co 0
Mik +
[0 τikx
τikxT −1− 2τikbk
]�co 0
The last step is to linearize the term τikx. Since x is a binary vector and τik is continuous, we can replace
the term τikx by vector dik with the following constraints:
− ρx≤ dik
dik ≤ ρx
τike + ρ(x− e)≤ dik
dik ≤ τike + ρ(e−x)
where ρ is a large scalar and e is the vector of ones. This completes the proof.

Author: Service Region Design for Urban EV Sharing Systems 3
B.2. Proof of Proposition 1
By restricting the copositive constraints with semidefinite constraints, we obtain a lower bound to the optimal
solution to the formulation with copositive constraints in Lemma 1. When Θ(q,x) is linear, the following
formulation is a mixed integer semidefinite program (MISDP):
maxqik,xi,Mik,τik,dik
∑i∈I
∑k∈K
fQikqik−∑i∈I
gixi + Θ(q,x)
s.t.
〈Mik,Σik〉 ≤ 1− qik,∀i∈ I,∀k ∈K (25)
Mik � 0,∀i∈ I,∀k ∈K (26)
Mik +
[0 dik
dTik −1− 2τikbk
]� 0,∀i∈ I,∀k ∈K (27)
− ρx≤ dik,∀i∈ I,∀k ∈K (28)
dik ≤ ρx,∀i∈ I,∀k ∈K (29)
τike + ρ(x− e)≤ dik,∀i∈ I,∀k ∈K (30)
dik ≤ τike + ρ(e−x),∀i∈ I,∀k ∈K (31)
τik ≥ 0,∀i∈ I,∀k ∈K (32)
qik ≤ xi,∀i∈ I,∀k ∈K
xi ∈ {0,1},∀i∈ I.
From Appendix B.1, we note that constraints (28)-(31) are imposed to linearize the term τikx. Let us
temporarily restore the nonlinear term τikx, and the constraints (25)-(32) become:
〈Mik,Σik〉 ≤ 1− qik,∀i∈ I,∀k ∈K
Mik � 0,∀i∈ I,∀k ∈K
Mik +
[0 τikx
τikxT −1− 2τikbk
]� 0,∀i∈ I,∀k ∈K
τik ≥ 0,∀i∈ I,∀k ∈K.
Moreover, it can be shown that τik in the optimal solution is strictly positive (as long as an optimal
solution exists), as τik = 0 leads to qik ≤ 0. We are then able to rewrite the above constraints as follows, by
defining new variables τik = 1τik≥ 0 and Mik = Mikτik:
〈Mik,Σik〉 ≤ τik(1− qik),∀i∈ I,∀k ∈K (33)
Mik � 0,∀i∈ I,∀k ∈K (34)
Mik +
[0 x
xT −τik− 2bk
]� 0,∀i∈ I,∀k ∈K (35)
τik ≥ 0,∀i∈ I,∀k ∈K (36)
We now show that constraints (33)-(36) can be reformulated in second-order conic form. Let P be the set
of probability distributions with mean µ and covariance matrix Γ� 0. Let ε ∈ (0,1] and γ ∈ R given. The
following propositions are equivalent (El Ghaoui et al. 2003):

4 Author: Service Region Design for Urban EV Sharing Systems
1.√
1−εε
√xTΓix−µTx≤ γ
2. There exist a symmetric matrix M and τ ∈R such that
〈M,Σ〉 ≤ τε
M� 0
M +
[0 x
xT −τ + 2γ
]� 0
τ ≥ 0
where Σ is the second-moment matrix.
By viewing 1−qik as ε and −bk as γ in the above result, the semidefinite constraint (33)-(36) can be expressed
as √qik
1− qik
√XTΓiX − aTi x + bk ≤ 0
≡
{1− qik ≥ xT Γix
(aTi
x−bk)2+xT Γix
aTi x− bk ≥ 0.(37)
In the case of aTi x − bk ≤ 0, the worst case probability is 1, because there exists a feasible two-point
distribution of aTi x with both points less than bk. To allow such possibility, we further introduce a set of
disjunctive constraints. When aTi x− bk ≤ 0, we set qik to 0. Therefore, we have either aTi x≥ bk or qik = 0.
By introducing new variables, we can express the disjunctive constraints as the feasible set:
Xik =
(x, qik) :bkuik ≤ aTi xqik ≤ uikuik ∈ {0,1}
. (38)
Moreover, we linearize the term xj1xj2 with zj1j2 defined in
Z =
(zj1j2 , xj1 , xj2) :
zj1j2 ≤ xj1zj1j2 ≤ xj2xj1 +xj2 − 1≤ zj1j2zj1j2 ≥ 0
. (39)
Lastly, the first inequality in constraint (37) can be expressed as (1 − qik + (aTi x − bk)2 + xTΓix)2 ≥4xTΓix + (1 − qik − (aTi x − bk)2 − xTΓix)2. Since zj1j2 = xj1xj2 in (39), we further linearize the terms
(aTi x)2 and xTΓix as∑
(j1,j2)∈I×I aij1 aij2zj1j2 and∑
(j1,j2)∈I×I σij1j2zj1j2 respectively. Let vik = b2k +∑(j1,j2)∈I×I(aij1 aij2 + σij1j2)zj1j2 − 2bk
∑j∈I aijxj , it is reorganized as
∥∥∥∥1− qik− vik2Γ
12i x
∥∥∥∥2
≤ 1 − qik + vik and
leads to the second-order cone constraint (5).
B.3. Detailed Formulation of the MISOCP (22)
maxxi,qik,N,Ψij
ψij ,ψ′ij ,φij ,λi
∑i∈I
∑k∈K
fQikqik−∑i∈I
gixi + ξ
(∑j∈I
∑i∈I
rtijψij −∑i∈I
∑j∈I
ητijφij −∑i∈I
cλi
)−hN
s.t.∥∥∥∥1− qik− vik2Γ
12i x
∥∥∥∥2
≤ 1− qik + vik,∀i∈ I,∀k ∈K
vik = b2k +∑
(j1,j2)∈I×I
(aij1 aij2 +σij1j2)zj1j2 − 2bk∑j∈I
aijxj ,∀i∈ I,∀k ∈K

Author: Service Region Design for Urban EV Sharing Systems 5
qik ≤ xi,∀i∈ I,∀k ∈K
Ψij = Pijµi∑k∈K
wikqik,∀i, j ∈ I
ψ′
ij ≥ αΨij ,∀i, j ∈ I
ψ′
ij ≤Ψij ,∀i, j ∈ I
ψ′
ij = Pij∑l∈I
ψ′il,∀i, j ∈ I
ψij ≤ψ′ij ,∀i, j ∈ I
ψij ≤ Pijµixj ,∀i, j ∈ I
ψ′ij +Pijµi(xj − 1)≤ψij ,∀i, j ∈ I∑j
ψji +∑j
φji =∑j
ψij +∑j
φij ,∀i∈ I
λi = Pc∑j∈J
ψji,∀i∈ I∑i∈I
α
1−αxi +
∑j∈I
∑i∈I
tijψij +∑i∈I
∑j∈I
τijφij +∑i∈I
tcλi ≤N
(zj1j2 , xj1 , xj2)∈Z,∀j1, j2 ∈ I
(x, qik)∈Xik,∀i∈ I,∀k ∈K
N,qik,ψij ,ψ′
ij ,Ψij , φij , λi ≥ 0,∀i, j ∈ I, k ∈K
xi ∈ {0,1},∀i∈ I.
B.4. Time-varying Travel Pattern
The customer adoption decision depends only on the service region coverage and thus the constraints (3)
and (5)-(7) from the adoption rate model still hold. To deal with time-varying travel patterns, we partition
the day into T periods (indexed by t), within each of which the travel pattern is assumed (approximated) to
be stationary, i.e., represented by P tij and µti for each period t. Let l(t) be the length of period t, the problem
in the presence of time-varying travel patterns, following the pointwise stationary approximation (Green and
Kolesar 1991), is then formulated as:
maxxi,qik,N,Ψ
tij
ψtij ,ψ
′tij ,φ
tij ,λ
ti
∑i∈I
∑k∈K
fQikqik−∑i∈I
gixi + ξ∑t∈T
l(t)
(∑j∈I
∑i∈I
rtijψtij −
∑i∈I
∑j∈I
ητijφtij −
∑i∈I
cλti
)−hN
s.t.
Constraint (3)&(5)− (7)
Ψtij = P t
ijµti
∑k∈K
wikqik,∀i, j ∈ I, t∈ T
ψ′tij ≥ αΨt
ij ,∀i∈ I, t∈ T
ψ′tij ≤Ψt
ij ,∀i, j ∈ I, t∈ T
ψ′tij = P t
ij
∑l∈I
ψ′il,∀i, j ∈ I, t∈ T
ψtij ≤ψ′tij ,∀i, j ∈ I, t∈ T

6 Author: Service Region Design for Urban EV Sharing Systems
ψtij ≤ P tijµ
tixj ,∀i, j ∈ I, t∈ T
ψ′tij +P t
ijµti(xj − 1)≤ψtij ,∀i, j ∈ I, t∈ T∑
j
ψtji +∑j
φtji =∑j
ψtij +∑j
φtij ,∀i∈ I, t∈ T
λti = Pc∑j∈J
ψtji,∀i∈ I, t∈ T
∑i∈I
α
1−αxi +
∑j∈I
∑i∈I
tijψtijl(t)
+∑i∈I
∑j∈I
τijφtijl(t)
+∑i∈I
tcλtil(t)≤N,∀t∈ T
N,qik,ψtij ,ψ
′tij ,Ψ
tij , φ
tij , λ
ti ≥ 0,∀i, j ∈ I,∀k ∈K,∀t∈ T
xi ∈ {0,1},∀i∈ I.
B.5. Proof of Proposition 2
Given a service region design I ′ ⊆ I, let q′ik be the realized adoption rate, e.g. q′ik = Prob(∑
j∈I′ aijxj ≥ bk).
Note that the fleet size constraint (21) is binding, the formulation (22) becomes a linear program below:
maxqik,ψij ,φij
∑i∈I′
∑k∈K
fQikqik−∑i∈I′
gixi + ξ
(∑j∈I′
∑i∈I′
rtijψij −∑i∈I′
∑j∈I′
ητijφij −∑i∈I′
cPc∑j∈I′
ψji
)
−h
(∑i∈I′
α
1−αxi +
∑j∈I′
∑i∈I′
tijψij +∑i∈I′
∑j∈I′
τijφij +∑i∈I′
tcPc∑j∈I′
ψji
)s.t.
qik ≤ q′ik,∀i∈ I ′,∀k ∈K
ψij ≥ αPijµi∑k∈K
wikqik,∀i∈ I ′
ψij ≤ Pijµi∑k∈K
wikqik,∀i, j ∈ I ′
ψij = Pij∑l∈I′
ψil,∀i, j ∈ I ′∑j∈I′
ψji +∑j∈I′
φji =∑j∈I′
ψij +∑j∈I′
φij ,∀i∈ I ′
qik,ψij , φij ≥ 0,∀i, j ∈ I ′,∀k ∈K.
Since the service region design I ′ is given, the terms with xi are constant and can be omitted. We define
an equivalent objective function
H(qik,ψij , φij) =∑i∈I′
∑k∈K
fQikqik +∑j∈I′
∑i∈I′
[(ξr−h)tij −Pc(ξc+htc)]ψij −∑j∈I′
∑i∈I′
(ξη+h)τijφij
=∑i∈I′
∑k∈K
fQikqik +∑j∈I′
∑i∈I′
(uijψij − vijφij)
where uij = (ξr−h)tij −Pc(ξc+htc) and vij = (ξη+h)τij .
Let yik,mij , nij , sij and zi be the dual variables. We write the dual formulation of the above linear program
as
minyik,mij ,nij ,sij ,zi
∑i∈I′
∑k∈K
q′ikyik

Author: Service Region Design for Urban EV Sharing Systems 7
s.t.
fQik +∑j∈I′
(mij −αnij)Pijµiwik ≤ yik,∀i∈ I ′,∀k ∈K (40)
uij −mij +nij +∑l∈I′
Pilsil− sij + zj − zi ≤ 0,∀i, j ∈ I ′ (41)
− vji ≤ zj − zi,∀i, j ∈ I ′ (42)
yik,mij , nij ≥ 0,∀i, j ∈ I ′
From inequalities (41) and (42), we have
uij − vji +∑l∈I′
Pilsil− sij ≤mij −nij ≤mij −αnij ,∀i, j ∈ I ′
⇒∑j∈I′
Pij(uij − vji)≤∑j∈I′
Pij(mij −αnij),∀i∈ I ′
This inequality provides a lower bound to the LHS of constraint (40). That is,
fQik +µiwik∑j∈I′
Pij(uij − vji)≤ yik,∀i∈ I ′,∀k ∈K
To have the adoption rate constraint qik ≤ q′ik tight, we need the associated dual variable yik > 0. Therefore,
by noting that vii = 0, the corresponding sufficient condition is to have
fQik +µiwikPiiuii +µiwik∑j∈I′j 6=i
Pij(uij − vji)> 0,∀i∈ I ′,∀k ∈K.
�
Appendix C: Estimation of Key Parameters
C.1. Utility Parameters
We use the trip distributions that describe customer preferences over destinations as proxies to utility
parameters a. Our study focuses on the 61 candidate zip codes in San Diego County, excluding remote
and military areas. We estimate the origin-destination trip distributions for the 61 candidate zip codes by
extrapolating, using a gravity model, from the Car2Go operations data for the 18 zip codes they currently
cover. The sample daily trips for each origin-destination pair of the 18 zip codes are counted and the outbound
(inbound) trips from (to) each zip code are summarized in Table 4.
Table 4 Sample Daily Outbound(Inbound) Trips in Current Car2Go Service Region
91910 91911 92101 92102 92103 921047.92 (8.19) 3.19 (3.27) 334.04 (335.23) 55.69 (54.77) 144.04 (144.04) 81.69 (80.5)
92105 92106 92107 92108 92109 9211011.23 (10.35) 45.89 (45.65) 54.23 (54.92) 50.77 (51.92) 84.08 (83.96) 44.92 (46)
92111 92113 92115 92116 92120 921230.35 (0.35) 1.23 (1.19) 14.62(14.85) 60.08 (58.73) 1.12 (1.19) 0.12 (0.08)
Table 4 suggests a large variation in trip demands of the 18 zip codes. The majority of the trips were
generated in the downtown San Diego with zip codes 92101 and 92103, while few trip demands are observed

8 Author: Service Region Design for Urban EV Sharing Systems
from zip codes 92111 and 92123. To better capture the demand pattern, we exclude zip codes with very low
demands, e.g., 91911, 92111, 92113, 92120 and 92123, in the estimation of the gravity model, since inclusion
of these outliers led to significantly worse fits.
We first fit a gravity model for the sample trip rates for one-way trips among 18 zip codes (i.e., trips
where origins and destinations are in distinct zip codes). Trips that originate and end within the same zip
code are handled later. Besides the (working-age) population factor in the classic gravity model, we also
test other socioeconomic factors, such as per capita income, business establishments, students enrollments
and workplace population, that may affect the trip distributions. The only statistical significant factors
we find are working-age population and per capita income. Similarly, Wills (1986) integrates income as a
destination-attribute variable in his trip distribution models. Hence, we fit the gravity model for one-way
trips as follows:
Tij = β1
PopiPopjIncβ2i Inc
β3j
distβ4ij(43)
where Popi is the working-age population and Inci is the per capita income in i. The number of trips
generated from i is proportional to Popi while Popj and Incj are indicators of the attractiveness of destination
j.
Let TCar2Goij be the observed trips from Car2Go’s operations data from i to j. The sample daily trip are
adjusted by the current adoption rate (current regular members divided by market size in the current service
region), e.g., TCar2Goij /(Current Adoption Rate). We then apply log-linear regression to Tij and obtain the
gravity model in (43) for the aggregated daily trip distribution below with adjusted R-squared of 0.7515 and
residual standard error of 0.9227.
Tij = exp(−62.212)PopiPopjInc
2.253i Inc2.249
j
dist2.013ij
. (44)
For trips that begin and end within the same zip code (round trips), we fit the following model using the
same socialeconomic factors as independent variables:
Tii = β1PopiIncβ2i .
The fitted model, as shown below, has adjusted R-squared of 0.7845 and residual standard error:
Tii = exp(−43.194)PopiInc3.413i . (45)
With the residual standard errors provided by the regressions, we randomly generate 1000 sample trip
distributions for the 61 candidate zip codes using gravity models in (44) and (45). In each sample n, the
sample utility parameter anij is estimated by normalizing the outbound trips by their destinations:
anij =T nij∑j∈I T
nij
.
The mean of utility parameter, aij , is then calculated as the sample average of anij . We also construct the
estimated diagonal covariance matrix Γi for each i with σ2ij set to be sample variance of anij for all origin i
and destination j.
Lastly, the outbound demand rate µi is estimated by averaging the total outbound trips µni =∑
j∈I Tnij
over all samples. The average travel speed in San Diego is assumed to be 31 mph (John Kleint 2016) for
conversion of travel time to travel distance as dij(mile) = tij(min)× 31(mph)
60(min/h).

Author: Service Region Design for Urban EV Sharing Systems 9
C.2. Adoption Requirement
The aspirational level b is evaluated based on the mode choice data in CHTS. We summarize the mode choice
distribution in 4 categories: non-moto (including walking and cycling, etc.), private car (including driver,
passenger, car rental and carpool, etc,.), bus (including bus and shuttle, etc.), and rail (including subways and
light rail, etc.). We focus on motorized trips, and group bus and rail modes to public transportation. Using
K-means clustering approach (e.g., Hartigan and Wong (1979)), we group the individuals into 3 clusters with
different mode choice distributions as shown in Table 5.
Table 5 Mode Choice Distribution
Group Car Public1 0.01 0.992 0.53 0.473 1.00 0.00
For instance, the potential travelers from Group 2 choose to drive for 53% of their trips. We hence set
b = 53% for these customers, i.e., they would be willing to switch to car sharing if it covers at least 53%
of their travel needs. After adoption, customers will use car sharing service regularly with destinations that
are in the service region. Following the same reasoning, Groups 1 and 3 are not target segments for Car2Go
because these customers either never drive or rely too much on their own cars that they would require 100%
service coverage. As a result, the target Group 2 account for 4.05% of the entire population and we set
Qik = 20%× 4.05%×Popi, where Popi is the population in area i, by assuming 20% local market share in
car sharing business. Due to the limited sample sizes at zip code level, we assume all zip codes share the
same mode choice distribution.
C.3. Coverage Costs
The fixed coverage cost associated with serving region i includes investments in charging infrastructure,
in partnership with charging service providers. As planned in 2011, Car2Go’s fleet in San Diego can be
recharged at 1000 Blink EV charging stations (Engadget 2014). We use the EV charging station data from
U.S. Department of Energy (2014a) to estimate the number of chargers required in each zip code to support
the EV sharing system. For each zip code in the current service region, we compute the charger density
(CD) by dividing the number of chargers (CG) with the land area (LA). From linear regression with various
socialeconomic factors, we find that number of business establishment (BE) is the only significant factor to
CD with the fitted model as below
CDi = 3.19 exp(−11)BEi.
The number of chargers needed for each candidate area is then approximated by
CGi = max{CDi,0}×LAi.
Suppose the investment in each charger by Car2Go through partnership with Blink is hc (e.g., $800, about
half of the typical cost to install a household Level 2 charger in California (California Plug-in Electric Vehicle
Collaborative 2016)), then the coverage cost for region i follows gi = hcCGi.

10 Author: Service Region Design for Urban EV Sharing Systems
Appendix D: Heuristic Formulation
D.1. H1 Formulation
The heuristic H1 solves the following mixed integer program based on a stylized view on adoption behavior
(assuming qs = b):
maxxi,N,Ψij
ψij ,ψ′ij ,φij ,λi
∑i∈I
fQiqs−∑i∈I
gixi + ξ
(∑j∈I
∑i∈I
rtijψij −∑i∈I
∑j∈I
ητijφij −∑i∈I
cλi
)−hN
s.t.
Constraint (9)− (21)
Ψij = µiPijqs,∀i∈ I, j ∈ J
N,ψij ,ψ′
ij ,Ψij , φij , λi ≥ 0
xi ∈ {0,1},∀i∈ I.
D.2. H2 Formulation
The heuristic H2 solves the following mixed integer SOCP formulated based on a stylized view on fleet
operations:
maxxi,qi,N,Ψij
ψij ,ψ′ij ,φij ,λi
∑i∈I
fQiqi−∑i∈I
gixi + ξ
(∑j∈I
∑i∈I
rtijψij −∑i∈I
∑j∈I
ητijφij −∑i∈I
cλi
)−hN
s.t.
Constraint (3)&(5)− (19)
N = t×∑i∈I
xiµiqi
N,ψij ,ψ′ij ,Ψij , φij , λi ≥ 0
xi ∈ {0,1},∀i∈ I.
D.3. H3 Formulation
The heuristic H3 solves the following mixed integer program formulated based on a stylized view on both
adoption behavior and fleet operations:
maxxi,N,Ψij
ψij ,ψ′ij ,φij ,λi
∑i∈I
fQiqs−∑i∈I
gixi + ξ
(∑j∈I
∑i∈I
rtijψij −∑i∈I
∑j∈I
ητijφij −∑i∈I
cλi
)−hN
s.t.
Constraint (9)− (19)
Ψij = µiPijqs,∀i∈ I, j ∈ J
N = t×∑i∈I
xiµiqi
N,ψij ,ψ′
ij ,Ψij , φij , λi ≥ 0
xi ∈ {0,1},∀i∈ I.