Service Learning Dr. Albrecht. Presenting Results 0 The following power point slides contain...
31
Service Service Learning Learning Dr. Albrec ht
-
Upload
julius-hopkins -
Category
Documents
-
view
213 -
download
0
Transcript of Service Learning Dr. Albrecht. Presenting Results 0 The following power point slides contain...

Service LearningService Learning
Dr. Albrecht

Presenting Results 0The following power point slides contain examples of how
information from evaluation research can be presented to audiences.
0Please note that all of the data was collected in one evaluation project.
0Examples include0 Descriptive tables0 Graphs0 Quotes taken from focus groups0 Anova tables0 Multiple regression tables

Table 33. Evaluation of the Table 33. Evaluation of the Impact of Service Learning Activities in the Following Areas Impact of Service Learning Activities in the Following Areas as as Perceived by the Service Learning Perceived by the Service Learning CoordinatorsCoordinators in 54 Texas Service Learning Programs in 54 Texas Service Learning Programs
NumberNumber PercentPercent
Academic Performance of ParticipantsAcademic Performance of Participants PositivePositive
5050 92.6092.60
Habits of Participants (i.e., attendance, Habits of Participants (i.e., attendance, involvement in school activities)involvement in school activities)
PositivePositive4747 92.1692.16
Civic Engagement of ParticipantsCivic Engagement of Participants PositivePositive 5050 94.3494.34
Efforts to Make Service Learning a Permanent Efforts to Make Service Learning a Permanent Part of InstitutionPart of Institution
PositivePositive
4949
92.4592.45
Organizations That Were ServedOrganizations That Were Served PositivePositive 5151 94.4494.44

Table 34. Descriptive Statistics for Elementary and Middle/High School Service Learning Table 34. Descriptive Statistics for Elementary and Middle/High School Service Learning Teachers:Teachers: Extent to Which Teachers Agree with the Following Statements about the Extent to Which Teachers Agree with the Following Statements about the Impact of Service Learning in Their ClassroomImpact of Service Learning in Their Classroom
ElementaryElementary Middle/High SchoolMiddle/High School
NumberNumber PercentPercent NumberNumber PercentPercent
Positive Addition to Classroom LearningPositive Addition to Classroom Learning Agree/Strongly AgreeAgree/Strongly Agree
Beneficial for the ALL StudentsBeneficial for the ALL Students Agree/Strongly AgreeAgree/Strongly Agree
Motivates Students to be InvolvedMotivates Students to be Involved Agree/Strongly AgreeAgree/Strongly Agree
Helps Students Learn CurriculumHelps Students Learn Curriculum Disagree/Strongly DisagreeDisagree/Strongly Disagree Neither Agree nor DisagreeNeither Agree nor Disagree Agree/Strongly AgreeAgree/Strongly Agree
3636
3838
3535
2212122626
90.0090.00
95.0095.00
87.5087.50
5.005.0030.0030.0065.0065.00
2727 2727 2424 11 66 2121
96.4396.43
96.4396.43
88.8988.89
3.573.5721.4321.4375.0075.00

Table 36: Descriptive Statistics: Identification and Description of Factors Related Table 36: Descriptive Statistics: Identification and Description of Factors Related to to the Success of Service Learning the Success of Service Learning by Middle/High School and Elementary by Middle/High School and Elementary Service Learning TeachersService Learning Teachers
ElementaryElementary Middle/High SchoolMiddle/High School
NumberNumber PercentPercent NumberNumber PercentPercent
Benefits for StudentsBenefits for Students Service to OthersService to Others Understanding of OthersUnderstanding of Others Personal GrowthPersonal Growth Applying InformationApplying Information
2121 88 77----
58.3358.3322.2222.2219.4419.44----
1616 44 44 44
57.1457.1414.2914.2914.2914.2914.2914.29
Benefits for TeachersBenefits for Teachers Service to OthersService to Others Involvement with StudentsInvolvement with Students Can See Growth in StudentsCan See Growth in Students Sense of AccomplishmentSense of Accomplishment
1111 991212----
34.3834.3828.1328.1337.5037.50
----
22 881010 77
7.147.1428.5728.5735.7135.7125.0025.00

Table 35. Descriptive Statistics for Elementary and Middle/High School Service Learning Table 35. Descriptive Statistics for Elementary and Middle/High School Service Learning Teachers: Extent to Which Teachers: Extent to Which TeachersTeachers Agree with the Following Statements about the Agree with the Following Statements about the Impact of Service Learning in Their ClassroomImpact of Service Learning in Their Classroom
ElementaryElementary Middle/High SchoolMiddle/High School
NumberNumber PercentPercent NumberNumber PercentPercent
Difficult to Relate to Subject TaughtDifficult to Relate to Subject Taught Disagree/Strongly DisagreeDisagree/Strongly Disagree Interferes with AcademicsInterferes with Academics Disagree/Strongly DisagreeDisagree/Strongly Disagree Neither Agree Nor DisagreeNeither Agree Nor Disagree Agree/Strongly AgreeAgree/Strongly Agree
Takes Too Much Time From ClassTakes Too Much Time From Class Disagree/Strongly DisagreeDisagree/Strongly Disagree
Overall Costs Exceed BenefitsOverall Costs Exceed Benefits Disagree/Strongly DisagreeDisagree/Strongly Disagree Neither Agree Nor DisagreeNeither Agree Nor Disagree Agree/Strongly AgreeAgree/Strongly Agree
Students Show Little InterestStudents Show Little Interest Disagree/Strongly DisagreeDisagree/Strongly Disagree
2525
3030 77 33
2929
2323 88 99
3232
62.5062.50
75.0075.0017.5017.50 7.507.50
72.5072.50
57.5057.5020.0020.0022.5022.50
80.0080.00
2020
002424 44
2222
2323 11 44
2424
71.4371.43
0.000.0085.7185.7114.2914.29
78.5778.57
82.1482.14 3.573.5714.2914.29
85.7185.71

Table 31a. Descriptive Statistics For Elementary and Middle/High School Service Table 31a. Descriptive Statistics For Elementary and Middle/High School Service Learning Learning TeachersTeachers: Extent to Which Teachers Agree the Following Factors Would : Extent to Which Teachers Agree the Following Factors Would be be Helpful for Future Projects Helpful for Future Projects
ElementaryElementary Middle/High SchoolMiddle/High School
NumberNumber PercentPercent NumberNumber PercentPercent
More Training for TeachersMore Training for Teachers Agree/Strongly AgreeAgree/Strongly Agree
More Training For Student LeadersMore Training For Student Leaders Agree/Strongly AgreeAgree/Strongly Agree
More Motivational Incentives for StudentsMore Motivational Incentives for Students Agree/Strongly AgreeAgree/Strongly Agree
More Rewards/Incentives for Teachers More Rewards/Incentives for Teachers Agree/Strongly AgreeAgree/Strongly Agree
2727
2828
2626
2222
64.2964.29
66.6766.67
61.9061.90
52.3852.38
1919
2626
1818
1919
67.8667.86
92.8692.86
64.2964.29
67.8667.86

Table 31b. Descriptive Statistics For Elementary and Middle/High School Service Table 31b. Descriptive Statistics For Elementary and Middle/High School Service Learning Teachers: Extent to Which Teachers Agree the Following Factors Would be Learning Teachers: Extent to Which Teachers Agree the Following Factors Would be Helpful For Future ProjectsHelpful For Future Projects
ElementaryElementary Middle/High SchoolMiddle/High School
NumberNumber PercentPercent NumberNumber PercentPercent
More Class TimeMore Class Time Agree/Strongly AgreeAgree/Strongly Agree
More IdeasMore Ideas Agree/Strongly AgreeAgree/Strongly Agree
More Time to PrepareMore Time to Prepare Agree/Strongly AgreeAgree/Strongly Agree
Better Instructions for Incorporation Better Instructions for Incorporation Agree/Strongly AgreeAgree/Strongly Agree
Better Instructions to Contact AgenciesBetter Instructions to Contact Agencies Agree/Strongly AgreeAgree/Strongly Agree
More Material ResourcesMore Material Resources Agree/Strongly AgreeAgree/Strongly Agree
2727
2929
2929
2626
2424
2626
64.2964.29
69.0569.05
69.0569.05
61.9061.90
57.1457.14
61.9061.90
2323
1818
2222
1818
1616
1515
82.1482.14
64.2964.29
78.5778.57
64.2964.29
57.1457.14
53.5753.57

Table 32: Descriptive Statistics: Identification and Description of Factors Related Table 32: Descriptive Statistics: Identification and Description of Factors Related to the Success of Service Learning by Middle/High School and Elementary Service Learning Teachersto the Success of Service Learning by Middle/High School and Elementary Service Learning Teachers
ElementaryElementary Middle/High SchoolMiddle/High School
NumberNumber PercentPercent NumberNumber PercentPercent
Recommended ChangesRecommended Changes More ResourcesMore Resources Integration into CurriculumIntegration into Curriculum Better CommunicationBetter Communication Wide InvolvementWide Involvement Emphasize BenefitsEmphasize Benefits No Change No Change
1313 22 11 11 33 22
59.0959.09 9.099.09 4.554.55 4.554.5513.6413.64 9.099.09
1717 44 11 55---- 33
53.5753.5714.2914.29 3.573.5717.8617.86
----10.7110.71
Factors that Would Make It EasierFactors that Would Make It Easier More ResourcesMore Resources Integration into CurriculumIntegration into Curriculum Support for AdministrationSupport for Administration NothingNothing Better CommunicationBetter Communication
2424 22 22 44----
75.0075.00 6.266.26 6.266.2612.5012.50
----
1717 33 44---- 22
65.3865.3811.5411.5415.3815.38
---- 7.697.69

Table 28. Descriptive Statistics for 18 Sub-grantee Service Table 28. Descriptive Statistics for 18 Sub-grantee Service Learning Schools/Districts; Percent of Service Learning Learning Schools/Districts; Percent of Service Learning Coordinators Coordinators Who Evaluated the Following Factors as Who Evaluated the Following Factors as Challenges Faced In Implementing Challenges Faced In Implementing The Service Learning The Service Learning Program Program
NumberNumber Percent YesPercent Yes
TransportationTransportationScheduling Scheduling ResourceResourceCoordinationCoordinationPartnersPartnersCommunity SupportCommunity SupportParent SupportParent SupportStudent SupportStudent SupportTeacher SupportTeacher SupportAdministration SupportAdministration SupportBoard SupportBoard SupportTeacher TimeTeacher TimeSubstituteSubstituteFundingFundingPaperwork/BureaucracyPaperwork/BureaucracyOther ChallengesOther Challenges
661212 55 99 22 33 33 11 99 77 1112 12 22 22 77 33
33.3333.3366.6766.6727.7827.7850.0050.0011.1111.1116.6716.6716.6716.67 5.565.5650.0050.0038.8938.89 5.565.5666.6766.6711.1111.1111.1111.1138.8938.8916.6716.67

Quotes by Students0One student claimed that “It (Service Learning) makes the
learning real.” Another student agreed claming that “Projects (are) no longer just assignments, now (they) also have intrinsic value.”
0As one student put it, “The students become excited and take over and become the leaders.”

Quotes by Teachers
0One teacher believed that Service Learning “brings out the best in students, even in things they don’t realize they were good at.” Another teacher stated that “Service Learning is one of the best ways to teach my kids.”
0Another teacher believed that “teachers must be passionate to motivate students.”
0A teacher agreed, “Ownership of the projects makes students care more because they don’t like being told what to do.”

Table 50. Descriptive Statistics for Table 50. Descriptive Statistics for ElementaryElementary School Service Learning Students; School Service Learning Students; Evaluation of Their School ExperienceEvaluation of Their School Experience
Pre-TestPre-Test Post-TestPost-Test
NumberNumber PercentPercent NumberNumber PercentPercent
I Can Make a Difference I Can Make a Difference Disagree/Strongly DisagreeDisagree/Strongly Disagree Agree/Strongly AgreeAgree/Strongly Agree
172172 510510
25.2225.2274.7874.78
177177515515
25.5825.5874.4274.42
What I Learn In School Is ImportantWhat I Learn In School Is Important Disagree/Strongly DisagreeDisagree/Strongly Disagree Agree/Strongly AgreeAgree/Strongly Agree
2424
669669 3.463.4696.5496.54
2020676676
2.982.9897.1297.12
I Can Find Information To Solve ProblemsI Can Find Information To Solve Problems Disagree/Strongly DisagreeDisagree/Strongly Disagree Agree/Strongly AgreeAgree/Strongly Agree
154154 526526
22.6522.6577.3577.35
123123574574
17.6517.6582.3582.35
I Am Good At Leading A Group ProjectI Am Good At Leading A Group Project Disagree/Strongly DisagreeDisagree/Strongly Disagree Agree/Strongly AgreeAgree/Strongly Agree
225225 454454
33.1333.1366.8666.86
271271421421
39.1639.1660.8360.83
*Wording was changed from positive to negative as a validity check.*Wording was changed from positive to negative as a validity check.**Check for pre and post**Check for pre and post

Table 40. Descriptive Statistics of Elementary Service Learning Students; Table 40. Descriptive Statistics of Elementary Service Learning Students; Attitudes Toward School as Reported on the Pre-Test SurveyAttitudes Toward School as Reported on the Pre-Test Survey
NumberNumber PercentPercent
I Enjoy Learning In The ClassroomI Enjoy Learning In The Classroom Disagree/Strongly DisagreeDisagree/Strongly Disagree Agree/Strongly AgreeAgree/Strongly Agree
9090598598
13.0813.0886.9286.92
What I Learn is Important for my FutureWhat I Learn is Important for my Future Disagree/Strongly DisagreeDisagree/Strongly Disagree Agree/Strongly AgreeAgree/Strongly Agree
3333965965
3.303.3096.7096.70
I Can Use What I Learn In the Classroom To Help I Can Use What I Learn In the Classroom To Help OthersOthers
Disagree/Strongly DisagreeDisagree/Strongly Disagree Agree/Strongly AgreeAgree/Strongly Agree
5656637637
8.088.0891.9291.92
I Can Find Information to Solve ProblemsI Can Find Information to Solve Problems Disagree/Strongly DisagreeDisagree/Strongly Disagree Agree/Strongly AgreeAgree/Strongly Agree
218218 765765
22.1822.1877.8277.82
Children are Too Young To Volunteer In The Children are Too Young To Volunteer In The CommunityCommunity
Disagree/Strongly DisagreeDisagree/Strongly Disagree Agree/Strongly AgreeAgree/Strongly Agree
545545 131131
80.6280.6219.3819.38

32%
6%
15%
47%
17%
49%
10%
24%
0.00%
10.00%
20.00%
30.00%
40.00%
50.00%
60.00%
70.00%
80.00%
90.00%
100.00%
StronglyDisagree
Disagree Agree StronglyAgree
Can
Cannot
(p<0.0001)
CHART 6. Elementary Students’ Perception of the Level to Which They Agree They Can Make a Difference in Their Neighborhood or Town, by Those Who Can and Cannot Tell Someone Else What Their Class Did for a Service Learning Project this Year.
CHART 8. Elementary Students’ Perception of the Level to Which They Agree They Believe They are Good at Getting Others to Listen to Their Ideas by Those Who Can and Cannot Tell Someone Else What Their Class Did for a Service Learning Project this Year.
(p 0.004)

CHART 9. Elementary Students’ Perception of the Level to Which They Agree They Believe They are Good at Speaking in Front of Groups of People, by Those who Can and Cannot Tell Someone Else What Their Class Did for a Service Learning Project this Year.
26%17%
27% 29%20%
26%28% 25%
0.00%10.00%20.00%30.00%40.00%50.00%60.00%70.00%80.00%90.00%
100.00%
StronglyDisagree
Disagree Agree StronglyAgree
Can
Cannot
(p 0.003)
CHART 13. Elementary Students’ Perception of the Level to Which They Agree They Want to be Involved in Service Learning Next Year by Those Who Can and Cannot Tell Someone Else What Their Class Did for a Service Learning Project this Year
(p<0.0001)

CHART 14. Elementary Students’ Perception of the Level to Which They Agree The Project Helped Them Better Understand Things in Class, by Those Who Can and Cannot Tell Someone Else What Their Class Did for a Service Learning Project this Year
42%
3%10%
46%
27%
37%
13%22%
0.00%10.00%20.00%
30.00%40.00%50.00%60.00%70.00%
80.00%90.00%
100.00%
StronglyDisagree
Disagree Agree StronglyAgree
Can
Cannot
(p<0.0001)

CHART 13. High School Students’ Perception of How Good They are at Speaking in Front of Groups, by Whether or Not Students Completed at Least Four Hours of Service Learning
(p 0.0002)
CHART 14. High School Students’ Perception of How Good They are at Leading Groups, by Whether or Not Students Completed at Least Four Hours of Service Learning
(p 0.009)

18%13%
37%32% 29%
33%
9%
29%
0.00%
10.00%
20.00%
30.00%
40.00%
50.00%
60.00%
70.00%
80.00%
90.00%
100.00%
StronglyDisagree
Disagree Agree Strongly Agree
Less than 4
4 or more
CHART 15. High School Students’ Perception of How Good They are at Being a Leader at School, by Whether or Not Students Completed at Least Four Hours of Service Learning
(p 0.0003)
CHART 16. High School Students’ Perception of the Level to Which They Agree That the Things They learn are Important for their future, by Whether or Not Students Completed at Least Four Hours of Service Learning
(p 0.003)

CHART 18. High School Students’ Perception of the Level to Which They Agree That School Work in Meaningful, by Whether or Not Students Completed at Least Four Hours of Service Learning
9%11%
37%43%
12%
55%
8%
25%
0.00%
10.00%20.00%
30.00%
40.00%50.00%
60.00%
70.00%
80.00%90.00%
100.00%
StronglyDisagree
Disagree Agree Strongly Agree
Less than 4
4 or more
(p<0.0001)
CHART 19. High School Students’ Perception of How Good They are at Finding Resources, by Whether or Not Students Completed at Least Four Hours of Service Learning
(p 0.005)

CHART 21. High School Students’ Perception of How Good They are at Finding Useful Information, by Whether or Not Students Completed at Least Four Hours of Service Learning
19%
6%
31%
44%
27%
49%
3%
21%
0.00%
10.00%
20.00%
30.00%
40.00%
50.00%
60.00%
70.00%
80.00%
90.00%
100.00%
StronglyDisagree
Disagree Agree Strongly Agree
Less than 4
4 or more
(p<0.0001)

Table 53. Percent Rating Their Skills as Very Good or Excellent in Terms of Their Ability to Use Table 53. Percent Rating Their Skills as Very Good or Excellent in Terms of Their Ability to Use
Various Resources to Solve Problems by Varying Levels of Participation as Reported by Service Various Resources to Solve Problems by Varying Levels of Participation as Reported by Service Learning Middle/High School Service Learning Students on the Pre- and Post-Test SurveysLearning Middle/High School Service Learning Students on the Pre- and Post-Test Surveys
Pre-TestPre-Test Post-TestPost-Test ChangeChange
Finding Useful Information to Solve ProblemsFinding Useful Information to Solve Problems Less than 4 hours*Less than 4 hours* 4 or more hours**4 or more hours** 11 or more hours***11 or more hours***
67.63%67.63%76.79%76.79%70.30%70.30%
64.71%64.71%77.15%77.15%73.27%73.27%
-2.92% -2.92% .36%.36%+2.97%+2.97%
Finding Resources in the Community to Solve ProblemsFinding Resources in the Community to Solve Problems Less than 4 hours*Less than 4 hours* 4 or more hours**4 or more hours** 11 or more hours***11 or more hours***
42.08%42.08%46.51%46.51%45.10%45.10%
44.84%44.84%51.24%51.24%53.54%53.54%
+2.76%+2.76% +4.73%+4.73% +8.44%+8.44%
Solve ProblemsSolve Problems Less than 4 hours*Less than 4 hours* 4 or more hours**4 or more hours** 11 or more hours***11 or more hours***
73.39%73.39%78.05%78.05%78.57%78.57%
72.52%72.52%78.83%78.83%80.00%80.00%
-.87%-.87%
+0.78%+0.78% +1.43%+1.43%
Looking at Media Sources to Solve ProblemsLooking at Media Sources to Solve Problems Less than 4 hours*Less than 4 hours* 4 or more hours**4 or more hours** 11 or more hours***11 or more hours***
43.45%43.45%45.11%45.11%42.57%42.57%
46.95%46.95%52.65%52.65%47.52%47.52%
+3.50%+3.50% +7.54%+7.54% +4.95%+4.95%
Using What I learn in School to Solve Problems Using What I learn in School to Solve Problems
Less than 4 hours*Less than 4 hours* 4 or more hours**4 or more hours** 11 or more hours***11 or more hours***
38.96%38.96%46.22%46.22%51.96%51.96%
41.28%41.28%56.23%56.23%58.42%58.42%
+2.32%+2.32%+10.01%+10.01% +6.46%+6.46%
*Only students who spent less than 4 hours in Service Learning*Only students who spent less than 4 hours in Service Learning**Only students who spent at least 4 hours in Service Learning**Only students who spent at least 4 hours in Service Learning***Only students who spent at least 11 hours in Service Learning***Only students who spent at least 11 hours in Service Learning

Table 54. Percent Rating Their Skills as Very Good or Excellent in Terms of Their Table 54. Percent Rating Their Skills as Very Good or Excellent in Terms of Their Leadership Abilities by Varying Levels of Participation as Reported by Service Leadership Abilities by Varying Levels of Participation as Reported by Service Learning Learning Middle/High School Service Learning Students Middle/High School Service Learning Students on the Pre- and Post-Test on the Pre- and Post-Test SurveysSurveys
Pre-TestPre-Test Post-TestPost-Test ChangeChange
Being a Leader at SchoolBeing a Leader at School Less than 4 hours*Less than 4 hours* 4 or more hours**4 or more hours** 11 or more hours***11 or more hours***
49.28%49.28%57.49%57.49%69.31%69.31%
52.01%52.01%59.89%59.89%57.00%57.00%
+2.73%+2.73% +2.40%+2.40% -12.31%-12.31%
Speaking in Front of GroupsSpeaking in Front of Groups Less than 4 hours*Less than 4 hours* 4 or more hours**4 or more hours** 11 or more hours***11 or more hours***
40.04%40.04%43.97%43.97%41.18%41.18%
39.58%39.58%50.42%50.42%56.00%56.00%
-.46%-.46% +6.45%+6.45%+14.82%+14.82%
Getting Others to Listen to My IdeasGetting Others to Listen to My Ideas Less than 4 hours*Less than 4 hours* 4 or more hours**4 or more hours** 11 or more hours***11 or more hours***
62.19%62.19%65.86%65.86%65.69%65.69%
62.84%62.84%67.77%67.77%67.68%67.68%
+0.65%+0.65%
+1.91%+1.91% +1.99%+1.99%
Understanding What Others SayUnderstanding What Others Say Less than 4 hours*Less than 4 hours* 4 or more hours**4 or more hours** 11 or more hours***11 or more hours***
77.92%77.92%81.35%81.35%79.00%79.00%
78.24%78.24%82.97%82.97%80.29%80.29%
+.32%+.32%+1.62%+1.62%+1.29%+1.29%
Leading a Group ProjectLeading a Group Project Less than 4 hours*Less than 4 hours* 4 or more hours**4 or more hours** 11 or more hours***11 or more hours***
54.89%54.89%59.41%59.41%56.86%56.86%
55.51%55.51%63.39%63.39%62.38%62.38%
+.62%+.62%
+3.98%+3.98% +5.52%+5.52%
*All students who participated in Service Learning*All students who participated in Service Learning**Only students who served at least 4 hours in Service Learning**Only students who served at least 4 hours in Service Learning***Only students who served at least 11 hours in Service Learning***Only students who served at least 11 hours in Service Learning

Table 55. Average Number of Hours Spent in a Service Learning ProjectTable 55. Average Number of Hours Spent in a Service Learning Projectfor for Elementary Elementary Service Learning Students Who Agree Compared to Those WhoService Learning Students Who Agree Compared to Those WhoDisagree With the Following StatementsDisagree With the Following Statements
Mean Hours Spent on Service Mean Hours Spent on Service Learning ProjectLearning Project
DisagreeDisagree AgreeAgree
I Can Stand up for Myself without Putting Others DownI Can Stand up for Myself without Putting Others DownI Can Get Others to Listen to IdeasI Can Get Others to Listen to IdeasI Can Speak in Front of OthersI Can Speak in Front of OthersI Can Find Information to Solve ProblemI Can Find Information to Solve ProblemI Like Being At SchoolI Like Being At SchoolI Can Lead a Group ProjectI Can Lead a Group ProjectI Believe Project Helps Me Better Understand ClassI Believe Project Helps Me Better Understand ClassI Would Like to Be Involved Next YearI Would Like to Be Involved Next YearI Can Make Difference in Town/NeighborhoodI Can Make Difference in Town/NeighborhoodSchool Is Important For The FutureSchool Is Important For The Future
46.6046.6045.1645.1651.0951.09
43.63*43.63*50.51 50.51
43.63* 43.63* 35.16** 35.16** 34.84** 34.84** 37.17**37.17**
41.3941.39
51.3451.3454.8654.8647.22 47.22 56.68*56.68*
48.8648.8656.68* 56.68* 60.10** 60.10** 63.57** 63.57** 59.32**59.32**
52.4552.45
* p <.05 ** p <.0001* p <.05 ** p <.0001Please Note: Hours were reported by teachersPlease Note: Hours were reported by teachers

CHART 2. High School Students’ Perception of How Good They are at Speaking in Front of Groups, by Whether or Not Students Made Decisions About Service Learning Projects
20%16%
35%28%
18%22%26%
33%
0.00%10.00%20.00%30.00%40.00%50.00%
60.00%70.00%80.00%90.00%
100.00%
StronglyDisagree
Disagree Agree Strongly Agree
Did
Did Not
(p 0.0006)
CHART 3. High School Students’ Perception of How Good They are at Getting Others to List to Their Ideas by Whether or Not Students Made Decisions About Service Learning Projects
(p 0.011)

77%
1% 2%
20%
62%
29%
3% 6%
0.00%
10.00%
20.00%
30.00%
40.00%
50.00%
60.00%
70.00%
80.00%
90.00%
100.00%
StronglyDisagree
Disagree Agree Strongly Agree
Did
Did Not
CHART 4. High School Students’ Perception of the Level to Which They Agree That They Will Definitely Graduate from College, by Whether or Not Students Made Decisions About Service Learning Projects
(p<0.0001)
CHART 10. High School Students’ Perception of How Good They are at Solving Problems, by Whether or Not Students Made Decisions About Service Learning Projects
(p 0.0007)

CHART 11. High School Students’ Perception of How Good They are at Finding Useful Information, by Whether or Not Students Made Decisions About Service Learning Projects
24%
3%
25%
48%
19%
44%
8%
29%
0.00%10.00%20.00%30.00%40.00%50.00%60.00%70.00%80.00%90.00%
100.00%
StronglyDisagree
Disagree Agree StronglyAgree
Did
Did Not
(p 0.0008)

Table 57. Mean Index Scores by Student Participation in Service Learning Table 57. Mean Index Scores by Student Participation in Service Learning Activities as Reported by Activities as Reported by Middle/High School Middle/High School Service Learning StudentsService Learning Students
Students Made DecisionsStudents Made Decisions
YesYes NoNo
Attitudes Toward Attending CollegeAttitudes Toward Attending CollegeAttitudes Toward SchoolAttitudes Toward SchoolProblem Solving SkillsProblem Solving SkillsLeadership SkillsLeadership Skills
7.34***7.34***14.60**14.60**
11.22***11.22***10.89**10.89**
6.79***6.79***14.13**14.13**
10.46***10.46***10.34**10.34**
Students Worked Four Hours or Students Worked Four Hours or MoreMore
YesYes NoNo
Attitudes Toward Attending CollegeAttitudes Toward Attending CollegeAttitudes Toward SchoolAttitudes Toward SchoolProblem Solving SkillsProblem Solving SkillsLeadership SkillsLeadership Skills
7.117.11 14.73**14.73**
11.09***11.09*** 11.29***11.29***
7.037.03 14.14**14.14**
10.27***10.27*** 10.55***10.55***
Student Participated in ProjectsStudent Participated in Projects
One or LessOne or Less More than OneMore than One
Attitudes Toward Attending CollegeAttitudes Toward Attending CollegeAttitudes Toward SchoolAttitudes Toward SchoolProblem Solving SkillsProblem Solving SkillsLeadership Skills Leadership Skills
6.92**6.92** 14.14*14.14* 10.54**10.54** 10.27**10.27**
7.14**7.14**14.51*14.51*
10.98**10.98** 10.78**10.78**
* p< .05 **p< 0.01 ***p< 0.0001* p< .05 **p< 0.01 ***p< 0.0001

Table 58. Regression Indices Measuring Possible Outcomes of Service Learning by TeachersTable 58. Regression Indices Measuring Possible Outcomes of Service Learning by Teachers ’’ Attitude; Structural Characteristics of the Service Learning Program or Project and StudentsAttitude; Structural Characteristics of the Service Learning Program or Project and Students ’’ Self Self Reported Behavior and AttitudesReported Behavior and Attitudes
Problem Problem SolvingSolving
LeadershipLeadershipSkillsSkills
Likes Likes SchoolSchool
AttendAttendCollegeCollege
Standardized estimateStandardized estimate
TeacherTeacher’’s Attitude About Projects Attitude About ProjectStudentStudent’’s Predicted Grades Predicted GradeHours Spent on Service ProjectHours Spent on Service ProjectStudent - Number of Volunteer ExperiencesStudent - Number of Volunteer ExperiencesTotal Service Learning Participants in DistrictTotal Service Learning Participants in DistrictLevel of Community Partner InvolvementLevel of Community Partner InvolvementQuality of Relationships with TeachersQuality of Relationships with TeachersPerception that Adult Take Ideas SeriouslyPerception that Adult Take Ideas SeriouslyPerceived Parental EncouragementPerceived Parental EncouragementAverage Grades as Reported by StudentAverage Grades as Reported by StudentNumber of Reflection ActivitiesNumber of Reflection ActivitiesAttitude Toward ParentsAttitude Toward Parents’’ Involvement InvolvementGrade Level of StudentGrade Level of StudentNumber of Service Projects CompletedNumber of Service Projects CompletedIf Student Felt He/She Chose ProblemIf Student Felt He/She Chose ProblemInterceptIntercept
0.09*0.09* 0.10*0.10* 0.11**0.11** 0.19***0.19*** 0.25***0.25*** 0.12**0.12** 0.13**0.13** 0.19***0.19*** ---- ---- ---- ---- ---- ---- ---- 0.000.00
---- ---- 0.12**0.12** 0.15***0.15*** 0.15***0.15*** ---- 0.19***0.19*** 0.09*0.09* 0.13**0.13** 0.15***0.15*** 0.08*0.08* ---- ---- ---- ---- 0.000.00
---- ---- ---- ---- ---- 0.08*0.08* 0.34***0.34*** ---- 0.12**0.12** ---- 0.12**0.12** 0.15***0.15*** -0.09**-0.09** ---- ---- 0.000.00
---- ---- ---- ---- ---- ---- ---- 0.15**0.15** 0.15**0.15** 0.23***0.23*** ---- ---- ---- -0.14**-0.14** 0.16**0.16** 0.000.00
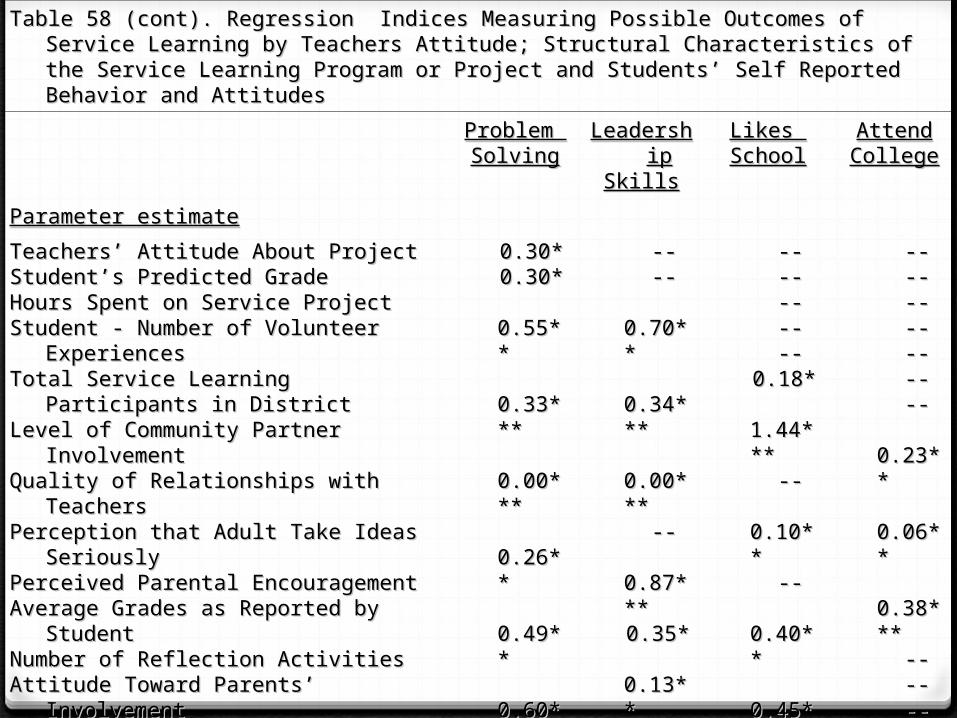
Table 58 (cont). Regression Indices Measuring Possible Outcomes of Service Learning by Teachers Attitude; Table 58 (cont). Regression Indices Measuring Possible Outcomes of Service Learning by Teachers Attitude; Structural Characteristics of the Service Learning Program or Project and StudentsStructural Characteristics of the Service Learning Program or Project and Students ’’ Self Reported Self Reported Behavior and AttitudesBehavior and Attitudes
Problem Problem SolvingSolving
LeadershipLeadershipSkillsSkills
Likes Likes SchoolSchool
AttendAttendCollegeCollege
Parameter estimateParameter estimate
TeachersTeachers’’ Attitude About Project Attitude About ProjectStudentStudent’’s Predicted Grades Predicted GradeHours Spent on Service ProjectHours Spent on Service ProjectStudent - Number of Volunteer ExperiencesStudent - Number of Volunteer ExperiencesTotal Service Learning Participants in DistrictTotal Service Learning Participants in DistrictLevel of Community Partner InvolvementLevel of Community Partner InvolvementQuality of Relationships with TeachersQuality of Relationships with TeachersPerception that Adult Take Ideas SeriouslyPerception that Adult Take Ideas SeriouslyPerceived Parental EncouragementPerceived Parental EncouragementAverage Grades as Reported by StudentAverage Grades as Reported by StudentNumber of Reflection ActivitiesNumber of Reflection ActivitiesAttitude Toward ParentsAttitude Toward Parents’’ Involvement InvolvementGrade Level of StudentGrade Level of StudentNumber of Service Projects CompletedNumber of Service Projects CompletedIf Students He/She Chose ProblemIf Students He/She Chose ProblemInterceptIntercept
0.30*0.30* 0.30*0.30* 0.55**0.55** 0.33***0.33*** 0.00***0.00*** 0.26**0.26** 0.49**0.49** 0.60***0.60*** ---- ---- ---- ---- ---- ---- ---- 4.834.83
---- ---- 0.70**0.70** 0.34***0.34*** 0.00***0.00*** ---- 0.87***0.87*** 0.35*0.35* 0.13**0.13** 0.66***0.66*** 0.30*0.30* ---- ---- ---- ---- 4.084.08
---- ---- ---- ---- ---- 0.18*0.18* 1.44***1.44*** ---- 0.10**0.10** ---- 0.40**0.40** 0.45***0.45*** -0.19**-0.19** ---- ---- 8.218.21
---- ---- ---- ---- ---- ---- ---- 0.23**0.23** 0.06**0.06** 0.38***0.38*** ---- ---- ---- -0.04**-0.04** 0.37**0.37** 6.606.60
F statisticF statisticR squareR squareAdjusted R squareAdjusted R square
16.22***16.22*** 0.210.21 0.200.20
25.89***25.89*** 0.230.23 0.220.22
49.52***49.52*** 0.290.29 0.290.29
22.29***22.29*** 0.190.19 0.180.18
*p<.05 **p< .01 ***p<.001*p<.05 **p< .01 ***p<.001

Table 56. Regression Models Measuring Possible Outcomes of Service Learning for Elementary Students Table 56. Regression Models Measuring Possible Outcomes of Service Learning for Elementary Students By TeachersBy Teachers’’ Attitude; Hours Spent on Service Learning and Whether or Not Elementary Students Attitude; Hours Spent on Service Learning and Whether or Not Elementary Students Understand Service LearningUnderstand Service Learning
FutureFutureInvolvementInvolvement
Helps UnderstandHelps UnderstandAcademicsAcademics
Efficacy ofEfficacy ofStudent (a)Student (a)
Standardized estimateStandardized estimate
Teachers Believe Service Learning Helps Students Teachers Believe Service Learning Helps Students LearnLearn
Project Lasted 4 HoursProject Lasted 4 HoursUnderstand Service LearningUnderstand Service LearningCould Tell Others about ProjectCould Tell Others about ProjectInterceptIntercept
0.08*0.08* 0.040.04 0.27****0.27**** 0.18****0.18**** 0.000.00
0.12***0.12*** 0.13***0.13*** 0.22****0.22**** 0.18****0.18**** 0.000.00
0.09*0.09* 0.14***0.14*** 0.17****0.17**** 0.16***0.16*** 0.000.00
Parameter estimateParameter estimate
Teachers Believe Service Learning Helps Students Teachers Believe Service Learning Helps Students LearnLearn
Project Lasted 4 HoursProject Lasted 4 HoursUnderstand Service LearningUnderstand Service LearningCould Tell Others about Project Could Tell Others about Project InterceptIntercept
0.10*0.10* -0.07-0.07 0.56****0.56**** 0.38****0.38**** 3.833.83
0.14***0.14*** -0.22***-0.22*** 0.39****0.39**** 0.33****0.33**** 3.693.69
0.39*0.39* -0.95***-0.95*** 1.16****1.16**** 1.08***1.08*** 19.1319.13
F statisticF statisticR squareR squareAdjusted R squareAdjusted R square
29.71****29.71**** 0.150.15 0.150.15
25.45****25.45**** 0.130.13 0.130.13
16.26****16.26**** 0.090.09 0.080.08
*p<0.05 **p<0.01 ***p<0.001 ****p<0.0001*p<0.05 **p<0.01 ***p<0.001 ****p<0.0001(a) Index which includes students(a) Index which includes students ’’ feelings about ability to solve problems and interact in groups. feelings about ability to solve problems and interact in groups.