Service Delivery Statements - Queensland Treasury · reviewing processes, systems and automation...
60
budget.qld.gov.au Service Delivery Statements Queensland Police Service Public Safety Business Agency
Transcript of Service Delivery Statements - Queensland Treasury · reviewing processes, systems and automation...

budget.qld.gov.au
Service Delivery StatementsQueensland Police Service Public Safety Business Agency

© Crown copyright All rights reservedQueensland Government 2018
Excerpts from this publication may be reproduced, with appropriate acknowledgement, as permitted under the Copyright Act.
Service Delivery StatementsISSN 1445-4890 (Print)ISSN 1445-4904 (Online)
2018–19 Queensland Budget Papers1. Budget Speech
2. Budget Strategy and Outlook
3. Capital Statement
4. Budget Measures
5. Service Delivery Statements
Appropriation Bills
Budget Highlights
The Budget Papers are available online at budget.qld.gov.au

Summary of portfolio
Page Police and Public Safety
2 Queensland Police Service - controlled
Queensland Police Service - administered
27 Prostitution Licensing Authority
35 Public Safety Business Agency
__________________________________________________________________________________________________________________

Portfolio overview
Ministerial and portfolio responsibilities
The table below represents the agencies and services which are the responsibility of the Minister for Police and Minister for Corrective Services:
Minister for Police and Minister for Corrective Services
The Honourable Mark Ryan MP
Queensland Police Service
Commissioner: Ian Stewart
Service area 1: Crime and public order
Service area 2: Road safety
The Minister for Police is also responsible for:
Prostitution Licensing Authority
Chairperson: Walter Tutt
Objective: To ensure that licensed brothels and prostitution advertising are regulated in accordance with statutory requirements and in the community interest.
Public Safety Business Agency
Chief Operating Officer: Peter Griffin
Service area 1: Corporate and Air Services
Additional information about these agencies can be sourced from:
www.police.qld.gov.au
www.pla.qld.gov.au
www.psba.qld.gov.au
2018-19 Queensland State Budget - Service Delivery Statements - Police and Public Safety 1

Queensland Police Service
2018-19 Queensland State Budget - Service Delivery Statements - Police and Public Safety 2

Departmental overview The role of the Queensland Police Service (QPS) is to provide timely, high quality and efficient policing services, in collaboration with community, government and non-government partners, to make Queensland safer. The department's vision is to deliver safe and secure communities through innovation, collaboration and best practice.
The QPS contributes to the Queensland Government's objectives to keep communities safe and to be a responsive Government. We do this by:
Stopping Crime- focusing resources to identify and deliver sustainable, effective, innovative and efficient services to prevent,
investigate and disrupt crime - addressing the threat of serious and organised crime, terrorism and radicalisation through strong collaborative
partnerships with community and other law enforcement agencies Making the Community Safer
- fostering collaborative partnerships with government agencies, non-government organisations and communitygroups to maximise opportunities to prevent crime and enhance community safety
- improving policing responses to people who are over-represented in the criminal justice system as either victimsor offenders, including vulnerable persons, young people and victims of domestic and family violence
Strengthening Relationships with the Community- preserving the legitimacy of policing through fair and ethical service delivery- providing timely and professional responses to calls for service to maintain community confidence- strengthening positive online user and social media experiences to expand options for engagement with police
Equipping our Workforce for the Future- optimising our workforce to meet current and future challenges through training and development- providing world-leading equipment, technology and facilities to support our frontline staff- supporting healthy, safe and inclusive workplaces and promoting a diverse workforce that reflects the community
we serve.
The QPS will be faced with a number of strategic challenges during 2018-19 and will aim to maintain community satisfaction and confidence, in an environment of changing expectations and economic uncertainty that may contribute to an increased number of vulnerable people within the community. The ongoing threat of terrorism will continue to pose unique challenges to our people and safety within the community, and the department will continue to develop necessary knowledge and skills to understand evolving criminal uses of emerging technologies.
There are also several strategic opportunities for the QPS in 2018-19, including opportunities for information sharing through collaborative partnerships with the community and a wide range of agencies. The department will continue to invest in the diversity, expertise, knowledge and safety of its people, and look for ways to encourage new ideas and use existing resources more efficiently, and recognise that technological advances and increased global connectivity provide opportunities to change and revolutionise policing.
To address these challenges and opportunities the key priorities for the QPS during 2018-19 include: continuing to improve policing responses to keep communities safe and reduce victimisation reducing rates of youth reoffending by intervening early to divert young people at risk reviewing processes, systems and automation opportunities to identify and implement new and better ways of doing
business continuing to create better workplaces by improving the health, safety and wellbeing of our people, families and
workplaces through the Our People Matter strategy.
2018-19 Queensland State Budget - Service Delivery Statements - Police and Public Safety 3

Service performance
Crime and public order
Service area objective
To uphold the law by working with the community to stop crime and make Queensland safer.
Service area description
The Queensland Police Service (QPS) provides services to the Queensland community designed to uphold and administer the law responsibly, fairly and efficiently; preserve peace and good order; protect and support the community; prevent, detect and solve crime; and to bring offenders to justice. This includes, but is not limited to:
protecting personal safety and preventing, detecting and solving offences including homicide, assault, sexual assaultand robbery
protecting property and preventing, detecting and solving offences including unlawful entry, other property damage,motor vehicle theft and other theft
maintaining public order and safety including during major events and disasters and addressing public spaceenjoyment, street and nuisance offences, liquor licensing issues and environmental design to reduce crime includingalcohol fuelled violence.
2018-19 service area highlights
The QPS will continue its focus on delivering the Government's commitments to the Queensland community in 2018-19 with a particular focus on keeping communities safe through the delivery of quality frontline services.
Highlights include:
establishing a QPS security and counter-terrorism command with counter-terrorism specialists located across theState
continuing to deliver key initiatives of the Government's Keeping our Community Safe and Tackling Alcohol FuelledViolence policies
continuing to support the implementation of the Domestic and Family Violence Prevention Strategy 2016-2026 andthe Government response to the report from the Special Taskforce on Domestic and Family Violence in Queensland
working with other appropriate agencies to increase the proportion of offenders, particularly young people, divertedfrom the criminal justice system
continuing to build an enhanced intelligence, preventative and investigative capability in response to terrorism andunplanned events that impact on safety and security and to target serious and organised crime.
Queensland Police Service Notes 2017-18
Target/Est.
2017-18
Est. Actual
2018-19
Target/Est.
Service area: Crime and public order 1
Service standards
Effectiveness measures
Percentage of personal safety offences cleared within 30 days: 1, 2
Homicide (murder and other homicide) 70-88% 70% 70-83%
Assault 55-69% 56% 54-63%
Sexual Assault 55-69% 50% 48-57%
Robbery 55-69% 61% 57-62%
2018-19 Queensland State Budget - Service Delivery Statements - Police and Public Safety 4

Queensland Police Service Notes 2017-18
Target/Est.
2017-18
Est. Actual
2018-19
Target/Est.
Total personal safety 55-69% 55% 54-61%
Percentage of property security offences cleared within 30 days: 2, 3, 4
Unlawful entry 16-20% 19% 18-21%
Other property damage 24-30% 26% 25-27%
Motor vehicle theft 30-38% 37% 36-39%
Other theft (excluding unlawful entry) 25-31% 28% 26-28%
Total property security 25-31% 29% 28-30%
Percentage of good order offences cleared within 30 days 2, 5 85-100% 82% 80-85%
Rate of complaints against police per 100 sworn (operational) staff 6, 7 <9.8 12.3 <9.8
Perception of police integrity: 8
Police perform their job professionally >85% 87.0% >85%
Police treat people fairly and equally >75% 77.3% >75%
Police are honest >75% 75.7% >75%
I do have confidence in the police >85% 84.7% >85%
Satisfaction of members of the public who had contact with police in the last 12 months 8 >85% 85.3% >85%
Public satisfaction with police dealing with public order problems 8 >70% 76.7% >70%
Public satisfaction with police dealing with emergencies and disasters 8 >85% 82.9% >85%
Percentage of code 1 and code 2 incidents attended within 12 minutes 9 >80% 84.0% >80%
Efficiency measure
Cost of crime and public order per person 10 $377 $361 $377
Notes: 1. The figures are provided as at 31 March 2018.2. The offence categories reported separately are those classified as violent crimes and are the most significant personal safety offence
categories in terms of their impact on the community. The total personal safety offences figure also includes the offence categories ofextortion, kidnapping, abduction and deprivation of liberty and other offences against the person.
3. Performance is reported against a range rather than a single figure. The revised target ranges for 2018-19 takes into account recent resultsand any known factors that are likely to have an impact in the reporting period. Upper and lower values account for past variation from therecent historical average. The values represent achievable targets for 2018-19.
4. The offence categories reported separately are considered high volume property security offences. The total property security offencesalso includes arson, fraud and handling stolen goods.
5. Good order offences include offences relating to public nuisance, obstructing police and other offences against good order.6. Sworn operational staff refers to a police officer employed by the QPS who has sworn the Oath of Office under the Police Service
Administration Act 1990, and whose primary duty is the delivery of police or police-related services to an external customer.
2018-19 Queensland State Budget - Service Delivery Statements - Police and Public Safety 5

7. The target value for 2018-19 represents a challenge for the QPS, given recent increases in the number of complaints reported since2014-15. However, changes being introduced to the discipline complaints system as well as the roll-out of body-worn cameras areexpected to result in fewer reported complaints through 2018-19.
8. These measures are derived from the National Survey of Community Satisfaction with Policing.9. Data measures the time taken to attend code 1 and code 2 incidents. Code 1 and 2 incidents include very urgent matters when danger to
human life is imminent and urgent matters involving injury or present threat of injury to person or property. The benchmark of 12 minuteswas chosen for comparability with New South Wales police who use similar methodology, business rules and systems.
10. Cost of crime and public order per person is the total cost of delivering crime and public order related policing activities divided by the estimated population of Queensland. Population data is sourced from the Australian Bureau of Statistics Catalogue No. 3101.0. This measure is reported in line with Report on Government Services methodology. The 2018-19 Target/Estimate is based on Queensland Treasury population estimates. Expenditure includes operating expenditure plus a calculated user cost of capital for property, plant and equipment assets excluding land assets. This measure is acknowledged as a high-level estimate only owing to current limitations of aligning budget allocation to specific service areas.
2018-19 Queensland State Budget - Service Delivery Statements - Police and Public Safety 6

Road safety
Service area objective
To contribute to stopping crime and making the community safer through road safety relationships, reducing road trauma and evidence based enforcement anywhere, anytime.
Service area description
Activities to enforce traffic law and reduce road trauma; target the prevention and detection of speeding; red light offences; driving while distracted; driving under the influence of alcohol or drugs; driving while fatigued; and not wearing seatbelts.
2018-19 service area highlights
The Queensland Police Service (QPS) will continue to work in partnership with the community and other road safety stakeholders to make our roads safer.
Highlights include:
expanding roadside drug testing to up to 75,000 tests per annum within four years working with the Department of Transport and Main Roads and other key partners to implement the Safer Roads,
Safer Queensland - Queensland's Road Safety Action Plan 2017-19 to help Queensland achieve its vision ofeliminating serious road trauma over the long term
continuing to engage with the public around the role everyone plays in improving road safety conducting enforcement activities to deter and detect dangerous behaviours, including using high visibility, covert
strategies such as point-to-point systems and portable speed cameras, and technology such as e-ticketing expanding radars on marked motorcycles increasing training for road police officers to enable them to better detect and deter broader criminal activities participating in Queensland Road Safety Week in August 2018, in partnership with the Department of Transport and
Main Roads and the Motor Accident Insurance Commission.
Queensland Police Service Notes 2017-18
Target/Est.
2017-18
Est. Actual
2018-19
Target/Est.
Service area: Road safety
Service standards
Effectiveness measures
Road crash fatalities rate per 100,000 population 1, 2, 3, 4 4.7 5.23 <4.35
Road crash hospitalisations rate per 100,000 population 1, 2, 3, 4,5 121 .. <108
Efficiency measure
Cost of road safety per person 1, 6 $87 $83 $87
Notes: 1. The figures provided for 2017-18 Estimated Actual are as at 31 March 2018.2. Road safety in Queensland is a collaborative approach and enforcement strategies are one aspect of overall road safety efforts. The QPS
collaborates with key industry and community organisations, research institutions, government agencies and peak bodies representingroad user groups.
3. Population data is sourced from Australian Bureau of Statistics (ABS) Australian Demographic Statistics Catalogue No. 3101.0.4. The 2018-19 Target/Estimate was developed in consultation with the Department of Transport and Main Roads. The National Road Safety
Strategy 2011-2020 outlines that the target road fatality rate is to be based on a 30 per cent reduction in the number of deaths and seriousinjuries on Australian roads by 2020. Therefore, the target road fatality rate is calculated by the average decline required per year toachieve a 30 per cent reduction by 2020 in Queensland (relative to baseline in 2008-2010).
5. A 2017-18 Estimated Actual for road crash hospitalisations rate per 100,000 population is not able to be estimated due to a data lag indefining relevant crashes.
2018-19 Queensland State Budget - Service Delivery Statements - Police and Public Safety 7

6. Cost of road safety per person is the total cost of delivering road safety related policing activities divided by the estimated population ofQueensland. Population data is sourced from the ABS Catalogue No. 3101.0. This measure is reported in line with Report on GovernmentServices methodology. The 2018-19 Target/Estimate is based on Queensland Treasury population estimates. Expenditure includesoperating expenditure plus a calculated user cost of capital for property, plant and equipment assets excluding land assets. This measureis acknowledged as a high-level estimate only owing to current limitations of aligning budget allocation to specific service areas.
2018-19 Queensland State Budget - Service Delivery Statements - Police and Public Safety 8

Discontinued measures
Performance measures included in the 2017-18 Service Delivery Statements that have been discontinued or replaced are reported in the following table with estimated actual results.
Queensland Police Service Notes 2017-18
Target/Est.
2017-18
Est. Actual
2018-19
Target/Est.
Service area: Crime and public order
Percentage of prosecutions where costs awarded against police 1, 2 0.05% 0.000%
Discontinued measure
Notes: 1. The figure provided for 2017-18 Estimated Actual is as at 31 March 2018.2. Reporting of this measure has been discontinued from the annual Report on Government Services, as it is no longer seen as a valid or
useful measure of police performance. The Queensland Police Service has discontinued this measure as the number of instances wherecosts are awarded against the police is exceptionally rare (less than 0.02 per cent of all prosecutions) and little meaningful performanceimprovement is possible. The measure will not be reported elsewhere.
2018-19 Queensland State Budget - Service Delivery Statements - Police and Public Safety 9

Administered items
Administered activities are those undertaken by departments on behalf of the Government.
The Queensland Police Service administers funds on behalf of the State which include weapons licensing fees, fines and forfeitures and proceeds from the sale of unclaimed property.
Weapons licensing fees comprise the majority of the administered revenue. Weapons licensing is an important part of the Government's framework to ensure public safety and to prevent the misuse of weapons.
Financial statements and variance explanations in relation to administered items appear in the departmental financial statements.
2018-19 Queensland State Budget - Service Delivery Statements - Police and Public Safety 10

Departmental budget summary The table below shows the total resources available in 2018-19 from all sources and summarises how resources will be applied by service area and by controlled and administered classifications.
Queensland Police Service
2017-18
Budget
$’000
2017-18
Est. Actual
$’000
2018-19
Budget
$’000
CONTROLLED
Income
Appropriation revenue1
Deferred from previous year/s 23,297 29,844 16,811
Balance of service appropriation 1,892,574 1,891,246 1,973,170
Other revenue 454,320 399,879 335,610
Total income 2,370,191 2,320,969 2,325,591
Expenses
Crime and public order 1,927,029 1,886,948 1,890,705
Road safety 443,162 434,021 434,886
Total expenses 2,370,191 2,320,969 2,325,591
Operating surplus/deficit .. .. ..
Net assets 117,753 119,095 123,380
ADMINISTERED
Revenue
Commonwealth revenue .. .. ..
Appropriation revenue .. .. 734
Other administered revenue 13,583 11,045 11,431
Total revenue 13,583 11,045 12,165
Expenses
Transfers to government 13,583 11,045 11,431
Administered expenses .. .. 734
Total expenses 13,583 11,045 12,165
Net assets .. .. ..
Note: 1. Includes State funding only.
2018-19 Queensland State Budget - Service Delivery Statements - Police and Public Safety 11

Service area sources of revenue1 Sources of revenue
2018-19 Budget
Queensland Police Service Total cost
$’000
State
contribution
$’000
User
charges
and fees
$’000
C’wealth
revenue
$’000
Other
revenue
$’000
Crime and public order 1,890,705 1,617,855 66,716 634 205,500
Road safety 434,886 372,126 15,346 146 47,268
Total 2,325,591 1,989,981 82,062 780 252,768
Note: 1. Explanations of variances are provided in the financial statements.
2018-19 Queensland State Budget - Service Delivery Statements - Police and Public Safety 12

Budget measures summary
This table shows a summary of budget measures relating to the department since the 2017-18 State Budget. Further details are contained in Budget Measures (Budget Paper 4).
Queensland Police Service 2017-18
$’000
2018-19
$’000
2019-20
$’000
2020-21
$’000
2021-22
$’000
Revenue measures
Administered .. .. .. .. ..
Departmental .. .. .. .. ..
Expense measures1
Administered .. (5) .. .. ..
Departmental (5,339) 10,180 57,063 78,118 95,731
Capital measures
Administered .. .. .. .. ..
Departmental 1,260 1,650 2,750 1,750 2,500
Note: 1. Figures reconcile with Budget Measures (Budget Paper 4), including the whole-of-government expense measure ‘Reprioritisations’.
2018-19 Queensland State Budget - Service Delivery Statements - Police and Public Safety 13

Departmental capital program
Most new and ongoing capital initiatives to support the operational capability of the Queensland Police Services (QPS) are provided by the Public Safety Business Agency (PSBA). This includes police accommodation facilities, motor vehicles, vessels, information technology and construction of a Counter-Terrorism and Community Safety Centre at Wacol.
The QPS continues to be responsible for delivering operational equipment to maintain quality frontline services.
In 2018-19, the QPS will invest $20.1 million in capital purchases. Program highlights include:
$5.5 million for Camera Detected Offence Program equipment.
$3.9 million for mobile capability and the development of new applications for QPS QLiTE mobile tablet devices.
$10.7 million for other property, plant and equipment including the replacement of operational assets.
Capital budget
Queensland Police Service Notes
2017-18
Budget $’000
2017-18
Est. Actual
$’000
2018-19
Budget $’000
Capital purchases 1, 2
Total plant and equipment 23,705 24,448 20,124
Total other capital .. .. ..
Total capital purchases 23,705 24,448 20,124
Notes: 1. For more detail on the agency’s capital acquisitions please refer to Capital Statement (Budget Paper 3).2. Capital measures in the 2018-19 Budget have been transferred to the Public Safety Business Agency (PSBA) and can be viewed in the
PSBA Capital Statement (Budget Paper 3).
2018-19 Queensland State Budget - Service Delivery Statements - Police and Public Safety 14

Staffing1
Queensland Police Service Notes 2017-18
Budget
2017-18
Est. Actual
2018-19
Budget
Crime and public order 2, 3 12,580 12,655 12,761
Road safety 2, 3 2,883 2,911 2,935
TOTAL 15,463 15,566 15,696
Notes: 1. Full-time equivalents (FTEs) as at 30 June.2. Corporate FTEs are allocated across the service to which they relate.3. The department participates in a partnership arrangement in the delivery of its services, whereby corporate FTEs are hosted by the
department to work across multiple departments.
2018-19 Queensland State Budget - Service Delivery Statements - Police and Public Safety 15

Chart: Total departmental expenses across the Forward Estimates period
The department's major assets are cash ($88.8 million), plant and equipment and intangibles ($88.5 million) and receivables ($69.6 million). The department's main liabilities relate to accrued employee benefits ($86.3 million) and payables ($42.8 million).
Budgeted financial statements
Analysis of budgeted financial statements
An analysis of the department's financial statements is provided below:
Departmental income statement
Total expenses are estimated to be $2.326 billion in 2018-19, an increase of $4.6 million from the 2017-18 Estimated Actual. The increase is mainly due to enterprise bargaining arrangements and funding provided for additional police officers, Counter-Terrorism, Safe Night Precincts, GPS tracking of defendants on bail, and mobile capability. This increase is partly offset by reprioritisation measures and the completion of the Gold Coast 2018 Commonwealth Games in 2017-18.
The increased expenditure from 2019-20 onwards is mainly due to enterprise bargaining arrangements and funding provided for additional police officers.
Departmental balance sheet
2,200,000
2,250,000
2,300,000
2,350,000
2,400,000
2,450,000
2,500,000
2,550,000
2,600,000
2017-18 2018-19 2019-20 2020-21 2021-22
$'00
0
Financial year
Total expenses
Total expenses
2018-19 Queensland State Budget - Service Delivery Statements - Police and Public Safety 16

Controlled income statement
Queensland Police Service Notes 2017-18 Budget
$'000
2017-18 Est. Act.
$'000
2018-19 Budget
$'000
INCOME
Appropriation revenue 5,10 1,915,871 1,921,090 1,989,981
Taxes .. .. ..
User charges and fees 80,612 80,612 82,062
Royalties and land rents .. .. ..
Grants and other contributions 1,6,11 370,952 316,511 250,792
Interest 550 550 550
Other revenue 2,206 2,206 2,206
Gains on sale/revaluation of assets .. .. ..
Total income 2,370,191 2,320,969 2,325,591
EXPENSES
Employee expenses 2,7,12 1,735,470 1,761,712 1,798,500
Supplies and services 3,8,13 314,033 293,564 255,648
Grants and subsidies 3,515 3,915 4,015
Depreciation and amortisation 15,773 14,973 15,839
Finance/borrowing costs .. .. ..
Other expenses 4,9 301,400 246,805 251,589
Losses on sale/revaluation of assets .. .. ..
Total expenses 2,370,191 2,320,969 2,325,591
OPERATING SURPLUS/(DEFICIT) .. .. ..
2018-19 Queensland State Budget - Service Delivery Statements - Police and Public Safety 17

Controlled balance sheet
Queensland Police Service Notes 2017-18 Budget
$'000
2017-18 Est. Act.
$'000
2018-19 Budget
$'000
CURRENT ASSETS
Cash assets 14,19 71,839 88,805 88,805
Receivables 15,20 59,006 69,623 69,623
Other financial assets .. .. ..
Inventories 5,466 3,864 3,864
Other 16,21 2,413 6,582 6,582
Non-financial assets held for sale .. .. ..
Total current assets 138,724 168,874 168,874
NON-CURRENT ASSETS
Receivables .. .. ..
Other financial assets .. .. ..
Property, plant and equipment 22,26 58,470 63,178 71,463
Intangibles 23,27 19,919 21,075 17,075
Other .. .. ..
Total non-current assets 78,389 84,253 88,538
TOTAL ASSETS 217,113 253,127 257,412
CURRENT LIABILITIES
Payables 17,24 23,425 42,809 42,809
Accrued employee benefits 18,25 69,080 86,271 86,271
Interest bearing liabilities and derivatives .. .. ..
Provisions .. .. ..
Other 6,855 4,952 4,952
Total current liabilities 99,360 134,032 134,032
NON-CURRENT LIABILITIES
Payables .. .. ..
Accrued employee benefits .. .. ..
Interest bearing liabilities and derivatives .. .. ..
Provisions .. .. ..
Other .. .. ..
Total non-current liabilities .. .. ..
TOTAL LIABILITIES 99,360 134,032 134,032
NET ASSETS/(LIABILITIES) 117,753 119,095 123,380
EQUITY
TOTAL EQUITY 117,753 119,095 123,380
2018-19 Queensland State Budget - Service Delivery Statements - Police and Public Safety 18

Controlled cash flow statement
Queensland Police Service Notes 2017-18 Budget
$'000
2017-18 Est. Act.
$'000
2018-19 Budget
$'000
CASH FLOWS FROM OPERATING ACTIVITIES
Inflows:
Appropriation receipts 33,40 1,915,871 1,907,843 1,989,981
User charges and fees 28,34 80,612 89,598 91,048
Royalties and land rent receipts .. .. ..
Grants and other contributions 35,41 75,575 74,783 4,280
Interest received 550 550 550
Taxes .. .. ..
Other 29,36 2,206 30,652 30,652
Outflows:
Employee costs 30,37,42 (1,735,470) (1,761,712) (1,798,500)
Supplies and services 31,38,43 (314,033) (322,010) (284,094)
Grants and subsidies (3,515) (3,915) (4,015)
Borrowing costs .. .. ..
Other 32,39 (6,023) (14,063) (14,063)
Net cash provided by or used in operating activities 15,773 1,726 15,839
CASH FLOWS FROM INVESTING ACTIVITIES
Inflows:
Sales of non-financial assets .. .. ..
Investments redeemed .. .. ..
Loans and advances redeemed .. .. ..
Outflows:
Payments for non-financial assets (23,705) (24,448) (20,124)
Payments for investments .. .. ..
Loans and advances made .. .. ..
Net cash provided by or used in investing activities (23,705) (24,448) (20,124)
CASH FLOWS FROM FINANCING ACTIVITIES
Inflows:
Borrowings .. .. ..
Equity injections 9,862 11,380 6,215
Outflows:
Borrowing redemptions .. .. ..
Finance lease payments .. .. ..
Equity withdrawals (1,930) (1,930) (1,930)
Net cash provided by or used in financing activities 7,932 9,450 4,285
Net increase/(decrease) in cash held .. (13,272) ..
Cash at the beginning of financial year 71,839 102,077 88,805
Cash transfers from restructure .. .. ..
Cash at the end of financial year 71,839 88,805 88,805
2018-19 Queensland State Budget - Service Delivery Statements - Police and Public Safety 19

Administered income statement
Queensland Police Service Notes 2017-18 Budget
$'000
2017-18 Est. Act.
$'000
2018-19 Budget
$'000
INCOME
Appropriation revenue 47,52 .. .. 734
Taxes .. .. ..
User charges and fees 44,48 11,162 9,195 9,517
Royalties and land rents .. .. ..
Grants and other contributions .. .. ..
Interest .. .. ..
Other revenue 45,49 2,421 1,850 1,914
Gains on sale/revaluation of assets .. .. ..
Total income 13,583 11,045 12,165
EXPENSES
Employee expenses .. .. ..
Supplies and services .. .. ..
Grants and subsidies 50,53 .. .. 734
Depreciation and amortisation .. .. ..
Finance/borrowing costs .. .. ..
Other expenses .. .. ..
Losses on sale/revaluation of assets .. .. ..
Transfers of Administered Revenue to Government 46,51 13,583 11,045 11,431
Total expenses 13,583 11,045 12,165
OPERATING SURPLUS/(DEFICIT) .. .. ..
2018-19 Queensland State Budget - Service Delivery Statements - Police and Public Safety 20

Administered balance sheet
Queensland Police Service Notes 2017-18 Budget
$'000
2017-18 Est. Act.
$'000
2018-19 Budget
$'000
CURRENT ASSETS
Cash assets 54,55 1,550 1,815 1,815
Receivables (1) (7) (7)
Other financial assets .. .. ..
Inventories .. .. ..
Other .. .. ..
Non-financial assets held for sale .. .. ..
Total current assets 1,549 1,808 1,808
NON-CURRENT ASSETS
Receivables .. .. ..
Other financial assets .. .. ..
Property, plant and equipment .. .. ..
Intangibles .. .. ..
Other .. .. ..
Total non-current assets .. .. ..
TOTAL ASSETS 1,549 1,808 1,808
CURRENT LIABILITIES
Payables 856 1,214 1,214
Transfers to Government payable 693 594 594
Accrued employee benefits .. .. ..
Interest bearing liabilities and derivatives .. .. ..
Provisions .. .. ..
Other .. .. ..
Total current liabilities 1,549 1,808 1,808
NON-CURRENT LIABILITIES
Payables .. .. ..
Accrued employee benefits .. .. ..
Interest bearing liabilities and derivatives .. .. ..
Provisions .. .. ..
Other .. .. ..
Total non-current liabilities .. .. ..
TOTAL LIABILITIES 1,549 1,808 1,808
NET ASSETS/(LIABILITIES) .. .. ..
EQUITY
TOTAL EQUITY .. .. ..
2018-19 Queensland State Budget - Service Delivery Statements - Police and Public Safety 21

Administered cash flow statement
Queensland Police Service Notes 2017-18 Budget
$'000
2017-18 Est. Act.
$'000
2018-19 Budget
$'000
CASH FLOWS FROM OPERATING ACTIVITIES
Inflows:
Appropriation receipts 59,64 .. .. 734
User charges and fees 56,60 11,162 9,195 9,517
Royalties and land rent receipts .. .. ..
Grants and other contributions .. .. ..
Interest received .. .. ..
Taxes .. .. ..
Other 57,61 2,421 1,850 1,914
Outflows:
Employee costs .. .. ..
Supplies and services .. .. ..
Grants and subsidies 62,65 .. .. (734)
Borrowing costs .. .. ..
Other .. .. ..
Transfers to Government 58,63 (13,583) (11,045) (11,431)
Net cash provided by or used in operating activities .. .. ..
CASH FLOWS FROM INVESTING ACTIVITIES
Inflows:
Sales of non-financial assets .. .. ..
Investments redeemed .. .. ..
Loans and advances redeemed .. .. ..
Outflows:
Payments for non-financial assets .. .. ..
Payments for investments .. .. ..
Loans and advances made .. .. ..
Net cash provided by or used in investing activities .. .. ..
CASH FLOWS FROM FINANCING ACTIVITIES
Inflows:
Borrowings .. .. ..
Equity injections .. .. ..
Outflows:
Borrowing redemptions .. .. ..
Finance lease payments .. .. ..
Equity withdrawals .. .. ..
Net cash provided by or used in financing activities .. .. ..
Net increase/(decrease) in cash held .. .. ..
Cash at the beginning of financial year 1,550 1,815 1,815
Cash transfers from restructure .. .. ..
Cash at the end of financial year 1,550 1,815 1,815
2018-19 Queensland State Budget - Service Delivery Statements - Police and Public Safety 22

Income statementMajor variations between 2017-18 Budget and 2017-18 Estimated Actual include:
1. Grants and other contributions decrease is mainly due to a revised methodology for the calculation of goods andservices below fair value to the Queensland Police Service (QPS) by the Public Safety Business Agency (PSBA).
2. Employee expenses increase is mainly due to additional funding for Counter-Terrorism capability and Safe NightPrecincts, the transfer of Frontline Integration and Analytics Data Services unit from PSBA effective 1 September2017, and a budget realignment from supplies and services.
3. Supplies and services decrease is mainly due to reprioritisation measures and a budget realignment to employeeexpenses. This decrease has been partly offset by additional funding for Counter-Terrorism capability and thetransfer of Frontline Integration and Analytics Data Services unit from PSBA effective 1 September 2017.
4. Other expenses decrease is mainly due to a revised methodology for the calculation of goods and services belowfair value to QPS by PSBA.
Major variations between 2017-18 Budget and 2018-19 Budget include:
5. Appropriation revenue increase is mainly due to enterprise bargaining arrangements and funding provided foradditional police officers, Counter-Terrorism capability, Safe Night Precincts, GPS tracking of defendants on bail,and additional QLiTE mobile tablet devices. This increase has been partly offset by reprioritisation measures.
6. Grants and other contributions decrease is mainly due to a revised methodology for the calculation of goods andservices below fair value to QPS by PSBA, and the completion of the Gold Coast 2018 Commonwealth Games in2017-18.
7. Employee expenses increase is mainly due to enterprise bargaining arrangements and funding provided foradditional police officers, Counter-Terrorism capability, and Safe Night Precincts. This increase has been partlyoffset by the completion of the Gold Coast 2018 Commonwealth Games in 2017-18.
8. Supplies and services decrease is mainly due to reprioritisation measures and the completion of the Gold Coast2018 Commonwealth Games in 2017-18. This decrease has been partly offset by funding provided for additionalpolice officers, Counter-Terrorism capability, GPS tracking of defendants on bail, and additional QLiTE mobiletablet devices.
9. Other expenses decrease is mainly due to a revised methodology for the calculation of goods and services belowfair value to QPS by PSBA.
Major variations between 2017-18 Estimated Actual and the 2018-19 Budget include:
10. Appropriation revenue increase is mainly due to enterprise bargaining arrangements and funding provided foradditional police officers, Counter-Terrorism capability, Safe Night Precincts, GPS tracking of defendants on bail,and additional QLiTE mobile tablet devices. This increase has been partly offset by reprioritisation measures.
11. Grants and other contributions decrease is mainly due to the completion of the Gold Coast 2018 CommonwealthGames in 2017-18.
12. Employee expenses increase is mainly due to enterprise bargaining arrangements and funding provided foradditional police officers, Counter-Terrorism capability, and Safe Night Precincts.
13. Supplies and services decrease is mainly due to reprioritisation measures and the completion of the Gold Coast2018 Commonwealth Games in 2017-18. This decrease has been partly offset by funding provided for additionalpolice officers, Counter-Terrorism capability, GPS tracking of defendants on bail, and additional QLiTE mobiletablet devices.
Explanation of variances in the financial statements
2018-19 Queensland State Budget - Service Delivery Statements - Police and Public Safety 23

Balance sheetMajor variations between 2017-18 Budget and 2017-18 Estimated Actual include:
14. Cash assets increase is due to movements in receivables, prepayments, accrued employee benefits, andpayables.
15. Receivables increase reflects the anticipated timing of receipts.
16. Other current assets increase is mainly due to movements in prepayments.
17. Payables increase reflects the anticipated timing of payments to trade creditors.
18. Accrued employee benefits increase reflects the timing of payments for salaries and wages and related costs.
Major variations between 2017-18 Budget and 2018-19 Budget include:
19. Cash assets increase is due to movements in receivables, prepayments, employee benefits, and payables.
20. Receivables increase reflects the anticipated timing of receipts.
21. Other current assets increase is mainly due to movements in prepayments.
22. Property, plant and equipment increase is mainly due to capital acquisitions planned for 2018-19.
23. Intangible assets decrease is mainly due to the amortisation of intangible assets.
24. Payables increase reflects the anticipated timing of payments to trade creditors.
25. Accrued employee benefits increase reflects the timing of payments for salaries and wages and related costs.
Major variations between 2017-18 Estimated Actual and the 2018-19 Budget include:
26. Property, plant and equipment increase is mainly due to capital acquisitions planned for 2018-19.
27. Intangible assets decrease is mainly due to the amortisation of intangible assets.
Cash flow statementMajor variations between 2017-18 Budget and 2017-18 Estimated Actual include:
28. User charges and fees increase is mainly due to an adjustment for GST.
29. Other inflows increase is mainly due to an adjustment for GST.
30. Employee costs increase is mainly due to additional funding for Counter-Terrorism capability and Safe NightPrecincts, the transfer of Frontline Integration and Analytics Data Services unit from PSBA effective1 September 2017, and a budget realignment from supplies and services.
31. Supplies and services increase is mainly due to an adjustment for GST, additional funding for Counter-Terrorismcapability, and the transfer of Frontline Integration and Analytics Data Services unit from PSBA effective1 September 2017. This increase has been partly offset by reprioritisation measures and a budget realignment toemployee costs.
32. Other outflows increase is mainly due to an adjustment for GST.
Major variations between 2017-18 Budget and 2018-19 Budget include:
33. Appropriation receipts increase is mainly due to enterprise bargaining arrangements and funding provided foradditional police officers, Counter-Terrorism capability, Safe Night Precincts, GPS tracking of defendants on bail,and additional QLiTE mobile tablet devices. This increase has been partly offset by reprioritisation measures.
34. User charges and fees increase is mainly due to an adjustment for GST.
35. Grants and other contributions decrease is mainly due to the completion of the Gold Coast 2018 CommonwealthGames in 2017-18.
36. Other inflows increase is mainly due to an adjustment for GST.
37. Employee costs increase is mainly due to enterprise bargaining arrangements and funding provided for additionalpolice officers, Counter-Terrorism capability, and Safe Night Precincts.
2018-19 Queensland State Budget - Service Delivery Statements - Police and Public Safety 24

38. Supplies and services decrease is mainly due to reprioritisation measures and the completion of the Gold Coast2018 Commonwealth Games in 2017-18. This decrease has been partly offset by an adjustment for GST andfunding provided for additional police officers, Counter-Terrorism capability, GPS tracking of defendants on bail,and additional QLiTE mobile tablet devices.
39. Other outflows increase is mainly due to an adjustment for GST.
Major variations between 2017-18 Estimated Actual and the 2018-19 Budget include:
40. Appropriation receipts increase is mainly due to enterprise bargaining arrangements and funding provided foradditional police officers, Counter-Terrorism capability, Safe Night Precincts, GPS tracking of defendants on bail,and additional QLiTE mobile tablet devices. This increase has been partly offset by reprioritisation measures.
41. Grants and other contributions decrease is mainly due to the completion of the Gold Coast 2018 CommonwealthGames in 2017-18.
42. Employee costs increase is mainly due to enterprise bargaining arrangements and funding provided for additionalpolice officers, Counter-Terrorism capability, and Safe Night Precincts.
43. Supplies and services decrease is mainly due to reprioritisation measures and the completion of the Gold Coast2018 Commonwealth Games in 2017-18. This decrease has been partly offset by additional funding provided foradditional police officers, Counter-Terrorism capability, GPS tracking of defendants on bail, and additional QLiTEmobile tablet devices.
Administered income statementMajor variations between 2017-18 Budget and 2017-18 Estimated Actual include:
44. User charges and fees decrease is due to lower than anticipated fees raised under the Weapons Act 1990.
45. Other revenue decrease relates to lower fines and forfeitures.
46. Transfers of administered revenue to government decrease relates to lower than anticipated user charges andfees and other revenue.
Major variations between 2017-18 Budget and 2018-19 Budget include:
47. Appropriation revenue increase is due to the transfer of the Prostitution Licensing Authority from the Department of Justice and Attorney-General (DJAG) effective 1 January 2018.
48. User charges and fees decrease reflects lower than anticipated fees raised under the Weapons Act 1990.
49. Other revenue decrease relates to lower fines and forfeitures.
50. Grants and subsidies increase is due to the transfer of the Prostitution Licensing Authority from DJAG effective 1 January 2018.
51. Transfers of administered revenue to government decrease relates to lower than anticipated user charges andfees and other revenue.
Major variations between 2017-18 Estimated Actual and the 2018-19 Budget include:
52. Appropriation revenue increase is due to the transfer of the Prostitution Licensing Authority from DJAG effective 1 January 2018.
53. Grants and subsidies increase is due to the transfer of the Prostitution Licensing Authority from DJAG effective 1 January 2018.
Administered balance sheetMajor variations between 2017-18 Budget and 2017-18 Estimated Actual include:
54. Cash assets increase relates to timing of payables.
Major variations between 2017-18 Budget and 2018-19 Budget include:
55. Cash assets increase relates to timing of payables.
2018-19 Queensland State Budget - Service Delivery Statements - Police and Public Safety 25

Administered cash flow statementMajor variations between 2017-18 Budget and 2017-18 Estimated Actual include:
56. User charges and fees decrease reflects lower than anticipated fees raised under the Weapons Act 1990.
57. Other inflows decrease relates to lower fines and forfeitures.
58. Transfers to government decrease relates to lower than anticipated user charges and fees and other revenue.
Major variations between 2017-18 Budget and 2018-19 Budget include:
59. Appropriation receipts increase is due to the transfer of the Prostitution Licensing Authority from DJAG effective 1 January 2018.
60. User charges and fees decrease reflects lower than anticipated fees raised under the Weapons Act 1990.
61. Other inflows decrease relates to lower fines and forfeitures.
62. Grants and subsidies increase is due to the transfer of the Prostitution Licensing Authority from DJAG effective 1 January 2018.
63. Transfers to government decrease relates to lower than anticipated user charges and fees and other revenue.
Major variations between 2017-18 Estimated Actual and the 2018-19 Budget include:
64. Appropriation receipts increase is due to the transfer of the Prostitution Licensing Authority from the DJAG effective 1 January 2018.
65. Grants and subsidies increase is due to the transfer of the Prostitution Licensing Authority from DJAG effective 1 January 2018.
2018-19 Queensland State Budget - Service Delivery Statements - Police and Public Safety 26

Statutory body
Prostitution Licensing Authority
Overview
The Prostitution Licensing Authority (PLA) is a licensing and regulatory agency established by the Prostitution Act 1999 (the Prostitution Act). Due to a machinery of government change on 12 December 2017, the PLA was moved from the portfolio of the Attorney-General and Minister for Justice to that of the Minister for Police and Minister for Corrective Services. The objective of the PLA is to ensure that the operations of licensed brothels and prostitution advertising are regulated in accordance with statutory requirements and in the community interest. The Prostitution Act primarily establishes a licensing framework for brothels and the functions of the PLA include deciding applications for brothel licences and approved manager's certificates, monitoring the provision of prostitution through licensed brothels, conducting disciplinary inquiries to decide whether there are grounds for taking disciplinary action against brothel licensees and approved managers, and regulating prostitution advertising.
The PLA contributes to the Queensland Government's plan to be a responsive Government promoting integrity and accountability and to keep communities safe. The PLA does this by: ensuring an efficient and effective brothel licensing framework that operates in accordance with statutory requirements and community expectations; promoting the health and safety of sex workers and clients; limiting the impact of prostitution on the community; and providing a barrier to the infiltration of organised crime and official corruption in licensed brothels. The probity, compliance and educative functions of the PLA are critical to achieving these objectives.
There are currently 20 licensed brothels in Queensland, the lowest number since 2004-05. Whilst there were 21 brothels in operation at year end in 2016-17, one brothel closed during 2017-18. Licensed brothel numbers had peaked at 27 in 2014-15 but are likely to remain at around current levels for the foreseeable future. In addition to personal factors unique to each licensee which will impact on their decision to remain in business, the size of the licensed brothel sector may be explained by: general economic conditions; the return on investment of brothels in comparison to other businesses; the entrepreneurial ability of individual licensees; competition with illegal operators and sole operator sex workers; the regulatory framework for brothels; and disruptive innovation. The size of the sector directly impacts the PLA Budget because the fewer the number of brothels, the fewer the fees revenue received.
Service summary
The PLA has maintained a high standard of industry regulation by comprehensively vetting applicants for brothel licences and approved manager's certificates to ensure that only suitable persons are involved in the operations of licensed brothels. The careful scrutiny of applicants will continue in 2018-19 and the PLA is committed to ensuring that its probity processes remain effective and efficient and accord with community and Government expectations. There has been no evidence of the infiltration of organised crime or official corruption at licensed brothels and in 2018-19, the PLA will continue to work with other agencies, including the Queensland Police Service (QPS), to maintain a barrier to such infiltration.
Audits and inspections of brothels are integral to the licensing regime in monitoring and achieving regulatory compliance. The results of these compliance activities demonstrate that licensees are generally committed to maintaining a high degree of regulatory compliance. The PLA will continue its rigorous scrutiny of brothel operations in 2018-19. Licensed brothels are acknowledged as providing the safest and healthiest environment for the provision of prostitution and in 2018-19 the PLA will continue to prioritise high standards of health and safety. The autonomy of sex workers at brothels has been a key priority for the PLA and in 2018-19 the PLA will continue to regulate licensed brothels to minimise opportunities for exploitation.
Brothel licensees continue to express concern to the PLA about the extent and impact of unlawful prostitution and the policing priority given to investigating alleged unlawful operators. During 2017-18, the PLA communicated stakeholder concerns to the QPS and fostered awareness of the impact of unlawful operators on the licensed brothel sector. The PLA is committed to ongoing engagement in 2018-19.
2018-19 Queensland State Budget - Service Delivery Statements - Police and Public Safety 27

Service performance
Performance statement
Prostitution Licensing Authority
Service area objective
To ensure that the operations of licensed brothels and prostitution advertising are regulated in accordance with statutory requirements and in the community interest.
Service area description
The Prostitution Licensing Authority (PLA) regulates prostitution in Queensland by administering the Prostitution Act 1999 and the Prostitution Regulation 2014. The functions of the PLA are established by statute and include deciding applications for brothel licences and approved manager's certificates, monitoring the provision of prostitution through licensed brothels, conducting disciplinary inquiries to decide whether there are grounds for taking disciplinary action against brothel licensees and approved managers, and regulating prostitution advertising. In 2018-19, the PLA will maintain its high standard of industry regulation in the public interest by ensuring that only suitable persons are involved in the operations of licensed brothels, that brothels are quarantined from the influence of organised crime or official corruption, by prioritising the health and safety of sex workers and clients, by promoting the autonomy of sex workers, and by ensuring the regulatory compliance of brothels.
Prostitution Licensing Authority Notes 2017-18
Target/Est.
2017-18
Est. Actual
2018-19
Target/Est.
Service standards
Effectiveness measures
Percentage of licensed brothels implementing best practice standards 1 100% 100% 100%
Satisfaction of applicants with PLA client service 2 95% 97% 95%
Percentage of complaints resolved 3 95% 95% 95%
Efficiency measure
Fees income as a percentage of total budget 4 50% 50% 50%
Notes: 1. This standard is measured at audits of licensed brothels, with an audit rating of at least 80 per cent indicating implementation of best
practice standards. 2. This standard is a measure of overall satisfaction. It is measured by surveying applicants.3. This standard refers to the proportion of complaints received in the reporting year that are resolved within the reporting year. As at
23 May 2018, the PLA had received 25 complaints in 2017-18.4. This standard calculates user fees, in the form of brothel licence fees and approved manager's certificate fees, as a percentage of total
PLA revenue. It measures the extent to which the PLA is self-funding, which is contingent on the number of licensed brothels operating.The 2018-19 Target/Est. of 50 per cent was reached due to the expected timing of applications and new applications received.
2018-19 Queensland State Budget - Service Delivery Statements - Police and Public Safety 28

Staffing1
Prostitution Licensing Authority Notes 2017-18
Budget
2017-18
Est. Actual
2018-19
Budget
Prostitution Licensing Authority 10 10 10
Note: 1. Full-time equivalents as at 30 June.
2018-19 Queensland State Budget - Service Delivery Statements - Police and Public Safety 29

Income statement
Prostitution Licensing Authority Notes 2017-18 Budget
$'000
2017-18 Est. Act.
$'000
2018-19 Budget
$'000
INCOME
Taxes .. .. ..
User charges and fees 1,8 860 819 872
Grants and other contributions 729 724 734
Interest 45 42 45
Other revenue 5,4,9 15 15 20
Gains on sale/revaluation of assets .. .. ..
Total income 1,649 1,600 1,671
EXPENSES
Employee expenses 2,10 1,083 1,003 1,075
Supplies and services 6,11 505 518 544
Grants and subsidies .. .. ..
Depreciation and amortisation 13 15 13
Finance/borrowing costs .. .. ..
Other expenses 12 33 33 39
Losses on sale/revaluation of assets 3,7 6 .. ..
Total expenses 1,640 1,569 1,671
OPERATING SURPLUS/(DEFICIT) 9 31 ..
2018-19 Queensland State Budget - Service Delivery Statements - Police and Public Safety 30

Balance sheet
Prostitution Licensing Authority Notes 2017-18 Budget
$'000
2017-18 Est. Act.
$'000
2018-19 Budget
$'000
CURRENT ASSETS
Cash assets 1,431 1,424 1,467
Receivables 9 8 8
Other financial assets .. .. ..
Inventories .. .. ..
Other 16,20 9 9 9
Non-financial assets held for sale .. .. ..
Total current assets 1,449 1,441 1,484
NON-CURRENT ASSETS
Receivables .. .. ..
Other financial assets .. .. ..
Property, plant and equipment 13,17,21 103 83 70
Intangibles .. .. ..
Other 5 5 5
Total non-current assets 108 88 75
TOTAL ASSETS 1,557 1,529 1,559
CURRENT LIABILITIES
Payables 14,18 64 38 38
Accrued employee benefits 15,19 15 29 29
Interest bearing liabilities and derivatives .. .. ..
Provisions .. .. ..
Other 190 190 220
Total current liabilities 269 257 287
NON-CURRENT LIABILITIES
Payables .. .. ..
Accrued employee benefits .. .. ..
Interest bearing liabilities and derivatives .. .. ..
Provisions .. .. ..
Other .. .. ..
Total non-current liabilities .. .. ..
TOTAL LIABILITIES 269 257 287
NET ASSETS/(LIABILITIES) 1,288 1,272 1,272
EQUITY
TOTAL EQUITY 1,288 1,272 1,272
2018-19 Queensland State Budget - Service Delivery Statements - Police and Public Safety 31

Cash flow statement
Prostitution Licensing Authority Notes 2017-18 Budget
$'000
2017-18 Est. Act.
$'000
2018-19 Budget
$'000
CASH FLOWS FROM OPERATING ACTIVITIES
Inflows:
User charges and fees 22,32 860 819 872
Grants and other contributions 729 724 734
Interest received 23,33 45 41 45
Taxes .. .. ..
Other 24,28,34 85 (77) 105
Outflows:
Employee costs 25,35 (1,079) (999) (1,075)
Supplies and services 26,29,36 (500) (534) (559)
Grants and subsidies .. .. ..
Borrowing costs .. .. ..
Other (73) (73) (79)
Net cash provided by or used in operating activities 67 (99) 43
CASH FLOWS FROM INVESTING ACTIVITIES
Inflows:
Sales of non-financial assets 27,30,37 17 44 ..
Investments redeemed .. .. ..
Loans and advances redeemed .. .. ..
Outflows:
Payments for non-financial assets 31,38 (83) (84) ..
Payments for investments .. .. ..
Loans and advances made .. .. ..
Net cash provided by or used in investing activities (66) (40) ..
CASH FLOWS FROM FINANCING ACTIVITIES
Inflows:
Borrowings .. .. ..
Equity injections .. .. ..
Outflows:
Borrowing redemptions .. .. ..
Finance lease payments .. .. ..
Equity withdrawals .. .. ..
Net cash provided by or used in financing activities .. .. ..
Net increase/(decrease) in cash held 1 (139) 43
Cash at the beginning of financial year 1,430 1,563 1,424
Cash transfers from restructure .. .. ..
Cash at the end of financial year 1,431 1,424 1,467
2018-19 Queensland State Budget - Service Delivery Statements - Police and Public Safety 32

Income statementMajor variations between 2017-18 Budget and 2017-18 Estimated Actual include:
1. This decrease is due to the timing of the lodgement of brothel applications and the decrease in brothel numbers.
2. This decrease is due to lower than budgeted staffing levels.
3. This decrease is due to the timing and net effect of the asset replacement program.
Major variations between 2017-18 Budget and 2018-19 Budget include:
4. This increase is due to the increase in penalty infringement notices issued.
5. This increase is due to an increase in penalty infringement notice fines collected.
6. This increase mainly relates to the increase in Board fees.
7. This decrease is due to the timing of the asset replacement program.
Major variations between 2017-18 Estimated Actual and the 2018-19 Budget include:
8. This increase is due to the timing of the lodgement of brothel applications.
9. This increase is due to an expected increase in penalty infringement notice fines to be collected.
10. This increase is due to the enterprise bargaining salary increase and the filling of vacant positions.
11. This increase mainly relates to the increase in Board fees.
12. This increase is due to the increase in penalty infringement notices fines collected and paid to QueenslandTreasury.
Balance sheetMajor variations between 2017-18 Budget and 2017-18 Estimated Actual include:
13. This decrease is due to the timing, depreciation and the net effect of the asset replacement program.
14. This decrease is due to the timing of receiving the creditor invoices.
15. This increase is due to the timing of receiving the employee related invoices.
Major variations between 2017-18 Budget and 2018-19 Budget include:
16. This increase is due to the timing of receiving brothel licence and manager certificate fees.
17. This decrease is due to the timing, depreciation and the net effect of the asset replacement program.
18. This decrease is due to the timing of receiving the creditor invoices.
19. This increase is due to the timing of receiving the employee related invoices.
Major variations between 2017-18 Estimated Actual and the 2018-19 Budget include:
20. This increase is due to the timing of receiving brothel licence and manager certificate fees.
21. This decrease is due to depreciation.
Cash flow statementMajor variations between 2017-18 Budget and 2017-18 Estimated Actual include:
22. This decrease is due to the timing of the lodgement of brothel applications and the decrease in brothel numbers.
23. This decrease is due to the low interest rates received on bank balances.
24. This decrease is due to the timing of the lodgement of brothel applications.
25. This decrease is due to the lower than budgeted staffing levels.
26. This increase mainly relates to the increase in Board fees.
Explanation of variances in the financial statements
2018-19 Queensland State Budget - Service Delivery Statements - Police and Public Safety 33

27. This decrease relates to the timing of the asset replacement program.
Major variations between 2017-18 Budget and 2018-19 Budget include:
28. This increase is due to the timing of the lodgement of brothel applications.
29. This increase mainly relates to the increase in Board fees.
30. This decrease relates to the timing of the asset replacement program.
31. This increase relates to the timing of the asset replacement program.
Major variations between 2017-18 Estimated Actual and the 2018-19 Budget include:
32. This increase is due to the timing of the lodgement of brothel applications.
33. This increase is due to the predicted higher interest rates to be received on bank balances.
34. This increase is due to the timing of the lodgement of brothel applications.
35. This increase is due to the enterprise bargaining salary increase and the filling of vacant positions.
36. This increase mainly relates to the increase in Board fees.
37. This decrease relates to the timing of the asset replacement program.
38. This decrease relates to the timing of the asset replacement program.
2018-19 Queensland State Budget - Service Delivery Statements - Police and Public Safety 34

Public Safety Business Agency
2018-19 Queensland State Budget - Service Delivery Statements - Police and Public Safety 35

Departmental overview The Public Safety Business Agency is committed to its vision to be a leader in corporate services innovation and delivery. The agency supports the Queensland Government’s objectives to keep communities safe and be a responsive Government. The agency's commitment to leadership in services, technology and capability will enhance access to Government services and strengthen Queensland's responsiveness to emergency events through the delivery of corporate and air services, including:
information and communications technology (ICT), financial, procurement, asset management, human resources andother corporate services to the Queensland Police Service, Queensland Fire and Emergency Services (including theRural Fire Service and the Queensland State Emergency Service) and the Office of the Inspector-GeneralEmergency Management
ICT services to the Queensland Ambulance Service and Queensland Corrective Services Queensland Government Air services.Environmental factors influencing service delivery by the agency and its customers include: growth in digital activity, including automation, advanced analytics, increasing social media use and complex cyber
security challenges changing vehicle and building technologies requiring innovative approaches to fleet and asset management increasing frequency and severity of cyclone, storm, bushfire and other emergency events, requiring sophisticated
planning and responsiveness the deconstruction of hierarchical organisations and fixed workplaces, increasing demand for workforce flexibility and
the creation and ceasing of job functions in response to technological and societal change.
Key objectives of the agency include:
productive and responsive services integrated and scaled service platforms innovative and collaborative best practices.
To achieve these objectives, the agency is focusing on the following strategies:
prioritise the most critical core business services re-engineer or eliminate ineffective end-to-end processes and partner with clients to identify solutions strengthen Queensland's responsiveness to emergency events digitise manual processes and streamline services implement Cloud-ready, integrated platforms and expand e-services as mobile, online, easy to use self-services identify external revenue opportunities invest in people and innovation and build a high performing workforce enhance collaboration and relationships across government.
In 2018-19, the agency will:
exploit innovation opportunities, particularly digital, and re-engineer processes collaborate and consult with clients to meet Service Agreement performance targets complete multi-year ICT investment planning with client agencies aligned to ICT strategic investment priorities undertake a strategic review of Queensland Government Air services maintain high safety standards for Queensland Government Air services, including transitioning fixed wing operations
to an Air Operator's Certificate develop enhanced asset and budget lifecycle management practices across the public safety entities implement workforce strategies to increase employee satisfaction and optimise workforce performance for service
delivery to the agency and clients.
The capital program that the agency will deliver includes new or upgraded police and fire and rescue stations across the State, new and replacement police, fire and emergency service vehicles, and a range of ICT initiatives, to support the delivery of essential frontline public safety services to Queensland communities.
2018-19 Queensland State Budget - Service Delivery Statements - Police and Public Safety 36
Service performance
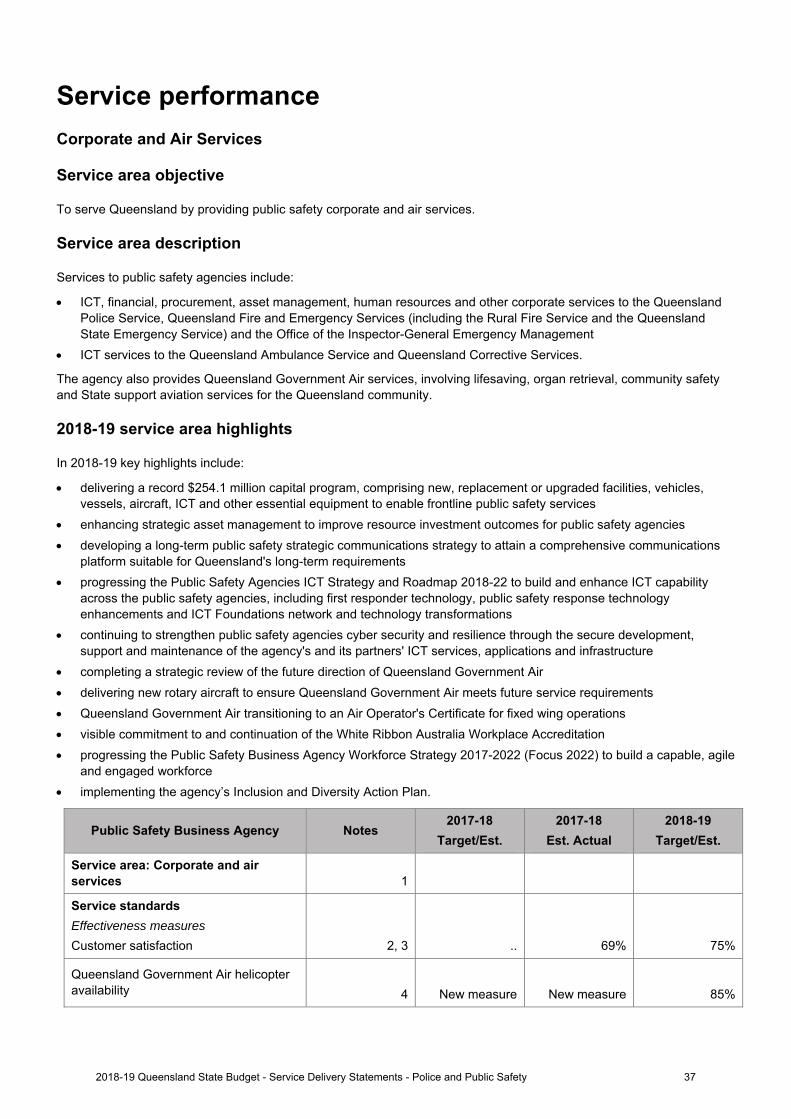
Corporate and Air Services
Service area objective
To serve Queensland by providing public safety corporate and air services.
Service area description
Services to public safety agencies include:
ICT, financial, procurement, asset management, human resources and other corporate services to the QueenslandPolice Service, Queensland Fire and Emergency Services (including the Rural Fire Service and the QueenslandState Emergency Service) and the Office of the Inspector-General Emergency Management
ICT services to the Queensland Ambulance Service and Queensland Corrective Services.
The agency also provides Queensland Government Air services, involving lifesaving, organ retrieval, community safety and State support aviation services for the Queensland community.
2018-19 service area highlights
In 2018-19 key highlights include:
delivering a record $254.1 million capital program, comprising new, replacement or upgraded facilities, vehicles,vessels, aircraft, ICT and other essential equipment to enable frontline public safety services
enhancing strategic asset management to improve resource investment outcomes for public safety agencies developing a long-term public safety strategic communications strategy to attain a comprehensive communications
platform suitable for Queensland's long-term requirements progressing the Public Safety Agencies ICT Strategy and Roadmap 2018-22 to build and enhance ICT capability
across the public safety agencies, including first responder technology, public safety response technologyenhancements and ICT Foundations network and technology transformations
continuing to strengthen public safety agencies cyber security and resilience through the secure development,support and maintenance of the agency's and its partners' ICT services, applications and infrastructure
completing a strategic review of the future direction of Queensland Government Air delivering new rotary aircraft to ensure Queensland Government Air meets future service requirements Queensland Government Air transitioning to an Air Operator's Certificate for fixed wing operations visible commitment to and continuation of the White Ribbon Australia Workplace Accreditation progressing the Public Safety Business Agency Workforce Strategy 2017-2022 (Focus 2022) to build a capable, agile
and engaged workforce implementing the agency’s Inclusion and Diversity Action Plan.
Public Safety Business Agency Notes 2017-18
Target/Est.
2017-18
Est. Actual
2018-19
Target/Est.
Service area: Corporate and air services 1
Service standards
Effectiveness measures
Customer satisfaction 2, 3 .. 69% 75%
Queensland Government Air helicopter availability 4 New measure New measure 85%
2018-19 Queensland State Budget - Service Delivery Statements - Police and Public Safety 37

Public Safety Business Agency Notes 2017-18
Target/Est.
2017-18
Est. Actual
2018-19
Target/Est.
Efficiency measure
Public Safety Business Agency corporate services staff as a percentage of Public Safety Entity staff 5 <6.5% 5.1% <6.5%
Notes: 1. The service area description in the 2017-18 Public Safety Business Agency Service Delivery Statement did not include air services. Air
services have been included in 2018-19 to reflect the critical role of Queensland Government Air in delivering lifesaving, organ retrieval,community safety and State support aviation services for the Queensland community.
2. This service standard informs on overall satisfaction with the agency's services based on all external customer dealings with the agency.Service standard results are derived from a survey of customers, which include the Queensland Police Service, Queensland Fire andEmergency Services, the Office of the Inspector-General Emergency Management, Queensland Ambulance Service, QueenslandCorrective Services and other government departments accessing the agency's services.
3. The agency revised its satisfaction measurement methodologies in 2017 following an agency restructure after the 2016 Review of PublicSafety Business Agency. Due to major structural changes to the agency following the Review, a satisfaction survey was not conducted in2016-17. The establishment of a 2017-18 Target/Estimate was suspended until the satisfaction measurement review was completed andan overall satisfaction baseline had been set. The 2017-18 Estimated Actual overall satisfaction figure is a result of the changedmeasurement approach and is not comparable with previous satisfaction survey results for the agency. Changes to the satisfactionmeasurement approach in 2017 included refinements to sample size and selection, clearer categorisation of the agency's services,benchmarking against other organisations, increased opportunity for qualitative feedback and revised delivery using a contemporary onlinesurvey instrument. In addition to the survey, the agency measures customer satisfaction through Service Agreement performance reviewsand other governance arrangements. The results of this additional measurement are not included in the 2017-18 Estimated Actual figure.The agency will continue to work with key agencies to improve customer satisfaction and measurement.
4. Queensland Government Air owns and operates five helicopters from bases in Archerfield, Townsville and Cairns. This measure indicatesQueensland Government Air's effectiveness in maintaining helicopter availability for tasking by Retrieval Services Queensland to lifesavingand community safety activities, noting that helicopters are subject to a wide range of planned and unplanned factors that may affectavailability. The percentage is calculated by dividing the hours of unavailability for the month by (24 hours x number of days in the month).Queensland Government Air also records the reasons for helicopter unavailability, such as scheduled maintenance, unscheduledmaintenance, training, sick leave etc. The 2018-19 Target/Estimate has been set at a realistic level and is based on availability datarecorded by Queensland Government Air over recent years. The Public Safety Business Agency will continue to investigate industrybenchmarking as part of the strategic review of Queensland Government Air to be completed in 2018-19 and the target will be reviewed for2019-20.
5. This service standard measures the proportion of corporate services required to support public safety entities in the delivery of frontlineservices. The data is based on real expenditure and total full time equivalent staff in the agency, the Queensland Police Service,Queensland Fire and Emergency Services and the Office of the Inspector-General Emergency Management. Figures for this servicestandard compare to the total percentage of corporate services employees across the Queensland Government in 2016-17, whichaveraged approximately 9 per cent.
2018-19 Queensland State Budget - Service Delivery Statements - Police and Public Safety 38

Departmental budget summary The table below shows the total resources available in 2018-19 from all sources and summarises how resources will be applied by service area and by controlled and administered classifications.
Public Safety Business Agency
2017-18
Adjusted Budget
$’000
2017-18
Est. Actual
$’000
2018-19
Budget
$’000
CONTROLLED
Income
Appropriation revenue1
Deferred from previous year/s 3,277 6,406 1,334
Balance of service appropriation 280,723 285,098 278,562
Other revenue 167,039 159,895 174,105
Total income 451,039 451,399 454,001
Expenses
Corporate and air services 424,046 437,286 422,577
Total expenses 424,046 437,286 422,577
Operating surplus/deficit 26,993 14,113 31,424
Net assets 2,854,629 2,748,762 2,933,888
Note: 1. Includes State funding only.
2018-19 Queensland State Budget - Service Delivery Statements - Police and Public Safety 39

Service area sources of revenue1
Sources of revenue
2018-19 Budget
Public Safety Business Agency Total cost
$’000
State
contribution
$’000
User
charges
and fees
$’000
C’wealth
revenue
$’000
Other
revenue
$’000
Corporate and air services 422,577 279,896 25,722 .. 148,383
Total 422,577 279,896 25,722 .. 148,383
Note: 1. Explanations of variances are provided in the financial statements.
2018-19 Queensland State Budget - Service Delivery Statements - Police and Public Safety 40

Budget measures summary
This table shows a summary of budget measures relating to the department since the 2017-18 State Budget. Further details are contained in Budget Measures (Budget Paper 4).
Public Safety Business Agency 2017-18
$’000
2018-19
$’000
2019-20
$’000
2020-21
$’000
2021-22
$’000
Revenue measures
Administered .. .. .. .. ..
Departmental .. .. .. .. ..
Expense measures1
Administered .. .. .. .. ..
Departmental (2,503) 396 .. .. ..
Capital measures
Administered .. .. .. .. ..
Departmental .. 3,728 .. .. ..
Note: 1. Figures reconcile with Budget Measures (Budget Paper 4), including the whole-of-government expense measure ‘Reprioritisations’.
2018-19 Queensland State Budget - Service Delivery Statements - Police and Public Safety 41

Departmental capital program
In 2018-19, the agency's capital program provides an investment of $254.1 million to support the delivery of essential frontline public safety services for Queensland communities. This is a 4.1 per cent increase on the 2017-18 capital program and reflects the Government's focus on increased infrastructure investment across regional Queensland. $82.3 million will be invested on behalf of Queensland Fire and Emergency Services, $123.3 million on behalf of the Queensland Police Service, $39.2 million for aircraft maintenance and rotary-wing aircraft replacement and $8.9 million to support the Queensland Ambulance Service ICT.
Queensland Fire and Emergency Services related program highlights include:
$8.1 million to replace auxiliary-staffed fire and rescue stations in smaller towns and communities across the State. $17.1 million to replace or upgrade permanently-staffed fire and rescue stations, operational, communications,
specialised and air operations response facilities in major regional centres and the greater-Brisbane area. $44.3 million for replacement and new urban and rural fire appliances.
Queensland Police Service related program highlights include:
investments to replace or upgrade stations, specialised policing facilities, vehicles, vessels, equipment andinformation and communications systems in major regional centres and towns to enhance coordination and deliveryof policing, community safety and emergency incident response services and improve community accessibility,including:- $21.2 million to replace or upgrade police stations, watch houses and associated facilities in regional centres,
smaller towns and communities across the State. - $35 million for the new Counter-Terrorism and Community Safety Training Centre, warehouse facility and
heritage buildings refurbishment at Wacol. - $35.3 million for replacement, upgraded and additional police vehicles, vessels and specialised response
vehicles across the State.
Other departmental highlights include:
$39.2 million for aircraft maintenance and rotary-wing aircraft replacement. $8.9 million to support the Queensland Ambulance Service ICT.
Capital budget
Public Safety Business Agency Notes
2017-18
Adjusted Budget
$’000
2017-18
Est. Actual
$’000
2018-19
Budget $’000
Capital purchases 1, 2
Total land, buildings and infrastructure 118,603 107,077 97,903
Total plant and equipment 125,424 132,938 156,179
Total capital purchases 244,027 240,015 254,082
Notes: 1. For more detail on the agency’s capital acquisitions please refer to Capital Statement (Budget Paper 3).2. Capital measures in the 2018-19 Budget have been transferred from Queensland Police Service and Queensland Fire and Emergency
Service and can be viewed in the Public Safety Business Agency Capital Statement (Budget Paper 3).
2018-19 Queensland State Budget - Service Delivery Statements - Police and Public Safety 42

Staffing1
Public Safety Business Agency Notes 2017-18
Budget
2017-18
Est. Actual
2018-19
Budget
Corporate and air services 2, 3, 4, 5 1,144 1,129 1,117
TOTAL 1,144 1,129 1,117
Notes: 1. Full-time equivalents (FTEs) as at 30 June.2. Corporate FTEs are allocated across the service to which they relate.3. The agency participates in a partnership arrangement in the delivery of its services, whereby corporate FTEs are hosted by the agency to
work across multiple departments.4. The 2017-18 Estimated Actual includes adjustments to the 2017-18 Budget which are an additional 1 FTE to manage Corporate Card, less
21 that transitioned to Statistical Services Queensland Police Service, plus an additional 5 FTE for Counter Terrorism Capability.5. The 2018-19 Budget includes adjustments to 2017-18 Estimated Actual which are an additional 4 FTE related to growth in frontline police
officers, less 10 FTE for Commonwealth Games (Corporate Services), less 1 FTE for the Queensland Government Air Cairns FacilityRedevelopment and less 5 FTE for the return of Significant Regional Infrastructure Projects Program functions to Queensland Fire andEmergency Services (3 FTE) and Queensland Police Service (2 FTE).
2018-19 Queensland State Budget - Service Delivery Statements - Police and Public Safety 43

Chart: Total departmental expenses across the Forward Estimates period
Departmental balance sheet
The department's major assets are property, plant and equipment and intangibles ($2.85 billion) and cash ($87.8 million). Non-current assets are expected to increase by 9.4 per cent over the next four years, principally due to anticipated acquisition levels and revaluations over the period. The department's main liabilities relate to payables ($52.1 million) with the value of payables estimated to remain at current levels through to 2021-22.
Budgeted financial statements
Analysis of budgeted financial statements
An analysis of the department's financial statements is provided below:
Departmental income statement
Total expenses are estimated to be $422.6 million in 2018-19, a decrease of $14.7 million from the 2017-18 Estimated Actual. The decrease is mainly due to equity to operating budget transfers for various ICT projects in 2017-18, budget transfers from the Queensland Police Service (QPS) and funding rescheduled into 2017-18 for various ICT and HR projects. The increased expenditure from 2019-20 onwards is mainly due to enterprise bargaining arrangements.
400,000
420,000
440,000
460,000
480,000
500,000
2017-18 2018-19 2019-20 2020-21 2021-22
$'00
0
Financial year
Total expenses
Total expenses
2018-19 Queensland State Budget - Service Delivery Statements - Police and Public Safety 44

Controlled income statement
Public Safety Business Agency Notes
2017-18Adjusted
Budget$'000
2017-18 Est. Act.
$'000
2018-19 Budget
$'000
INCOME
Appropriation revenue 1,5,9 284,000 291,504 279,896
Taxes .. .. ..
User charges and fees 25,360 25,360 25,722
Royalties and land rents .. .. ..
Grants and other contributions 2,6,10 139,103 131,959 145,807
Interest .. .. ..
Other revenue 576 576 576
Gains on sale/revaluation of assets 2,000 2,000 2,000
Total income 451,039 451,399 454,001
EXPENSES
Employee expenses 128,168 126,673 127,585
Supplies and services 3,7,11 154,272 167,507 151,111
Grants and subsidies 528 528 178
Depreciation and amortisation 135,002 135,002 136,076
Finance/borrowing costs 471 471 471
Other expenses 4,8 3,605 5,105 5,156
Losses on sale/revaluation of assets 2,000 2,000 2,000
Total expenses 424,046 437,286 422,577
OPERATING SURPLUS/(DEFICIT) 26,993 14,113 31,424
2018-19 Queensland State Budget - Service Delivery Statements - Police and Public Safety 45
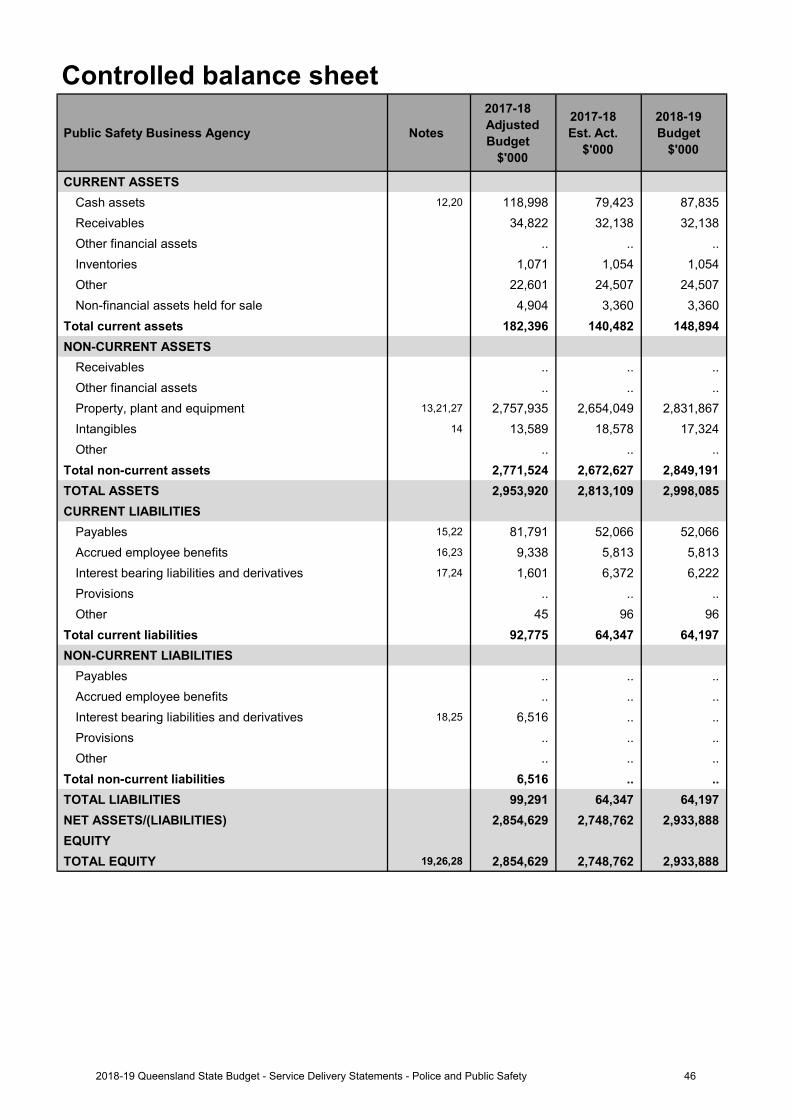
Controlled balance sheet
Public Safety Business Agency Notes
2017-18Adjusted
Budget$'000
2017-18 Est. Act.
$'000
2018-19 Budget
$'000
CURRENT ASSETS
Cash assets 12,20 118,998 79,423 87,835
Receivables 34,822 32,138 32,138
Other financial assets .. .. ..
Inventories 1,071 1,054 1,054
Other 22,601 24,507 24,507
Non-financial assets held for sale 4,904 3,360 3,360
Total current assets 182,396 140,482 148,894
NON-CURRENT ASSETS
Receivables .. .. ..
Other financial assets .. .. ..
Property, plant and equipment 13,21,27 2,757,935 2,654,049 2,831,867
Intangibles 14 13,589 18,578 17,324
Other .. .. ..
Total non-current assets 2,771,524 2,672,627 2,849,191
TOTAL ASSETS 2,953,920 2,813,109 2,998,085
CURRENT LIABILITIES
Payables 15,22 81,791 52,066 52,066
Accrued employee benefits 16,23 9,338 5,813 5,813
Interest bearing liabilities and derivatives 17,24 1,601 6,372 6,222
Provisions .. .. ..
Other 45 96 96
Total current liabilities 92,775 64,347 64,197
NON-CURRENT LIABILITIES
Payables .. .. ..
Accrued employee benefits .. .. ..
Interest bearing liabilities and derivatives 18,25 6,516 .. ..
Provisions .. .. ..
Other .. .. ..
Total non-current liabilities 6,516 .. ..
TOTAL LIABILITIES 99,291 64,347 64,197
NET ASSETS/(LIABILITIES) 2,854,629 2,748,762 2,933,888
EQUITY
TOTAL EQUITY 19,26,28 2,854,629 2,748,762 2,933,888
2018-19 Queensland State Budget - Service Delivery Statements - Police and Public Safety 46

Controlled cash flow statement
Public Safety Business Agency Notes
2017-18Adjusted
Budget$'000
2017-18 Est. Act.
$'000
2018-19 Budget
$'000
CASH FLOWS FROM OPERATING ACTIVITIES
Inflows:
Appropriation receipts 36,45 284,000 286,080 279,896
User charges and fees 29,37 25,360 30,483 30,845
Royalties and land rent receipts .. .. ..
Grants and other contributions 30,38,46 137,053 129,909 143,706
Interest received .. .. ..
Taxes .. .. ..
Other 31,39 576 43,911 43,911
Outflows:
Employee costs (128,168) (126,673) (127,585)
Supplies and services 32,40,47 (154,272) (210,842) (194,446)
Grants and subsidies (528) (528) (178)
Borrowing costs (471) (471) (471)
Other 33,41 (1,555) (8,178) (8,178)
Net cash provided by or used in operating activities 161,995 143,691 167,500
CASH FLOWS FROM INVESTING ACTIVITIES
Inflows:
Sales of non-financial assets 34,42,48 14,800 17,573 19,280
Investments redeemed .. .. ..
Loans and advances redeemed .. .. ..
Outflows:
Payments for non-financial assets 43,49 (244,027) (240,015) (254,082)
Payments for investments .. .. ..
Loans and advances made .. .. ..
Net cash provided by or used in investing activities (229,227) (222,442) (234,802)
CASH FLOWS FROM FINANCING ACTIVITIES
Inflows:
Borrowings .. .. ..
Equity injections 35,44 126,694 132,450 136,374
Outflows:
Borrowing redemptions (150) (150) (150)
Finance lease payments .. .. ..
Equity withdrawals (60,510) (60,510) (60,510)
Net cash provided by or used in financing activities 66,034 71,790 75,714
Net increase/(decrease) in cash held (1,198) (6,961) 8,412
Cash at the beginning of financial year 120,196 86,384 79,423
Cash transfers from restructure .. .. ..
Cash at the end of financial year 118,998 79,423 87,835
2018-19 Queensland State Budget - Service Delivery Statements - Police and Public Safety 47

Income statementMajor variations between 2017-18 Adjusted Budget and 2017-18 Estimated Actual include:
1. Appropriation revenue increase is mainly due to budget transfers from the Queensland Police Service (QPS) andequity to operating budget transfers for various ICT projects in 2017-18. This increase has been partly offset byreprioritisation measures and the transfer of Frontline Integration and Analytics Data Services unit to QPSeffective 1 September 2017.
2. Grants and other contributions decrease is mainly due to a reduction in the contribution from Queensland Fire and Emergency Services (QFES) for the QFES capital program.
3. Supplies and services increase is mainly due to budget transfers from QPS and QFES, and equity to operatingbudget transfers for various ICT projects in 2017-18. This increase has been partly offset by reprioritisationmeasures and the transfer of Frontline Integration and Analytics Data Services unit to QPS effective1 September 2017.
4. Other expenses increase is mainly due to the transfer of funding for the Queensland Government Insurance Fund(QGIF) premium from QPS to the Public Safety Business Agency (PSBA).
Major variations between 2017-18 Adjusted Budget and 2018-19 Budget include:
5. Appropriation revenue decrease is mainly due to reprioritisation measures and the transfer of Frontline Integrationand Analytics Data Services unit to QPS effective 1 September 2017.
6. Grants and other contributions increase is mainly due to an increase to the contribution from QFES to deliver theQFES capital program.
7. Supplies and services decrease is mainly due to reprioritisation measures and the transfer of Frontline Integrationand Analytics Data Services unit to QPS effective 1 September 2017.
8. Other expenses increase is mainly due to the transfer of funding for the QGIF premium from QPS to PSBA.
Major variations between 2017-18 Estimated Actual and the 2018-19 Budget include:
9. Appropriation revenue decrease is mainly due to funding rescheduled into 2017-18 for various ICT and HRprojects, and budget transfers from QPS and equity to operating budget transfers for various ICT projects in2017-18.
10. Grants and other contributions increase is mainly due to an increase to the contribution from QFES to deliver theQFES capital program.
11. Supplies and services decrease is mainly due to funding rescheduled into 2017-18 for various ICT and HRprojects, and budget transfers from QPS and equity to operating budget transfers for various ICT projects in2017-18.
Balance sheetMajor variations between 2017-18 Adjusted Budget and 2017-18 Estimated Actual include:
12. Cash assets decrease is mainly due to movements in receivables, prepayments, accrued employee benefits andpayables.
13. Property, plant and equipment decrease is mainly due to a change in accounting policy for the measurement offire appliances and lower than anticipated revaluations in 2016-17.
14. Intangibles increase is mainly due to higher than anticipated capital acquisitions.
15. Payables decrease reflects anticipated timing of payments to trade creditors.
16. Accrued employee benefits decrease reflects the timing of payments for salaries and wages and related costs.
17. Current interest-bearing liabilities and derivatives increase mainly reflects the reclassification of borrowings fromnon-current liabilities.
18. Non-current interest-bearing liabilities and derivatives decrease reflects the reclassification of borrowings tocurrent liabilities.
Explanation of variances in the financial statements
2018-19 Queensland State Budget - Service Delivery Statements - Police and Public Safety 48
19. Total equity decrease is mainly due to changes in the asset revaluation surplus and a decrease to the operating surplus from the QFES and Queensland Amculance Service (QAS) grant revenue for ICT capital purchases. This decrease has been partly offset by increased equity funding for the capital acquisitions program.
Major variations between 2017-18 Adjusted Budget and 2018-19 Budget include:
20. Cash assets decrease is mainly due to payments for property, plant and equipment and intangibles, and timing ofpayments.
21. Property, plant and equipment increase is mainly due to the capital acquisitions planned for 2018-19.
22. Payables decrease reflects anticipated timing of payments to trade creditors.
23. Accrued employee benefits decrease reflects the timing of payments for salaries and wages and related costs.
24. Current interest-bearing liabilities and derivatives increase mainly reflects the reclassification of borrowings fromnon-current liabilities.
25. Non-current interest-bearing liabilities and derivatives decrease reflects the reclassification of borrowings tocurrent liabilities.
26. Total equity increase is mainly due to an increase to the operating surplus from the QFES and QAS grant revenuefor ICT capital purchases and increased equity funding for the capital acquisitions program. This decrease ispartly offset by changes in the asset revaluation surplus.
Major variations between 2017-18 Estimated Actual and the 2018-19 Budget include:
27. Property, plant and equipment increase is mainly due to revaluation increments and capital acquisitions plannedfor 2018-19.
28. Total equity increase is mainly due to estimated revaluation increments, an increase to the operating surplus fromthe QFES and QAS grant revenue for ICT capital purchases, and increased equity funding for the capitalacquisitions program.
Cash flow statementMajor variations between 2017-18 Adjusted Budget and 2017-18 Estimated Actual include:
29. User charges and fees increase is mainly due to an adjustment for GST.
30. Grants and other contributions decrease is mainly due to a reduction in the contribution from QFES for the QFEScapital program.
31. Other inflows increase is mainly due to an adjustment for GST.
32. Supplies and services increase is mainly due to an adjustment for GST, budget transfers from QPS and QFES,and equity to operating budget transfers for various ICT projects in 2017-18. This increase has been partly offsetby reprioritisation measures and the transfer of Frontline Integration and Analytics Data Services unit to QPSeffective 1 September 2017.
33. Other outflows increase is mainly due to an adjustment for GST.
34. Sale of non-financial assets increase is mainly due to higher than anticipated property disposals.
35. Equity injections increase is mainly due to funding for the QGAir asset renewal program.
Major variations between 2017-18 Adjusted Budget and 2018-19 Budget include:
36. Appropriation receipts decrease is mainly due to reprioritisation measures and the transfer of Frontline Integrationand Analytics Data Services unit to QPS effective 1 September 2017.
37. User charges and fees increase is mainly due to an adjustment for GST.
38. Grants and other contributions increase is mainly due to an increase to the contribution from QFES to deliver theQFES capital program.
39. Other inflows increase is mainly due to an adjustment for GST.
40. Supplies and services increase is mainly due to an adjustment for GST. This increase is partly offset byreprioritisation measures and the transfer of Frontline Integration and Analytics Data Services unit to QPSeffective 1 September 2017.
41. Other outflows increase is mainly due to an adjustment for GST.
42. Sale of non-financial assets increase is mainly due to higher than anticipated property disposals.
2018-19 Queensland State Budget - Service Delivery Statements - Police and Public Safety 49
43. Payments for non-financial assets increase is mainly due to an increase in the PSBA capital program.
44. Equity injections increase is mainly due to funding for the QGAir asset renewal program.
Major variations between 2017-18 Estimated Actual and the 2018-19 Budget include:
45. Appropriation receipts decrease is mainly due to funding rescheduled into 2017-18 for various ICT and HRprojects, and budget transfers from QPS and equity to operating budget transfers for various ICT projects in2017-18.
46. Grants and other contributions increase is mainly due to an increase to the contribution from QFES to deliver theQFES capital program.
47. Supplies and services decrease is mainly due to funding rescheduled into 2017-18 for various ICT and HRprojects, and budget transfers from QPS and equity to operating budget transfers for various ICT projects in2017-18.
48. Sale of non-financial assets increase is mainly due to property disposals.
49. Payments for non-financial assets increase is mainly due to an increase in the PSBA capital program.
2018-19 Queensland State Budget - Service Delivery Statements - Police and Public Safety 50

Glossary of terms
Accrual accounting Recognition of economic events and other financial transactions involving revenue, expenses, assets, liabilities and equity as they occur and reporting in financial statements in the period to which they relate, rather than when a flow of cash occurs.
Administered items Assets, liabilities, revenues and expenses an entity administers, without discretion, on behalf of the Government.
Agency/entity Used generically to refer to the various organisational units within Government that deliver services or otherwise service Government objectives. The term can include departments, commercialised business units, statutory bodies or other organisations established by Executive decision.
Appropriation Funds issued by the Treasurer, under Parliamentary authority, to agencies during a financial year for: • delivery of agreed services• administered items• adjustment of the Government’s equity in agencies, including acquiring of
capital.
Balance sheet A financial statement that reports the assets, liabilities and equity of an entity as at a particular date.
Capital A term used to refer to an entity’s stock of assets and the capital grants it makes to other agencies. Assets include property, plant and equipment, intangible items and inventories that an entity owns/controls and uses in the delivery of services.
Cash Flow Statement A financial statement reporting the cash inflows and outflows for an entity’s operating, investing and financing activities in a particular period.
Controlled items Assets, liabilities, revenues and expenses that are controlled by departments. These relate directly to the departmental operational objectives and arise at the discretion and direction of that department.
Depreciation The periodic allocation of the cost of physical assets, representing the amount of the asset consumed during a specified time.
Equity Equity is the residual interest in the assets of the entity after deduction of its liabilities. It usually comprises the entity’s accumulated surpluses/losses, capital injections and any reserves.
Equity injection An increase in the investment of the Government in a public sector agency.
2018-19 Queensland State Budget - Service Delivery Statements - Police and Public Safety 51

Financial statements Collective description of the Income Statement, the Balance Sheet and the Cash Flow Statement for an entity’s controlled and administered activities.
Income statement A financial statement highlighting the accounting surplus or deficit of an entity. It provides an indication of whether the entity has sufficient revenue to meet expenses in the current year, including non-cash costs such as depreciation.
Outcomes Whole-of-government outcomes are intended to cover all dimensions of community wellbeing. They express the current needs and future aspirations of communities, within a social, economic and environment context.
Own-source revenue Revenue that is generated by an agency, generally through the sale of goods and services, but it may also include some Commonwealth funding.
Priorities Key policy areas that will be the focus of Government activity.
Services The actions or activities (including policy development) of an agency which contribute to the achievement of the agency’s objectives.
Service area Related services grouped into a high level service area for communicating the broad types of services delivered by an agency.
Service standard Define a level of performance that is expected to be achieved appropriate for the service area or service. Service standards are measures of efficiency or effectiveness.
2018-19 Queensland State Budget - Service Delivery Statements - Police and Public Safety 52


Queensland Budget 2018–19 Service Delivery Statements

Queensland Budget 2018–19
Service Delivery Statements
budget.qld.gov.au