
Server Saving
6
1 © 2010 Applied Math Modeling Inc. WP103 Introduction As energy prices continue to rise and con- cerns about global warming due to carbon emissions continue to grow, there is a grow- ing motive to lower the PUE (power usage effectiveness) of data centers worldwide. The PUE of a data center is d efined as Total Fa- cility Power /Total IT Power . The Total Fa- cility Power is comprised of all the power delivered to the entire data center, and the Total IT Power is defined as onl y that which is delivered to the IT equipment. A careful look at this ratio (Figure 1) reveals that the Total Facility Power is dominated by the power to drive the data center cooling system (45%) and the power consumed by the IT equipment (30%). Another way to say this is that 75% of the non-IT power is consumed by the cooling system. By focusing on the power to drive the cooling system and IT equipment as the dominant parameters, an alternative ratio can be defined: Total Cooling Power/Total IT Power , which is often re- ferred to as the Cooling Load Factor (CLF). The Cooling Load Factor is the total power consumed by the chill- ers, CRACS, cooling towers, pumps and other cooling re- lated equipment, divided by the total IT equipment Improving Data Center PUE Through Airflow Management By Paul Bemis and Liz Marshall, Applied Math Modeling Inc., Concord, NH Applied Math Modeling White Paper Figure 1: The breakdown of power utilization in a typical data center February 2010
-
Upload
jorgevelasquez66 -
Category
Documents
-
view
219 -
download
0
Transcript of Server Saving

8/3/2019 Server Saving
http://slidepdf.com/reader/full/server-saving 1/6
1 © 2010 Applied Math Modeling Inc. WP
Introduction
As energy prices continue to rise and con-
cerns about global warming due to carbon
emissions continue to grow, there is a grow-
ing motive to lower the PUE (power usage
effectiveness) of data centers worldwide. The
PUE of a data center is defined as Total Fa-
cility Power /Total IT Power . The Total Fa-
cility Power is comprised of all the power
delivered to the entire data center, and the
Total IT Power is defined as only that which
is delivered to the IT equipment. A careful
look at this ratio (Figure 1) reveals that theTotal Facility Power is dominated by the
power to drive the data center cooling system
(45%) and the power consumed by the IT
equipment (30%).
Another way to say this is that 75% of the
non-IT power is consumed by the cooling
system. By focusing on the power to drive
the cooling system and IT equipment as the
dominant parameters, an alternative ratio can be defined:
Total Cooling Power/Total
IT Power , which is often re-
ferred to as the Cooling Load
Factor (CLF). The Cooling
Load Factor is the total
power consumed by the chill-
ers, CRACS, cooling towers,
pumps and other cooling re-lated equipment, divided by
the total IT equipment
Improving Data Center PUE Through
Airflow Management
By Paul Bemis and Liz Marshall, Applied Math Modeling Inc., Concord, NH
Applied Math Modeling White Paper
Figure 1: The breakdown of power utilization in a typicaldata center
February 2010

8/3/2019 Server Saving
http://slidepdf.com/reader/full/server-saving 2/6
2 © 2010 Applied Math Modeling Inc. WP
power. To accurately deter-
mine the total annual cost
of power to drive the cool-
ing system for a given data
center, one must take into
account the kind of cooling
unit (gas or liquid), the ef-
ficiency of the motors that
drive the fan and compres-
sors, as well as the specific
geographic location of the
data center. If power meas-
urements of the equipment
are not feasible, estimates
must be made that oftenrequire detailed knowledge
from the cooling manufacturer. Rather than
focus on the power required by the cooling
equipment, one can instead use the cooling
capacity of the equipment. In this sense, an-
other modified ratio can be defined: Total
Cooling Capacity / IT Power Consumed . This
ratio can be defined as the “Cooling Capacity
to IT Load Ratio”, and by focusing on these
two parameters and attempting to drive this
ratio down as close as possible to 1.0, the
PUE will also decline in direct proportion.
The cooling for a given data center consists
of two primary components: the total capac-
ity of the cooling system, typically measured
in Tons or Kilowatts, and its related airflow,
typically measured in Cubic Feet per Minute
(CFM). It is important to consider both of
these parameters, since the reason for hot
spots in many data centers is not the total
cooling capacity (this is typically more than
adequate) but rather the inability to get the
cold air to where it is needed.
Baseline Case
To illustrate this point we will use computa-
tional fluid dynamics (CFD) to consider a
hypothetical data center of 2500 square feet
as illustrated in Figure 2. For this data center,
eight Liebert FH600C cooling units are de-
ployed in a slightly staggered (asymmetric)
pattern around the perimeter of the room,creating a total cooling capacity of 1724 kW.
The thermal load consists of six rows of
equipment racks, each row containing 20
racks, and each rack with a thermal load of 7
kW for a total of 840 kW. This results in a
Cooling Capacity to IT Load Ratio of 2.0, a
full 100% higher than should be required to
cool the equipment. Notice, however, that the
airflow supplied by each of the eight
FH600C units is only 17100 CFM, creating a
total airflow capacity of 136,800 CFM. Each
7 kW rack requires 1091 CFM to keep the
temperature rise across the rack to a 20°F
maximum, so with 120 racks in the room, the
total rack demand is 130,920 CFM, nearly
Figure 2: A 2500sq. ft. data center that could operate
more efficiently

8/3/2019 Server Saving
http://slidepdf.com/reader/full/server-saving 3/6
3 © 2010 Applied Math Modeling Inc. WP
5% more than is supplied by the Liebert
cooling units. This will become a significant
consideration when attempting to reduce the
overall power consumption.
One way of improving the PUE for this data
center is to reduce the Cooling Capacity to
IT Load Ratio. The Liebert FH600C uses an
11kW centrifugal blower to supply air to the
data center. If we assume that the cost of
electricity is $.10/kW-hr, the annual cost of
operating just the blower for this unit would
exceed $10,000, and would be nearly twice
that amount when including the work done
by the compressor. Shutting down one of
these units would reduce the PUE and save
money. The question, however, is whether
or not this can be done without causing ex-
cessive temperatures at any of the server
inlets. While shutting down a CRAC unit
looks like a viable option, only a CFD model
can identify which CRAC is the best one to
shut down and whether doing so will result
in troublesome hot spots on any of the equip-
ment.
Figure 3 illustrates the
rack inlet temperatures
in the data center with
all CRACs operating
normally. As can be
seen, there are already
hot spots located at the
ends of the rack rows.
In some cases, the rack inlet temperatures ex-
ceed the ASHRAE rec-
ommended maximum of
80.6°F. The maximum
rack inlet temperature
for this case is 82°F and
the maximum temperature in the room is
91°F. Turning off both the fan and coil on
any of the 8 CRAC units would create a sce-
nario where the total cooling capacity would
be sufficient, but due to the lack of proper
airflow to some servers, extreme tempera-
tures may result. Using CFD, it is a straight-
forward matter to test this possibility and
find out the consequences when each one of
the CRACs is disabled.
To compare scenarios, a CFD model was
created using CoolSim that allowed a series
of 8 simulations to be run concurrently, each
with a CRAC unit shut off in a round robin
fashion. A summary of the simulation results
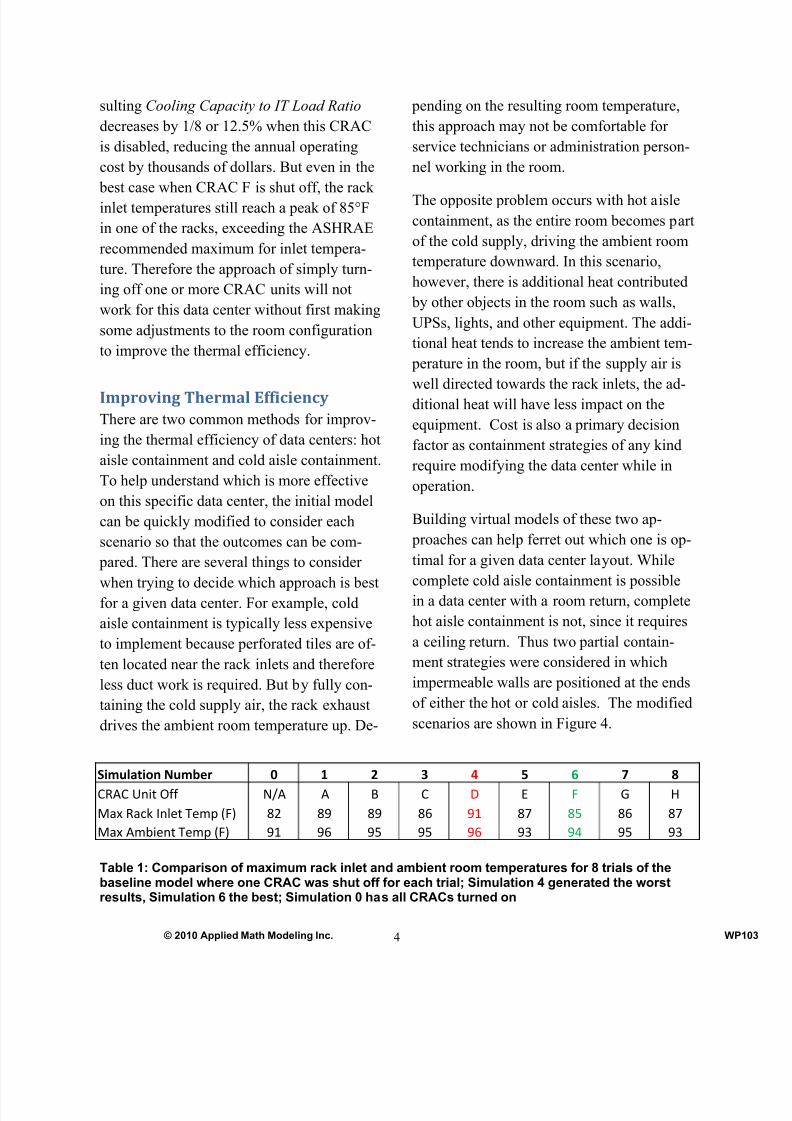
is presented in Table 1. The best case, high-
lighted in green, corresponds to the elimina-
tion of CRAC F (lower corner on the left in
Figure 3). It has the smallest impact on the
maximum rack inlet temperature, and drives
up the maximum temperature in the room by
only 3 degrees, from 91°F to 94°F, according
to the detailed CFD output reports. The re-
Figure 3: Baselinemodel rack inlettemperature profiles
8/3/2019 Server Saving
http://slidepdf.com/reader/full/server-saving 4/6
4 © 2010 Applied Math Modeling Inc. WP
sulting Cooling Capacity to IT Load Ratio
decreases by 1/8 or 12.5% when this CRAC
is disabled, reducing the annual operating
cost by thousands of dollars. But even in the
best case when CRAC F is shut off, the rack
inlet temperatures still reach a peak of 85°F
in one of the racks, exceeding the ASHRAE
recommended maximum for inlet tempera-
ture. Therefore the approach of simply turn-
ing off one or more CRAC units will not
work for this data center without first making
some adjustments to the room configuration
to improve the thermal efficiency.
Improving Thermal Efficiency
There are two common methods for improv-
ing the thermal efficiency of data centers: hot
aisle containment and cold aisle containment.
To help understand which is more effective
on this specific data center, the initial model
can be quickly modified to consider each
scenario so that the outcomes can be com-
pared. There are several things to consider
when trying to decide which approach is bestfor a given data center. For example, cold
aisle containment is typically less expensive
to implement because perforated tiles are of-
ten located near the rack inlets and therefore
less duct work is required. But by fully con-
taining the cold supply air, the rack exhaust
drives the ambient room temperature up. De-
pending on the resulting room temperature,
this approach may not be comfortable for
service technicians or administration person-
nel working in the room.
The opposite problem occurs with hot aisle
containment, as the entire room becomes part
of the cold supply, driving the ambient room
temperature downward. In this scenario,
however, there is additional heat contributed
by other objects in the room such as walls,
UPSs, lights, and other equipment. The addi-
tional heat tends to increase the ambient tem-
perature in the room, but if the supply air is
well directed towards the rack inlets, the ad-
ditional heat will have less impact on the
equipment. Cost is also a primary decision
factor as containment strategies of any kind
require modifying the data center while in
operation.
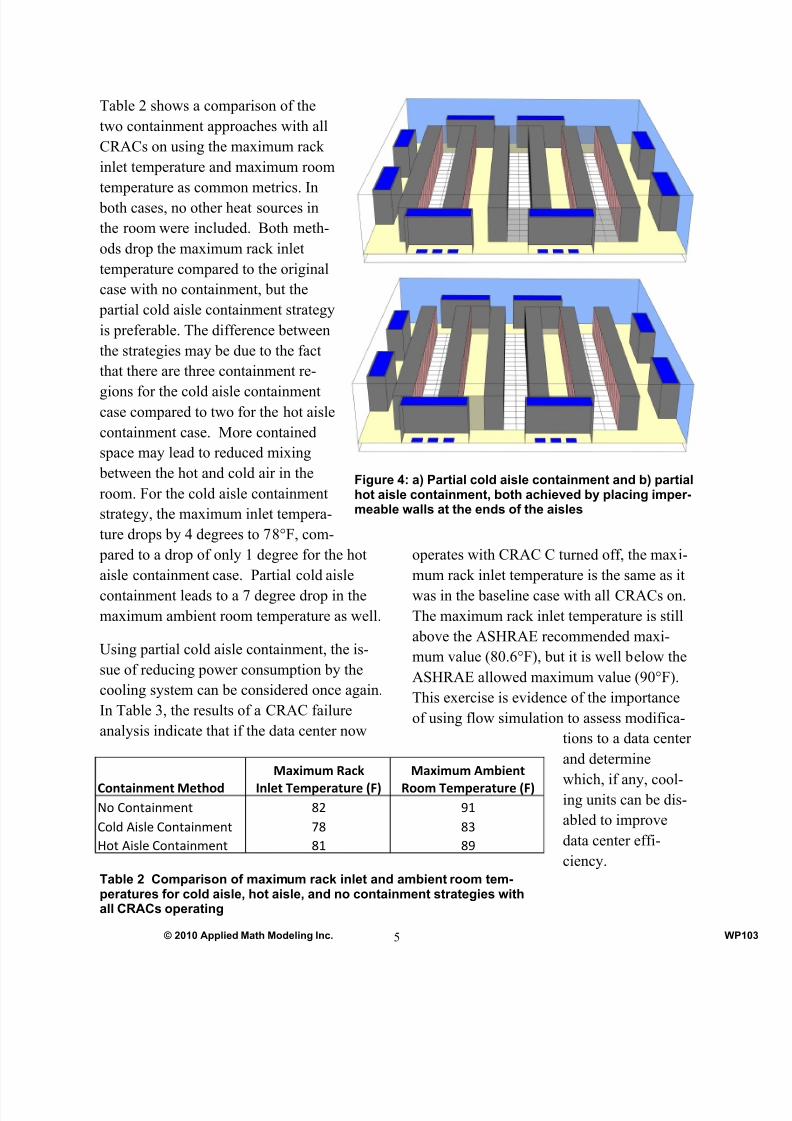
Building virtual models of these two ap-
proaches can help ferret out which one is op-
timal for a given data center layout. While
complete cold aisle containment is possible
in a data center with a room return, complete
hot aisle containment is not, since it requires
a ceiling return. Thus two partial contain-
ment strategies were considered in which
impermeable walls are positioned at the ends
of either the hot or cold aisles. The modified
scenarios are shown in Figure 4.
Table 1: Comparison of maximum rack inlet and ambient room temperatures for 8 trials of thebaseline model where one CRAC was shut off for each trial; Simulation 4 generated the worstresults, Simulation 6 the best; Simulation 0 has all CRACs turned on
Simulation Number 0 1 2 3 4 5 6 7 8
CRAC Unit Off N/A A B C D E F G H
Max Rack Inlet Temp (F) 82 89 89 86 91 87 85 86 87
Max Ambient Temp (F) 91 96 95 95 96 93 94 95 93
8/3/2019 Server Saving
http://slidepdf.com/reader/full/server-saving 5/6
5 © 2010 Applied Math Modeling Inc. WP
Table 2 shows a comparison of the
two containment approaches with all
CRACs on using the maximum rack
inlet temperature and maximum room
temperature as common metrics. In
both cases, no other heat sources in
the room were included. Both meth-
ods drop the maximum rack inlet
temperature compared to the original
case with no containment, but the
partial cold aisle containment strategy
is preferable. The difference between
the strategies may be due to the fact
that there are three containment re-
gions for the cold aisle containmentcase compared to two for the hot aisle
containment case. More contained
space may lead to reduced mixing
between the hot and cold air in the
room. For the cold aisle containment
strategy, the maximum inlet tempera-
ture drops by 4 degrees to 78°F, com-
pared to a drop of only 1 degree for the hot
aisle containment case. Partial cold aisle
containment leads to a 7 degree drop in the
maximum ambient room temperature as well.
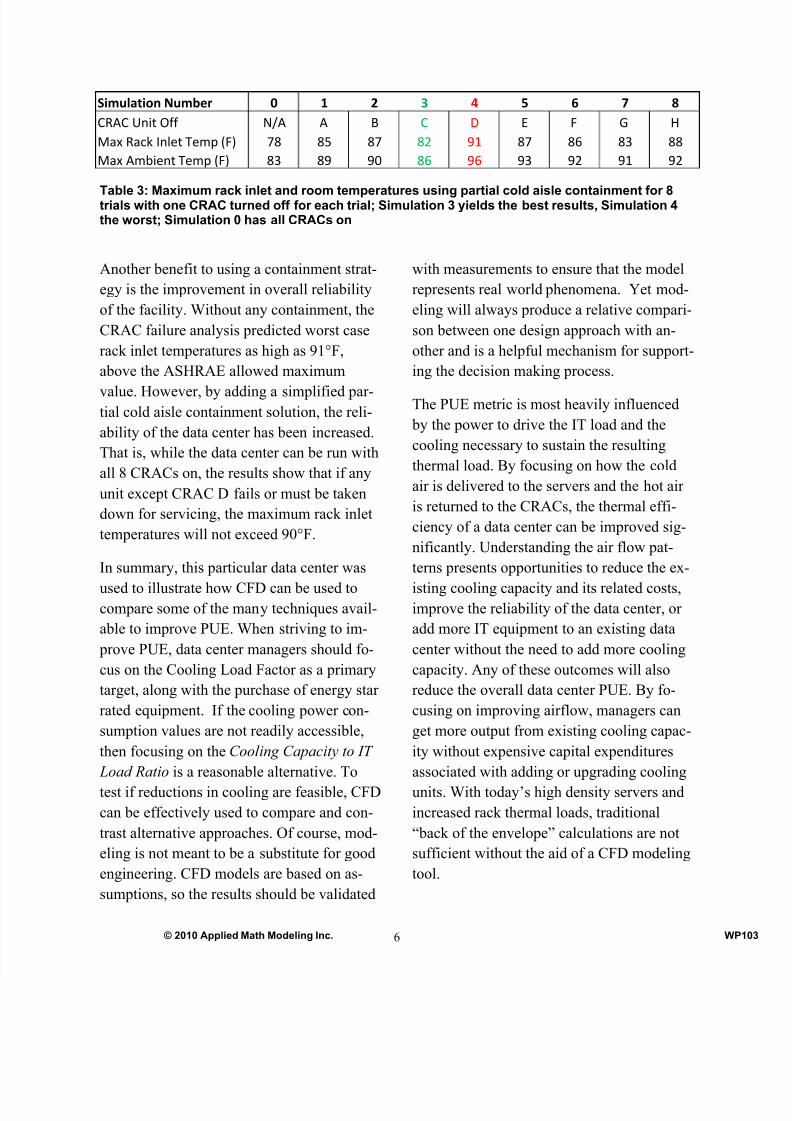
Using partial cold aisle containment, the is-
sue of reducing power consumption by the
cooling system can be considered once again.
In Table 3, the results of a CRAC failure
analysis indicate that if the data center now
operates with CRAC C turned off, the maxi-
mum rack inlet temperature is the same as it
was in the baseline case with all CRACs on.
The maximum rack inlet temperature is still
above the ASHRAE recommended maxi-
mum value (80.6°F), but it is well below the
ASHRAE allowed maximum value (90°F).
This exercise is evidence of the importance
of using flow simulation to assess modifica-
tions to a data center
and determine
which, if any, cool-ing units can be dis-
abled to improve
data center effi-
ciency.Table 2 Comparison of maximum rack inlet and ambient room tem-peratures for cold aisle, hot aisle, and no containment strategies withall CRACs operating
Containment Method
Maximum Rack
Inlet Temperature (F)
Maximum Ambient
Room Temperature (F)
No Containment 82 91
Cold Aisle Containment 78 83
Hot Aisle Containment 81 89
Figure 4: a) Partial cold aisle containment and b) partialhot aisle containment, both achieved by placing imper-meable walls at the ends of the aisles
8/3/2019 Server Saving
http://slidepdf.com/reader/full/server-saving 6/6
6 © 2010 Applied Math Modeling Inc. WP
Another benefit to using a containment strat-
egy is the improvement in overall reliability
of the facility. Without any containment, the
CRAC failure analysis predicted worst case
rack inlet temperatures as high as 91°F,
above the ASHRAE allowed maximum
value. However, by adding a simplified par-tial cold aisle containment solution, the reli-
ability of the data center has been increased.
That is, while the data center can be run with
all 8 CRACs on, the results show that if any
unit except CRAC D fails or must be taken
down for servicing, the maximum rack inlet
temperatures will not exceed 90°F.
In summary, this particular data center was
used to illustrate how CFD can be used tocompare some of the many techniques avail-
able to improve PUE. When striving to im-
prove PUE, data center managers should fo-
cus on the Cooling Load Factor as a primary
target, along with the purchase of energy star
rated equipment. If the cooling power con-
sumption values are not readily accessible,
then focusing on the Cooling Capacity to IT
Load Ratio is a reasonable alternative. To
test if reductions in cooling are feasible, CFD
can be effectively used to compare and con-
trast alternative approaches. Of course, mod-
eling is not meant to be a substitute for good
engineering. CFD models are based on as-
sumptions, so the results should be validated
with measurements to ensure that the model
represents real world phenomena. Yet mod-
eling will always produce a relative compari-
son between one design approach with an-
other and is a helpful mechanism for support-
ing the decision making process.
The PUE metric is most heavily influenced
by the power to drive the IT load and the
cooling necessary to sustain the resulting
thermal load. By focusing on how the cold
air is delivered to the servers and the hot air
is returned to the CRACs, the thermal effi-
ciency of a data center can be improved sig-
nificantly. Understanding the air flow pat-
terns presents opportunities to reduce the ex-
isting cooling capacity and its related costs,improve the reliability of the data center, or
add more IT equipment to an existing data
center without the need to add more cooling
capacity. Any of these outcomes will also
reduce the overall data center PUE. By fo-
cusing on improving airflow, managers can
get more output from existing cooling capac-
ity without expensive capital expenditures
associated with adding or upgrading cooling
units. With today’s high density servers and
increased rack thermal loads, traditional
“back of the envelope” calculations are not
sufficient without the aid of a CFD modeling
tool.
Table 3: Maximum rack inlet and room temperatures using partial cold aisle containment for 8trials with one CRAC turned off for each trial; Simulation 3 yields the best results, Simulation 4the worst; Simulation 0 has all CRACs on
Simulation Number 0 1 2 3 4 5 6 7 8
CRAC Unit Off N/A A B C D E F G H
Max Rack Inlet Temp (F) 78 85 87 82 91 87 86 83 88
Max Ambient Temp (F) 83 89 90 86 96 93 92 91 92