The Influence of Perceived Organizational Support on Affective Commitment

Walden UniversityScholarWorks
Walden Dissertations and Doctoral Studies Walden Dissertations and Doctoral StudiesCollection
2017
Servant Leadership and Affective Commitment toChange in Manufacturing OrganizationsJeffrey SchulkersWalden University
Follow this and additional works at: https://scholarworks.waldenu.edu/dissertations
Part of the Business Commons
This Dissertation is brought to you for free and open access by the Walden Dissertations and Doctoral Studies Collection at ScholarWorks. It has beenaccepted for inclusion in Walden Dissertations and Doctoral Studies by an authorized administrator of ScholarWorks. For more information, pleasecontact [email protected].

Walden University
College of Management and Technology
This is to certify that the doctoral study by
Jeffrey Schulkers
has been found to be complete and satisfactory in all respects,
and that any and all revisions required by
the review committee have been made.
Review Committee
Dr. Michael Lavelle, Committee Chairperson, Doctor of Business Administration Faculty
Dr. Janet Booker, Committee Member, Doctor of Business Administration Faculty
Dr. Gergana Velkova, University Reviewer, Doctor of Business Administration Faculty
Chief Academic Officer
Eric Riedel, Ph.D.
Walden University
2017

Abstract
Servant Leadership and Affective Commitment to Change in Manufacturing
Organizations
by
Jeffrey Lee Schulkers
MBA, South University, 2012
BA, University of Minnesota – Twin Cities, 2005
Doctoral Study Submitted in Partial Fulfillment
of the Requirements for the Degree of
Doctor of Business Administration
Walden University
March 2017

Abstract
Organizational change initiatives in the United States frequently fail with estimated
failure rates as high as 90%. Change failure rates resulting from underused and poorly
trained front-line managers (FLMs) remained high, with no signs of improvement in the
past 2 decades. The purpose of the correlational study, grounded in servant leadership
theory, was to examine the relationship between employee perceptions of their FLM’s
servant leadership dimensions and employee affective commitment to change. A
purposive, nonprobability sample of 107 employees of a U.S. manufacturing organization
that had recently undergone organizational change completed a questionnaire for the
study. Results of the multiple linear regression analysis were not significant, F(7, 107) =
.714, p = .660, R2 = 0.045. Though results were not statistically significant, the beta
weights for creating value for the community (β = .165) and behaving ethically (β = .168)
indicated that creating value for the community and behaving ethically were potentially
the most important variables in accounting for variance in the model. The beta weights
for emotional healing (β = -.048) and conceptual skills (β = -.047) indicated that
emotional healing and conceptual skills were potentially the least important variables in
accounting for variance in the model. The findings may be of value to manufacturing
leaders developing initiatives to improve change initiative success rates. Support for
servant leadership during periods of organizational change has positive social change
implications for employees. The practice of servant leadership reduces employee
uncertainty and anxiety incurred during periods of change by resolving uncertainties and
sustaining employee motivation for supporting organizational change.
Servant Leadership and Affective Commitment to Change in Manufacturing
Organizations
by
Jeffrey Lee Schulkers
MBA, South University, 2012
BA, University of Minnesota – Twin Cities, 2005
Doctoral Study Submitted in Partial Fulfillment
of the Requirements for the Degree of
Doctor of Business Administration
Walden University
March 2017
Dedication
I dedicate this study to my son, Thomas, to my mother, Joan, and to my father,
Jerry. To my son, Thomas, there is nothing you can’t achieve, and I will move heaven
and earth to support you through this life. Words can’t express how much I love you. I
hope your natural curiosity and love of learning continues and that you pass these onto
future generations of Schulkers. To my mother, thank you for always believing in me and
for your continuous support. Your accomplishments in life set the bar high for your
children and taught us hard work pays off. You should be extremely proud to have two
children earning their doctorates in the same month! Lastly, I dedicate this study to my
late father whom I was too young to know when he passed. I think of you when I look at
my son and hope I have made you proud.

Acknowledgments
I want to thank my professors at Walden University for their support and
encouragement throughout the program. Specifically, I want to thank my committee
chair, Dr. Michael Lavelle. You are a true mentor, and I couldn’t have done this without
you. I thank you not just for being my chair, but for your dedication and encouragement
for all your students. I would also like to thank my second committee member, Dr. Janet
Booker. Thank you for your timely feedback and guidance throughout this journey.
Lastly, I want to thank Dr. Gergana Velkova. When I look back at this program, I will
remember your expert reviews as most instrumental to my academic growth.
i
Table of Contents
List of Tables ..................................................................................................................... iv
List of Figures ......................................................................................................................v
Section 1: Foundation of the Study ......................................................................................1
Background of the Problem ...........................................................................................2
Problem Statement .........................................................................................................3
Purpose Statement ..........................................................................................................3
Nature of the Study ........................................................................................................4
Research Question .........................................................................................................5
Hypotheses .....................................................................................................................5
Theoretical Framework ..................................................................................................6
Operational Definitions ..................................................................................................6
Assumptions, Limitations, and Delimitations ................................................................7
Assumptions ............................................................................................................ 7
Limitations .............................................................................................................. 8
Delimitations ........................................................................................................... 8
Significance of the Study ...............................................................................................9
A Review of the Professional and Academic Literature ..............................................10
Servant Leadership Theory ................................................................................... 12
Rival Theories ....................................................................................................... 16
Measurement ......................................................................................................... 19
Servant Leadership................................................................................................ 21

ii
Commitment to Change ........................................................................................ 32
Methodologies....................................................................................................... 41
Front-Line Management During Organizational Change ..................................... 42
Transition and Summary ..............................................................................................55
Section 2: The Project ........................................................................................................56
Purpose Statement ........................................................................................................56
Role of the Researcher .................................................................................................57
Participants ...................................................................................................................58
Research Method and Design ......................................................................................60
Research Method .................................................................................................. 60
Research Design.................................................................................................... 62
Population and Sampling .............................................................................................64
Ethical Research...........................................................................................................67
Instrumentation ............................................................................................................69
Data Collection Technique ..........................................................................................75
Data Analysis ...............................................................................................................77
Study Validity ..............................................................................................................80
Transition and Summary ..............................................................................................81
Section 3: Application to Professional Practice and Implications for Change ..................82
Introduction ..................................................................................................................82
Presentation of the Findings.........................................................................................83
Test of Assumptions ............................................................................................. 84
iii
Descriptive Statistics ............................................................................................. 87
Inferential Results ................................................................................................. 89
Applications to Professional Practice ..........................................................................97
Implications for Social Change ....................................................................................99
Recommendations for Action ....................................................................................100
Recommendations for Further Research ....................................................................102
Reflections .................................................................................................................103
Summary and Study Conclusions ..............................................................................104
References ........................................................................................................................106
Appendix A: SL-28 Servant Leadership Scale ................................................................123
Appendix B: Commitment to Change Inventory .............................................................126
Appendix C: Instruments Use Request ............................................................................127
Appendix D: Email to Participate in Survey....................................................................129
Appendix E: National Institutes of Health Certificate of Completion .............................130

iv
List of Tables
Table 1. Synopsis of Literature Review Sources .............................................................. 12
Table 2. Distribution of Commitment to Change Methodologies .................................... 42
Table 3. Definitions of Servant Leadership Dimensions .................................................. 70
Table 4. Correlation Coefficients Collinearity Statistics for Study Independent Variables
........................................................................................................................................... 85
Table 5. Descriptive Statistics........................................................................................... 88
Table 6. Model Summary With Dependent Variable Affective Commitment to Change 90
Table 7. Analysis of Variance ........................................................................................... 90
Table 8. Regression Analysis Summary for Predictor Variables ..................................... 91
v
List of Figures
Figure 1. Organization of the literature review ..................................................................11
Figure 2. Power as a function of sample size.....................................................................66
Figure 3. Normal probability plot of the regression-standardized residual .......................86
Figure 4. Scatterplot of the standardized residuals ............................................................87

1
Section 1: Foundation of the Study
Organizational change affects all organizations without exception. The ability to
change is necessary for organizational survival and to remain competitive (Holt &
Vardaman, 2013). Employers must initiate frequent change and employees must commit
to organizational changes to enable adaptability within their markets (Dermol & Cater,
2013). Despite the need for continual change, change initiative failure rates remain high
with no signs of improvement (Maurer, 2011). Strong, ethical leadership is even more
important during change initiatives as leaders face moral compromises that potentially
damage employee perceptions of leader credibility (Sharif & Scandura, 2014).
Researchers are increasingly interested in how front-line managers (FLMs), who spend
the most time with employees, influence employees to engage in positive change
behaviors (Evans, 2015).
FLMs both positively and negatively influence their followers. As economic and
environmental uncertainty increases, scholars theorize that servant leadership is an
increasingly effective leadership style that positively influences employee change
behaviors, such as commitment to change (de Sousa & van Dierendonck, 2014).
Commitment to change is significantly related to change success, as it is a strong
indicator of the employee support needed for organizational changes to work (Abrell-
Vogel & Rowold, 2014; Herscovitch & Meyer, 2002). In this study, I examined the
relationship between employee perception of their FLM’s servant leadership dimensions
and employee affective commitment to change (ACC).
2
Background of the Problem
Despite advancements in change management theory, a proliferation of
consultants, and increased access to literature, change initiative failure rates have
consistently remained near 70% for decades with no clear model on how to avoid failure
(Decker et al., 2012; Maurer, 2011). While organizations continue to experience high
change initiative failure rates, business leaders must remain adaptive through
systematically managed change in hyper-competitive environments (Klarner & Raisch,
2013). A knowing-doing gap is growing as business leaders become increasingly
knowledgeable in change management techniques and principles while their ability to
manage change successfully remains unchanged (Maurer, 2011).
Both researchers and business leaders historically underemphasized the
importance of FLMs in delivering change (Nielsen, 2013). FLMs receive little to no
training in how to manage change, nor receive opportunities to contribute input to change
strategy formulation (Nielsen, 2013). The net result is that FLMs are less efficient in
managing change (Nielsen, 2013). FLMs can become more effective in managing change
and facilitate change implementation through their interactions and relationships with
employees (Shin, Taylor, & Seo, 2012). FLMs can (a) implement servant leadership to
meet the psychological needs of employees during periods of change, (b) drive positive
change behaviors, and (c) encourage engagement in the change process (de Sousa & van
Dierendonck, 2014).
3
Problem Statement
Organizational change initiatives in the United States frequently fail with
estimated failure rates as high as 90% (Cândido & Santos, 2015). Improved change
leadership is especially needed in the manufacturing industry, as large-scale
organizational changes evidenced by 3,944 mass manufacturing layoff actions in the last
year of available data represent nearly a third of all mass layoffs throughout the United
States (Bureau of Labor Statistics, 2013). The general business problem that I addressed
in this study is that high organizational change failure rates negatively affect business
organizations. The specific business problem that I addressed in this study is that some
manufacturing leaders do not know the relationship between employee perception of their
FLM’s servant leadership dimensions and employee ACC.
Purpose Statement
The purpose of this quantitative study was to examine the relationship between
employee perceptions of their FLM’s servant leadership dimensions and employee ACC.
The independent variables were employee perceptions of their FLM’s (a) conceptual
skills, (b) empowering, (c) helping subordinates grow and succeed, (d) putting
subordinates first, (e) behaving ethically, (f) emotional healing, and (g) creating value for
the community. The dependent variable was employee ACC. The targeted population
was manufacturing firms located in the United States. This study promoted positive
social change and the potential to improve business practices by providing information
manufacturing leaders might use to increase the probability of change success and reduce
change implementation costs. Increased change success rates might benefit communities
4
through access to more affordable, higher quality goods and services. The implications
for positive social change also include the potential to decrease employee anxiety and
uncertainty during organizational change.
Nature of the Study
I used a quantitative method, as it was the appropriate method to examine the
relationship between independent and dependent variables in this study. Researchers use
quantitative methods to test a theory objectively using numerically measured independent
and dependent variables, as well as mathematical methods (Yilmaz, 2013). Conversely,
researchers use qualitative methodologies to explore or develop a better understanding of
the context or meaning behind phenomena such as human experiences, reactions, and
emotions (Arghode, 2012). In a mixed-methods approach, researchers combine
quantitative and qualitative methodologies to generate new hypotheses or theories or
triangulate previous research findings (Leedy & Ormrod, 2013).
I used a correlational design using multiple linear regression (MLR) to address the
research question for this study. Quantitative research designs include experimental,
quasiexperimental, and nonexperimental correlational designs (Castillo-Page, Bodilly, &
Bunton, 2012). Researchers use correlational designs to identify and examine
relationships between variables in nonexperimental research when the sample is of
sufficient size (Castillo-Page et al., 2012). Researchers use MLR in a correlational design
to model the relationship between a set of independent variables and a dependent variable
(Nimon & Oswald, 2013). I used MLR to assess the role multiple employee-perceived
servant leadership dimensions played in accounting for variance in ACC. I chose not to

5
use an experimental or quasiexperimental design. In an experimental design, researchers
randomly assign participants to experimental and control groups to determine the degree
and nature of causality (Castillo-Page et al., 2012). In quasiexperimental designs,
researchers examine the relationships between experimental variables among nonrandom
populations (Castillo-Page et al., 2012).
Research Question
I used the following research question in my study: What is the relationship
between employee perception of their FLM’s (a) conceptual skills, (b) empowering, (c)
helping subordinates grow and succeed, (d) putting subordinates first, (e) behaving
ethically, (f) emotional healing, (g) creating value for the community, and employee
ACC?
Hypotheses
The null and alternative hypotheses were:
H01: There is no statistically significant relationship between employee
perception of their FLM’s (a) conceptual skills, (b) empowering, (c) helping subordinates
grow and succeed, (d) putting subordinates first, (e) behaving ethically, (f) emotional
healing, (g) creating value for the community, and employee ACC.
Ha1: There is a statistically significant relationship between employee perception
of their FLM’s (a) conceptual skills, (b) empowering, (c) helping subordinates grow and
succeed, (d) putting subordinates first, (e) behaving ethically, (f) emotional healing, (g)
creating value for the community, and employee ACC.
6
Theoretical Framework
The servant leadership theory served as the foundation for this study. Greenleaf
(1977) developed the servant leadership theory. Greenleaf based servant leadership
theory on the premise that one should be a servant first and place follower needs above
those of the leader, thereby creating strong relationships within an organization. Liden,
Wayne, Zhao, and Henderson (2008) furthered this theory and developed a multifactorial
servant leadership construct capturing seven distinct servant leadership dimensions. The
seven servant leadership dimensions Liden et al. identified were (a) conceptual skills, (b)
empowering, (c) helping subordinates grow and succeed, (d) putting subordinates first,
(e) behaving ethically, (f) emotional healing, and (g) creating value for the community.
Researchers have used servant leadership theory to explain leadership based on
the premise that leaders can inspire positive employee behaviors such as commitment to
change (Kool & van Dierendonck, 2012). Servant leaders focus on satisfying the needs of
their followers, thereby encouraging a reciprocal relationship where employees then feel
obligated to commit to leader requests (Kool & van Dierendonck, 2012). As applied to
this study, servant leadership theory supported that I would expect employee-perceived
FLM servant leadership dimensions to influence or partially explain ACC.
Operational Definitions
The operational definitions listed in this section provide definitions for technical
language or special words found in this study.
Affective commitment to change: Affective commitment to change (ACC) is the
commitment to change via internalization of and positive emotional engagement with the
7
change initiative, influencing increased individual effort to ensure change success
(Herscovitch & Meyer, 2002).
Front-line manager: Front-line managers (FLMs) are individuals with supervisory
or management responsibilities working at the operational level of an organization
including team leaders, supervisors, front-line supervisors, FLMs, first-line supervisors,
and first-line managers (Townsend & Russell, 2013).
Servant leadership: Leaders demonstrate servant leadership by serving the needs
of others and placing follower needs above those of the leader, thereby creating strong
relationships within an organization (Greenleaf, 1977).
Assumptions, Limitations, and Delimitations
Researchers discuss the assumptions, limitations, and delimitations of a study to
identify unverified statements or beliefs, potential limitations to analysis techniques or
findings, and any potential boundaries for the research project or research constructs
(Keller, 2009). The following is a discussion of assumptions, limitations, and
delimitations of this study.
Assumptions
Assumptions are unverified statements or beliefs researchers assume to be true
(Bower & Maxham, 2012). I made two assumptions for this study. The first assumption
was that participants would answer all survey questions truthfully. The second
assumption was that the questions in both data collection instruments were clear and easy
to understand.

8
Limitations
Limitations are possible restrictions with analysis, including threats to internal
and external validity (Keller, 2009). The first limitation was that I included only
participants from a single occupational group and single organization. Collecting data
from a single occupational group and single organization may limit the generalizability of
results (Herscovitch & Meyer, 2002). Second, I invited only hourly employees to
participate in the study, and I did not measure FLMs’ perceptions. Third, I did not
measure FLMs’ ACC as a control variable. FLMs exhibiting high levels of commitment
to change may influence their employees to show high levels of commitment to change
(Bouckenooghe, de Clercq, & Deprez, 2014). Fourth, I administered both data collection
instruments at the same time. Study findings may, as a result, contain common method
bias. Researchers may introduce common method bias when participants self-report
measures for both independent and dependent variables with no time separation between
data collection (de Clercq, Bouckenooghe, Raja, & Matsyborska, 2014). Last, researchers
cannot determine causality when using nonexperiental correlational designs (Herscovitch
& Meyer, 2002).
Delimitations
Delimitations are the boundaries set by a construct, area, idea, or a research
proposal (Gabriele & Chiaravalloti, 2013). I limited the scope of this study to examining
the relationship between employee perception of their FLM’s servant leadership
dimensions and employee ACC. The participating organization could only be a
manufacturing organization within the United States. Study participants comprised solely

9
of hourly manufacturing employees in operations or support roles. No salaried employees
or FLMs participated in this study.
Significance of the Study
The significance of this study was the potential to improve business practices by
providing information manufacturing leaders might use regarding how employee-
perceived FLM servant leadership dimensions correlate with the employee commitment
to change needed for change success. Change failure rates remain high with no signs of
improvement in the past 2 decades (Maurer, 2011). Manufacturing leaders often underuse
and poorly train FLMs to lead during periods of change, which contributes to high
change failure rates (Semper, 2011). Manufacturing leaders may use my findings to
improve the probability of organizational change initiative success through improved
FLM change leadership. Manufacturing leaders can also use information that resulted
from this study to encourage FLMs to exhibit servant leadership dimensions that
positively correlated with the employee ACC needed for change initiatives to succeed.
The implications for positive social change include the potential to enhance
manufacturing leaders’ understanding of and support for servant leadership, which could
lead to reduced employee anxiety and uncertainty during periods of change. Employees
often incur adverse psychological impacts such as increased anxiety and uncertainty
during organizational change (Michela & Vena, 2012). FLMs can engage in servant
leadership behaviors to positively affect the lives of their employees during periods of
change by sustaining motivations and reducing anxieties associated with change (de
Sousa & van Dierendonck, 2014). The implications for positive social change also

10
include decreased product costs and improved quality of goods and services offered to
people. Communities may benefit from more affordable, higher quality goods and
services resulting from reduced change failure rates.
A Review of the Professional and Academic Literature
The literature review includes current research from peer-reviewed journal
articles, non-peer-reviewed journal articles, seminal works, and scholarly books. The
literature review consists primarily of peer-reviewed journal articles published from 2012
to 2015. The literature review includes research conducted in the areas of servant
leadership theory, rival leadership theories, organizational change, change management,
front-line management, and commitment to change.
The literature review contains three main sections (see Figure 1) including (a)
servant leadership, (b) commitment to change, and (c) front-line management during
organizational change. In the first section, I discuss (a) servant leadership theory, (b) rival
theories, (c) measurement, and (d) servant leadership. In the second section, I discuss (a)
ACC, (b) measurement, and (c) methodologies. The third section includes supporting
discussions on (a) organizational change and (b) front-line management in
manufacturing.

11
Figure 1. Organization of the literature review.
The literature review resulted from my search for scholarly, peer-reviewed journal
articles published in 2012 or later. I primarily used Walden University’s Online Library
and Google Scholar. Specific databases that I used were ABI/INFORM Complete,
Business Source Complete, Dissertations and Theses at Walden University, Emerald
Management Journals, ProQuest Central, and SAGE Premier. Keywords that I used were
servant leader, change management, middle manager, front-line leader, front-line
manager, supervisor, manufacturing, quantitative, qualitative, and commitment to
Servant leadership and affective commitment to change
Servant leadership
Servant leadership theory
Rival theories
Measurement
Servant leadership
Commitment to change
Affective commitment to
change
Measurement
Methodologies
Front-line management during organizational change
Organizational change
Front-line management in manufacturing
12
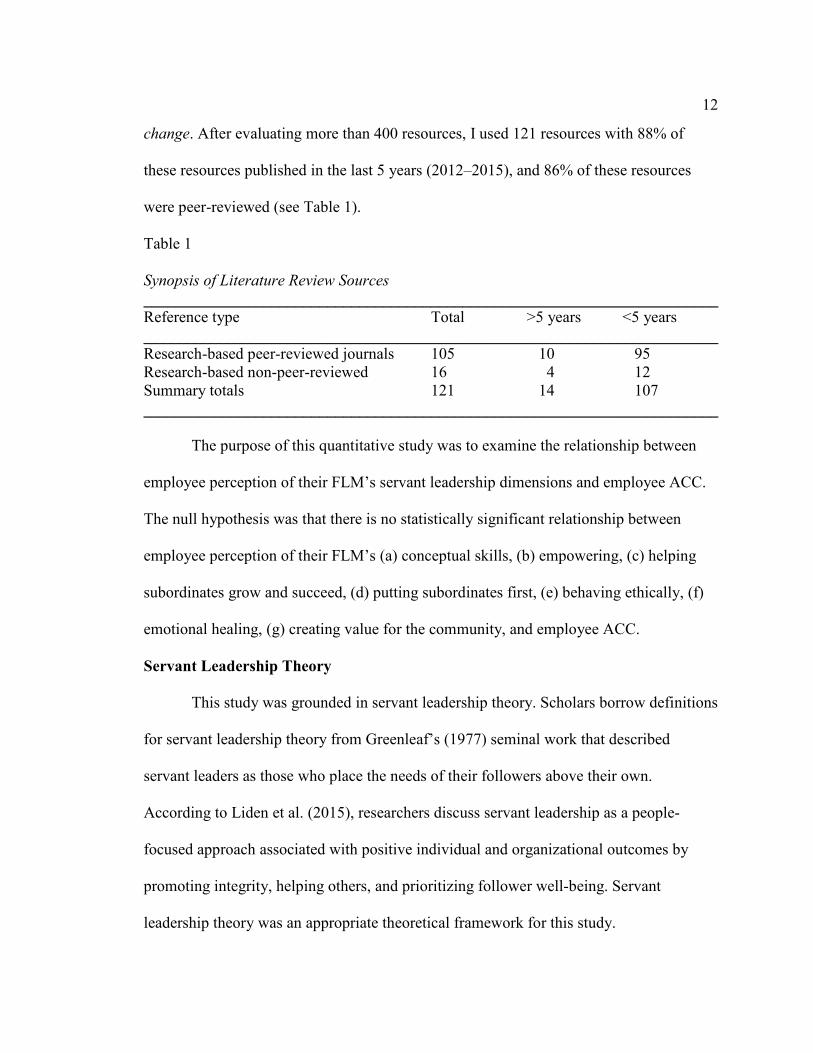
change. After evaluating more than 400 resources, I used 121 resources with 88% of
these resources published in the last 5 years (2012–2015), and 86% of these resources
were peer-reviewed (see Table 1).
Table 1
Synopsis of Literature Review Sources
________________________________________________________________________
Reference type Total >5 years <5 years
________________________________________________________________________
Research-based peer-reviewed journals 105 10 95
Research-based non-peer-reviewed 16 4 12
Summary totals 121 14 107
________________________________________________________________________
The purpose of this quantitative study was to examine the relationship between
employee perception of their FLM’s servant leadership dimensions and employee ACC.
The null hypothesis was that there is no statistically significant relationship between
employee perception of their FLM’s (a) conceptual skills, (b) empowering, (c) helping
subordinates grow and succeed, (d) putting subordinates first, (e) behaving ethically, (f)
emotional healing, (g) creating value for the community, and employee ACC.
Servant Leadership Theory
This study was grounded in servant leadership theory. Scholars borrow definitions
for servant leadership theory from Greenleaf’s (1977) seminal work that described
servant leaders as those who place the needs of their followers above their own.
According to Liden et al. (2015), researchers discuss servant leadership as a people-
focused approach associated with positive individual and organizational outcomes by
promoting integrity, helping others, and prioritizing follower well-being. Servant
leadership theory was an appropriate theoretical framework for this study.
13
Many businesses succeed because of skilled leadership. Organizational failure,
success, and sustainability result from leadership (Harper, 2012). Scholars and business
leaders turned attention to servant leadership as a potential leadership theory that may
improve organizational success and sustainability through employee needs satisfaction.
Greenleaf (1977) founded servant leadership theory on the premise that one should be a
servant first and place follower needs ahead of self-desires. The concept of fulfilling the
needs of others is a central theme to servant leadership.
Inherent in Greenleaf’s (1977) theory is the call to place follower needs above
those of the leader, creating strong, trusting relationships within an organization. Servant
leaders motivate followers to perform at full potential by understanding follower desires
and goals. Servant leaders use this knowledge to assist employees in achieving their
potential by providing resources, information, and feedback (Bambale, 2014; Boone &
Makhami, 2013). Researchers postulate that when servant leaders focus on fulfilling
employee needs, employees positively reciprocate by exhibiting desirable work behaviors
(Chan & Mak, 2014; Hunter et al., 2013). Servant leader leaders focus on fulfilling
subordinate needs. Employees reciprocate by supporting their leader’s objectives.
Servant leaders also act as role models. Employees model their servant leader’s
behavior and demonstrate supportive coworker interactions (Liden et al., 2014).
Researchers believe servant leadership has the potential to contribute toward ethical
behaviors and social responsibility, as servant leaders tend to influence others to lead as
servant leaders (Liden et al., 2014). As servant leadership theory grows in popularity,

14
researchers are increasingly interested in identifying characteristics or traits that may
identify potential servant leaders.
Servant leaders tend to have characteristics consistent with fulfilling follower
needs. Though researchers note a lack of a predictive framework to identify who will
become servant leaders (Barbuto, Gottfredson, & Searle, 2014), employees perceive
servant leaders as having personality traits of high agreeability and low extraversion
(Hunter et al., 2013). Beck (2014) found that predictors of servant leadership behaviors
included longevity in a leadership role, volunteerism of at least an hour a week, ability to
create trusting relationships, and an altruistic mindset. Servant leaders lead through
stewardship and empowering behaviors.
The word servant misconstrues the intent of servant leadership. Servant leaders
are servants in nature, but this does not represent a balance where subordinates are free to
direct their leadership. Instead, servant leaders serve by acting as stewards and
empowering subordinates through support and autonomy (Rachmawati & Lantu, 2014),
and through building a culture of appreciation and recognition (Umlas, 2013). Servant
leadership may manifest in ways not yet operationalized or understood though many
consultants suggest a 2:1 ratio of soliciting questions to giving directives (Boone &
Makhami, 2013). This lack of operational understanding of how servant leadership
manifests within organizations is consistent with the current state of servant leadership
theory.
Servant leadership in business practice has no religious affiliation or connotations.
The example of Jesus Christ as a servant leader, however, served as one of the main
15
philosophical bases that Greenleaf (1977) used to guide theory creation. Consistent with
the teachings of Jesus Christ, servant leaders seek to move beyond exercising power and
expertise for their gain, but they do so selflessly in the best interests of their followers
(Rachmawati & Lantu, 2014). Servant leaders are not motivated by power but by serving
others and using their influence to better the lives of those around them (Rachmawati &
Lantu, 2014). This motivation to serve others makes the duality of both serving and
leading the same, where no clear boundary exists anymore.
Furthermore, servant leaders act selflessly. Rather than use people to achieve
organizational health and stability, servant leaders obtain motivation by focusing on their
follower’s personal growth, which by extension leads to organizational health and
stability (Rachmawati & Lantu, 2014). Servant leaders act selflessly and beyond self-
interests by maintaining focus on identifying and fulfilling follower needs (Rachmawati
& Lantu, 2014). The motivational difference between servant leadership and other
leadership theories is the intention to serve follower needs before those of the leader or
the organization.
As applied to this study, servant leadership theory supported my expectation that
employee-perceived FLM servant leadership dimensions would influence or partially
explain ACC. I expected this influence because servant leaders focus on satisfying
employee needs, and employees may reciprocate this support by supporting the leader’s
change initiatives. According to servant leadership theory, employee-perceived FLM
servant leadership dimensions may influence or partially explain employee ACC if
employees desire to support their servant leader during periods of change.

16
Rival Theories
Rival theories include transactional leadership theory and transformational
leadership theory. Transactional leadership theory is a practical leadership theory where
leaders meet follower needs by giving rewards for fulfilling leader work objectives
(Gelaidan & Ahmad, 2013). Transformational leadership theory is more researched than
servant leadership, with the latter having only recently gained scholarly interest (van
Dierendonck et al., 2014). Both theories share similarities. In transformational leadership
theory, leaders focus on inspiring followers to achieve organizational goals (van
Dierendonck et al., 2014). In servant leadership theory, servant leaders focus on
satisfying follower needs (van Dierendonck et al., 2014). Researchers have used both
leadership theories to investigate correlates with employee outcomes, including
commitment to change.
Transactional leadership theory is a modern leadership theory to examine
organizational and employee outcomes. Recently, Gelaidan and Ahmad (2013) examined
the relationship between transactional leadership and normative commitment to change
(NCC), one of three components of Herscovitch and Meyer’s (2002) commitment to
change model. Gelaidan and Ahmad found a positive relationship mediated by
organizational culture. Gelaidan and Ahmad suggested that future research should
examine the relationship between transactional leadership and both normative and ACC.
Additional research may increase understanding of how transactional leadership affects
the construct of commitment to change.
17
Additional research has added clarity to how both transactional and
transformational leadership related to commitment to change. Tyssen, Wald, and
Heidenreich (2014) found a positive relationship between both transactional and
transformational leadership, and ACC. Tyssen et al. also theorized that transactional
leadership forms the basis for most organizational leadership with the goal to maximize
efficiency and consistency through transactional behaviors. The authors postulated that
transactional leadership formed a basis for transformational leadership, but that
transformational leadership was ultimately more effective in influencing ACC.
Transactional leadership theory did not appear to be the appropriate leadership theory for
this study.
Transformational leadership theory is also an effective leadership theory that
explains many positive organizational and employee outcomes. In their review of the
literature, van Dierendonck et al. (2014) noticed that both transformational and servant
leadership theories positively related to similar outcomes and the research team showed
interest in exploring how and why. The authors found that each leadership style differed
in the mechanism that drove correlations. Employees viewed transformational leaders as
more effective but considered servant leaders as better at fulfilling employee needs,
consistent with the tenants of each theory (van Dierendonck et al., 2014). Both leadership
styles positively influence outcome variables but through different mechanisms.
There exists a positive relationship between transformational leadership and ACC.
Scholars investigated this relationship in numerous studies within the past 5 years.
Abrell-Vogel and Rowold (2014); Seo et al. (2012); Shin, Seo, Shapiro, and Taylor
18
(2015); and Tyssen et al. (2014) recently confirmed that a positive relationship exists
between transformational leadership and ACC across diverse populations. Abrell-Vogel
and Rowold are the only researchers found to have examined how the individual
dimensions of transformational leadership contributed to this relationship, as no previous
researchers explored this aspect. Additional research is needed to clarify this relationship.
Initial findings regarding the relationship between a multifactorial construct of
transformational leadership and ACC provided an interesting correlation. Abrell-Vogel
and Rowold (2014) found that only one of six dimensions in a six-factor construct of
transformational leadership showed significant positive correlation with ACC. The single
dimension was “individual support.” I found this finding interesting because, in
transformational leadership theory, leaders emphasize inspiring followers to achieve
organizational goals (Abrell-Vogel & Rowold, 2014). In servant leadership theory,
leaders focus on the individual and satisfying individual needs (Parris & Peachey, 2013).
I chose to use servant leadership theory instead of transformational leadership theory as
the theoretical framework for this study for three primary reasons. First, the relationship
between servant leadership and ACC is significantly under-researched in comparison to
transformational leadership and ACC. Second, initial evidence suggests the
transformational leadership dimension most closely related to servant leadership,
individual support, has the highest influence on ACC. Last, initial evidence suggests that
servant leadership is positively related to commitment to change, but no apparent studies
have examined the how individual dimensions of servant leadership contribute to this
model.

19
Measurement
No consensus exists among scholars on how to measure servant leadership.
Researchers agree that servant leadership is multidimensional (Parris & Peachey, 2013;
Rachmawati & Lantu, 2014; van Dierndonck, 2011). Greenleaf’s (1977) original
conceptualization of servant leadership as a way of life makes empirically testing the
theory difficult (Parris & Peachey, 2013). Greenleaf did not discuss dimensions of
servant leadership nor create an instrument to capture the domain of servant leadership
theory. Greenleaf primarily focused on advancing the principles of wanting to serve
others and helping others grow, succeed, gain autonomy, and become healthier in their
lives from a more spiritual perspective (Rachmawati & Lantu, 2014). Researchers
responded to the lack of a servant leadership instrument by developing their own.
Numerous researchers developed servant leadership instruments. In their review
of the literature, Parris and Peachey (2013) identified 14 unique measurement instruments
purporting to measure servant leadership across 27 correlational studies. Liden et al.
(2008) developed one of the few multifactorial instruments that measured seven
dimensions of servant leadership for both individual-level and group-level outcomes
while controlling for transformational leadership. Liden et al.’s seven-factor, 28-item
servant leadership instrument named the is among the most frequently used to measure
servant leadership. In the past 5 years, Chan and Mak (2014), Chiniara and Bentein
(2016), de Clercq et al. (2014), Liden et al. (2014), Liden et al. (2015), and Peterson et al.
(2012) are among researchers who used SL-28 to inform their quantitative studies.
20
Though researchers use numerous instruments to measure servant leadership, the SL-28
is among the most popular.
The SL-28 is a valid and reliable scale. Liden et al.’s (2008) servant leadership
instrument contains 28 items using a 7-point Likert-type ordinal scale. I chose to use this
instrument owing to its multidimensional framework, scale reliability, and validity. Liden
et al.’s SL-28 demonstrated a stable factor structure across multiple samples and is a
valid instrument owing to the rigorous procedure used in development (van Dierndonck,
2011). To create an efficient and reliable scale, Liden et al. used the four highest loading
factors with a loading factor of at least 0.4 for each of the seven dimensions. Scale
reliabilities for the seven dimensions ranged from (α = .76) to (α = .86), indicating high
reliability (Liden et al., 2008). Liden et al. (2008) tested the instrument for (a) content
validity, (b) external validity, (c) discriminate validity, and (d) predictive validity. The
instrument is, therefore, both reliable and valid.
The SL-28 is a multifactorial scale that researchers may use to measure multiple
dimensions of servant leadership. Liden et al.’s (2008) intent were that researchers would
use the SL-28 as a multifactorial, or multidimensional model. In subsequent research
conducted, the researchers used the instrument as a global construct of servant leadership,
ignoring the contribution of each dimension toward variance in a dependent variable
(Liden et al., 2015). I used the instrument to its full potential by using each dimension as
an independent variable.

21
Servant Leadership
Scholars research servant leadership, most often as a global construct, to gain a
better understanding of how servant leadership affects employees and organizations.
Servant leadership is popular leadership style among business executives though remains
under-researched as a construct (van Dierendonck, 2011). Researchers increasingly study
servant leadership because evidence suggests that servant leaders positively influence a
multitude of employee behaviors (de Sousa & van Dierendonck, 2014). Researchers
found that servant leaders inspire positive employee behaviors by satisfying follower
needs, thereby encouraging reciprocal relationships where employees feel obligated to
commit to leader requests (Chan & Mak, 2014; Hunter et al., 2013). Leader requests may
include committing to organizational changes.
Servant leadership benefits both employees and the organization during periods of
change. During periods of change, employees often incur adverse psychological impacts
that harm employee well-being (Michela & Vena, 2012). FLMs can utilize servant
leadership to improve employee conditions during periods of change by focusing on
employee needs such as sustaining motivations and reducing anxieties (de Sousa & van
Dierendonck, 2014). As the rates of organizational change increase, servant leadership
becomes increasingly relevant as a leadership style that can not only improve employee
well-being but elicit the employee change behaviors needed for change success.
Empirical reviews of the servant leadership literature exist as of recent. Parris and
Peachey (2013) and van Dierendonck (2011) performed empirical reviews of the servant
leadership literature. Both research teams found strong evidence that servant leadership

22
influenced both leader-follower relationships and the general psychological environment
of their workplace (Parris & Peachey, 2013; van Dierendonck, 2011). Van Dierendonck
found that servant leaders influenced followers on three levels: (a) individual level
positive outcomes such as increased job performance, (b) the team level such as increased
team effectiveness, and (c) the organizational level such as increased corporate social
responsibility. Parris and Peachey similarly found that servant leaders influenced
followers on two levels: (a) follower’s well-being, and (b) team effectiveness. Both Parris
and Peachey and van Dierendonck noted a lack of empirically accepted outcomes
associated with servant leadership. Additional research is needed to understand better
how servant leadership influences outcomes.
Evidence exists that servant leadership practiced by FLMs positively correlates
with desirable outcomes at both the employee and organizational level. In their reviews
of the extant literature, Parris and Peachey (2013) and van Dierendonck (2011) identified
numerous positive employee and organizational outcomes associated with servant
leadership at the FLM level. These outcomes included increased organizational trust,
team and employee effectiveness, organizational citizenship behavior, collaboration,
follower well-being, organizational commitment, positive work climate, job satisfaction,
and decreased turnover. More recent findings include Chan and Mak’s (2014) findings of
a positive relationship between servant leadership and both trust in leader and job
satisfaction. Peterson, Galvin, and Lange (2012) additionally found a positive correlation
between CEO servant leadership and firm performance. This finding suggests that servant
leadership may positively affect organizations at many levels.
23
Servant leadership may also positively correlate with employee servant leadership
behaviors. Liden et al. (2014) sought to understand better how servant leadership
promotes follower outcomes by asking employees to rate their FLMs for servant
leadership behaviors and self-rating for the behavior of serving others. The authors found
a positive relationship between perceived FLM servant leadership behaviors and
employees serving others (Liden et al., 2014). These results indicated that FLMs who
engage in servant leadership behaviors might also influence their employees to act in
similar supportive ways with coworkers. Researchers know less about the efficacy of
servant leadership theory in high-paced environments such as manufacturing.
Leaders in manufacturing could use servant leadership to help employees feel
valued. In one of the few qualitative studies conducted on servant leadership in the past 5
years, Claxton (2014) described how servant leadership in a manufacturing facility
helped workers feel valued, enabled pride, and fostered a shared purpose. Claxton
explained that FLMs in manufacturing influenced these positive outcomes through
supporting and listening to employees, feeling responsible for employee livelihoods, and
involving employees in decision-making and idea development (Claxton, 2014). In this
context, the application of servant leadership behaviors may benefit manufacturing
environments. However, empirical evidence does not yet exist on the efficacy of servant
leadership theory in fast-paced or uncertain conditions.
Concerns exist regarding the practicality of servant leadership in uncertain or fast-
paced environments. Boone and Makhani (2013) postulated that servant leadership might
work better in static environments where leaders can take their time to solicit feedback

24
from followers. In three separate studies, van Dierendonck, Stam, Boersma, de Windt,
and Alkema (2014) reported mixed findings of the effectiveness of servant leadership
during organizational change. One study suggested servant leadership was most effective
during stable times but published inconclusive results for two additional studies. Sterling
and Boxall (2013) discussed that the benefits of servant leadership might diminish in
high-pressure, fast-paced settings accompanied by low employee literacy rates. These
scholars believed additional research was needed to understand better the efficacy of
servant leadership in similar environments. Contrary to these concerns, other researchers
found evidence that suggests servant leadership may be increasingly useful in uncertain
environments.
Though scholars are not yet in agreement on the efficacy of servant leadership in
uncertain, high-paced environments, evidence exists that servant leadership is
increasingly useful in uncertain environments such as during significant organizational
change. De Sousa and van Dierendonck (2014) found that servant leadership positively
affected employee engagement during a turbulent, large-scale organizational change
accompanied by mass layoffs though the context was in a European service organization.
De Sousa and van Dierendonck postulated that servant leadership was increasingly more
useful as environmental and economic uncertainty increased by sustaining motivations,
reducing anxieties, and encouraging employee engagement during the large-scale
organizational change. Though this evidence suggests that servant leadership may be an
effective leadership style during organizational change, researchers have not yet

25
examined how servant leadership correlates with the employee ACC needed for change
to succeed.
One study exists where the researchers examined the relationship between
employee-perceived FLM servant leadership and employee commitment to change. Kool
and van Dierendonck (2012) conducted the study and prefaced their research hypothesis
by proclaiming that to date there is no best leadership style identified to maximize
commitment to change during change initiatives (Kool & van Dierendonck, 2012). Kool
and van Dierendonck sought to investigate the relationship between employee-perceived
FLM servant leadership and employee commitment to change but did so in a European
service organization context. Their results indicated a positive correlation between
employee-perceived FLM servant leadership and employee commitment to change,
mediated by organizational justice and optimism. This study contained numerous
limitations that reduced generalizability to a manufacturing context within the United
States.
Limitations included both the independent and dependent variables used, and the
population sampled. Kool and van Dierendonck (2012) used a global construct and
instrument to measure servant leadership, as opposed to a multifactorial construct and
instrument like the SL-28 developed by Liden et al. (2008). Liden et al. (2015) found that
scholars consistently measured servant leadership as a global measurement, or single
factor, in most all servant leadership research to date. Researchers who used
multifactorial instruments still measured servant leadership as a single factor, and ignored
the contribution of each factor towards a predictive model. A limitation of Kool and van
26
Dierendonck’s study was the absence of using a multifactorial instrument. Researchers
may use multifactorial instruments to understand better the role each servant leadership
factor or dimension contributes to variation in commitment to change.
An additional limitation was the lack of focus on the three-component model of
commitment to change. Kool and van Dierendonck (2012) did not distinguish between
which of three components of commitment to change they used despite using Herscovitch
and Meyer’s (2002) three-component model. Interestingly, Herscovitch and Meyer’s
(2002) three-component model contained 18 survey items with each component
containing six survey items each. Kool and van Dierendonck reported using six items
from Herscovitch and Meyer’s three-component model but did not distinguish which
component of commitment to change they measured. It is unknown which component of
commitment to change was the outcome variable.
The third limitation was the population sampled. Kool and van Dierendonck
(2012) sampled 135 participants in a European service organization undergoing a
significant organizational change. The authors stated that both a small sample size and a
limited setting were limitations to generalizing results across populations. Last, the
authors suggested using a multifactorial or multidimensional construct of servant
leadership in different organizational settings to allow deeper insight into the relationship
between employee-perceived FLM servant leadership and employee commitment to
change. I responded to this suggestion by using a multidimensional servant leadership
instrument with seven dimensions to measure servant leadership.
27
The seven dimensions of servant leadership were the independent variables in this
study. The seven dimensions of servant leadership are: (a) conceptual skills, (b)
empowering, (c) helping subordinates grow and succeed, (d) putting subordinates first,
(e) behaving ethically, (f) emotional healing, and (g) creating value for the community
(Liden et al., 2008). Both Liden et al. (2008) and van Dierndonck (2011) argued and
demonstrated that servant leadership covers the domain of multiple dimensions and
researchers should use a multifactorial instrument designed to test the claimed strengths
of servant leadership. To develop each dimension within the SL-28, Liden et al. initially
identified 85 items across nine servant leadership dimensions. The research team
searched for servant leadership scales used in prior research and found nine potential
dimensions of servant leadership. Liden et al. subsequently eliminated the two
dimensions of (a) servanthood and (b) relationships after conducting an exploratory
factor analysis, and confirmed subsequently using confirmatory factor analysis,
hierarchical linear modeling, and pilot testing. The net result was seven remaining servant
leadership dimensions.
Few researchers utilized multifactorial instruments to measure servant leadership.
Counter to Liden et al.’s (2008) original intent in subsequent research, the researchers
ignored the seven dimensions as independent variables and used the SL-28 as a global
construct of servant leadership and a singular independent variable. The only research
that used these dimensions as a set of independent variables occurred during testing of the
instrument. During this testing, Liden et al. (2008) found support for the validity of the
scale, as individual servant leadership dimensions helped explain the incremental

28
variance in employee outcomes of organizational commitment, community citizenship
behavior, and in-role performance. Though little research exists where the researchers
used each servant leadership dimension as independent variables, each variable is
relevant to the theme of servant leadership.
The first dimension is emotional healing. Emotional healing is the action of
expressing sensitivity to the concerns of others (Liden et al., 2008). The dimension of
emotional healing is an important theme to the construct of servant leadership because
servant leaders must attend to the emotional needs of their subordinates (Liden et al.,
2008). During testing of the instrument, Liden et al. (2008) found that emotional healing
significantly helped explain the incremental variance in employee outcomes of
organizational commitment, community citizenship behavior, and in-role performance.
Specifically, emotional healing related positively to in-role performance and related
negatively to both organizational commitment and community citizenship behavior
(Liden et al., 2008). No further research exists using emotional healing as an independent
variable.
The second dimension is creating value for the community. Creating value for the
community is the level of both leader community involvement and support for employee
involvement in the community (Liden et al., 2015). The dimension of creating value for
the community is central to the theme of servant leadership because servant leaders
should instill confidence in their followers and communities to serve the needs others
(Greenleaf, 1977). During testing of the instrument, Liden et al. (2008) found that
creating value for the community significantly helped explain the incremental variance in

29
outcome variables. Specifically, creating value for the community positively related to
organizational commitment and community citizenship behavior, though showed no
relationship to in-role performance (Liden et al., 2008). No further research exists using
creating value for the community as an independent variable.
The third dimension is conceptual skills. Conceptual skills are the leader’s ability
to understand organizational goals and solve work problems (Liden et al., 2015). The
dimension of conceptual skills is important to the theme of servant leadership, as servant
leaders must be skilled to empower and support employee performance (Rachmawati &
Lantu, 2014). During testing of the instrument, Liden et al. (2008) found that conceptual
skills significantly helped explain the incremental variance in outcome variables.
Specifically, conceptual skills related negatively to in-role performance though showed
no relationship with organizational commitment and community citizenship behavior
(Liden et al., 2008). No further research exists using conceptual skills as a separate
independent variable.
The fourth dimension is empowering. Empowering is entrusting subordinates with
responsibility and autonomy to make decisions (Liden et al., 2015). The dimension of
empowering is significant to the theme of servant leadership because servant leaders
empower followers through support and autonomy, focusing on employee growth
(Rachmawati & Lantu, 2014). During testing of the instrument, Liden et al. (2008) found
that empowering helped explain the incremental variance in outcome variables.
Specifically, empowering related positively to community citizenship behavior,
negatively related to organizational commitment, and showed no relationship with in-role
30
performance (Liden et al., 2008). No further research exists using empowering as a
separate independent variable.
The fifth dimension is helping subordinates grow and succeed. Helping
subordinates grow and succeed is the extent to which the leader helps subordinates
realize their potential and achieve career success (Liden et al., 2015). The dimension of
helping subordinates grow and succeed is important to the theme of servant leadership
because servant leaders help employees to achieve their potential by providing resources,
information, and feedback (Bambale, 2014). During testing of the instrument, Liden et al.
(2008) found that helping subordinates grow and succeed significantly helped explain the
incremental variance in outcome variables. Specifically, helping subordinates grow and
succeed related positively to organizational commitment, negatively related to
community citizenship behavior, and showed no relationship with in-role performance
(Liden et al., 2008). No further research exists using helping subordinates grow and
succeed as a separate independent variable.
The sixth dimension is putting subordinates first. Putting subordinates first
measures the degree to which the leader places follower needs above their own (Liden et
al., 2015). The dimension of putting subordinates first is meaningful to the theme of
servant leadership because Greenleaf (1977) founded servant leadership theory on the
premise that leaders should place employee needs above their own. During testing of the
instrument, Liden et al. (2008) found that putting subordinates first significantly helped
explain the incremental variance in outcome variables. Specifically, putting subordinates
first related positively to community citizenship behavior, but there was no significant

31
relationship with organizational commitment or in-role performance (Liden et al., 2008).
No further research exists using putting subordinates first as an independent variable.
The seventh and last dimension is behaving ethically. Behaving ethically is the
degree to which the leader is honest, trustworthy, and acts with integrity (Liden et al.,
2015). The dimension of behaving ethically is relevant to the theme of servant leadership
because servant leaders must act as role models and contribute towards ethical behaviors
and social responsibility (Liden et al., 2014). During testing of the instrument, Liden et
al. (2008) found that behaving ethically significantly helped explain the incremental
variance in outcome variables. Specifically, behaving ethically related positively to in-
role performance and negatively related to both community citizenship behavior and
organizational commitment (Liden et al., 2008). No further research exists using
behaving ethically as a separate independent variable.
The initial testing of servant leadership dimensions as independent variables
provided further support for a multidimensional construct of servant leadership. Though
none of the seven servant leadership dimensions captures the domain of servant
leadership alone, each dimension uniquely contributes to an aggregate model of servant
leadership (Liden et al., 2015). Researchers have yet to utilize the SL-28 for its intended
purpose to measure how individual servant leadership dimensions contribute to an
outcome variable (Liden et al., 2015). This study contributed to the literature by
potentially being the first to measure how each dimension uniquely contributed to
variance in the dependent variable of ACC.

32
Commitment to Change
Organizations change frequently, and employees must commit to organizational
changes for change initiatives to succeed. Herscovitch and Meyer (2002) defined
commitment to change as a mindset that binds an individual to a course of action needed
for a change initiative to succeed. Commitment to change represents a key psychological
effort or attachment to buy into workplaces changes and is a strong predictor of change
success (Herscovitch & Meyer, 2002). Employees must commit to changes, as change
initiatives will not succeed without the support and commitment of employees.
Successfully managing change initiatives is a recurring business problem. One of
the biggest business challenges today is how to ensure change initiatives are successful
(Cândido & Santos, 2015). As organizations engage in continuous cycles of
organizational change, business leaders must find a way to build and maintain the
commitment to change necessary for change success (Morin et al., 2015). Scholars
conduct research using commitment to change as an outcome variable to better
understand potential influences of commitment to change.
Researchers measure commitment to change using a multidimensional
commitment to change model. Herscovitch and Meyer (2002) developed the prevailing
multidimensional model to both understand and measure commitment to change
(Bouckenooghe, Schwarz, & Minbashian, 2015). In this model, Herscovitch and Meyer
defined three dimensions of commitment to change. The first dimension is continuance
commitment to change (CCC), defined as the perceived costs of committing to an
organizational change. The second dimension is NCC, defined as the perceived
33
obligation to commit to an organizational change. The third dimension is ACC, defined
as the internal desire to commit to an organizational change based upon perceived
benefits of the change (Herscovitch & Meyer, 2002). I used ACC as the dependent
variable in this study.
The proliferation of research on commitment to change has grown considerably
since the conception of Herscovitch and Meyer’s (2002) model. Bouckenooghe et al.
(2015) conducted a meta-analysis of 17 studies using Herscovitch and Meyer’s
commitment to change model. In their review, Bouckenooghe et al. found individuals
who scored high on CCC supported a change only after calculating a lower cost to
support the change than not supporting the change, and that CCC correlated with
negative, energy depleting outcomes (Bouckenooghe et al., 2015). The authors found the
second type of commitment to change, NCC, closely mirrored employee moral beliefs
that supporting a change initiative was the right thing to do. Last, they found the third
type of commitment to change, ACC, was present when employees personally wanted or
desired to support change. ACC is potentially the most desirable component of
commitment to change as it is linked to employee want and desire to commit to
workplace changes.
I chose ACC as the dependent variable because researchers have consistently
found that ACC is the most positively related commitment to change dimension to
behavioral support for change initiatives. Researchers have linked ACC to employee
willingness to extend the extra effort to make a change initiative successful (Morin et al.,
2015). Though researchers found initial evidence that the global construct of servant
34
leadership positively related to commitment to change (Kool & van Dierendonck, 2012),
no evidence exists on how servant leadership dimensions relate to ACC. Findings from
this study may assist organizations in achieving better change success rates by
contributing to the understanding of how perceived FLM servant leadership dimensions
predict employee ACC. As ACC grows across a workforce, the probability of change
success and sustainability may also increase.
Affective commitment to change. ACC is potentially the most important
component of commitment to change. Individuals demonstrating ACC are mobilized to
engage fully in the change process and engage in positive work behaviors that support
change initiatives (Bouckenooghe et al., 2015). Researchers continue to investigate how
FLMs positively influence ACC but believe FLMs can manage ACC by changing the
context surrounding a change initiative (Bouckenooghe et al., 2015). FLMs can
encourage ACC by ensuring the conditions exist where employees both anticipate change
benefits from a change initiative and have experienced change benefits with past change
efforts (Shin et al., 2015). Michel et al. (2013) agreed with this statement and found that
as employees perceived increased change benefits, their ACC also increased. FLMs are in
the unique position to influence employee change perceptions and behaviors due to their
proximity and daily interactions with employees.
FLMs can influence how employees perceive change by changing the context
employees use to assign meaning to change. Employees experience organizational
change in many ways, both positive and negative (Bouckenooghe, 2012; Shin et al.,
2012). Some changes initiatives may bring positive task changes, benefits, or advantages
35
(Bouckenooghe, 2012; Shin et al., 2012). Conversely, change initiatives may also
produce a loss of autonomy, familiarity, skill, or other work disadvantages
(Bouckenooghe, 2012; Shin et al., 2012). Employees make sense of change meanings
through interpreting information and assigning meaning to changes (Bouckenooghe,
2012). FLMs have opportunities to influence the meaning employees assign to change
initiatives by focusing on the needs of their followers and encouraging an environment
where employees are more likely to experience ACC.
FLMs can influence multiple conditions that subsequently influence ACC. FLMs
can affect ACC by involving employees in the change implementation decision-making
process and preemptively addressing areas of concern (Pardo-Del-Val, Martinez-Fuentes,
& Roig-Dobon, 2012). Bouckenooghe (2012) and Rafferty, Jimmieson, and Armenakis
(2013) presented findings that a high degree of change communication was positively
related with ACC. FLMs should design their communications to alleviate employee
concerns about change because employee concerns about change are negatively related to
ACC (Battistelli, Montani, Odoardi, Vandenberghe, & Picci, 2014). There is a cost to
increased communication and employee participation. As communication and employee
participation increases, change implementation occurs more slowly (Pardo-Del-Val et al.,
2012). This tradeoff highlights the leadership challenge evident in fast-paced
environments such as manufacturing, where the speed of events and production
requirements may discourage participative leadership styles such as servant leadership.
FLMs can also influence ACC by treating their employees fairly in daily
operations and throughout the change process. Researchers found that perceived
36
differences in employee treatment negatively impacted employee ACC. Bernerth,
Walker, & Harris (2011) and Montani et al. (2012) conducted two of the most recent
studies using ACC as a dependent variable within the manufacturing industry. Bernerth et
al. found that when employees perceived differences in FLM treatment between self and
others, this led to emotional exhaustion, reduced ACC, and increased turnover intentions.
Both Kool and van Dierendonck (2012) and Montani et al. confirmed similar findings
that perceived fair treatment and positive relationships between FLMs and subordinates
positively correlated with ACC. Montani et al. also found that ACC was highest when
both FLMs and coworkers exhibited high levels of support. These findings bolstered
Bouckenooghe et al.’s (2014) assertions that reducing the threat of unfair treatment and
conflict between FLMs and employees is critical to building positive attitudes towards
change. These studies provide support for the postulation that FLMs play key roles in
developing and sustaining ACC amongst their employees in manufacturing as well as
other industries.
There is a strong psychological component to ACC. High employee psychological
resilience positively correlated with ACC (Shin et al., 2012). Shin et al. (2012) found
evidence that building up individual resources and offering organizational inducements
including materialistic and developmental incentives positively correlated with ACC.
Increased employee development and incentives also helped employees feel a positive
state effect, and positively influenced their subsequent ACC. Further, individuals with
higher levels of psychological resilience experienced more positive emotions during
organizational change, which also affected their ACC (Shin et al., 2012). These findings
37
suggest that FLMs can further influence ACC by building up employee resources and
psychological resilience before a change.
Additional research suggests a psychological component to ACC. Mangundjaya
(2015) examined how psychological empowerment and organizational trust related to all
three dimensions of commitment to change. Mangundjaya found that both psychological
empowerment and organizational trust positively related to commitment to change as a
global construct, but had the highest effect on the dimension of ACC. The author stated
that business leaders could improve the probability of change success by creating a
trustworthy organizational climate and psychological empowerment among their
employees. Though the previously discussed research on ACC informs the literature on
the conditions that influence ACC at a singular point in time, scholars are increasingly
interested in how ACC changes over multiple data collection points during a naturally
occurring organizational change.
Two research efforts addressed how ACC changes over time during a naturally
occurring organizational change. Seo et al. (2012) demonstrated that FLMs influence
both employee emotional responses to change initiatives and ACC over time. The
researchers found over two data collection periods that employee-perceived FLM
transformational leadership directly related to positive and negative employee reactions
to change. Further, both employee behavioral responses and ACC related strongly to
initial experiences during the change initiative. These results were consistent with Morin
et al.’s (2015) findings that initial ACC predicted long-term ACC during multiple data
38
collection points. FLMs may further influence long-term ACC by ensuring employees
have initial positive experiences during change initiatives.
FLMs can also influence long-term ACC by ensuring employees understand the
necessity and legitimacy of change initiatives. Morin et al. (2015) conducted a
longitudinal study at a Canadian public healthcare company to understand how ACC
developed while undergoing a continuous change. Among their results, Morin et al.
found that only the independent variables of employee perceptions of necessity and
legitimacy contributed to the prediction of ACC throughout the cycle of change. The
researchers found that when organizational leaders did not convince employees of a
change initiative’s legitimacy, their ACC was low even if they perceived the change was
necessary. Low employee ACC may occur because workers lack the intrinsic motivation
associated with ACC when they do not believe that a change initiative will solve the
stated problem (Morin et al., 2015). The authors also found that ACC was relatively
stable throughout the continuous change, and that initial ACC predicted later ACC.
Organizational leaders can potentially influence initial and later ACC by ensuring
employees understand how a change initiative addresses a stated problem.
Previous researchers identified leadership styles that positively correlated with
ACC, but offered little guidance on the styles of leadership that may best influence ACC.
Among these findings, Abrell-Vogel and Rowold (2014), Seo et al. (2012), Shin et al.
(2015), and Tyssen et al. (2014) all confirmed that a positive relationship exists between
transformational leadership and ACC. Tyssen et al. (2014) additionally found a positive
correlation between both transactional and transformational leadership, and ACC. Tyssen

39
et al. suggested that transformational leadership was more effective than transactional
leadership at eliciting ACC. No research exists yet on the relationship between servant
leadership and ACC. Only one study exists examining the relationship between servant
leadership and commitment to change in general.
Only one study exists where researchers examined the relationship between
servant leadership and commitment to change though this study did not explicitly use
ACC as a dependent variable. Kool and van Dierendonck (2012) conducted this study in
a service industry environment and found that servant leadership was positively related to
commitment to change, partially moderated by optimism and interactional justice (Kool
& van Dierendonck, 2012). The researchers used a global construct of servant leadership
and did not identify which dimension of commitment to change they measured. No
researchers have examined the relationship between servant leadership and ACC.
The study by Kool and van Dierendonck (2012) had three significant limitations.
First, the authors measured servant leadership as a single independent variable and were
unable to distinguish which dimensions of servant leadership positively correlated with
commitment to change. Second, the authors did not distinguish between ACC, CCC, and
NCC despite using only six items from the 18-item instrument, which infers they
examined a single dimension. Third, the authors used a small sample size in a single
organizational setting, and further examination is necessary to generalize these findings
across different industries such as manufacturing. This study addressed these limitations
by using a multidimensional servant leadership instrument, and focusing exclusively on
ACC as the dependent variable in a manufacturing context.
40
Measurement. The multidimensional commitment to change model Herscovitch
and Meyer (2002) developed is the prevailing conceptualization to both understand and
measure and commitment to change. Researchers have used this instrument in
commitment to change research since its creation (Bouckenooghe et al., 2015).
Herscovitch and Meyer validated their commitment to change instrument titled the
Commitment to Change Inventory (CCI) as a separate measurable construct from
organizational commitment. Herscovitch and Meyer extended continuance, normative,
and affective components from the organizational commitment construct to commitment
to change. Herscovitch and Meyer found that this new construct of commitment to
change better-predicted employee efforts to work towards change success than the
construct of organizational commitment. Researchers use the commitment to change
instrument in part as a behavioral measure of employee efforts towards change.
The CCI contains an 18-item scale equally distributed across three dimensions of
commitment to change: CCC, NCC, and ACC. Researchers measure each item on a 7-
point Likert-type ordinal scale of measurement ranging from 1 (strongly disagree) to 7
(strongly agree). Herscovitch and Meyer (2002) examined construct and content validity
of the CCI by conducting a principal-axis factor analysis with Oblimin rotation for 22
survey items, forming composite scales with corresponding correlations. Next,
Herscovitch and Meyer conducted 2 × 2 × 2 ANOVAs to determine if each dimension
was influenced as expected and found support for this expectation with strong main
effects for each manipulation on each dimension. The authors discarded two items that
failed to load at least .5 on the appropriate factor and two items that loaded on multiple

41
factors, resulting in an 18-item instrument with factor loadings of at least 0.5 per factor.
The researchers confirmed the best fit of this model through confirmatory factor analysis
and goodness of fit using root-mean-square error of approximation and expected cross-
validation index. The resulting 18-item instrument contained six items per dimension
with scale reliabilities of (α = .92) for ACC, (α = .71) for CCC, and (α = .78) for NCC,
representing high reliability (Herscovitch & Meyer, 2002). The instrument is therefore
reliable.
Additional researchers have added to the validity testing of this model.
Bouckenooghe et al. (2015) examined the discriminant validity of the CCI during their
meta-analysis and reported high correlations between dimensions, indicating a need to
improve discriminant validity. Jing, Xie, and Ning (2014) tested for construct and
predictive validity in a Chinese context as they stated weak construct validity is one of
the criticisms of the CCI. The authors found support for both construct and predictive
validity in the Chinese context. Though researchers may still improve upon the CCI, it is
the main instrument used to measure commitment to change.
Methodologies
Scholars primarily research commitment to change using a quantitative method
and a correlational design. I identified and incorporated 21 peer-reviewed journal articles
regarding commitment to change in the literature review, with 20 of these peer-reviewed
journal articles published between 2012 and 2015. Researchers used Herscovitch and
Meyer’s (2002) CCI to measure commitment to change as a dependent variable in all 18
quantitative studies (see Table 2). In the review of the literature, I also included two

42
theoretical reviews encompassing commitment to change, and one meta-analysis of
commitment to change. I found no qualitative studies on commitment to change during
my search for scholarly, peer-reviewed journal articles published 2012 or after.
Table 2
Distribution of Commitment to Change Methodologies
Methodology type Total
________________________________________________________________________
Quantitative 18
Qualitative 0
Theoretical review 2
Meta-analysis 1
________________________________________________________________________
Total 21
Front-Line Management During Organizational Change
Organizational change affects the lives of both FLMs and their employees.
Continuous change efforts are necessary for organizations to be efficient and sustain
competitive advantage as business environments evolve (Holt & Vardaman, 2013).
Employers must initiative frequent change and employees commit to organizational
changes to enable adaptability within their markets (Dermol & Cater, 2013). Despite the
need for continual change, change initiative failure rates remain high with no signs of
improvement (Maurer, 2011). Researchers are increasingly interested in how FLMs, who
spend the most time with employees, influence employees to engage in positive change
behaviors (de Sousa & van Dierendonck, 2014). FLMs may be key to driving employee
behavioral outcomes.

43
FLMs can positively influence employee outcomes through skillful leadership.
Front-line manager leadership approaches are essential to unlocking positive employee
outcomes and helping employees solve workplace challenges in manufacturing
environments (Sterling & Boxall, 2013). How FLMs influence employee outcomes
through leadership and management practices is a critical and increasingly researched
topic (Brewster, Gollan, & Wright, 2013; Kilroy & Dundon, 2015). FLMs are often under
skilled in leading change (Smet, Lavoie & Hioe, 2012) and need support and
contemporary development to unlock how they can deliver desired employee outcomes
(Edgar, Geare, & O’Kane, 2015). Researchers and manufacturing leaders must reexamine
the role of FLMs as change agents because FLMs are critical to delivering successful
change (Nielsen, 2013). Manufacturing leaders should improve FLM utilization during
periods of change.
Organizational change. Complex business environments present business
leaders with a multitude of challenges that contribute to poor change initiative success
rates. Researchers agree that too many change initiatives fail (Cândido & Santos, 2015;
Michel, By, & Burnes, 2013). Business leaders have not seen change failure rates
improve despite the growing amount of literature and training on how to manage change
(Maurer, 2011). In contrast, a knowing-doing gap is growing as business leaders’
increase their knowledge in change management techniques and principles but still fail to
manage change effectively (Maurer, 2011). Business leaders should look for new ways to
help reduce change failure rates.
44
Business leaders make many mistakes that contribute to change failure. Maurer
(2011) found that leaders often erroneously assume employee understanding of change
efforts equals commitment, underestimate the power of engaged employees, fail to
reduce change fears and fail to acknowledge the role trust plays in accepting change.
Toterhi and Recardo (2012) found that business leaders often accept weak leadership,
treat change management as a separate work stream, and fail to align the organization to
support change. Eliminating mistakes during change implementation is important as each
subsequent change failure increases employee cynicism, making future changes even
harder to navigate (Maurer, 2011). Repeated errors that are not corrected contribute to
high change failure rates while making future changes more difficult.
Maurer (2011) is not alone in this pessimistic view. Decker et al. (2012) ascribed
to the viewpoint that consistently high change failure rates across industries are in part
due to a lack of a predictive framework that may guide organizations to positive change
outcomes. Decker et al. found 60 previously identified critical failure factors including
many leader-follower interactions in a demonstration of how complex a predictive
framework would be, despite an admitted nonexhaustive review of the extant literature.
This complexity of change failure is in part why failure rates remain static.
Change scholars offer diverse opinions on actual change failure rates though
agree improvement is needed. Cândido and Santos (2015) reviewed the available
literature and concluded that true change failure rates are elusive but somewhere between
28% to 90%. These high failure rates contribute to poor employee perceptions of how
well senior leaders manage change. Among 1.6 million respondents in the United

45
Kingdom, only 34% felt their management team managed change effectively (Pritchard
& Bloomfield, 2014). Together, these statistics indicate that senior leaders do not manage
change well.
Senior leaders impact the change design, implementation, employee responses to
change, and ultimately, change success. Practical changes are possible without large-
scale, risky initiatives associated with change failure, employee discontent, and marginal
lasting effects (Golden-Biddle, 2013). Instead of risky, large-scale initiatives, senior
leaders can alternatively pursue change through uncovering frequent disconnects and
discrepancies between actual and desired practices (Golden-Biddle, 2013). Davies (2013)
similarly believed that when senior leaders leave their comfort zones to participate in
employee-level process streams, they more effectively drive change through supportive
leadership and discover gaps between corporate rhetoric and actual state. These practices
also help leverage existing employee knowledge within the organization to help drive
change.
Business leaders may find additional benefits to engaging employees during
change implementation. Whalen (2014) theorized that during change initiatives,
employees transact with each other in an infinite amount of ways. As these transactions
accumulate, a change narrative emerges based on how the change initiative is perceived
to affect both individuals and the organization as a whole (Whalen, 2014). Organizational
leaders lose control of the change narrative when they do not actively remain involved in
change discussions. Business leaders may also lose control of a change initiative when
the environment changes due to unpredicted external variables (Mackay & Chia, 2013).
46
Business leaders can improve the probability of change success by remaining engaged
with employees during the change process and using collective employee knowledge to
help identify external variables that may threaten a change initiative.
Change frequency also affects organizational performance. Klarner and Raisch
(2013) conducted a mixed-methods study to examine and explore the relationship
between the frequency of organizational change and its effect on firm performance
among 67 European insurance companies over a nine-year period. Companies that
changed at regular intervals outperformed companies that changed at infrequent intervals,
did not change at all, or changed too frequently without periods of stability (Klarner &
Raisch, 2013). In manufacturing, change and stability are complementary in nature. Each
stage requires periods of change and stability, and a complete absence of stability
negatively affects change outcomes through change resistance, organizational inertia, and
increased interest to maintain the status quo among employees (Mejia-Morelos, Grima, &
Trepo, 2013). These findings are consistent with Klarner and Raisch though the specific
mechanisms that drive these outcomes require further research.
Business leaders create and implement change plans, but change will not succeed
without employee participation and acceptance. Non-management employees arguably
play the most important role in change outcomes (Alasadi & Askary, 2014; Rothermel &
LaMarsh, 2012). Employees must be able to change frequently and quickly for the
organization to remain agile (Dermol & Carter, 2013). Understanding how organizational
leaders can create an environment where employees voluntarily participate in, drive
efforts, and commit to those changes is vital to improving change initiative failure rates.
47
Employee participation and acceptance of organizational change has multiple
contextual variables. In a stable environment, employees get comfortable with their job
routines. Changes to these routines may result in resistance through unfamiliarity or lack
of training in new work processes (Bateh, Castaneda, & Farah, 2013). Organizational
changes may conflict with individual employee identities (Drzensky, Egold, & Van Dick,
2012; Gover & Duxbury, 2012). Both Drzensky et al. (2012) and Gover and Duxbury
(2012) found via quantitative and qualitative studies, respectively, that organizational
identity plays a significant role in organizational readiness to change. Both research
teams also found that a high degree of organizational identity among employees resulted
in higher levels of readiness to change. Organizational leaders may improve the
probability of change success by aligning organizational and individual identities.
Organizational leaders can do this by creating a healthy change culture and alignment
between change efforts and professional identities.
Scholars increased research efforts to understand employee outcomes and
contextual variables during organizational change. Researchers cite employee resistance
to change as one of the most significant barriers to change success (Michel et al., 2013;
Stonehouse, 2012). Organizations can adjust their change management approach to
reduce employee resistance to change (Michel et al., 2013). Business leaders may
improve change outcomes through understanding where this resistance comes from and
reducing it.
Organizational leaders should also strive to understand the reasons for resistance
to change. Grounds for resistance to change relate in some way to a lack of understanding

48
of the need to change, perceived costs outweighing perceived benefits, shortage of time
to work through change issues, and personal anxiety (Stonehouse, 2012). To combat
resistance, organizational leaders can improve communication, increase employee
engagement, encourage participation with honest responses, and involve employees at
each stage to increase shared ownership of the change efforts (Stonehouse, 2012). Recent
research expands on the psychological precursors to resistance to change.
Psychological precursors to resistance to change partially explain why employees
resist changes. Employees may distance themselves from the organization as a self-
protecting psychological mechanism in response to significant changes (Michela & Vena,
2012). Employees may also devalue the organization or mentally disengage due to
uncertainty stemming from change (Michela & Vena, 2012). Resisting change is a
counterproductive change behavior that reduces the probability of change success and
negatively affects a healthy psychological balance among employees (Bouckenooghe,
2012). Significant value exists in reducing this resistance.
The value of overcoming employee resistance to change and actively pursuing
employee commitment to change extends past improving upon change initiative failure
rates, as the value also includes improving the psychological well-being of workers.
FLMs play a significant role in influencing employee behaviors (Evans, 2015). FLMs as
a group have been overlooked by researchers for decades (Evans, 2015; Nielsen, 2013).
Researchers have only recently increased efforts to understand how FLMs influence
employee behaviors in the workplace.
49
Front-line management in manufacturing. The role of FLMs in manufacturing
shifted over the past few decades. FLMs traditionally held process and personnel
supervisory roles, but roles have gradually shifted towards increased responsibilities
(Townsend & Russell, 2013). FLMs now experience increased job enlargement, work
intensity, people management roles, pressures from the employees they lead and
increased burden to deliver policy change (Townsend & Russell, 2013). FLMs often find
themselves caught in the middle of implementing changes they have little influence over
and pressure and resistance to these changes from their employees (Nielsen, 2013;
Townsend & Russell, 2013). FLMs in manufacturing face increasingly demanding roles
centered on (a) the motivation of individuals and teams, (b) conflict resolution, (c)
meeting management, and (d) communication (Pederson, Dresdow, & Benson, 2013).
There are negative consequences from enlarging FLM roles.
FLMs are pulled in different directions during organizational change by
competing needs. FLMs typically manage the greatest number of people (Townsend &
Loudoun, 2015). FLMs often find they simply do not have the time to execute all
responsibilities within their expanded job scope (Evans, 2015). This shortage of time
occurs in part due to the competing needs of senior managers and direct reports. FLMs
facing these competing objectives face increased risk of turnover, burnout, and decreased
effectiveness (Townsend & Russell, 2013). FLMs are pulled between organizational and
functional roles (Townsend & Russell, 2013), and must manage decreasing budgets while
maintaining or improving quality of work (Evans, 2015). Senior managers may impose
changes on FLMs who have little to no involvement in change initiative planning, but

50
nevertheless expectations exist to execute proposed changes. When changes do not work,
senior managers may then cite ineffective FLMs (Townsend and Russell, 2013). A new
perspective may be considered to combat the adverse effects of expanding FLM job
scopes.
FLMs can influence change initiatives through increased participation in policy
change and eliciting change support from their employees. FLMs play a crucial role in
organizational change and are the most important people in an organization to drive
employee performance (Edgar et al., 2015). Senior managers should recognize the
importance of and engage FLMs and other floor leaders (Alagaraja & Egan, 2013). FLMs
may then be empowered to balance the competing needs of implementing change with
the needs of their employees receiving change (Semper, 2011). Manufacturing industry
examples of what happens when senior manufacturing leaders ignore FLMs during the
change process exist as of recent.
One of the key barriers to success and lessons learned from a major
manufacturing improvement effort at MillerCoors was the failure to involve FLMs in the
change process. To become a lean, world-class manufacturing organization, MillerCoors
implemented new strategies to engage workers in job functions (Semper, 2011). Senior
leaders at MillerCoors did not fully explain the role of FLMs in these new strategies,
which resulted in conflict (Semper, 2011). MillerCoors gave both senior managers and
employees extensive training geared toward empowered work performance, yet FLMs
received no training in how to lead in this new environment (Semper, 2011). FLMs took
on two separate but conflicting roles: (a) regular job duties, and (b) secondary duties

51
associated with the new tasks (Semper, 2011). FLMs were unable to sustain new
processes as they lacked the knowledge and training to follow new protocols (Semper,
2011). Fast, Burris, and Bartel (2014) found this pattern familiar, as FLMs lacking self-
efficacy in their work roles are less likely to solicit input and less likely to take received
employee input into account. These lessons highlight the importance of empowering
FLMs to both participate in and drive organizational change. Senior manufacturing
leaders should include FLMs in training efforts and change strategy formulations for
change sustainability.
Developing FLM skills to influence change behaviors, such as employee
commitment to change, may increase the likelihood of change initiative success.
McClean, Burris, and Detert (2013) postulated that FLMs have significant influence over
employee change behaviors. McClean et al. reported that increasing FLM participation
and access to resources during change initiatives increased employee engagement and
decreased turnover. Regardless of the outcome measured, FLMs influence both positive
and negative employee behaviors through their actions and leadership styles.
FLMs behave in ways that may either empower their subordinates and positively
influence employee behaviors, or perceptively transgress against their employees and
negatively influence employee behaviors. To identify how FLMs may positively
influence employees behaviors, Erturk (2012) examined psychological empowerment in a
manufacturing context. Erturk found that psychological empowerment and trust in
supervisor positively related to creative and innovative employees who (a) believed
FLMs had their best interests in mind and (b) felt empowered to share opinions to

52
influence organizational processes, policies, strategies, and results. FLM behaviors
influence employee behaviors.
FLMs may also influence employee trust in the organization through their actions
by treating employees fairly and consistently. Sousa-Lima, Michel, and Caetano (2013)
found that FLMs in manufacturing could increase employee trust in their organizations
by treating employees fairly and uniformly, effectively communicating important issues
with employees, and creating supportive supervisory relationships. In another study of
manufacturing workplace justice during change initiatives, perceived differences in
treatment between employees were positively related to emotional exhaustion and
negatively related to commitment to change (Bernerth, Walker, Walker, & Hirschfeld,
2011). Bernerth et al. (2011) described that employees judge what is fair by comparing
their treatment against how they perceive FLMs are treating others. Bernerth et al. further
postulated that when differences arise that employees perceive as unfair, employees
perceive an injustice is committed against them, decreasing the likelihood of positive
behavioral outcomes such as commitment to change. These findings highlight the duality
of FLM influence, as FLMs can positively or negatively affect the manufacturing
workforce through their actions.
Just as leadership empowering behavior influences positive outcomes and
behaviors, abusive FLM behaviors negatively affect employee outcomes and behaviors.
Lin, Wang, and Chen (2013) suggested that abusive supervisory behaviors were higher in
manufacturing than other professional industries. Lin et al. (2013) argued that higher
abusive supervisory behaviors occur due to higher power distance orientations in
53
manufacturing organizations, with similar findings observed in both China and the United
States. In this context, FLMs play a potentially larger role in ensuring fair treatment of
employees in the manufacturing industry, compared to industries with smaller power
distance orientations.
FLMs may significantly influence a broad range of behaviors and outcomes
through their employee relationships. Palanski, Avey, and Jiraporn (2014) conducted a
quantitative study across industries that highlighted the effects of both ethical and abusive
FLM relationships with employees on job satisfaction, job search behaviors, and
intentions to quit. Consistent with their hypotheses, ethical leadership behaviors increased
employee job satisfaction, reduced intentions to quit, and decreased job search behaviors.
Abusive leadership behaviors had an inverse relationship with each of these measures
(Palanski et al., 2014). These findings suggest that FLMs hold influential positions across
industries due to the positive or negative influence their actions may have on
subordinates.
FLMs engaged in abusive employee relationships likely have negative effects on
a multitude of outcomes. Gregory, Osmonbekov, Gregory, Albritton, and Carr (2013)
examined the relationship between abusive supervisory behavior and organizational
citizenship behavior. The researchers found that employees not only reduced
organizational citizenship behavior, such as helping coworkers or engaging in tasks that
are not formally rewarded, but also demanded more money over time in response to
abuse. Demand for pay increases occurs as employees turn to extrinsic reasons to perform
when employees are no longer intrinsically motivated to perform due to poor treatment
54
(Gregory et al., 2013). Botsford Morgan and King (2012) and Sharkawi, Abdul Rahman,
and Azuradahalan (2013) explained this effect through the lens of psychological contract
violation. Psychological contract violation occurs when employees form psychological
contracts with their FLMs and expectations are unfulfilled. As expectations are
unfulfilled, employees feel a contract breach resulting in counterproductive work
behaviors. Abusive FLM behaviors are damaging to the organization, and many occur
overtly or in subtle ways where management may have difficulty observing.
Abusive FLM behaviors may occur in many forms. Basford (2014) identified
eleven themes including performance criticisms, demeaning insults, false accusations,
unreasonable demands, unfair employment decisions, inconsiderate treatment, inequitable
behavior, inappropriate contextual selections, disregard of opinions, undersupplied
resources, and underprovided recognition. Business leaders may be able to decrease the
probability that FLMs engage in these abusive behaviors by developing skilled FLMs that
place employee needs in high regard.
Many leadership styles may be appropriate per situational context. Servant
leadership is a viable leadership theory that positively influences organizational outcomes
by placing employee needs above those of the leader. FLMs have significant influence
over their employees. Through servant leadership, FLMs may positively influence
behaviors and outcomes by valuing employees, creating trusting relationships, and
demonstrating efforts to treat employees with high regard for their contributions.
55
Transition and Summary
Change failure rates have consistently remained near 70% for decades with no
clear model on how to avoid failure (Decker et al., 2012; Maurer, 2011). Skilled FLMs
who positively influence individual and organizational outcomes such as commitment to
change may assist in improving upon these change failure rates (Bouckenooghe, 2012).
Servant leadership is a tenable leadership theory that FLMs may utilize to influence
follower outcomes such as commitment to change (Parris & Peachey, 2013; van
Dierendonck, 2011). In this study, I examined the relationship between employee
perception of their FLM’s servant leadership dimensions and employee ACC.
In section 1, I presented the foundation of this study including the background of
the problem, problem statement, the purpose of the study, the research questions and
hypotheses, the theoretical framework, operational definitions, significance of the study,
and an extensive review of the literature. Section 2 contains the research project including
a review of the purpose statement, role of the researcher, participants, research method
and design, population and sampling, ethical research, instrumentation, data collection
and analysis techniques, and study validity.

56
Section 2: The Project
Servant leadership theory is a viable leadership theory that places follower needs
above those of the leader (Parris & Peachey, 2013). Initial evidence suggests that servant
leadership positively correlates with the employee commitment to change necessary to
for change success (Kool & van Dierendonck, 2012). I used the following research
question in my study: What is the relationship between employee perception of their
FLM’s (a) conceptual skills, (b) empowering, (c) helping subordinates grow and succeed,
(d) putting subordinates first, (e) behaving ethically, (f) emotional healing, (g) creating
value for the community, and employee ACC? Section 2 contains the research project
including a review of the purpose statement, role of the researcher, participants, research
method and design, population and sampling, ethical research, instrumentation, data
collection and analysis techniques, and study validity.
Purpose Statement
The purpose of this quantitative study was to examine the relationship between
employee perception of their FLM’s servant leadership dimensions and employee ACC.
The independent variables were employee perceptions of their FLM’s (a) conceptual
skills, (b) empowering, (c) helping subordinates grow and succeed, (d) putting
subordinates first, (e) behaving ethically, (f) emotional healing, and (g) creating value for
the community. The dependent variable was employee ACC. The targeted population
was manufacturing firms located in the United States. This study promoted positive
social change and the potential to improve business practices by providing information
manufacturing leaders might use to increase the probability of change success and reduce

57
change implementation costs. Increased change success rates might benefit communities
through access to more affordable, higher quality goods and services. The implications
for positive social change also include the potential to decrease employee anxiety and
uncertainty during organizational change.
Role of the Researcher
The role of the researcher is to gather data; analyze data; and present the findings
in an unbiased, neutral, and ethical manner (Khan, 2014). My role as the researcher was,
therefore, to collect data, analyze data, and present the results in an unbiased, neutral, and
ethical manner. I had no direct or personal relationships with any study participants. I
previously worked in the manufacturing industry within the United States as an FLM. I
accumulated experience as an FLM in manufacturing and a working knowledge of
servant leadership through organizational and academic experiences before conducting
this study. Previous experience and working knowledge did not bias or affect my
objectivity or interpretation of results.
Researchers must conduct ethical research (Khan, 2014). Ethical research
considerations include causing no harm to participants, ensuring voluntary consent, and
ensuring participant anonymity and confidentiality (Khan, 2014). Ethical research also
includes not disrupting the collection site and communicating the intent and purpose of
the study (Caruth, 2013). I conducted ethical research, caused no harm to participants,
ensured voluntary consent, ensured participant anonymity and confidentiality, did not
disrupt the collection site, and communicated the intent and purpose of this study to
participants.

58
I complied with all ethical protocols established in the Belmont Report (1979)
regarding the ethics and principles of research involving human subjects. I also complied
with all ethical protocols as set forth by the Walden University Institutional Review
Board (IRB) and the American Psychological Association (APA). The Belmont Report
contains three fundamental principles for the ethical treatment of human research
subjects: (a) respect for persons, (b) doing no harm including maximizing benefits and
minimizing risks to participants, and (c) fairly distributing justice across research
participants.
Participants
A sample is the subset of a population and must be representative of the
population (Acharya, Prakash, Saxena, & Nigam, 2013). Researchers must also ensure
the sample aligns with the overarching research question (Uprichard, 2013). Researchers
violate statistical conclusion validity if the sample is not representative of the population
(Venkatesh, Brown, & Bala, 2013). I included five eligibility criteria to ensure
participants were representative of the target population. The five eligibility criteria were
(a) participants work in a manufacturing organization in the United States, (b)
participants are hourly employees, (c) participants are employed in an operations or
support role, (d) participants have been involved in or affected by an organizational or
departmental change in the past year, and (e) participants have an FLM with whom the
participant interacts with at least weekly.
I used a purposive, nonprobability sampling technique to gain access to
participants. Researchers using purposive, nonprobability sampling techniques accept an

59
unknown probability of participant selection, making this technique less desirable owing
to selection bias (Archarya et al., 2013). The purposive, nonprobability sampling method
is the most common method used in correlational designs, and it is more convenient and
cost effective than other methods (Kandola et al., 2014). My strategy to find participants
was to contact manufacturing organizations in the United States and solicit human
resource (HR) managers via telephone and email for permission to survey employees (see
Appendix D). Inferential validity is violated if the sample is not representative of the
population (Venkatesh et al., 2013). I discussed eligibility requirements with interested
HR managers to ensure participants were representative of the target population. Upon
receiving a letter of cooperation, I established a working relationship with the
participating organization by keeping the participating organization informed of the
research process and data collection methods. I also ensured the participating
organization had a complete understanding of participant confidentiality and anonymity. I
discussed the importance of voluntary consent with the participating organization. I
ensured the participating organization understood that they could not recruit participants
on my behalf and that there could be no actual or implied repercussions for employees
who declined participation.
I interacted with and established a working relationship with individual
participants only once I was on-site to collect data. Researchers must convey trust and
understanding in their interactions with participants (Venkatesh et al., 2013). Quantitative
researchers should also remain neutral during the research process (Yilmaz, 2013). A
researcher can establish a neutral, trusting relationship with participants in part by

60
discussing informed consent (Khan, 2014). Researchers should ensure participants
understand that their participation is voluntary and inform participants of the purpose and
research goals of the study (Khan, 2014). I ensured that participants had a thorough
understanding of informed consent before questionnaire completion, including anonymity
within their organization and the exclusion of any personally identifiable information. I
had no further contact with participants after data collection. Upon doctoral study
approval, I concluded the working relationship with the participating organization by
emailing the organization a one-page study summary detailing findings and conclusions.
The participating organization ensured all participants had access to study findings and
conclusions by posting the one-page summary on their facility announcement boards.
Research Method and Design
The research method and design must align with the research question. The
research method may be qualitative, quantitative, or mixed-methods (Yilmaz, 2013). The
research design is the particular design within that methodology the researcher uses to
address the research question (Castillo-Page et al., 2012). My method and design aligned
with the following research question in my study: What is the relationship between
employee perception of their FLM’s (a) conceptual skills, (b) empowering, (c) helping
subordinates grow and succeed, (d) putting subordinates first, (e) behaving ethically, (f)
emotional healing, (g) creating value for the community, and employee ACC?
Research Method
The research method delineates a study as qualitative, quantitative, or mixed-
methods (Caruth, 2013). A quantitative research method was best suited for the research
61
question in this study. I examined the linear relationship between multiple independent
variables and a single dependent variable. A quantitative approach is the appropriate
methodology for examining the relationship between independent and dependent
variables, and is objective, generalizable, and reliable (Martin & Bridgmon, 2012).
Researchers examine relationships using quantitative methodologies through the use of
descriptive and inferential statistics that assign probabilities of observed findings in
making external generalizations (Yilmaz, 2013).
In quantitative research, researchers use statistical tools and analysis techniques to
examine relationships between phenomena (Caruth, 2013). To accomplish this,
researchers use pre-constructed instrumentations to measure the phenomena objectively
under inquiry via deductive reasoning and make external generalizations with their
findings (Yilmaz, 2013). Researchers focus on hypothesis testing in quantitative
methodologies whereas hypothesis generation is better suited to qualitative methods
(Castillo-Page et al., 2012). Researchers use quantitative methods to quantify the
relationship between variables (Onwuegbuzie et al., 2009). Researchers using
quantitative methods may overlook other phenomena or variables affecting outcomes or
experiences that may otherwise surface through qualitative methodologies (Yilmaz,
2013).
Qualitative methods may address an identified weakness in quantitative
methodologies in that researchers using qualitative methodologies may better identify
phenomena, variables, or nuances of a research question that may otherwise be
unexplored during quantitative efforts (Hunt, 2011). In qualitative studies, researchers
62
aim to provide an in-depth understanding of human experiences and the meanings
attached to them (Yilmaz, 2013). Researchers using qualitative methods often focus on
understanding how and why behaviors and events occur (Castillo-Page et al., 2012). I
ruled out using a qualitative method for two reasons. First, a qualitative method was not
appropriate to examine the statistical relationship between variables. Second, I tested a
hypothesis informed by the literature review, which included both an existing theory on
servant leadership and a standardized instrument to measure servant leadership
dimensions as independent variables.
I also chose not to use a mixed-method. In mixed-methods, researchers combine
aspects of both quantitative and qualitative designs in the same study to potentially add
robustness to the research (Caruth, 2013). Mixed-methods include triangulation,
embedded, explanatory, and exploratory designs (Castillo-Page et al., 2012). Scholars can
develop rich insights by using mixed-methods that may otherwise be difficult to obtain
using only qualitative or quantitative methods (Venkatesh et al., 2013). The use of mixed-
methods frequently increases research complexity (Leedy & Ormrod, 2013). Researchers
often use mixed-methods to generate hypotheses and triangulate qualitative and
quantitative data (Leedy & Ormrod, 2013). I did not consider a mixed-method because
the variables in this study were well-defined, and the purpose of this study was not to
triangulate data or generate new hypotheses for future research.
Research Design
Quantitative research designs are the blueprint for a quantitative study and dictate
the type and interpretation of statistics used to gather and analyze data (Martin &
63
Bridgmon, 2012). The three main categories of design are experimental,
quasiexperimental, and nonexperimental (Castillo-Page et al., 2012). I used a
nonexperimental correlational design. Researchers use correlational designs to explore
multivariate relationships without the utilization of a control group or researcher
manipulation to outcome variables (Martin & Bridgmon, 2012). Researchers use
correlational designs to measure both direction and strength of the relationship between
variables without implying causation (Leedy & Ormrod, 2013).
I chose not to use an experimental or quasiexperimental design. In an
experimental design, researchers assign participants to experimental and control groups,
while manipulating treatment variables between groups to determine causality (Castillo-
Page et al., 2012). Researchers use experimental designs to attempt to control and
understand changes in variables by carefully designing the procedures and conditions of
an experiment, such as randomization of participant assignment to test or control groups
while minimizing extraneous variables (Martin & Bridgmon, 2012). Researchers also use
quasiexperimental designs to discover causal relationships between variables (Martin &
Bridgmon, 2012). Quasiexperimental designs lack the randomization of participant group
assignment (Leedy & Ormrod, 2013).
Neither experimental nor quasiexperimental approaches were appropriate for this
study. The independent variables in this study were seven servant leadership dimensions.
The dependent variable was ACC. The intent of this study was to examine the statistical
relationship between variables, not to identify causation typically measured in
experimental designs. Most importantly, I did not use random assignment to groups nor

64
treatments or interventions. A correlational design was most appropriate. Though it was
possible to conduct an experiment or quasiexperiment given the independent and
dependent variables, conducting an experiment or quasiexperiment would have required
providing a treatment that may have been expensive, time-consuming, and difficult to
implement.
Population and Sampling
Researchers must ensure the sample aligns with the overarching research question
(Uprichard, 2013). The sample must also be representative of the population to avoid
violating statistical conclusion validity (Venkatesh et al., 2013). When a researcher
violates statistical conclusion validity, the researcher violates inferences regarding the
correlation between study variables (Venkatesh et al., 2013). The target population for
this study was manufacturing firms located in the United States. I used five participant
eligibility criteria to ensure the sample was representative of the population and aligned
with the overarching research question. The five eligibility criteria were: (a) participants
work in a manufacturing organization in the United States, (b) participants are hourly
employees, (c) participants are employed in an operations or support role, (d) participants
have been involved in or affected by an organizational or departmental change in the past
year, and (e) participants have an FLM with whom the participant interacts with at least
weekly.
Researchers choose their population sampling technique based on the research
question, population of interest, and resources available to the researcher (Acharya et al.,
2013; Uprichard, 2013). The two primary approaches to sampling techniques are

65
probability and nonprobability sampling (Kandola, Banner, O’Keefe-McCarthy, & Jassal,
2014). Probability sampling, though time-consuming and costly, is the most desirable
sampling technique as each member of the population has an equal and randomized
probability of inclusion into the study (Kandola et al., 2014). Probability sampling
techniques include simple random sampling, systematic random sampling, stratified
random sampling, cluster sampling, multiphase sampling, and multistage sampling
(Archarya et al., 2013; Kandola et al., 2014).
In comparison, nonprobability sampling techniques have an unknown probability
of participant selection into the study and therefore are less desirable due to selection bias
(Archarya et al., 2013; Kandola et al., 2014). Researchers cannot generalize findings
across populations using nonprobability sampling techniques due to the potential for
selection bias (Archarya et al., 2013). Nonprobability sampling techniques are generally
more convenient, cost-effective, and often used for pilot studies or to inform future
research directions (Archarya et al., 2013). Nonprobability sampling techniques include
purposive sampling, quota sampling, and snowball sampling methods (Kandola et al.,
2014). I used a nonprobability purposive sampling technique based on convenient access
to the population. The nonprobability purposive sampling technique is the most common
sampling method utilized in conjunction with nonexperimental quantitative
methodologies such as correlational designs (Archarya et al., 2013).
To determine the minimum required sample size, I used the free statistical
software package G*Power to conduct an apriori sample size analysis (Faul, Erdfelder,
Buchner, & Lang, 2009). I conducted a power analysis using G*Power version 3.1.9.2

66
software that indicated, assuming a medium effect size (f2 = .15), α = .05, and seven
independent variables, that a sample size of 103 participants was required to achieve a
power of .80 and a sample size of 203 participants was required to increase power to .99
(see Figure 2). I included between 103 and 203 participants in the study.
Figure 2. Power as a function of sample size.
The effect size represents an indexed value of the difference between the null and
alternate hypothesis, and ultimately the degree to which the null hypothesis is considered
false (Cohen, 1992). The use of a medium effect size (f2 = .15) represents an effect that is
likely to be observed by a researcher’s naked eye as is recommended for quantitative
research (Cohen, 1992; Faul et al., 2009). An alpha value indicates the risk of falsely
rejecting the null hypothesis and the probability of committing type I error (Cohen,
1992). Researchers most frequently use an α = .05 in quantitative studies, thereby
accepting a 5% probability of committing Type I error (Cohen, 1992). A power of .80
represents a medium probability of rejecting a false null hypothesis at a given confidence
interval and corresponds with a .20 probability of committing Type II error, also referred
0.6 0.65 0.7 0.75 0.8 0.85 0.9 0.95
0
20
40
60
80
100
120
140
To
tal sa
mp
le s
ize
= 0.15
Effect size f²
F tests - Linear mult iple regression: Fixed model. R² deviation from zero
Number of predictors = 7. α err prob = 0.05. Ef ect size f² = 0.15
Power (1-β err prob)
67
to as failing to reject a false null hypothesis (Cohen, 1992). A power lower than .80 risks
committing too high of Type II error and a power greater than .80 requires a sample size
that may be outside researcher resource constraints (Cohen, 1992).
Ethical Research
I obtained approval from the Walden University IRB (05-13-16-0341893) before
collecting data. The IRB reviews research proposals for ethical considerations to ensure
protections are in place to properly safeguard participants (Tamariz, Palacio, Robert, &
Marcus, 2013). I sent an introductory email to the participating organization that included
the background and purpose of the study, the anonymity and voluntary nature of
participation, and explained the informed consent process (see Appendix D). Researchers
must solicit informed consent for research to be ethical (Khan, 2014). Evidence exists
that participants may not fully understand informed consent and researchers can improve
participant understanding (Tamariz et al., 2013). Researchers can improve
comprehension by spending more time explaining informed consent to participants and
answering questions that may arise (Tamariz et al., 2013).
Each participant received a copy of the informed consent form in their
questionnaire packet. I explained the informed consent process at employee meetings to
potential participants interested in learning more about the study. I also remained
available during the entire data collection period to answer any additional questions
regarding the informed consent form or process. The informed consent form indicated
that participants could keep the informed consent copy for his or her records and that no
signature was required. I addressed all questions and concerns so that participants felt
68
comfortable agreeing to informed consent. Participation in any research must be
voluntary (Khan, 2014). As indicated in the informed consent form, participants could
withdraw from the study at any point. Participants could withdraw by simply declining to
participate, returning a partially completed questionnaire, or returning a blank
questionnaire. Commercial researchers often use incentives to increase participation and
response rates (Chang & Vowles, 2013). I am not a commercial researcher, and I did not
use extrinsic incentives to encourage participation in this study. The informed consent
form indicated how study findings could lead to positive social change.
Researchers must take measures to assure the ethical protection of participants
(Khan, 2014). Researchers must assure participants of anonymity and confidentiality, in
addition to voluntary consent (Khan, 2014). I ensured anonymity and confidentiality of
all organizational and individual identifiers by explicitly omitting any opportunity to
record the participating organization’s name, a participant’s name, or any personally
identifiable information. Researchers cannot fully provide complete confidentiality and
anonymity for data collected and stored online (Chang & Vowles, 2013). I collected data
on-site and offline, and only I have access to the data. I will store original copies offline
in a fire-rated safe for 5 years to maintain participant confidentiality. After 5 years all
documents will be shredded in compliance with Walden University requirements. See
Appendix E for the National Institutes of Health Certificate of Completion certifying my
training in Protecting Human Research Participants.
69
Instrumentation
I conducted a site visit to collect data using two instruments. Liden et al. (2008)
published the instrument titled the SL-28. Researchers use the SL-28 to measure seven
dimensions of servant leadership. Herscovitch and Meyer (2002) published the
instrument titled the Commitment to Change Inventory (CCI) (see Appendix A and
Appendix B for the instruments, and Appendix C for permissions to use the instruments).
The CCI contains three sections of six-items each, with each section measuring a
dimension of commitment to change. I only used the six-item section measuring the
dimension of ACC.
Liden et al. (2008) developed the SL-28 as a 28-item instrument measuring seven
distinct servant leadership dimensions. The SL-28 contains a 7-point Likert-type ordinal
scale of measurement ranging from 1 (strongly disagree) to 7 (strongly agree) with four
items covering each dimension. Each dimension was an independent variable in this
study. The independent variables were conceptual skills, empowering, helping
subordinates grow and succeed, putting subordinates first, behaving ethically, emotional
healing, and creating value for the community (see Table 3 for definitions). Scholars
agree that servant leadership is a multidimensional construct (Parris & Peachey, 2013;
van Dierendonck, 2011). Researchers often ignore these dimensions and research servant
leadership a single variable, which limits implications of research findings (Liden et al.,
2015).

70
Table 3
Definitions of Servant Leadership Dimensions
1. Emotional healing (EH): The act of showing sensitivity to others’ concerns.
2. Creating value for the community (CVFTC): A conscious, genuine concern for
helping the community.
3. Conceptual skills (CS): Possessing the knowledge of the organization and tasks at
hand so as to be in a position to effectively support and assist others, especially
immediate followers.
4. Empowering (Emp): Encouraging and facilitating others, especially immediate
followers, in identifying and solving problems, as well as determining when and how
to complete work tasks.
5. Helping subordinates grow and succeed (HSGAS): Demonstrating genuine concern
for others' career growth and development by providing support and mentoring.
6. Putting subordinates first (PSF): Using actions and words to make it clear to others
that satisfying their work needs is a priority (supervisors who practice this principle
will often break from their work to assist subordinates with problems they are facing
with their assigned duties).
7. Behaving ethically (BE): Interacting openly, fairly, and honestly with others.
________________________________________________________________________
Herscovitch and Meyer (2002) developed the CCI as an 18-item instrument to
measure commitment to change, including a six-item scale to measure the dependent
variable in this study, ACC. Researchers use the CCI as the prevailing instrument to both
understand and measure commitment to change (Bouckenooghe et al., 2015).
Herscovitch and Meyer defined ACC as the internal desire to commit to an organization
based upon perceived benefits of the change. Researchers suggest that ACC is the
commitment to change dimension most positively related to behavioral support for
change initiatives and is linked to employee willingness to extend the extra effort to make
a change initiative successful (Morin et al., 2015). The 18-item CCI contains a 7-point
Likert-type ordinal scale of measurement ranging from 1 (strongly disagree) to 7

71
(strongly agree) with six items covering each dimension. I only used the six-item scale
measuring ACC.
Both the SL-28 and the CCI were appropriate instruments for this study. The SL-
28 demonstrates a stable factor structure across multiple samples and is a valid
instrument owing to the rigorous procedures used in development (van Dierndonck,
2011). Investigating servant leadership as a multifactorial construct using the SL-28
maximizes domain coverage that researchers have previously ignored (Liden et al.,
2015). The CCI was the appropriate instrument because it is the only empirically
researched instrument used to measure ACC (Bouckenooghe et al., 2015).
After IRB approval, I coordinated with the participating organization for the time
and place to administer the instruments via paper and pencil. On-site data collection
eliminates potential selection bias that may otherwise occur when target populations have
limited Internet access (Weigold, Weigold, & Russell, 2013). Researchers remain present
in the room when collecting on-site data to control the research setting and monitor for
factors such as distractions and environmental cues (Ward, Clark, Zabriskie, & Morris,
2012). Researchers must also remain neutral (Khan, 2014). The participating organization
reserved a private conference room for me, which allowed me to control the research
setting and monitor for factors such as distractions and environmental cues. Participants
were free to complete the questionnaire in the reserved conference room and ask any
questions about the research process. Participants reviewed the procedures located in the
informed consent form before instrument administration. Participants then completed the
72
SL-28 and CCI. The average duration for completion of all questionnaire items was 10
minutes.
Researchers can use the SL-28 as a single factor instrument by summing and
averaging all 28 items (Liden et al., 2015). I used the SL-28 as a multifactorial instrument
and calculated scale scores by averaging scaled responses for each servant leadership
dimension. I calculated the CCI score by averaging the six scaled responses for ACC
(Herscovitch & Meyer, 2002). Herscovitch and Meyer (2002) used Oblimin rotation for
items 3, 5, and 6 of the ACC scale so I reverse scored these three items to arrive at their
true values. Final scores represented the mean value per participant, per variable, ranging
from 1 (strongly disagree) to 7 (strongly agree).
Researchers have used the SL-28 in diverse populations though only as a single
factor instrument. Most recently, these populations include a service-oriented private firm
in China (Chan & Mak, 2014), information technology professionals in the Ukraine (de
Clercq et al., 2014), restaurant managers and employees in the United States (Liden et al.,
2014), graduate students and real estate employees in the United States (Liden et al.,
2015), cross-industry employees in Singapore (Liden et al., 2015), and technology CEOs
in the United States (Peterson et al., 2012). Researchers used the CCI to measure ACC in
diverse populations. Most recently, these populations include an Italian hospital setting
(Battistelli et al., 2014), and automotive company in Belgium (Bouckenooghe et al.,
2014), a European reintegration company (Kool & van Dierendonck, 2012), a state-
owned organization in Indonesia (Mangundjaya, 2015), an Italian pharmaceutical
73
company (Montani et al., 2012), cross-industry employees in Spain (Pardo-Del-Val et al.,
2012), and a large organization undergoing change in the United States (Seo et al., 2012).
In an effort to create an efficient and reliable scale, Liden et al. (2008) used the
four highest loading factors with a loading factor of at least .4 (for a total of 28 items) for
each dimension. The seven dimensions and accompanying scale reliabilities (Cronbach’s
alpha) were: (a) conceptual skills (α = .81), (b) empowering (α = .80), (c) helping
subordinates grow and succeed (α = .82), (d) putting subordinates first (α = .86), (e)
behaving ethically (α = .83), (f) emotional healing (α = .76), and (g) creating value for the
community (α = .83), indicating high scale reliability (Liden et al., 2008). Scholars use
Cronbach’s alpha, also referred to as the alpha coefficient, as a representation of internal
consistency and reliability (Herscovitch & Meyer, 2002). A value of (α = .70) or greater
indicates acceptable reliability (Liden et al., 2008).
Instrument validity is how accurately an instrument measures what it intends to
measure (Caruth, 2013). Multiple types of validity fall into three categories: design
validity, measurement validity, and inferential validity (Venkatesh et al., 2013). More
specifically, design validity includes internal and external validity; measurement validity
includes construct validity, content validity, and reliability, and inferential validity is the
statistical conclusion validity (Yilmaz, 2013). Liden et al. (2008) ensured content validity
through full content review and item selection per characteristic by each participating
researcher (Liden et al., 2008). The researching team then met to discuss and reach
consensus on the original 85-items (Liden et al., 2008). The authors then chose the four
74
highest loading items for each of the remaining seven dimensions to ensure reliability,
ease of use, and content validity (Liden et al., 2008).
Liden et al. (2008) tested the external and discriminate validity by regressing
hypothesized outcomes using the developed 28-item servant leadership instrument while
controlling for transformational leadership and leader–member exchange in a multi-level
hierarchical linear modeling analysis (Liden et al., 2008). The authors found that servant
leadership was a multidimensional construct and uniquely contributed to explaining
hypothesized outcomes after controlling for transformational leadership and leader–
member exchange (Liden et al., 2008). Last, the researchers examined predictive validity
through both a pilot study with student participants and a secondary study using working
professionals and found support for predictive validity (Liden et al., 2008).
Herscovitch and Meyer (2002) tested for reliability and validity of the CCI.
Herscovitch and Meyer reported a scale reliability of (α = .92) for ACC, representing
high reliability. The authors examined construct and content validity by conducting a
principal-axis factor analysis with Oblimin rotation for 22 survey items, forming
composite scales with corresponding correlations. Next, Herscovitch and Meyer
conducted 2 x 2 x 2 ANOVAs and found strong main effects for each manipulation on
each dimension. The authors discarded two items that failed to load at least .5 on the
appropriate factor and two items that loaded on multiple factors, resulting in an 18-item
instrument with factor loadings of at least .5 per factor. The researchers confirmed the
best fit of this model through confirmatory factor analysis and goodness of fit using root-
mean-square error of approximation and expected cross-validation index. The resulting

75
18-item instrument contained six items for the dimension of ACC. I made no revisions to
either the SL-28 or CCI. Raw data is available upon written request.
Data Collection Technique
I conducted on-site data collection using the SL-28 and CCI instruments.
Researchers use standardized instruments to gather data in quantitative studies (Yilmaz,
2013). Online data collection is an increasingly popular method to collect data using
standardized instruments and researchers must weigh the advantages and disadvantages
of online versus on-site paper and pencil collection techniques (Ward et al., 2012). Online
data collection is more convenient, faster, and cost-effective than paper and pencil
questionnaires (Chang & Vowles, 2013). Online data collection methods may also
correlate with higher participation rates and increased access to larger geographical areas
(Ward et al., 2012), and eliminate the time and costs of data entry (Weigold et al., 2013).
There are disadvantages to online techniques. Disadvantages include the potential
difficulty in sampling select participants due to spam filters or invalid email addresses
(Chang & Vowles, 2013) and disparate internet access (Weigold et al., 2013). A third
disadvantage is potential variations in survey instrument reliability developed from paper
and pencil data collection methods (Ward et al., 2012). Researchers may also encounter
ethical concerns over confidentiality and anonymity using online collection techniques as
the data is not under strict control of the researcher (Chang & Vowles, 2013).
I conducted on-site data collection for three interrelated reasons: increased data
availability, reduced selection bias, and in-person explanation and responsiveness to
issues concerning informed consent. A site visit to collect data was suitable for a

76
manufacturing facility with a large number of employees and limited Internet access.
More specifically, fast-paced manufacturing operations coupled with potential disparate
Internet access made completion of an online questionnaire logistically difficult and may
have led to a low response rate or selection bias. Further, I justified the increased cost
associated with an on-site questionnaire as a strategy to minimally interfere with
manufacturing operations, as I could collect data in one short period or during employee
downtime. Last, ethical research requires informed consent, and participants often do not
fully understand informed consent (Tamariz et al., 2013). The site visit allowed me to
answer any questions concerning informed consent.
The researcher must be present during on-site data collection to monitor for
distractions (Ward et al., 2012). I attended employee meetings to introduce the study and
recruit potential participants. The participating organization reserved a conference room
for me to distribute questionnaires and collect data, and this conference room served as
the reserved space where employees could ask questions or complete the questionnaire in
privacy. I remained in the reserved conference room when not recruiting participants to
monitor for distractions and answer questions. The informed consent form indicated that
once participants agreed to informed consent, they could then complete both survey
instruments. Researchers must also ensure neutrality (Khan, 2014). The informed consent
form instructed participants to return questionnaires to the neutral collection point in the
reserved conference room upon completion.
77
Data Analysis
I used the following research question in my study: What is the relationship
between employee perception of their FLM’s (a) conceptual skills, (b) empowering, (c)
helping subordinates grow and succeed, (d) putting subordinates first, (e) behaving
ethically, (f) emotional healing, (g) creating value for the community, and employee
ACC?
The null and alternative hypotheses were:
H01: There is no statistically significant relationship between employee
perception of their FLM’s (a) conceptual skills, (b) empowering, (c) helping subordinates
grow and succeed, (d) putting subordinates first, (e) behaving ethically, (f) emotional
healing, (g) creating value for the community, and employee ACC.
Ha1: There is a statistically significant relationship between employee perception
of their FLM’s (a) conceptual skills, (b) empowering, (c) helping subordinates grow and
succeed, (d) putting subordinates first, (e) behaving ethically, (f) emotional healing, (g)
creating value for the community, and employee ACC.
After I completed data collection, I inputted survey data into an excel spreadsheet.
I then uploaded the spreadsheet into SPSS version 23 and analyzed the data using MLR.
MLR was the appropriate data analysis technique. In an MLR, researchers attempt to
model the relationship between a set of independent variables and a dependent variable
through linear equation fitment to data (Green & Salkind, 2011; Nimon & Oswald, 2013).
Researchers analyze fitment to data to assess the role multiple variables play in
accounting for variance in a singular dependent variable (Nathans, Oswald, & Nimon,
78
2012). I chose an MLR over other techniques. Researchers use MLR for ordinal data to
examine the role multiple independent variables play in accounting for variation in a
single dependent variable (Green & Salkind, 2011; Leedy & Ormrod, 2013).
One of the most important steps in data analysis is to make sure the data is entered
correctly (Green & Salkind, 2011). A disadvantage of collecting paper and pencil data is
that data is not automatically electronically uploaded (Ward et al., 2012). Researchers
may make input and processing errors when entering data manually (Chang & Vowles,
2013). I cleaned data by discarding any questionnaires with missing or illegible data. The
data cleaning resulted in 107 completed questionnaires.
Researchers must verify assumptions before continuing with additional statistical
procedures (Green & Salkind, 2011). Random-effects model assumptions are appropriate
for nonexperimental studies (Green & Salkind, 2011). Random-effects model
assumptions are: (a) all variables are normally distributed within the population and (b)
the data represents both a random sample of the population and variable scores are
independent of each other (Green & Salkind, 2011). Researchers should therefore test for
normality and linearity at a minimum.
Researchers conducting MLR should also test for outliers, homoscedasticity, and
multicollinearity (Tabachnick & Fidell, 2013). I tested for (a) multicollinearity, (b)
outliers, (c) normality, (d) linearity, (e) homoscedasticity, and (f) independence of the
residuals. Researchers may test for outliers, normality, linearity, and independence of the
residuals by examining the normal probability plot (P-P) of the regression-standardized

79
residual (Tabachnick & Fidell, 2013) and model homoscedasticity using a scatterplot of
the standardized residuals (Nimon & Oswald, 2013).
Researchers may test for multicollinearity by calculating correlation coefficients,
tolerance levels, and variance inflation factors (Tabachnick & Fidell, 2013).
Multicollinearity exists where there is a high correlation between independent variables
that may lead to one independent variable confounding the beta weight of another
(Keller, 2009). If a researcher observes multicollinearity, additional statistical analysis
should be performed (Nathans et al., 2012). I conducted the recommended procedures to
test for violations of assumptions and observe for any patterns or values that suggested a
violation.
Once I verified assumptions, I conducted an MLR to interpret inferential results.
The primary outputs interpreted in an MLR are the beta weights, R2 value, and the F
value reported in the ANOVA (Green & Salkind, 2011). The beta weights would indicate
an expected increase or decrease in the dependent variable if the independent variable
were increased or decreased by one standard deviation (Nathans et al., 2012). The R2
value indicates how much variation the linear combination of the independent variables
explains in the dependent variable (Pallant, 2013). The F value indicates how much
variation in the dependent variable the model explains (Keller, 2009). Each independent
variable corresponded to a unique beta weight that may be rank ordered to, on the
surface, rank variable importance in accounting for variance in the MLR model (Nathans
et al., 2012; Nimon & Oswald, 2013). When researchers use an alpha value of α = .05,

80
the researcher will reject the null hypothesis if the value is less than 0.05 (Nimon &
Oswald, 2013).
Study Validity
Study validity includes external, internal, and statistical conclusion validity
(Venkatesh et al., 2013). External validity is the extent that researchers can generalize
findings across populations or settings (Yilmaz, 2013). I used nonprobability purposive
sampling, and this choice was a threat to external validity. When researchers use
nonprobability sampling techniques, there is an unknown probability of participant
selection into the study and the researcher may introduce selection bias (Archarya et al.,
2013; Kandola et al., 2014). A limitation to nonprobability sampling is that results may
not be generalizable to the population (Archarya et al., 2013). Researchers and business
leaders may find results interesting enough to justify more rigorous designs and sampling
methods.
In quantitative research, internal validity refers to cause-and-effect relationships
between treatments and outcomes (Yilmaz, 2013). Researchers use correlational designs
to explore multivariate relationships without the utilization of a control group or
researcher manipulation to outcome variables (Martin & Bridgmon, 2012). Researchers
do not investigate cause-and-effect relationships when using correlational designs (Leedy
& Ormrod, 2013). Internal validity, therefore, did not apply to this study. Instead, I
discussed threats to statistical conclusion validity, otherwise known as inferential
validity.
81
Statistical conclusion validity is the validity of inferences researchers may make
regarding the correlation between independent and dependent variables (Leedy &
Ormrod, 2013). Threats to statistical conclusion validity include using the appropriate
sample size and Type I error rate, as well as using the appropriate statistical tests
(Barends, Janssen, ten Have, & ten Have, 2014). I reduced threats to statistical conclusion
validity by using the appropriate sample size, Type I error rate and statistical tests.
As previously discussed, I used the free statistical software package G*Power to
conduct an apriori sample size analysis to mitigate the threat of too small a sample size.
The results indicated I needed a sample size of 103 to 203 participants to reduce the
probability of committing Type I error assuming a medium effect size (f2 = .15), α = .05,
and seven independent variables. Too small a sample size may increase the probability of
Type I error (Faul et al., 2009). Last, I reduced threats to statistical conclusion validity by
conducting the appropriate statistical tests. I conducted an MLR as this was the
appropriate statistical analysis for the research question.
Transition and Summary
In Section 2, I restated the purpose of the study. I also discussed the role of the
researcher, participants, research method and design, population sampling, ethical
research, reviewed the instruments I used, discussed data collection and analysis
procedures, and study validity including external, internal, and statistical conclusion
validity. Section 3 contains study results, applications to professional practice,
implications for social change, and recommendations for future studies.

82
Section 3: Application to Professional Practice and Implications for Change
Commitment to change is a strong indicator of employee support needed for
organizational change to work (Abrell-Vogel & Rowold, 2014). Business leaders must
find ways to improve probabilities of change initiative success, as organizational change
initiatives in the United States frequently fail with estimated failure rates as high as 90%
(Cândido & Santos, 2015). In this study, I examined the relationship between employee
perception of their FLM’s servant leadership dimensions and employee ACC in a U.S.
manufacturing firm. In this section, I present the findings of the data analysis. I also
present how findings apply to professional practice, implications for social change,
recommendations for actions, and recommendations for further research.
Introduction
The purpose of this quantitative study was to examine the relationship between
employee perception of their FLM’s servant leadership dimensions and employee ACC
in a U.S. manufacturing firm. The independent variables were employee perceptions of
their FLM’s (a) conceptual skills, (b) empowering, (c) helping subordinates grow and
succeed, (d) putting subordinates first, (e) behaving ethically, (f) emotional healing, and
(g) creating value for the community. The dependent variable was employee ACC.
The null hypothesis was that there is no statistically significant relationship
between employee perception of their FLM’s (a) conceptual skills, (b) empowering, (c)
helping subordinates grow and succeed, (d) putting subordinates first, (e) behaving
ethically, (f) emotional healing, (g) creating value for the community, and employee
ACC. The alternative hypothesis was that there is a statistically significant relationship

83
between employee perception of their FLM’s (a) conceptual skills, (b) empowering, (c)
helping subordinates grow and succeed, (d) putting subordinates first, (e) behaving
ethically, (f) emotional healing, (g) creating value for the community, and employee
ACC. I found that employee perceptions of these variables related to their FLM did not
significantly predict employee ACC. Therefore, I failed to reject the null hypothesis.
Presentation of the Findings
In this section, I discuss the statistical tests that I performed, including tests of
statistical assumptions, descriptive statistics, and inferential results. I then discuss the
findings. I use MLR to model the relationship between employee perception of their
FLM’s servant leadership dimensions and employee ACC. The independent variables
were employee perceptions of their FLM’s (a) conceptual skills, (b) empowering, (c)
helping subordinates grow and succeed, (d) putting subordinates first, (e) behaving
ethically, (f) emotional healing, and (g) creating value for the community. The dependent
variable was employee ACC.
I invited 175 eligible employees to participate and received 134 completed or
partially completed questionnaires. I cleaned the data by discarding 27 incomplete
questionnaires, resulting in 107 completed questionnaires. Therefore, I analyzed 107
completed questionnaires. Researchers use bootstrapping to improve statistical accuracy
by offsetting the influence of possible violations of assumptions at a given confidence
interval (Koopman, Howe, Hollenbeck, & Sin, 2015). Therefore, I used bootstrapping of
2,000 samples to reduce the influence of any violations of assumptions. After evaluating
tests of assumptions, I performed a standard MLR, α = .05 (two-tailed) to examine the

84
role employees perceptions of their FLM’s servant leadership dimensions played in the
variance in employee ACC. The null hypothesis was that there is no statistically
significant relationship between employee perceptions of their FLM’s servant leadership
dimensions, and employee ACC.
Test of Assumptions
I evaluated tests of assumptions associated with MLR: (a) multicollinearity, (b)
outliers, (c) normality, (d) linearity, (e) homoscedasticity, and (f) independence of the
residuals. Researchers must test and carefully examine statistical assumptions related to
linear regression to determine if data is meaningful (Barton, Crozier, Lillycrop, Godfrey,
& Inskip, 2013). If the researcher identifies violations of assumptions, the researcher
should use another statistical analysis (Barton et al., 2013).
Multicollinearity. Multicollinearity is a phenomenon that occurs to some degree
in most multiple regression models when independent variables are highly correlated
(Keller, 2009). Researchers may observe a violation of the validity and consistency of
linear regression when independent variables are linearly related (Sinan & Alkan, 2015).
Researchers most commonly use variance inflation factors (VIFs) to diagnose
multicollinearity (Sinan & Alkan, 2015). VIFs represent the increase in the variance of a
regression coefficient related to the collinearity, and multicollinearity is strong when
VIFs are above 10 (Sinan & Alkan, 2015).
I tested for multicollinearity by calculating VIFs and correlation coefficients (see
Table 4). The VIFs were less than 10, indicating no major violations of multicollinearity.
However, correlation coefficients were medium to strong, indicating that independent
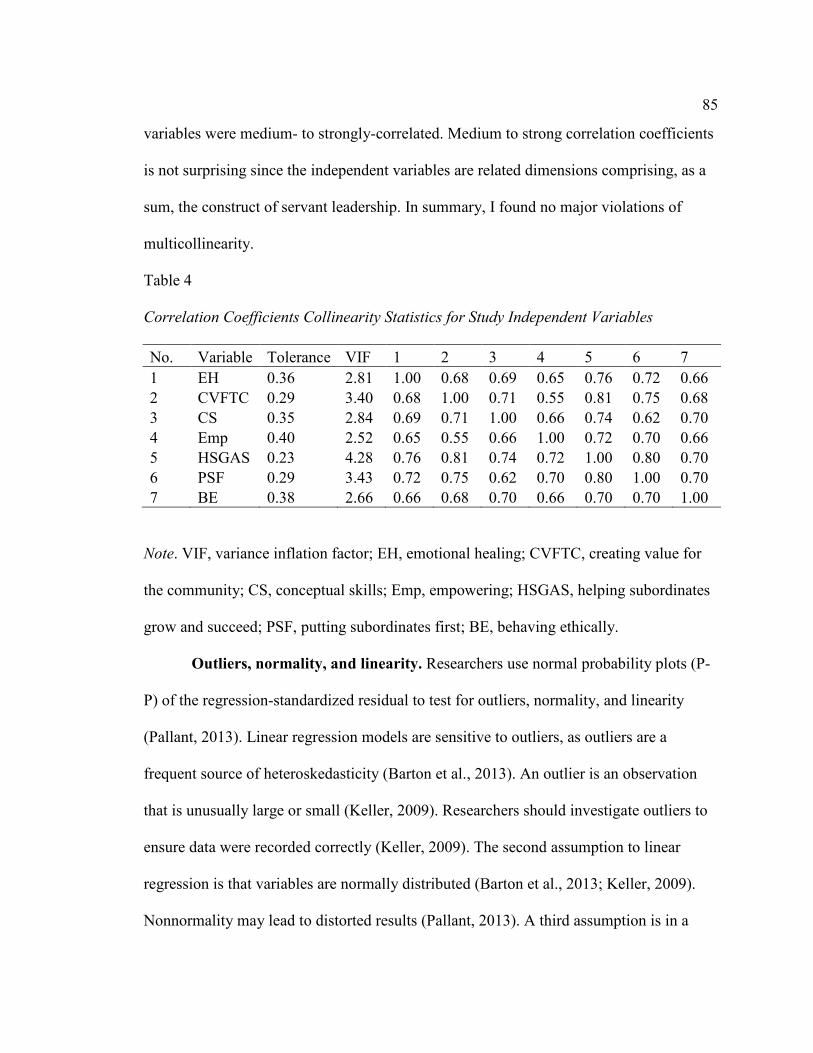
85
variables were medium- to strongly-correlated. Medium to strong correlation coefficients
is not surprising since the independent variables are related dimensions comprising, as a
sum, the construct of servant leadership. In summary, I found no major violations of
multicollinearity.
Table 4
Correlation Coefficients Collinearity Statistics for Study Independent Variables
No. Variable Tolerance VIF 1 2 3 4 5 6 7
1 EH 0.36 2.81 1.00 0.68 0.69 0.65 0.76 0.72 0.66
2 CVFTC 0.29 3.40 0.68 1.00 0.71 0.55 0.81 0.75 0.68
3 CS 0.35 2.84 0.69 0.71 1.00 0.66 0.74 0.62 0.70
4 Emp 0.40 2.52 0.65 0.55 0.66 1.00 0.72 0.70 0.66
5 HSGAS 0.23 4.28 0.76 0.81 0.74 0.72 1.00 0.80 0.70
6 PSF 0.29 3.43 0.72 0.75 0.62 0.70 0.80 1.00 0.70
7 BE 0.38 2.66 0.66 0.68 0.70 0.66 0.70 0.70 1.00
Note. VIF, variance inflation factor; EH, emotional healing; CVFTC, creating value for
the community; CS, conceptual skills; Emp, empowering; HSGAS, helping subordinates
grow and succeed; PSF, putting subordinates first; BE, behaving ethically.
Outliers, normality, and linearity. Researchers use normal probability plots (P-
P) of the regression-standardized residual to test for outliers, normality, and linearity
(Pallant, 2013). Linear regression models are sensitive to outliers, as outliers are a
frequent source of heteroskedasticity (Barton et al., 2013). An outlier is an observation
that is unusually large or small (Keller, 2009). Researchers should investigate outliers to
ensure data were recorded correctly (Keller, 2009). The second assumption to linear
regression is that variables are normally distributed (Barton et al., 2013; Keller, 2009).
Nonnormality may lead to distorted results (Pallant, 2013). A third assumption is in a

86
linear regression model, independent and dependent variables should exhibit a linear
relationship (Keller, 2009). Results of the model will underestimate relationships should
a nonlinear relationship exist (Keller, 2009).
Researchers may visually examine the probability plot (P-P) of the regression-
standardized residual for outliers, normality, and linearity (Pallant, 2013). Violation of
assumptions of outliers, normality, and linearity is evident when points on the normal
probability plot (P-P) are not in a reasonably straight line and contain significant outliers
(Pallant, 2013). Therefore, I tested for outliers, normality, and linearity by examining the
normal probability plot (P-P) of the regression-standardized residual (see Figure 3). I
observed no major violation of assumptions regarding outliers, normality, and linearity
because the points on the normal probability plot (P-P) are in a reasonably straight line
with no outliers.
Figure 3. Normal probability plot (P-P) of the regression-standardized residual
(dependent variable: ACC).
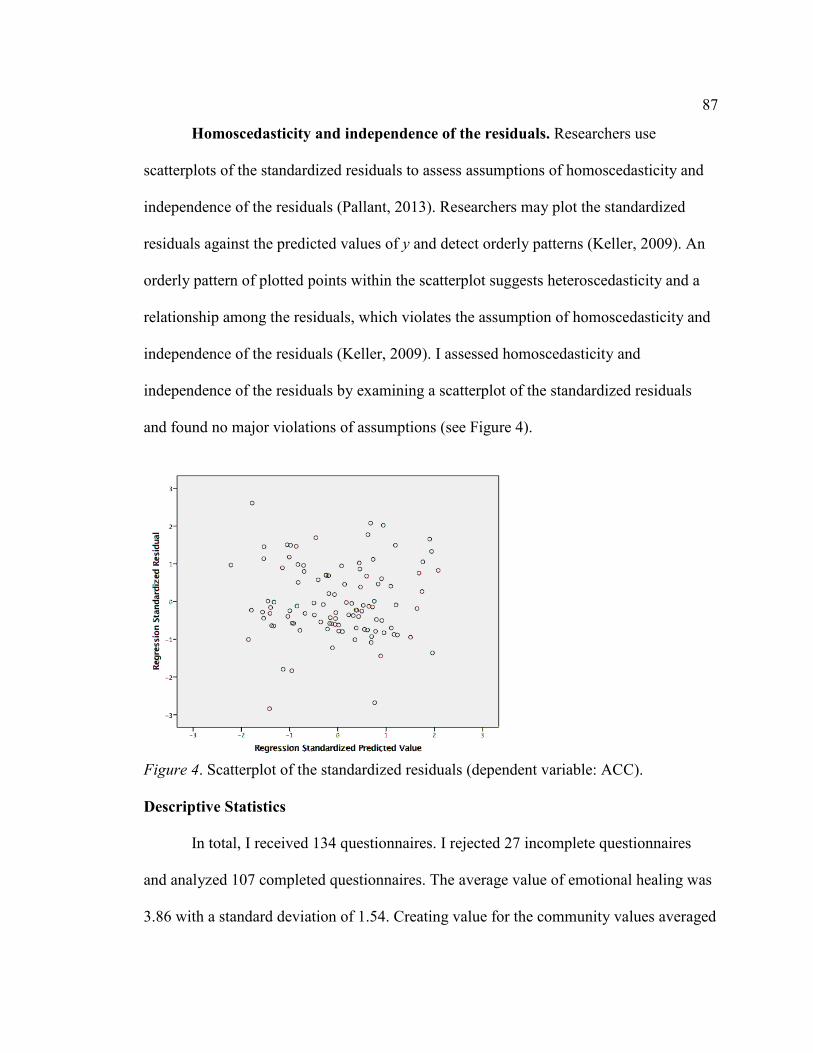
87
Homoscedasticity and independence of the residuals. Researchers use
scatterplots of the standardized residuals to assess assumptions of homoscedasticity and
independence of the residuals (Pallant, 2013). Researchers may plot the standardized
residuals against the predicted values of y and detect orderly patterns (Keller, 2009). An
orderly pattern of plotted points within the scatterplot suggests heteroscedasticity and a
relationship among the residuals, which violates the assumption of homoscedasticity and
independence of the residuals (Keller, 2009). I assessed homoscedasticity and
independence of the residuals by examining a scatterplot of the standardized residuals
and found no major violations of assumptions (see Figure 4).
Figure 4. Scatterplot of the standardized residuals (dependent variable: ACC).
Descriptive Statistics
In total, I received 134 questionnaires. I rejected 27 incomplete questionnaires
and analyzed 107 completed questionnaires. The average value of emotional healing was
3.86 with a standard deviation of 1.54. Creating value for the community values averaged
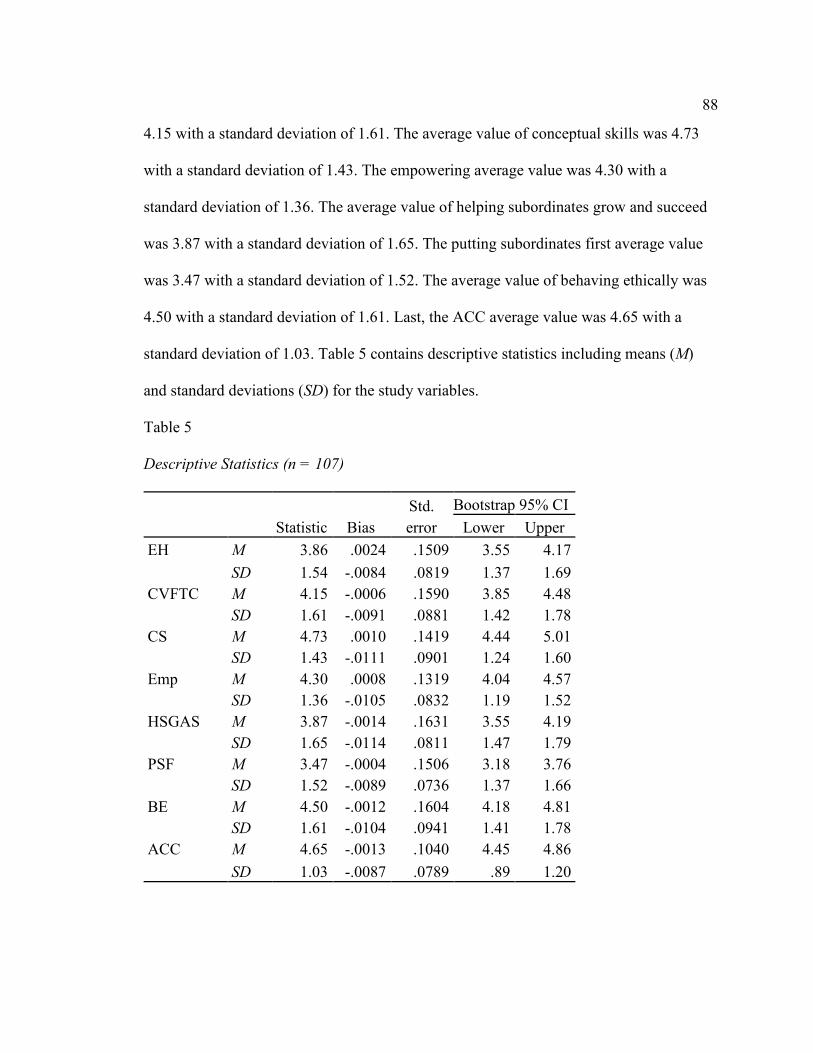
88
4.15 with a standard deviation of 1.61. The average value of conceptual skills was 4.73
with a standard deviation of 1.43. The empowering average value was 4.30 with a
standard deviation of 1.36. The average value of helping subordinates grow and succeed
was 3.87 with a standard deviation of 1.65. The putting subordinates first average value
was 3.47 with a standard deviation of 1.52. The average value of behaving ethically was
4.50 with a standard deviation of 1.61. Last, the ACC average value was 4.65 with a
standard deviation of 1.03. Table 5 contains descriptive statistics including means (M)
and standard deviations (SD) for the study variables.
Table 5
Descriptive Statistics (n = 107)
Statistic Bias
Std.
error
Bootstrap 95% CI
Lower Upper
EH M 3.86 .0024 .1509 3.55 4.17
SD 1.54 -.0084 .0819 1.37 1.69
CVFTC M 4.15 -.0006 .1590 3.85 4.48
SD 1.61 -.0091 .0881 1.42 1.78
CS M 4.73 .0010 .1419 4.44 5.01
SD 1.43 -.0111 .0901 1.24 1.60
Emp M 4.30 .0008 .1319 4.04 4.57
SD 1.36 -.0105 .0832 1.19 1.52
HSGAS M 3.87 -.0014 .1631 3.55 4.19
SD 1.65 -.0114 .0811 1.47 1.79
PSF M 3.47 -.0004 .1506 3.18 3.76
SD 1.52 -.0089 .0736 1.37 1.66
BE M 4.50 -.0012 .1604 4.18 4.81
SD 1.61 -.0104 .0941 1.41 1.78
ACC M 4.65 -.0013 .1040 4.45 4.86
SD 1.03 -.0087 .0789 .89 1.20

89
Inferential Results
I conducted an MLR to examine the relationship between employee perception of
their FLM’s servant leadership dimensions and employee ACC in a U.S. manufacturing
firm. The independent variables were (a) conceptual skills, (b) empowering, (c) helping
subordinates grow and succeed, (d) putting subordinates first, (e) behaving ethically, (f)
emotional healing, and (g) creating value for the community. The dependent variable was
employee ACC. I assessed the assumptions associated with MLR regarding (a)
multicollinearity, (b) outliers, (c) normality, (d) linearity, (e) homoscedasticity, and (f)
independence of the residuals, and noted no major violations.
I used a standard MLR, α = 0.05 (two-tailed), to examine the relationship between
independent and dependent variables. When researchers use an alpha value of α = .05,
they will reject the null hypothesis if the significance level, also called the p-value, is less
than 0.05 (Nimon & Oswald, 2013). The results for the MLR were not significant, F(7,
107) = .714, p = .660, R2 = 0.048, indicating that the linear combination of employee
perceptions of their FLM’s (a) conceptual skills, (b) empowering, (c) helping
subordinates grow and succeed, (d) putting subordinates first, (e) behaving ethically, (f)
emotional healing, and (g) creating value for the community did not significantly predict
employee ACC (Table 6). Because the significance p-value of the model was greater than
0.05 (p = .660), I failed to reject the null hypothesis.

90
Table 6
Model Summary With Dependent Variable Affective
Commitment to Change
Model R R square
Adjusted R
square
Std. error of
the estimate
1 .219 .048 -.019 1.05502
Table 7
Analysis of Variance
Model
Sum of
squares df
Mean
square F Sig.
1 Regression 5.567 7 .795 .714 .660
Residual 110.195 99 1.113
Total 115.761 106
The R2 value represents the percent of the variance in the dependent variable that
the linear combination of predictor variables explains (Green & Salkind, 2011). A value
of 0 means there is no relationship and a value of 1 represents a perfect linear relationship
(Green & Salkind, 2011). However, because the significance p-value of the model was
greater than 0.05 (p = .660) and I failed to reject the null hypothesis, the R2 (0.048) value
is not statistically relevant in this model. Additionally, the significance p-values for each
independent variable were greater than 0.05, indicating that none of the independent
variables significantly predicted employee ACC.
Beta weights indicate an expected increase or decrease in the dependent variable
if the independent variable increases or decreases by one standard deviation (Nathans et
al., 2012). Each independent variable corresponds to a unique beta weight that may be
rank ordered to, on the surface, rank variable importance in accounting for variance in the
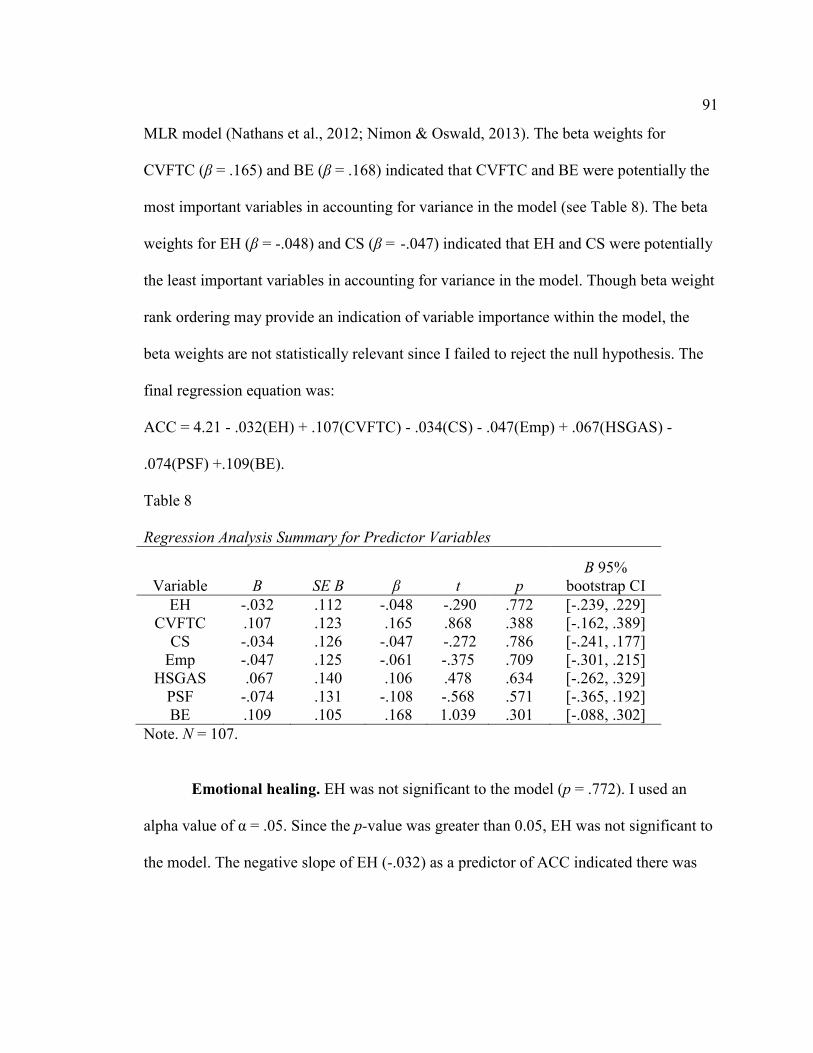
91
MLR model (Nathans et al., 2012; Nimon & Oswald, 2013). The beta weights for
CVFTC (β = .165) and BE (β = .168) indicated that CVFTC and BE were potentially the
most important variables in accounting for variance in the model (see Table 8). The beta
weights for EH (β = -.048) and CS (β = -.047) indicated that EH and CS were potentially
the least important variables in accounting for variance in the model. Though beta weight
rank ordering may provide an indication of variable importance within the model, the
beta weights are not statistically relevant since I failed to reject the null hypothesis. The
final regression equation was:
ACC = 4.21 - .032(EH) + .107(CVFTC) - .034(CS) - .047(Emp) + .067(HSGAS) -
.074(PSF) +.109(BE).
Table 8
Regression Analysis Summary for Predictor Variables
Variable Β SE Β β t p
B 95%
bootstrap CI
EH -.032 .112 -.048 -.290 .772 [-.239, .229]
CVFTC .107 .123 .165 .868 .388 [-.162, .389]
CS -.034 .126 -.047 -.272 .786 [-.241, .177]
Emp -.047 .125 -.061 -.375 .709 [-.301, .215]
HSGAS .067 .140 .106 .478 .634 [-.262, .329]
PSF -.074 .131 -.108 -.568 .571 [-.365, .192]
BE .109 .105 .168 1.039 .301 [-.088, .302]
Note. N = 107.
Emotional healing. EH was not significant to the model (p = .772). I used an
alpha value of α = .05. Since the p-value was greater than 0.05, EH was not significant to
the model. The negative slope of EH (-.032) as a predictor of ACC indicated there was
92
approximately a .032 decrease in ACC for each one-point increase in EH. However, EH
did not significantly predict ACC, so the negative slope is not statistically relevant.
Creating value for the community. CVFTC was not significant to the model (p
= .388). I used an alpha value of α = .05. Since the p-value was greater than 0.05, CVFTC
was not significant to the model. The positive slope of CVFTC (.107) as a predictor of
ACC indicated there was approximately a .107 increase in ACC for each one-point
increase in CVFTC. However, CVFTC did not significantly predict ACC, so the positive
slope is not statistically relevant.
Conceptual skills. CS was not significant to the model (p = .786). I used an alpha
value of α = .05. Since the p-value was greater than 0.05, CS was not significant to the
model. The negative slope of CS (-.034) as a predictor of ACC indicated there was
approximately a .034 decrease in ACC for each one-point increase in CS. However, CS
did not significantly predict ACC, so the negative slope is not statistically relevant.
Empowering. Empowering was not significant to the model (p = .709). I used an
alpha value of α = .05. Since the p-value was greater than 0.05, empowering was not
significant to the model. The negative slope of empowering (-.047) as a predictor of ACC
indicated there was approximately a .047 decrease in ACC for each one-point increase in
empowering. However, empowering did not significantly predict ACC, so the negative
slope is not statistically relevant.
Helping subordinates grow and succeed. HSGAS was not significant to the
model (p = .634). I used an alpha value of α = .05. Since the p-value was greater than
0.05, HSGAS was not significant to the model. The positive slope of HSGAS (.067) as a

93
predictor of ACC indicated there was approximately a .067 increase in ACC for each
one-point increase in HSGAS. However, HSGAS did not significantly predict ACC, so
the positive slope is not statistically relevant.
Putting subordinates first. PSF was not significant to the model (p = .571). I
used an alpha value of α = .05. Since the p-value was greater than 0.05, PSF was not
significant to the model. The negative slope of PSF (-.074) as a predictor of ACC
indicated there was approximately a .074 decrease in ACC for each one-point increase in
PSF. However, PSF did not significantly predict ACC, so the negative slope is not
statistically relevant.
Behaving ethically. BE was not significant to the model (p = .301). I used an
alpha value of α = .05. Since the p-value was greater than 0.05, PSF was not significant to
the model. The positive slope of BE (.109) as a predictor of ACC indicated there was
approximately a .109 increase in ACC for each one-point increase in BE. However, BE
did not significantly predict ACC, so the positive slope is not statistically relevant.
Analysis summary. The purpose of this quantitative study was to examine the
relationship between employee perception of their FLM’s servant leadership dimensions
and employee ACC. I used standard MLR to examine the ability of employee perceptions
of their FLM’s (a) conceptual skills, (b) empowering, (c) helping subordinates grow and
succeed, (d) putting subordinates first, (e) behaving ethically, (f) emotional healing, and
(g) creating value for the community to predict employee ACC. I found no major
violations of assumptions associated with MLR analysis. The model as a whole was not
able to significantly predict employee ACC, F(7, 107) = .714, p = .660, R2 = 0.048.

94
Additionally, none of the independent variables significantly predicted employee ACC.
My conclusion from this analysis is that employee perceptions of their FLM’s (a)
conceptual skills, (b) empowering, (c) helping subordinates grow and succeed, (d) putting
subordinates first, (e) behaving ethically, (f) emotional healing, and (g) creating value for
the community does not significantly predict employee ACC.
The study results indicated that there was no relationship between employee
perceptions of their FLM’s servant leadership dimensions and employee ACC. Findings
from this study were not consistent with findings from two similar studies. Kool and van
Dierendonck (2012) found a positive, weak relationship between servant leadership and
commitment to change. Gowdy (2015) published his dissertation after the proposal stage
of this study and also found a positive, weak relationship between servant leadership and
commitment to change. Gowdy examined the relationship between servant leadership and
ACC in a nonprofit human service agency and found that the composite score of servant
leadership behaviors accounted for 5.1% of the variance in ACC, indicating that servant
leadership weakly predicted ACC in this setting. It is possible that findings from my
study did not replicate previous findings because I used a different instrument to measure
servant leadership and the participants of the study were from a different industry.
Analysis of the data indicated that none of the servant leadership dimensions
significantly predicted employee ACC in the participant’s manufacturing setting. Servant
leadership is a multidimensional construct yet few researchers have investigated servant
leadership using multiple dimensions (Liden et al., 2015). Therefore, there is little context
in the available research to assist in interpreting study results. Additionally, there is no
95
universally accepted instrument used to measure servant leadership (van Dierendonck,
2011). The lack of a consistent measurement tool adds to researcher difficulty when
investigating servant leadership outcomes (Parris & Peachey, 2013). Last, I found no
information available regarding previously investigated relationships between servant
leadership dimensions and commitment to change, nor other outcomes of servant
leadership dimensions in a manufacturing context. As a result, this study may provide
multidimensional context for future servant leadership research efforts in the
manufacturing industry.
Empirical research does not exist on the efficacy of servant leadership in
manufacturing organizations or similar fast-paced environments despite the increasing
popularity of servant leadership among Fortune 500 organizations (Parris & Peachey,
2013). Researchers postulate that servant leaders can inspire positive employee behaviors
such as commitment to change (Kool & van Dierendonck, 2012). Servant leaders focus
on satisfying the needs of their followers, thereby encouraging a reciprocal relationship
where employees feel obligated to commit to the leader’s requests (Kool & van
Dierendonck, 2012). Researchers identified numerous positive outcomes of servant
leadership across varied industries, but researchers also have concerns regarding the
efficacy of servant leadership in specific settings.
Researchers have expressed concerns over the efficacy of servant leadership in
fast-paced or turbulent environments (Boone & Makhani, 2013). Boone and Makhani
postulated that the positive benefits of servant leadership might diminish in high-
pressure, fast-paced settings, and van Dierendonck et al. (2014) similarly stated that
96
servant leadership might work better in static environments. Additionally, employee
literacy rates are often low in fast-paced manufacturing organizations, which complicates
employee-focused leadership strategies (Sterling & Boxall, 2013). The existing literature
is not clear on the efficacy of servant leadership in manufacturing.
Since contrasting researcher views exist on the efficacy of servant leadership in
manufacturing or fast-paced settings, and no empirical evidence exists on outcomes of
servant leadership in a manufacturing environment, further research is needed to
understand if results from this study differ from previous studies because the industry
sampled. Business leaders can interpret study results as there being no significant
relationship between servant leadership and employee ACC in a manufacturing
environment. However, the practice of servant leadership does not correlate with an
increase or decrease in employee ACC and poses no risk to employee commitment levels.
Business leaders may use this interpretation to improve the effective practice of business
as servant leadership may have other positive benefits within manufacturing
organizations without affecting commitment to change levels. Separate studies may be
needed to better understand the relationships between servant leadership and other
employee outcomes in a manufacturing setting.
Despite insignificant findings, investigating servant leadership as a
multidimensional construct improved clarity in understanding the relationship between
employee perceptions of their FLM’s servant leadership dimensions and employee ACC.
When researchers investigate bivariate relationships between servant leadership and an
outcome variable, it remains unclear which aspects or dimensions of servant leadership

97
contribute to the bivariate relationship (Liden et al., 2015). This occurs because servant
leadership is composed of multiple dimensions, yet often investigated as a single
dimension to improve researcher ease of data collection and analysis (Liden et al., 2015).
Results from this study indicated that none of the servant leadership dimensions predicted
employee ACC. However, results contain more clarity regarding the insignificant
findings than if I had only included servant leadership as a singular construct or variable.
Researchers and business leaders are increasingly interested in how FLMs
influence employee commitment to change because commitment to change represents the
behavioral support needed for change initiatives to succeed (Morin et al., 2015).
Researchers and business leaders may turn to alternative leadership theories to identify
leadership styles that significantly predict commitment to change. Increased probabilities
of change initiative success would improve effective business practice and reduce costs
of implementing change. Researchers consistently found positive relationships between
transformational leadership and commitment to change (Abrell-Vogel & Rowold, 2014;
Tyssen et al., 2014). Researchers found that transformational leadership positively
influenced the employee ACC needed for change initiatives to succeed across industries
(Abrell-Vogel & Rowold, 2014; Tyssen et al., 2014). However, more research is needed
to identify if the positive relationship between transformational leadership and
commitment to change remains significant in a manufacturing context.
Applications to Professional Practice
I collected survey data from hourly employees in a manufacturing firm to better
understand the relationship between employee perception of their FLM’s servant
98
leadership dimensions and employee ACC. Participants completed questionnaires on
servant leadership dimensions of their FLMs and self-rated ACC by answering survey
questions. Findings from this study extended existing knowledge of both servant
leadership and ACC. In my review of the literature, this is the third study where the
researcher investigated the relationship between servant leadership and commitment to
change, and the first study to do so in a manufacturing context.
High organizational change failure rates negatively affect business organizations.
Organizational competitiveness and survival depend on the ability of organizations to
manage change successfully (Holt & Vardaman, 2013). Both researchers and business
leaders historically underemphasized the importance of FLMs in delivering change
(Nielsen, 2013), and researchers are increasingly interested in how FLMs influence
employees to engage in positive change behaviors such as commitment to change (Evans,
2015). Results from this study apply to professional practice by indicating that employee
perceptions of their FLM’s servant leadership dimensions do not significantly predict
employee ACC in a manufacturing context. Manufacturing leaders should not expect the
practice of FLM servant leadership to improve employee commitment to change levels.
Some manufacturing leaders do not know the relationship between employee
perceptions of their FLM’s servant leadership dimensions and employee ACC. In my
review of the literature, I found little information regarding the efficacy of servant
leadership in manufacturing settings. De Sousa and van Dierendonck (2014) suggested
that FLMs practicing servant leadership during periods of change drove positive change
behaviors and encouraged engagement in the change process, while Boone and Makhani

99
(2013) expressed doubts regarding the efficacy of servant leadership in fast-paced or
turbulent environments such as manufacturing. Kool and van Dierendonck (2012) and
Gowdy (2015) both found that servant leadership was positively yet weakly related to
commitment to change. However, no evidence previously existed on the relationship
between servant leadership and commitment to change in a manufacturing context.
Previous research findings supported that I would expect employee perceptions of their
FLM’s servant leadership dimensions to influence or partially explain employee ACC in
a manufacturing context. However, I found no support for this expectation.
Implications for Social Change
The present study has implications for social change despite insignificant results.
The implications for positive social change include the potential to enhance
manufacturing leaders’ understanding and support for servant leadership. Employees
often incur adverse psychological impacts such as increased anxiety and uncertainty
during periods of change (Michela & Vena, 2012). Servant leadership positively affects
employees during periods of change by sustaining motivations and reducing anxieties
associated with change (de Sousa & van Dierendonck, 2014). Servant leadership may
lead to reduced employee anxiety and uncertainty during periods of change (Michela &
Vena, 2012). Though I found no statistically significant relationship between employee
perceptions of their FLM’s servant leadership dimensions and employee ACC in
manufacturing firms, FLMs may practice servant leadership to retain benefits associated
with servant leadership without negatively affecting employee ACC.

100
Despite insignificant results in this study, researchers previously identified
positive benefits of servant leadership across varied industries. In their empirical reviews
of the literature, Parris and Peachey (2013) and van Dierendonck (2011) identified
positive outcomes associated with servant leadership as increased organizational trust,
team and employee effectiveness, organizational citizenship behavior, collaboration,
follower well-being, organizational commitment, positive work climate, job satisfaction
and decreased turnover. Servant leaders focus on employee well-being and fulfilling
follower needs (Liden et al., 2015). Most recently, Chiniara and Bentein (2016) found
that fulfilling basic psychological needs mediated the relationship between servant
leadership and employee performance. Though results of this study were insignificant,
organizations may benefit from other positive outcomes of servant leadership such as
improved employee performance while better fulfilling employees needs and
psychological well-being.
Recommendations for Action
Several recommendations for manufacturing leaders in the United States follow
from this study and are based on both my research experience in this program and the
results of this study. The findings from this study indicated that there was no significant
relationship between servant leadership and employee ACC in a manufacturing context
despite previous researchers finding significant relationships between these variables in
other industries. In my review of the literature, I found little research regarding the
efficacy of servant leadership in manufacturing. Manufacturing leaders should allow
researchers into their facilities to conduct additional research regarding servant leadership
101
in manufacturing to improve understanding of potential benefits of servant leadership in
this setting.
FLMs are in a unique position to influence employee behaviors as they spend the
most time with employees (Evans, 2015). Manufacturing leaders should be aware of the
importance of FLMs within their organizations and the effects they have on the
employees they lead. Manufacturing leaders should also be aware of previously found
positive benefits of servant leadership that not only lead to positive outcomes benefitting
the organization, but also improve employee well-being (Michela & Vena, 2012) and
employee feelings of inclusiveness within the organization (Gotsis & Grimani, 2016).
Once manufacturing leaders better understand the importance of FLMs and outcomes of
servant leadership in their organizations, they can implement leadership development
programs that encourage the servant leadership behaviors that positively influence
desired outcomes such as employee commitment to change.
Manufacturing leaders may also benefit from increased knowledge of how to
improve upon high change initiative failure rates. Change initiative failure rates remain as
high as 90% (Cândido & Santos, 2015). Commitment to change represents the employee
support needed for organizational changes to work (Abrell-Vogel & Rowold, 2014).
Therefore, manufacturing leaders should educate themselves on how FLMs influence
behaviors such as commitment to change to improve better upon high change failure
rates.
For scholars, there is a need to expand research to further analyze outcomes of
servant leadership in a manufacturing environment. Researchers are increasingly
102
interested in servant leadership theory (Gotsis & Grimani, 2016). However, in my review
of the literature, there is little research regarding the efficacy and outcomes of servant
leadership in a manufacturing environment. Scholars interested in the potential benefits
and outcomes of servant leadership may improve understanding of the efficacy of servant
leadership in manufacturing through expanding servant leadership research into the
manufacturing industry.
I may disseminate the results of this study through peer-reviewed publication and
presentation at conferences. I intend to submit to and publish findings of this study in one
the following scholarly journals, (a) Journal of Organizational Change Management, (b)
Journal of Change Management, (c) Academy of Management Journal, and (d) The
Leadership Quarterly. I intend to submit my findings to the Greenleaf Center for Servant
Leadership, the Spears Center for Servant Leadership, and the National Association of
Manufacturers. I will offer to present my findings at future conferences or symposiums
affiliated with these organizations.
Recommendations for Further Research
Further studies could examine other outcomes of servant leadership in a
manufacturing context. In this study, I examined only one outcome of servant leadership
in a manufacturing setting. Study findings were not consistent with previous research
findings on the relationship between servant leadership and commitment to change. The
dynamics between servant leadership and outcomes variables may be different in fast-
paced industries such as manufacturing.

103
The sample size of the present research was relatively small, and further research
efforts would benefit from a larger sample size. I used a power of .80 to calculate a
sample size of 103 and accepted a 20% probability of failing to reject a false null
hypothesis. I recommend increasing the sample size to 203 to increase the power to .99,
resulting in a 1% probability of failing to reject a false null hypothesis.
There were several limitations in this study future research efforts can address.
First, I included only participants from a single occupational group and single
organization, which limited the generalizability of results. Second, I did not measure
FLMs’ self-rated perceptions of servant leadership dimensions. Future research efforts
could include a comparison of FLM self-rated servant leadership dimension scores to
employee-perceived FLM servant leadership dimension scores. Third, I did not measure
FLM’s ACC as a control variable. FLMs exhibiting high levels of ACC may influence
their employees to exhibit high levels of ACC (Bouckenooghe et al., 2014). Researchers
could examine whether FLM levels of ACC moderate the relationship between servant
leadership and employee ACC.
Reflections
The doctoral research process was an exciting, difficult, and exhausting
experience. I had never conducted original research before this program and the
experience of reviewing the literature and focusing on a single topic helped me to learn
and hone new skill sets. I learned to think more critically, acknowledge biases, and better
take constructive criticism. I learned to balance the rigors of the doctoral process with
104
familial and career obligations, and improved my time management skills to do so
effectively.
This program has changed the way I think. The doctoral process has changed the
way I think about how knowledge is gained and how I interpret study results. I learned
how to conduct research in this program and feel more confident in critically interpreting
research methods and results. By researching FLMs in the manufacturing industry, I
gained valuable insight that accelerated my ability to manage FLMs within my
manufacturing organization. I hope that my research will help other manufacturing
leaders better understand the importance of FLMs and introduce servant leadership
theory within their organizations.
Summary and Study Conclusions
Previous researchers examined the relationship between servant leadership and
commitment to change (Gowdy, 2015; Kool & van Dierendonck, 2012), but neither
focused on the manufacturing industry. Employee commitment to change is significantly
related to change initiative success and is a strong indicator of the employee support
needed for organizational changes to work (Abrell-Vogel & Rowold, 2014). Improved
change leadership efforts may focus on increasing employee commitment levels towards
organizational change to increase the probability of change initiative success.
Improved change leadership is needed in manufacturing because manufacturing
organizations must change frequently. In the last year of available data, there were 3,944
mass manufacturing layoff actions in the United States alone (Bureau of Labor Statistics,
2013), representing significant change efforts in these firms. Using an MLR, I examined
105
the relationship between employee perceptions of their FLM’s servant leadership
dimensions and employee ACC in a manufacturing context. Study results indicated that
the linear combination of employee-perceived servant leadership dimensions comprising
the construct of servant leadership did not significantly predict employee ACC, so I failed
to reject the null hypothesis.
I recommend continued investigation of the relationship between servant
leadership and employee outcomes in manufacturing, as I found limited research in this
context during my review of the literature. As business leaders increase support for
servant leadership theory, additional research is needed to examine and explore the
effects of servant leadership in varied industries. Manufacturing leaders experiencing
high change failure rates should additionally support future research on how their FLMs
can positively affect employee change behaviors to increase probabilities of change
initiative success.

106
References
Abrell-Vogel, C., & Rowold, J. (2014). Leaders’ commitment to change and their
effectiveness in change - A multilevel investigation. Journal of Organizational
Change Management, 27, 900-921. doi:10.1108/JOCM-07-2012-0111
Acharya, A., Prakash, A., Saxena, P., & Nigam, A. (2013). Sampling: Why and how of
it? Indian Journal of Medical Specialties, 4, 330-333. doi:10.7713/ijms.2013.0032
Alagaraja, M., & Egan, T. (2013). The strategic value of HRD in lean strategy
implementation. Human Resource Development Quarterly, 24, 1-27.
doi:10.1002/hrdq.21155
Alasadi, R., & Askary, S. (2014). Employee involvement and the barriers to
organizational change. International Journal of Information, Business and
Management, 6, 29-51. Retrieved from http://ijibm.elitehall.com
Allen, N. J., & Meyer, J. P. (1990). The measurement and antecedents of affective,
continuance and normative commitment to the organization. Journal of
Occupational Psychology, 63, 1-18. doi:10.1111/j.2044-8325.1990.tb00506.x
Arghode, V. (2012). Qualitative and quantitative research: Paradigmatic differences.
Global Education Journal, 4, 155-163. Retrieved from
http://www.franklinpublishing.net/globaleducation.html
Bambale, A. J. (2014). Relationship between servant leadership and organizational
citizenship behaviors: Review of literature and future research directions. Journal
of Marketing & Management, 5, 1-16. Retrieved from http://gsmi-ijmm.com

107
Barbuto, J. E., Gottfredson, R. K., & Searle, T. P. (2014). An examination of emotional
intelligence as an antecedent of servant leadership. Journal of Leadership &
Organizational Studies, 24, 315-323. doi:10.1177/1548051814531826
Barends, E., Janssen, B., ten Have, W., & ten Have, S. (2014). Difficult but doable:
Increasing the internal validity of organizational change management studies.
Journal of Applied Behavioral Science, 50, 50-54.
doi:10.1177/0021886313515614
Barton, S. J., Crozier, S. R., Lillycrop, K. A., Godfrey, K. M., & Inskip, H. M. (2013).
Correction of unexpected distributions of P values from analysis of whole genome
arrays by rectifying violation of statistical assumptions. BMC Genomics, 14, 1-9.
doi:10.1186/1471-2164-14-161
Basford, T. E. (2014). Supervisor transgressions: A thematic analysis. Leadership &
Organization Development Journal, 35, 79-97. doi:10.1108/lodj-03-2012-0041
Bateh, J., Castaneda, M. E., & Farah, J. E. (2013). Employee resistance to organizational
change. International Journal of Management & Information Systems, 17, 113-
116. Retrieved from www.cluteinstitute.com
Battistelli, A., Montani, F., Odoardi, C., Vandenberghe, C., & Picci, P. (2014).
Employees’ concerns about change and commitment to change among Italian
organizations: The moderating role of innovative work behavior. International
Journal of Human Resource Management, 25, 951-978.
doi:10.1080/09585192.2013.809012

108
Beck, C. (2014). Antecedents of servant leadership: A mixed methods study. Journal of
Leadership & Organizational Studies, 21, 299-314.
doi:10.1177/1548051814529993
Bernerth, J. B., Walker, H. J., & Harris, S. G. (2011). Change fatigue: Development and
initial validation of a new measure. Work & Stress, 25, 321-337.
doi:10.1080/02678373.2011.634280
Bernerth, J. B., Walker, H. J., Walker, F., & Hirschfeld, R. R. (2011). A study of
workplace justice differences during times of change: It’s not all about me. The
Journal of Applied Behavioral Science, 47, 336-359.
doi:10.1177/0021886311404929
Boone, L. W., & Makhani, S. (2013). Five necessary attitudes of a servant leader.
Review of Business, 33, 83-96. Retrieved from http://www.stjohns.edu
Botsford Morgan, W., & King, E. B. (2012). Mothers’ psychological contracts: Does
supervisor breach explain intention to leave the organization? Human Resource
Management, 51, 629-649. doi:10.1002/hrm.21492
Bouckenooghe, D. (2012). The role of organizational politics, contextual resources, and
formal communication on change recipients’ commitment to change: A multilevel
study. European Journal of Work and Organizational Psychology, 21, 575-602.
doi:10.1080/1359432X.2011.591573
Bouckenooghe, D., De Clercq, D., & Deprez, J. (2014). Interpersonal justice, relational
conflict, and commitment to change: The moderating role of social interaction.
Applied Psychology, 63, 509-540. doi:10.1111/apps.12006

109
Bouckenooghe, D., Schwarz, G. M., & Minbashian, A. (2015). Herscovitch and Meyer’s
three-component model of commitment to change: Meta-analytic findings.
European Journal of Work and Organizational Psychology, 24, 578-595.
doi:10.1080/1359432X.2014.963059
Bower, A. B., & Maxham III, J. G. (2012). Return shipping policies of online retailers:
Normative assumptions and the long-term consequences of fee and free returns.
Journal of Marketing, 76, 110-124. doi:10.1509/jm.10.0419
Brewster, C., Gollan, P. J., & Wright, P. M. (2013). Guest editors' note: Human resource
management and the line. Human Resource Management, 52, 829-838.
doi:10.1002/hrm.21594
Bureau of Labor Statistics. (2013). Economic News Release. Retrieved from
http://www.bls.gov/news.release/mmls.t01.htm
Cândido, C. J. F., & Santos, S. P. (2015). Strategy implementation: What is the failure
rate? Journal of Management & Organization, 21, 237-262.
doi:10.1017/jmo.2014.77
Castillo-Page, L., Bodilly, S., & Bunton, S. A. (2012). AM last page: Understanding
qualitative and quantitative research paradigms in academic medicine. Academic
Medicine, 87, 386. doi:10.1097/ACM.0b013e318247c660
Caruth, G. D. (2013). Demystifying mixed methods research design: A review of the
literature. Mevlana International Journal of Education, 3, 112-122.
doi:10.13054/mije.13.35.3.2
110
Chan, S., & Mak, W. (2014). The impact of servant leadership and subordinates'
organizational tenure on trust in leader and attitudes. Personnel Review, 43, 272-
287. doi:10.1108/PR-08-2011-0125
Chang, T., & Vowles, N. (2013). Strategies for improving data reliability for online
surveys: A case study. International Journal of Electronic Commerce Studies, 4,
121-129. doi:10.7903/ijecs.1121
Chiniara, M., & Bentein, K. (2016). Linking servant leadership to individual
performance: Differentiating the mediating role of autonomy, competence and
relatedness need satisfaction. Leadership Quarterly, 27, 124-141.
doi:10.1016/j.leaqua.2015.08.004
Claxton, J. (2014). How do I know I am valued? Journal of Workplace Learning, 26,
188-201. doi:10.1108/JWL-02-2014-0013
Cohen, J. (1992). A power primer. Psychological Bulletin, 112, 155-159.
doi:10.1037/0033-2909.112.1.155
Davies, N. (2013). Visible leadership: Going back to the front line. Nursing Management
- UK, 20, 22-26. doi:10.7748/nm2013.07.20.4.22.e1086
De Clercq, D., Bouckenooghe, D., Raja, U., & Matsyborska, G. (2014). Servant
leadership and work engagement: The contingency effects of leader–follower
social capital. Human Resource Development Quarterly, 25, 183-212.
doi:10.1002/hrdq.21185

111
De Sousa, M. C., & Van Dierendonck, D. (2014). Servant leadership and engagement in
a merge process under high uncertainty. Journal of Organizational Change
Management, 27, 877-899. doi:10.1108/JOCM-07-2013-0133
Decker, P., Durand, R., Mayfield, C. O., McCormack, C., Skinner, D., & Perdue, G.
(2012). Predicting implementation failure in organizational change. Journal of
Organizational Culture, Communications & Conflict, 16, 39-59. Retrieved from
http://www.alliedacademies.org
Dermol, V., & Cater, T. (2013). The influence of training and training transfer factors on
organizational learning and performance. Personnel Review, 42, 324-348.
doi:10.1108/0048381311320435
Drzensky, F., Egold, N., & Van Dick, R. (2012). Ready for a change? A longitudinal
study of antecedents, consequences and contingencies of readiness for change.
Journal of Change Management, 12, 95-111. doi:10.1080/14697017.2011.652377
Edgar, F., Geare, A., & O'Kane, P. (2015). The changing dynamic of leading knowledge
workers. Employee Relations, 37, 487-503. doi:10.1108/ER-06-2014-0068
Ertürk, A. (2012). Linking psychological empowerment to innovation capability:
Investigating the moderating effect of supervisory trust. International Journal of
Business and Social Science, 3, 153-165. Retrieved from http://ijbssnet.com/
Evans, S. (2015). Juggling on the line. Employee Relations, 37, 459-474.
doi:10.1108/ER-06-2014-0066

112
Fast, N. J., Burris, E. R., & Bartel, C. A. (2014). Managing to stay in the dark:
Managerial self-efficacy, ego defensiveness, and the aversion to employee voice.
Academy of Management Journal, 57, 1013-1034. doi:10.5465/amj.2012.0393
Faul, F., Erdfelder, E., Buchner, A., & Lang, A. G. (2009). Statistical power analyses
using G*Power 3.1: Tests for correlation and regression analyses. Behavior
Research Methods, 41, 1149-1160. doi:10.3758/brm.41.4.1149
Gabriele, S., & Chiaravalloti, F. (2013). Using the meteorological information for the
regional rainfall frequency analysis: An application to Sicily. Water Resources
Management, 27, 1721-1735. doi:10.1007/s11269-012-0235-6
Gelaidan, H. M., & Ahmad, H. (2013). The factors effecting employee commitment to
change in public sector: Evidence in Yemen. International Business Research,
6(3), 75-87. doi:10.5539/ibr.v6n3p75
Golden-Biddle, K. (2013). How to change an organization without blowing it up. MIT
Sloan Management Review, 54(2), 35-41. Retrieved from
http://sloanreview.mit.edu
Gotsis, G., & Grimani, K. (2016). The role of servant leadership in fostering inclusive
organizations. Journal of Management Development, 35, 985-1010.
doi:10.1108/JMD-07-2015-0095
Gover, L., & Duxbury, L. (2012). Organizational faultlines: Social identity dynamics and
organizational change. Journal of Change Management, 12, 53-75.
doi:10.1080/14697017.2011.652375
113
Gowdy, D. T. (2015). Serving change: Understanding the efficacy of servant leader
behaviors to influence follower commitment to organizational change (Doctoral
dissertation). Available from ProQuest Dissertations and Theses database. (UMI
No. 3742928)
Green, S., & Salkind, N. (2011). Using SPSS for Windows and Macintosh: Analyzing and
understanding data. Upper Saddle River, NJ: Pentice Hall.
Greenleaf, R. K. (1977). Servant leadership: A journey into the nature of legitimate
power and greatness. New York, NY: Paulist Press.
Gregory, B. T., Osmonbekov, T., Gregory, S. T., Albritton, M. D., & Carr, J. C. (2013).
Abusive supervision and citizenship behaviors: Exploring boundary conditions.
Journal of Managerial Psychology, 28, 628-644. doi:10.1108/jmp-10-2012-0314
Harper, S. (2012). The leader coach: A model of multi-style leadership. Journal of
Practical Consulting, 4, 22-31. Retrieved from http://www.regent.edu
Herscovitch, L., & Meyer, J. P. (2002). Commitment to organizational change: Extension
of a three-component model. Journal of Applied Psychology, 87, 474-487.
doi:10.1037/0021-9010.87.3.474
Holt, D. T., & Vardaman, J. M. (2013). Toward a comprehensive understanding of
readiness for change: The case for an expanded conceptualization. Journal of
Change Management, 13, 9-18. doi:10.1080/14697017.2013.768426
Hunt, B. (2011). Publishing qualitative research in counseling journals. Journal of
Counseling & Development, 89, 296-300. doi:10.1002/j.1556-
6678.2011.tb00092.x

114
Hunter, E. M., Neubert, M. J., Perry, S. J., Witt, L. A., Penney, L. M., & Weinberger, E.
(2013). Servant leaders inspire servant followers: Antecedents and outcomes for
employees and the organization. Leadership Quarterly, 24, 316-331.
doi:1016/j.leaqua.2012.12.001
Jing, R., Xie, J. L., & Ning, J. (2014). Commitment to organizational change in a Chinese
context. Journal of Managerial Psychology, 29, 1098-1114. doi:10.1108/JMP-08-
2011-0042
Kandola, D., Banner, D., O’Keefe-McCarthy, S., & Jassal, D. (2014). Sampling methods
in cardiovascular nursing research: An overview. Canadian Journal of
Cardiovascular Nursing, 24, 15-18. Retrieved from https://www.cccn.ca
Keller, G. (2009). Statistics for management and economics. Mason, OH: South-Western
Centage learning.
Khan, S. (2014). Qualitative research method: Grounded theory. International Journal of
Business and Management, 9, 224-233. doi:10.5539/ijbm.v9n11p224
Kilroy, J., & Dundon, T. (2015). The multiple faces of front line managers. Employee
Relations, 37, 410-427. doi:10.1108/ER-06-2014-0071
Klarner, P., & Raisch, S. (2013). Move to the beat--Rhythms of change and firm
performance. Academy of Management Journal, 56, 160-184.
doi:10.5465/amj.2010.0767
Kool, M., & Van Dierendonck, D. (2012). Servant leadership and commitment to change,
the mediating role of justice and optimism. Journal of Organizational Change
Management, 25, 422-433. doi:10.1108/09534811211228139
115
Koopman, J., Howe, M., Hollenbeck, J. R., & Sin, H. P. (2015). Small sample mediation
testing: Misplaced confidence in bootstrapped confidence intervals. Journal of
Applied Psychology, 100, 194-202. doi:10.1037/a0036635
Leedy, P. D., & Ormrod, J. E. (2013). Practical research: Planning and design (10th
ed.). Upper Saddle River, NJ: Pearson.
Liden, R. C., Wayne, S. J., Liao, C., & Meuser, J. D. (2014). Servant leadership and
serving culture: Influence on individual and unit performance. Academy of
Management Journal, 57, 1434-1452. doi:10.5465/amj.2013.0034
Liden, R. C., Wayne, S. J., Meuser, J. D., Hu, J., Wu, J., & Liao, C. (2015). Servant
leadership: Validation of a short form of the SL-28. The Leadership Quarterly,
26, 254-269. doi:10.1016/j.leaqua.2014.12.002
Liden, R. C., Wayne, S. J., Zhao, H., & Henderson, D. (2008). Servant leadership:
Development of a multidimensional measure and multi-level assessment. The
Leadership Quarterly, 10, 161-177. doi:10.1016/j.leaqua.2008.01.006
Lin, W., Wang, L., & Chen, S. (2013). Abusive supervision and employee well-being:
The moderating effect of power distance orientation. Applied Psychology: An
International Review, 62, 308-329. doi:10.1111/j.1464-0597.2012.00520.x
Mackay, R., & Chia, R. (2013). Choice, chance, and unintended consequences in
strategic change: A process understanding of the rise and fall of Northco
Automotive. Academy of Management Journal, 56, 208-230.
doi:10.5465/amj.2010.0734
116
Mangundjaya, W. H. (2015). People or trust in building commitment to change? Journal
of Developing Areas, 49, 67-78. doi:10.1353/jda.2015.0050
Martin, W. E., & Bridgmon, K. D. (2012). Research methods for the social sciences,
volume 42: Quantitative and statistical research methods: From hypothesis to
results. San Francisco, CA: John Wiley & Sons.
Maurer, R. (2011). Why most changes fail. Journal for Quality & Participation, 34(2),
17-18. Retrieved from http://asq.org/pub/jqp/
McClean, E. J., Burris, E. R., & Detert, J. R. (2013). When does voice lead to exit? It
depends on leadership. Academy of Management Journal, 56, 525-548.
doi:10.5465/amj.2011.0041
Mejia-Morelos, J. H., Grima, F., & Trepo, G. (2013). Change and stability interaction
processes in SMEs: A comparative case study. Journal of Organizational Change
Management, 26, 370-422. doi:10.1108/09534811311328407
Michela, J. L., & Vena, J. (2012). A dependence-regulation account of psychological
distancing in response to major organizational change. Journal of Change
Management, 12, 77-94. doi:10.1080/14697017.2011.652376
Michel, A., By, R. T., & Burnes, B. (2013). The limitations of dispositional resistance in
relation to organizational change. Management Decision, 51, 761-780.
doi:10.1108/00251741311326554
Montani, F., Odoardi, C., & Battistelli, A. (2012). Explaining the relationships among
supervisor support, affective commitment to change, and innovative work

117
behavior: The moderating role of coworker support. Bollettino di Psicologia
Applicata, 264, 43-57. Retrieved from http://www.giuntios.it/riviste_boll.jsp
Morin, A. J., Meyer, J. P., Belanger, E., Boudrias, J., Gagne, M., & Parker, P. D. (2015).
Longitudinal associations between employees’ beliefs about the quality of the
change management process, affective commitment to change and psychological
empowerment. Human Relations, 68, 1-19. doi:10.1177/0018726715602046
Nathans, L. L., Oswald, F. L., & Nimon, K. (2012). Interpreting multiple linear
regression: A guidebook of variable importance. Practical Assessment, Research
& Evaluation, 17(9), 1-19. Retrieved from pareonline.net
Nesterkin, D. (2013). Organizational change and psychological reactance. Journal of
Organizational Change Management, 26, 573-594.
doi:10.1108/09534811311328588
Nielsen, K. (2013). Review article: How can we make organizational interventions work?
Employees and line managers as actively crafting interventions. Human
Relations, 66, 1029-1050. doi:10.1177/0018726713477164
Nimon, K. F., & Oswald, F. L. (2013). Understanding the results of multiple linear
regression beyond standardized regression coefficients. Organizational Research
Methods, 16, 650-674. doi:10.1177/1094428113493929
Onwuegbuzie, A. J., Johnson, R. B., & Collins, K. M. T. (2009). Call for mixed analysis:
A philosophical framework for combining qualitative and quantitative
approaches. International Journal of Multiple Research Approaches, 3, 114-139.
doi:10.5172/mra.3.2.114

118
Palanski, M., Avey, J., & Jiraporn, N. (2014). The effects of ethical leadership and
abusive supervision on job search behaviors in the turnover process. Journal of
Business Ethics, 121, 135-146. doi:10.1007/s10551-013-1690-6
Pallant, J. (2013). SPSS survival manual: A step by step guide to data analysis using
SPSS (5th ed.). Crows Nest, NSW: Allen & Unwin.
Pardo-del-Val, M., Martínez-Fuentes, C., & Roig-Dobón, S. (2012). Participative
management and its influence on organizational change. Management Decision,
50, 1843-1860. doi:10.1108/00251741211279639
Parris, D. L., & Peachey, J. W. (2013). A systematic literature review of servant
leadership theory in organizational contexts. Journal of Business Ethics, 113, 377-
393. doi:10.1007/s10551-012-1322-6
Pederson, L. S., Dresdow, S., & Benson, J. (2013). Significant tasks in training of job-
shop supervisors. Journal of Workplace Learning, 25, 23-36.
doi:10.1108/13665621311288467
Peterson, S. J., Galvin, B. M., & Lange, D. (2012). CEO servant leadership: Exploring
executive characteristics and firm performance. Personnel Psychology, 65, 565-
596. doi:10.1111/j.1744-6570.2012.01253.x
Pritchard, K., & Bloomfield, E. (2014). Tackling the challenges of leading through
change. Strategic HR Review, 13, 16-19. doi:10.1108/SHR-07-2013-0075
Rachmawati, A. W., & Lantu, D. C. (2014). Servant leadership theory development &
measurement. Procedia - Social and Behavioral Sciences, 115, 387-393.
doi:10.1016/j.sbspro.2014.02.445

119
Rafferty, A. E., Jimmieson, N. L., & Armenakis, A. A. (2013). Change readiness: A
multilevel review. Journal of Management, 39, 110-135.
doi:10.1177/0149206312457417
Rothermel, R., & LaMarsh, J. (2012). Managing change through employee
empowerment. Global Business & Organizational Excellence, 31(2), 17-23.
doi:10.1002/joe.21411
Semper, S. (2011). Labor-management collaboration ensures sustainable change at
MillerCoors. Global Business & Organizational Excellence, 30(5), 35-44.
doi:10.1002/joe.20393
Seo, M., Taylor, M. S., Hill, N. S., Zhang, X., Tesluk, P. E., & Lorinkova, N. M. (2012).
The role of affect and leadership during organizational change. Personnel
Psychology, 65, 121-165. doi:10.1111/j.1744-6570.2011.01240.x
Sharif, M. M., & Scandura, T. A. (2014). Do perceptions of ethical conduct matter during
organizational change? Ethical leadership and employee involvement. Journal of
Business Ethics, 124, 185-196. doi:10.1007/s10551-013-1869-x
Sharkawi, S., Abdul Rahman, A. R., & Azuradahalan, N. (2013). Relationship between
person organization fit, psychological contract violation on counterproductive
work behaviour. International Journal of Business and Social Science, 4, 174-
183. Retrieved from http://ijbssnet.com/
Shin, J., Taylor, M., & Seo, M. (2012). Resources for change: The relationships of
organizational inducements and psychological resilience to employees' attitudes

120
and behaviors toward organizational change. Academy of Management Journal,
55, 727-748. doi:10.5465/amj.2010.0325
Sinan, A., & Alkan, B. B. (2015). A useful approach to identify the multicollinearity in
the presence of outliers. Journal of Applied Statistics, 42, 986-993.
doi:10.1080/02664763.2014.993369
Smet, A., Lavoie, J., & Hioe, E. (2012). Developing better change leaders. Mckinsey
Quarterly, 2, 98-104. Retrieved from http://www.mckinsey.com/insights
Sousa-Lima, M., Michel, J. W., & Caetano, A. (2013). Clarifying the importance of trust
in organizations as a component of effective work relationships. Journal of
Applied Social Psychology, 43, 418-427. doi:10.1111/j.1559-1816.2013.01012.x
Sterling, A., & Boxall, P. (2013). Lean production, employee learning and workplace
outcomes: A case analysis through the ability-motivation-opportunity framework.
Human Resource Management Journal, 23, 227-240. doi:10.1111/1748-
8583.12010
Stonehouse, D. (2012). Resistance to change: The human dimension. British Journal of
Healthcare Assistants, 6, 456–457. doi:10.12968/bjha.2012.6.9.456
Tabachnick, B. G., & Fidell, L. S. (2013). Using Multivariate Statistics. New Jersey:
Pearson Education, Inc.
Tamariz, L., Palacio, A., Robert, M., & Marcus, E. N. (2013). Improving the informed
consent process for research subjects with low literacy: A systematic review.
Journal of General Internal Medicine, 28, 121-126. doi:10.1007/s11606-012-
2133-2

121
Toterhi, T., & Recardo, R. J. (2012). Managing change: Nine common blunders-and how
to avoid them. Global Business & Organizational Excellence, 31, 54-69.
doi:10.1002/joe.21438
Townsend, K., & Loudoun, R. (2015). The front-line manager’s role in informal voice
pathways. Employee Relations, 37, 475-486. doi:10.1108/ER-06-2014-0060
Townsend, K., & Russell, B. (2013). Investigating the nuances of change in front-line
managers' work. Labour & Industry, 23, 168-181.
doi:10.1080/10301763.2013.820683
Tyssen, A. K., Wald, A., & Heidenreich, S. (2014). Leadership in the context of
temporary organizations: A study on the effects of transactional and
transformational leadership on followers’ commitment in projects. Journal of
Leadership & Organizational Studies, 21, 376-393.
doi:10.1177/1548051813502086
Umlas, J. W. (2013). Grateful leadership: Using the power of acknowledgment to engage
all your people and achieve superior results. Canadian Manager, 38(2), 18-20.
Retrieved from http://www.cim.ca
Uprichard, E. (2013). Sampling: Bridging probability and non-probability designs.
International Journal of Social Research Methodology, 16, 1–11.
doi:10.1080/13645579.2011.633391
Van Dierendonck, D. (2011). Servant leadership: A review and synthesis. Journal of
Management, 37, 1228-1261. doi:10.1177/0149206310380462

122
Van Dierendonck, D., Stam, D., Boersma, P., De Windt, N., & Alkema, J. (2014). Same
difference? Exploring the differential mechanisms linking servant leadership and
transformational leadership to follower outcomes. The Leadership Quarterly, 25,
544-562. doi:10.1016/j.leaqua.2013.11.014
Venkatesh, V., Brown, S. A., & Bala, A. (2013). Bridging the qualitative-quantitative
divide: Guidelines for conducting mixed methods research in information
systems. MIS Quarterly, 37, 21-54. Retrieved from www.misq.org
Ward, P., Clark, T., Zabriskie, R., & Morris, T. (2012). Paper/pencil versus online data
collection: An exploratory study. Journal of Leisure Research, 44, 507-530.
Retrieved from http://js.sagamorepub.com/jlr
Weigold, A., Weigold, I. K., & Russell, E. J. (2013). Examination of the equivalence of
self-report survey-based paper-and-pencil and Internet data collection methods.
Psychological Methods, 18, 53-70. doi:10.1037/a0031607
Whalen, T. B. (2014). Utilizing the social transaction theory of social ontology to
understand organizational culture change. Journal of Business & Economics
Research, 12(1), 37-42. Retrieved from www.cluteinstitute.com
Yilmaz, K. (2013). Comparison of quantitative and qualitative research traditions:
Epistemological, theoretical, and methodological differences. European Journal
of Education, 48, 311-325. doi:10.1111/ejed.12014
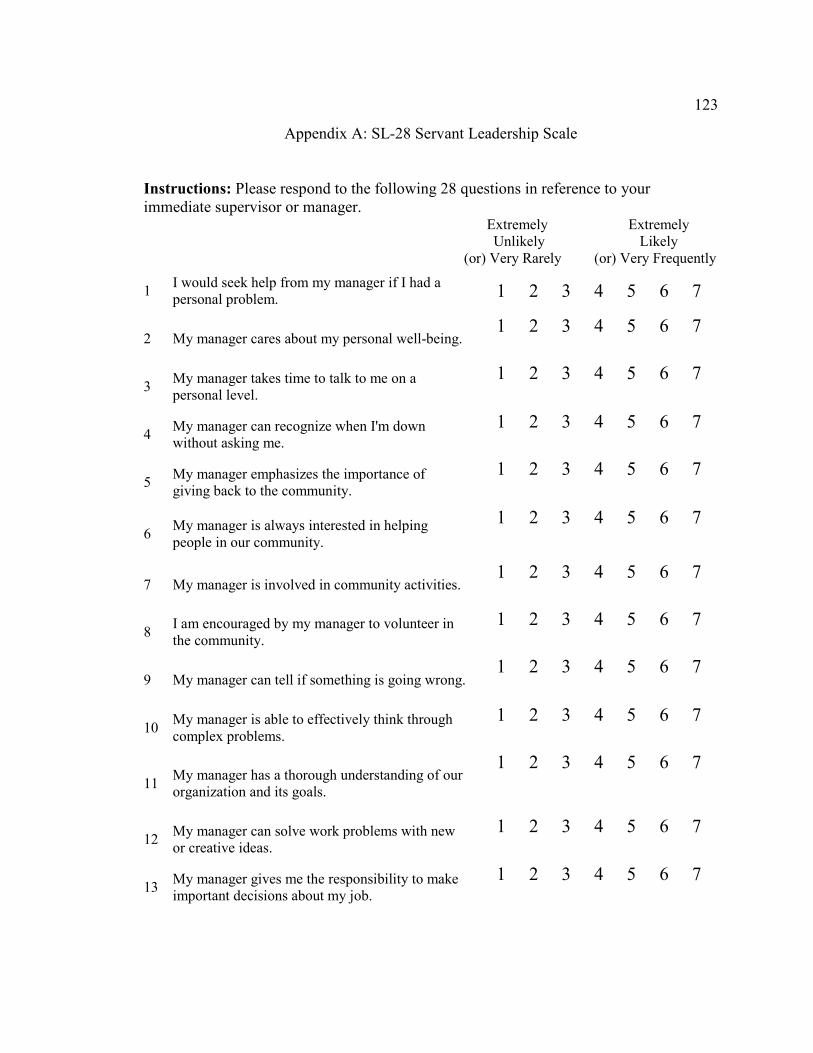
123
Appendix A: SL-28 Servant Leadership Scale
Instructions: Please respond to the following 28 questions in reference to your
immediate supervisor or manager. Extremely Extremely
Unlikely Likely
(or) Very Rarely (or) Very Frequently
1 I would seek help from my manager if I had a
personal problem. 1 2 3 4 5 6 7
2 My manager cares about my personal well-being. 1 2 3 4 5 6 7
3 My manager takes time to talk to me on a
personal level.
1 2 3 4 5 6 7
4 My manager can recognize when I'm down
without asking me.
1 2 3 4 5 6 7
5 My manager emphasizes the importance of
giving back to the community.
1 2 3 4 5 6 7
6 My manager is always interested in helping
people in our community.
1 2 3 4 5 6 7
7 My manager is involved in community activities. 1 2 3 4 5 6 7
8 I am encouraged by my manager to volunteer in
the community.
1 2 3 4 5 6 7
9 My manager can tell if something is going wrong. 1 2 3 4 5 6 7
10 My manager is able to effectively think through
complex problems.
1 2 3 4 5 6 7
11 My manager has a thorough understanding of our
organization and its goals.
1 2 3 4 5 6 7
12 My manager can solve work problems with new
or creative ideas.
1 2 3 4 5 6 7
13 My manager gives me the responsibility to make
important decisions about my job.
1 2 3 4 5 6 7

124
14 My manager encourages me to handle important
work decisions on my own.
1 2 3 4 5 6 7
15
My manager gives me the freedom to
handle difficult situations in the way that I
feel is best.
1 2 3 4 5 6 7
16
When I have to make an important
decision at work, I do not have to consult
my manager first.
1 2 3 4 5 6 7
17 My manager makes my career
development a priority.
1 2 3 4 5 6 7
18 My manager is interested in making sure
that I achieve my career goals.
1 2 3 4 5 6 7
19
My manager provides me with work
experiences that enable me to develop
new skills.
1 2 3 4 5 6 7
20 My manager wants to know about my
career goals.
1 2 3 4 5 6 7
21 My manager seems to care more about
my success than his/her own.
1 2 3 4 5 6 7
22 My manager puts my best interests ahead
of his/her own.
1 2 3 4 5 6 7
23 My manager sacrifices his/her own
interests to meet my needs.
1 2 3 4 5 6 7
24 My manager does what she/he can do to
make my job easier.
1 2 3 4 5 6 7
25 My manager holds high ethical standards.
1 2 3 4 5 6 7
26 My manager is always honest.
1 2 3 4 5 6 7

125
27 My manager would not compromise ethical
principles in order to achieve success.
1 2 3 4 5 6 7
28 My manager values honesty more than profits.
1 2 3 4 5 6 7
Survey used with permission from Liden, R. C., Wayne, S.J., Zhao, H., &
Henderson, D. (2008). Servant leadership: Development of a multidimensional measure
and multi-level assessment. The Leadership Quarterly, 10, 161-177.
doi:10.1016/j.leaqua.2008.01.006
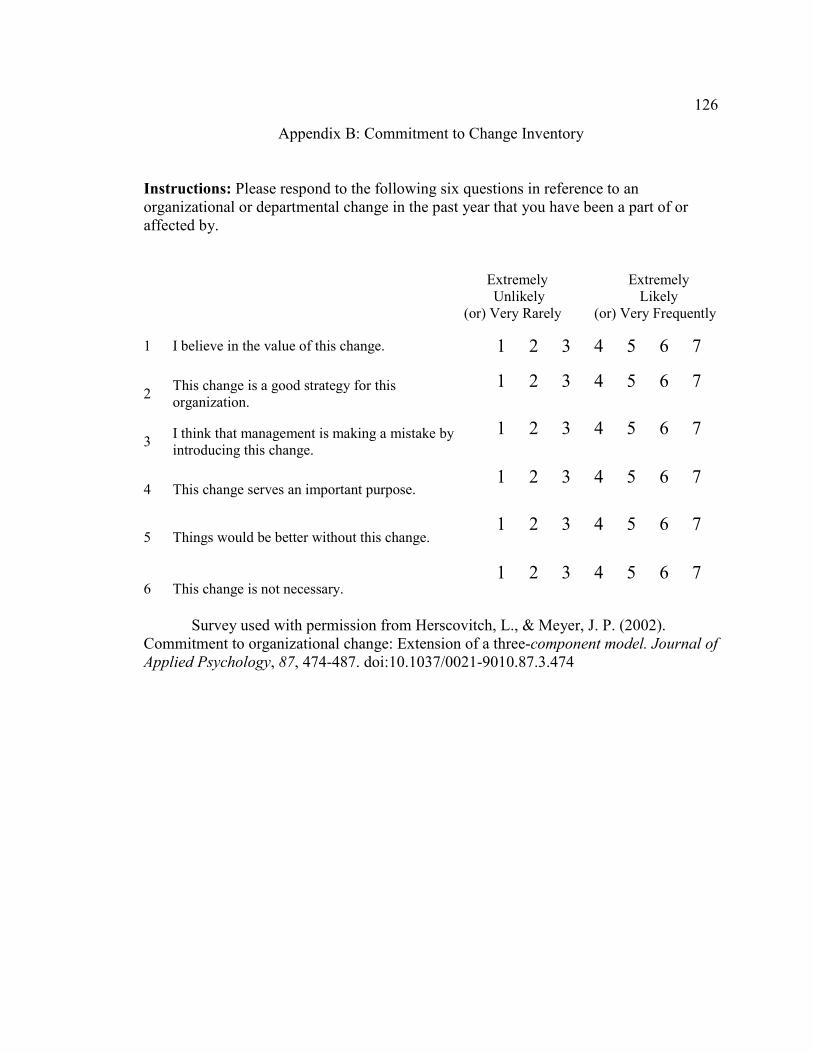
126
Appendix B: Commitment to Change Inventory
Instructions: Please respond to the following six questions in reference to an
organizational or departmental change in the past year that you have been a part of or
affected by.
Extremely Extremely
Unlikely Likely
(or) Very Rarely (or) Very Frequently
1 I believe in the value of this change. 1 2 3 4 5 6 7
2 This change is a good strategy for this
organization.
1 2 3 4 5 6 7
3 I think that management is making a mistake by
introducing this change.
1 2 3 4 5 6 7
4 This change serves an important purpose. 1 2 3 4 5 6 7
5 Things would be better without this change. 1 2 3 4 5 6 7
6 This change is not necessary. 1 2 3 4 5 6 7
Survey used with permission from Herscovitch, L., & Meyer, J. P. (2002).
Commitment to organizational change: Extension of a three-component model. Journal of
Applied Psychology, 87, 474-487. doi:10.1037/0021-9010.87.3.474
127
Appendix C: Instruments Use Request
3/25/16, 11:24 AMWalden University M ail - Survey Inst rument Use
Page 1 of 2ht tps:/ /mail.google.com/mail/ u/ 1/?ui=2&ik=838f9dcb91&view=pt&…=153a1405c42d2917&siml=153a1405c42d2917&siml=153a3e937db45df3
jeffrey schulkers <[email protected]>
Survey Instrument Use2 messages
jeffrey schulkers <[email protected]> Tue, Mar 22, 2016 at 9:14 PMTo: [email protected]
Dr. Liden,
I request permission to use your 28-item servant leadership scale (SL-28) in my doctoral study. I am conducting aquantitative correlational inquiry through the Walden University DBA program. I intend to use the seven servantleadership dimensions measured by your SL-28 instrument as the predictor variables in this study. The outcomevariable is affective commitment to change. I also request permission to reproduce the SL-28 in my final doctoralstudy.
Thanks you for your time,
Jeff Schulkers
Bob Liden <[email protected]> Wed, Mar 23, 2016 at 9:38 AMTo: jeffrey schulkers <[email protected]>
Robert C. Liden

128

129
Appendix D: Email to Participate in Survey
Email Subject: Request to Complete Doctoral Study Survey
Dear employee name of Organization Name,
My name is Jeffrey Schulkers. I am a student at the School of Management at Walden
University and have previously worked in food manufacturing as a front-line manager. I
am conducting a research study as part of the requirements of my Doctor of Business
Administration degree, and request permission from your organization to include some of
your employees as participants.
I am researching servant leadership dimensions of front-line managers in manufacturing
and whether a relationship exists between these dimensions and commitment to
organizational changes. If your organization decides to participate, I will conduct a site
visit to administer a questionnaire to hourly employees. They will be asked to
acknowledge an informed consent form and rank a response via a seven-point Likert-type
scale to 34 survey questions. The survey will take approximately 10 minutes to complete.
Participation is confidential and no personally identifiable information will be asked on
the survey.
Taking part in the study is discretionary. Participants may choose to quit at any time prior
to submission. There are no ramifications for not completing the survey. If you have any
questions regarding the survey, you may contact me at [email protected].
Your participation may help manufacturing leaders realize benefits of servant leadership.
Servant leadership may foster reciprocal relationships that increase employee willingness
to engage is positive organizational behaviors such as increased commitment to changes.
Thank you for your consideration. If you would like to participate, please begin by
responding with the completed letter of permission and we will be in contact to arrange a
site visit at your best convenience.
Thank You,
Jeffrey Schulkers

130
Appendix E: National Institutes of Health Certificate of Completion
Certificate of Completion
The National Institutes of Health (NIH) Office of Extramural Research certifies thatJeffrey Schulkers successfully completed the NIH Web-based training course"Protecting Human Research Participants".
Date of completion: 05/17/2013.
Certification Number: 1181607.