
Sert II 1980 Extended Flight Thruster Experiments
28
NASA Technical Memorandum 81685 (NASA~TH-81685) SERT II 1980 EXTENDED N8 1-19222 FLIGHT TUROSTER EXPEHIfl£NTS (NASA) 27 p HC A03/MF A01 CSCL 21c Onelas G3/20 41728 \ Sert II 1980 Extended Flight Thruster Experiments W. R. Kerslake and L. R. Ignaczak Lewis Research Center Cleveland, Ohio Prepared for the Fifteenth International Electric Propulsion Conference cosponsored by the American Institute of Aeronautics and Astronautics, the Japan Society for Aeronautical and Space Sciences, and Deutsche Gesselschaft fur Luft- und Raumfahrt Las Vegas, Nevada, April 21-23, 1981 NASA https://ntrs.nasa.gov/search.jsp?R=19810010695 2018-01-31T16:41:04+00:00Z
Transcript of Sert II 1980 Extended Flight Thruster Experiments

NASA Technical Memorandum 81685
(NASA~TH-81685) SERT II 1980 EXTENDED N8 1-19222FLIGHT TUROSTER EXPEHIfl£NTS (NASA) 27 pHC A03/MF A01 CSCL 21c
OnelasG3/20 41728
\
Sert II 1980 Extended FlightThruster Experiments
W. R. Kerslake and L. R. IgnaczakLewis Research CenterCleveland, Ohio
Prepared for theFifteenth International Electric Propulsion Conferencecosponsored by the American Institute of Aeronautics and Astronautics,the Japan Society for Aeronautical and Space Sciences,and Deutsche Gesselschaft fur Luft- und RaumfahrtLas Vegas, Nevada, April 21-23, 1981
NASA
https://ntrs.nasa.gov/search.jsp?R=19810010695 2018-01-31T16:41:04+00:00Z

SERT II 1980 EXTENDED" FLIGHT THRUSTER EXPERIMENTS
by W. R. Kerslake and L.-R. Ignaczak
National Aeronautics and Space AdministrationLewis Research CenterCleveland, Ohio 44135
Abstract
. The SERT II spacecraft, launched in 1970, hasbeen maintained in an operational, but inter-mittent status since 1971. This paper presentsthe flight results obtained from mid 1979 throughDecember 1980. Near continuous solar power in1979 and 1980 has enabled long periods of thrusterendurance testing. Three of four propellant tankshave been exhausted with no significant change inthruster system operation before being empty. Anew plasma mode thrust has been characterized anddirect thrust measurements obtained. Other tests,including beam neutralization by various neutral-izer sources, give insight to electron conductionacross plasmas in space and provide a basis tomodel neutralization of thruster arrays.
Introduction
The Space Electric Rocket Test II (SERT II)spacecraft was launched in 1970 with a primaryobjective of demonstrating long-term operation ofa space electric thruster system*-. Progresstowards that objective was completed late in 1970when each of two ion thruster systems on boarddeveloped a high-voltage grid short. The continu-ing functional state of the spacecraft has per-mitted an expansion of the original scope of mis-sion to include demonstration of ion thrustersystem space storage, restartability, and steadystate operation"?, and the study of plasma effluxbetween two thruster system^. These added testswere possible since the spacecraft returned to acontinuous sunlight orbit on January 11, 1979 andContinuous power is available to perform testingunti1 April 1981 (est.).
This paper presents the results of SERT IIexperiments conducted in the period of mid 1979 toDecember 1980. These results include: (1) veri-fication of flow rates measured on earth in vacuumtanks with flow rates measured on board SERT II;(2) thruster system operating characteristics(startup or steady state) remained stable duringthis operation; (3) indentification of a plasmathrust mode (H.V. off) of the discharge chamberand obtaining direct thrust measurements of thismode;,(4) operating an ion beam while emittingneutralizing electrons from various sources; and(5). operating an ion thruster with no on-boardneutralizer emitter.
During the period of December 1980 to April1981, thruster system 2 is planned for plasma modeoperation to obtain further discharge chamberendurance operation and exhaust the main propel-,lant tank to obtain confirmation of its flowrate. In April 1981, the spacecraft orbit willenter an era of partial shadowing for eight years(except October-November 1981). In 1989 continu-ous sunlight orbits would again occur. No planspresently exist for any spacecraft testing pastApril 1981.
Nomenclature
1 current, mAn-j ion plasma density, ions/cm^Neut neutralizerMain main discharge of thrusterS/A solar 'arrayS/C spacecraftSupply 4 main dischargeSupply 5 screen (beam) current (i.e., 2-15
is beam current of T/S-2)Supply 6 accel gridSupply 7 neut keeperSupply 9 neut biasSupply 10 main keeperT/S-1 thruster system 1T/S-2 thruster system 2V voltage, v\/5 space plasma potential
(assumed = zero v)
Apparatus and Procedure
The SERT II spacecraft is shown in Fig. 1.It consists of an Agena stage rocket with a 1.5-kWsolar array on one end and two experimental ionthruster systems on the opposite end. Further'description of the spacecraft and its operationmay be found in Refs. 2 to 4. A thruster systemcontains an ion thruster together with Hg-loadedpropellant tanks mounted on gimbals. A thrusterpower conditioning and control box is locatedinside the spacecraft body. Each thruster systemhas a hot-wire probe that can be swept through theion exhaust beam and measure its plasma potentialprofile. The following sections describe thishardware and operating conditions in detail.
Thruster Systems
The steady-state SERT II thruster operationat various times since 1970 is summarized in Ref.2 and Table 1 and 2. The information below givesnormal thruster operation applicable to the dataof this paper. The two thruster systems wereidentical in electrical and mechanical design.
T/S-1. - Data were attained with'thisthruster completely off, with the neutralizerdischarge only lit, and with both the main andneutralizer discharges lit. Figure 2 shows aschematic wiring diagram of thruster power sup-plies and solar array. Various set points ofoperation may be found in data tables of thispaper. The screen (1-V5) to accel grid (I-V6) .short developed in 1970 remains, and preventedthese supplies from turning on without currentoverload. The telemetry current return to S/Cground, however, remains functional when the sup-plies are off. The 15 current reads electronreturn to S/C ground or ions leaving the thrust-er. If a net flow of electrons should leave thethruster, the 15 current would read zero. The 16current reads electrons flowing from S/C ground tothe accel grid due to ion impingement. If a net

flow of electrons should strike the accel grid,the 16 current would read zero. With the V6 sup-ply turned off, the impedance to electrons flowingfrom S/C ground through the supply causes theaccel grid to become 10 v. positive for 0.1 mAcurrent, 29 v. positive for 6 mA, and 47 v. posi-tive for 22 mA.
T/S-2. - For the tests described herein, thebeam current of thruster 2 was maintained at 85*3mA or 200*3 mA by closed-loop control. The screenvoltage was 3000 v and the accel grid was -1500 v.for 85 mA beam. The data tables give operatingvalues of other parameters, such as when T/S-2 wasoperated in a plasma thruster mode (H.V. off, maindischarge on.)
V9 bias supply. - The V9 supply was designedto place a bias voltage between the neutralizercathode and S/C ground. In addition to zero volt-age, there are four nominal bias voltages: ±25 vand ± 50 v. The common of the bias supply isconnected to S/C ground and the output then drivesthe neutralizer cathode either (+) or (-) withrespect to the S/C frame. The bias voltages weregenerated by flowing current across a zener diodestack with voltage magnitude and polarity changesmade by a command switching network. .Current toproduce negative bias was produced internallywithin the supply, but neutralizer emission cur-rent was required to produce positive bias. Attimes, when there was little or no neutralizeremission, the nominal positive V9 voltage did notappear on the neutralizer. The 19 telemetry reademitted electron current from S/C ground throughthe neutralizer cathode to space plasma. If elec-tron flow was in the opposite direction, 19 tele-metry would read zero.
Hot-Wire Probes
The SERT II spacecraft was designed withthree hot-wire emissive probes to measure plasmapotentials^. One probe, which burned out in1971, was at the end of a 1.5-meter long beamprotruding ahead of the S/C body. The other -twoprobes were each at the end of an arm that rotated
ion beam. The two beam3. Beam probe 1-was
jammed and remained stationary in a position fullyaway from the beam center, but was electricallyoperative. The probe voltages listed in tablesare data as received from the S/C and are relativeto S/C frame. All plasma potentials shown onfigures are relative to space plasma potentialwhich is assumed zero.
Beam probe 2 functioned normally. When com-manded, it began rotating and was heated at thesame time. The telemetry system sampled the probepotential reading every 4 seconds. Fifty secondswere required to make one sweep. Possible probereading positions are shown in Fig. 3. As the"probe-on" command and telemetry sampling timeswere not synchronized the positions of readingsare not always those shown in Fig. 3. One sam-pling, however, must always occur in the ionbeam. Micro switches stop, reverse sweep direc-tion,- and turn off the probe^at each end oftravel, leaving an arc of 60° not traversed by theprobe 2 sweep. Further details of probe operationmay be found in Ref. 3 or 5.
it into and out of eachprobes are shown in Fig.
Solar Array
Description and 1979 performance curves forthe SERT II main solar array (S/A) are presentedin Ref. 2. The 1430-W (beginning of life, BOL)array was degraded to about 63 percent of BOL"maximum power and this power limit prevented crossneutralization operation at ion beam currentsgreater than 85 mA. For all tests the negativeside of the S/A was connected to S/C ground. S/Aoperating voltages are listed in Table 2 and thesmall voltage variation is due to load change andvoltage degradation.
The solar array was loaded to maximum powerseveral times in 1980. These tests showed, withindata accuracy (±2 percent), little change fromdate taken in 1979 (2). This is to be expectedfrom a solar array that has been in orbit over 10years and was on the "flat" portion of ,its degra-dation curve.
Telemetry Data Accuracy
All S/C data is in the form of 0 to 63counts, but each parameter has its own scale fac-tor. The list below give the value of 1 countchange in each parameter. The uncertainty is ±0.5count. Some of the values in Table 2 fall betweencounts due to a time averaging of the data. Thereis also uncertainty in the data of Table 2 due tothe updating sequence of the telemetry. For exam-ple, 15 and 16 update every 30 seconds, but 19 andV9 update only once per minute. The probe volt-ages update every 4 seconds.
Spacecraft Telemetry Values
Parametern;1619V9V10
Probe voltage-S/A
1-Count value5~~mA0.05 mA7 mA2 v0.52.4 v1.5 v
Results and Discussion
Ion Beam Thrusting
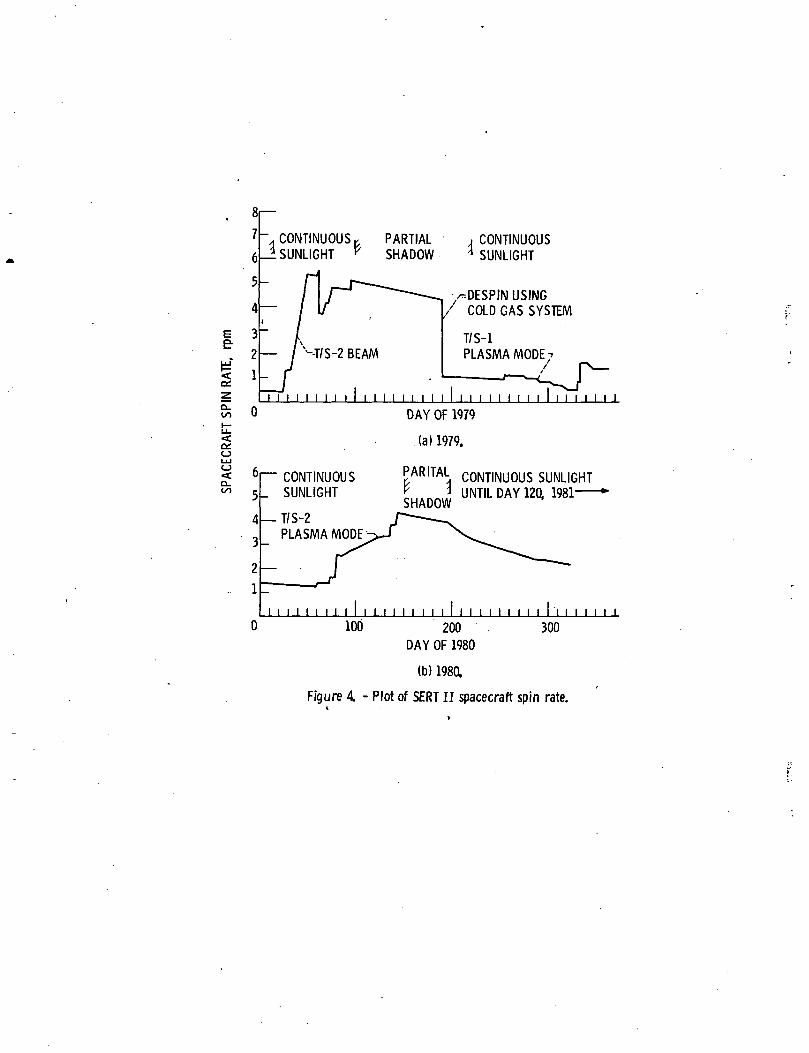
A summary of operating hours for both thrust-er systems is presented in Table 1. Table 2 pre-sents representative values of detailed operatingparameters of T/S-2 (thruster system 2). T/S-2was operated 42 times in 1979-80 for a total of606 hours at 85 mA beam and 58 hours at 200 mAbeam. Solar array maximum power limits, asanticipated, prevented operation-at 250 mA beamfor more than a few seconds during each of fourattempts. T/S-2 thrust data taken in 1980 agreedwith that measured in 1979 and that measured in1970; i.e., 10 mN at 85 mA beam and 22 mN at 200mA beam. Experimental accuracy was-±3 percent for85 mA beam and ±1.5 percent for 200 mA beam.These thrust values were measured from the result-ing changes in spacecraft spin rate data, such as,shown in Fig. 4 for 1979-80. T/S-2 increased spinrate and T/S-1 decreased spin rate. Detai-ls ofthis type of thrust measurement may be found inthe appendix of Ref. 2.
There has been no change in thruster perfor-mance over the 10-1/2 year period of space opera-

tion that included 4030 hours of operation (2744with beam) and 261 restarts with T/S-2. An addi-tional 110 hours of beam current was logged afterthe 4030-hour (next tank empty) point duringdistant-neutralizing tests described later. Themain discharge of T/S-2 ran an additional 2635hours after the 4030-hour point and is estimatedto operate 2500 hours more before the main tankwill be empty in March-April 1981.
T/S-1 beam operation was attempted ten timesin 1979-80, but the H.V. short of 1970 remained.The description of its discharge operation isdescribed below in the Plasma Mode and Durabilitytesting sections.
Distant Neutralization
Reference 3 presented early data on distantneutralization, a term used to describe neutrali-zation of T/S-2 beam by electrons emitted from theneutralizer of T/S-1, almost 1 meter away. Figure5 (also in Ref. 3) shows a diagram of possible ioncurrents and plasma densities while in distantneutralization. One result of Ref. 3 that wasdifficult to explain, was that the neutralizercoupling voltage (between neutralizer and beamcenter) was lower in the distant coupling modethan for normal neutralization. Reference 6 sug-gested a model for coupling voltages that ex-plained the relative ease (lower coupling voltage)of cross neutralization. This model used thethruster external magnetic fields and showed thatneut-2 emission must cross magnetic lines to enterits beam plasma, while neut-1 emission can follow(without crossing) magnetic lines in a path reach-ing to the ion beam 1 meter away.
The fraction of emission coming from eitherneutralizer could be adjusted by varying a biaspotential (V9, Fig. 2) to either neutralizer cath-ode. Figure 6 shows how this fraction changeswith bias voltage in addition to correspondingchanges in beam voltage and spacecraft voltage.The 83 mA beam data were from Ref. 3 while the 200ntA beam data are new in this paper.
The data of Fig. 6 show that for no biasvoltage, most of the neutralizer emission camefrom the neutralizer near the ion beam. For 83 mAbeam data-, all emission could be put off fromneut-2 by applying +34 volts bias to neut-2.Similiarly, a bias of +6 volts on neut-1 (neut-2at no bias) cut off all emission from neut-1. For200 mA beam data, the neut-2 bias was set at itsmaximum value (+46 v.), but still about half theemission came from neut-2. The lack of completecut off was probably due to the higher beam plasmavoltage (acting like a natural anode) at 200 mAbeam and a fixed bias limit. The spacecraft volt-age and beam voltage shown on Fig. 6 react to.neutralizer bias as expected from Ref. 2 or 5.(Space plasma potential is defined as zero.)
The increased difficulty of distant neutrali-zation at 200 mA means that distant neutralizationof a multiple thruster array, particularly athigher beam current, may not be as readily accom-plished as first stated in Ref. 2. This is not tosay that distant neutralization can not be accom-plished on a multi array of 2 A beam currentthrusters, merely that higher coupling voltagesmay be required.
No Local Neutralizer
The distant neutralization data taken inearly 19793 was always modified by the fact thatthere was no way to operate an ion beam withouthaving its local neutralizer also turned on.Simulated off conditions were achieved by applyingpositive bias to the local neutralizer cathode,but the on-board command sequences did not providefor separate disabling of the neutralizer. There-fore, a test plan was made to disable the neutral-izer another way, that was, by operating it longenough to empty its mercury propellent tank.Then, even though commanded on, the neutralizerwas incapable of significant emission becausethere was no mercury flow to establish a hollowcathode discharge. Under this condition thekeeper electrode was at high (-250 v.) startingvoltage and the tip heater was at maximum power.Thermonic emission at the maximum power tempera-ture (1100° C) was less than 1 mA.
Neut-2 tank was emptied on day 122 (May 1)1980 and distant neutralization tests were run inwhich (1) the main-1 and neut-1 discharges wereturned on to neutralize the ion beam from T/S-2(Fig. 7(a)), or (2) just neut-1 turned on (Fig.7(b)). Later, when neut-1 propellant tank wasempty, neutralization was accomplished from justthe maih-1 discharge (Fig. 7(c)). Figure 7 con-tains plots of ion beam plasma potential profilestaken with the movable hot wire probe of T/S-2.Voltages levels for the spacecraft and neut-1 arealso shown and were determined by the probe forT/S-1 which was in a fixed position3 midwaybetween T/S-2 and T/S-1. Thruster operatingconditions for Fig. 7 as well as Figs. 8 and 9 maybe found in Table 3. (Each curve of the figuresis given a number to key it to Table 3. Passnumbers in Table 3 key it to spacecraft controlroom data.)
Figure 7(a) results show three curves: (1)normal operation with local neutralization, (2)distant neutralizer with neut-2 biased off (1979),and (3) distant neutralization with neut-2 empty.As stated in the previous section, curve 2 shows adrop in beam plasma potential and coupling voltagewhen both- neutralizer discharges were operating,although all emission seems to be coming from thedistant neutralizer. Curve 3 shows a 25-volt in-crease in beam plasma potential with the local(neut-2) neutralizer empty. Interestingly curves 1and 3 have about the same spacecraft potential,and the 34 volts positive bias of neut-2 (curve 2)lowered the spacecraft potential by 10 volts.
A hypothesis offered by Domitz^ to explainthe coupling voltages observed in Fig. 7(a) is thefollowing: space charge neutralization of an ionbeam may require only a small (~1 mA) number ofelectrons which become trapped in the positivewell of the beam plasma. The only electrons thatneed to be added are equal to those lost from thiswell. Current neutralization may be achieved byother paths external and perhaps far downstreamfrom the local neutralizer. (For example, neu-tralizer electrons could flow into the spaceplasma and other space plasma electrons couldcurrent neutralize the beam.)
Curve 2 with emission biased to "zero" mayhave emitted a net current of 3 mA and still haveshown zero counts on the telemetry channel. The

neut-2 keeper potential was 28 volts above space-craft potential and therefore a few volts abovethe "wing" plasma of curve 2. Hence electronsfrom the keeper discharge could have been easily-drawn into the beam to provide space-charge neu-tralization, while neut-1 emission was providingthe bulk of the current neutralization to space 'plasma. When the local neutralizer tank (neut-2)was empty and no keeper discharge was present,space charge electrons were drawn from furtheraway and a higher coupling (beam plasma) potentialresulted.
Figure 7(b) shows the effect of eliminatingthe plasma produced by the main-1 discharge.Without this additional plasma density, apparentlyuseful to aid electron conduction, the beam plasmapotential must increase to draw sufficient elec-trons to itself. Figure 7(b) shows a normal beamprofile for reference together with two corres-ponding neut-2 curves, but with the main-1 dis-charge off. In curve 5, neut-2 empty, the beamplasma potential is not only high enough to excedethe design range of the probe, it has considerablybroadened in width, and the spacecraft potentialwas lowered. . All these trends were apparentlycaused by the need for neutralizing electrons andthe relative impedence (no main-1 dischargeplasma) to electron diffusion.
The data of Fig. 7(c) were taken later in1980 after neut-1 tank was also empty. In thiscase the only source of net electron emission wasthe cathode of the main-1 discharge. For thiscase the shape of the beam plasma potential pro-file was about the same as for curve 5 (Fig.7(b)), but the apparent coupling voltage was in-creased and the spacecraft voltage was driven to-70 v. The maximum beam plasma voltage is specu-lation because the probe design limits were againexceeded.
The operating conditions of both curve 3 and5 (Fig. 7, neut-2 empty) were maintained for 2 daysto obtain a thrust measurement with this type ofneutralization. The result was a thrust of 9.9 mN(±5 percent) for curve 3 and 10.0 mN (±3 percent)for curve 5. Both these values were essentiallythe same as for normal neutralization-measuredthrust^ of 10.0 mN (±3 percent). Apparently noappreciable beam diverange was introduced by thedistant neutralization, nor did the greater beampotential affect the thrust. This latter observa-tion was not surprizing as the maximum calculatedvalue would be proportional to the square root ofthe respective net accelerating voltage, i.e.(3000-25) v. for curve 1, (3000-52) v. for curve3, and (3000-85+) v. for curve. 5
The operating conditions of curve 6 could notbe maintained for a long enough period to changethe spacecraft spin rate and obtain a thrust mea-surement. This was due to the negative voltagemagnitude of the spacecraft and a resulting large(>60 mA) amount of ions attracted to the accelera-tor grid of T/S-1. The >60 mA caused a built-incurrent overload protection circuit to trip and acut back of the flow to the main-1 discharge. Asthe flow cutback, the discharge density and ac-celerater grid current were reduced below the trippoint, thus permitting the flow to resume. Thiscyclic behavior was marginally stable, but neverpersisted for more than two hours. The change inspin rate in two hours was equivalent to the un-
certainty in reading the spin rate and no meaning-ful data resulted.
The most dramatic case of operation with nolocal neutralizer occurred when the conditions ofFig. 7(c) (curve 6) above were being attempted,and T/S-1 shut off completely due to a 2 minute-overload integration device incorporated into the.system. Surprizingly, T/S-2 continued to operateat 85 mA beam current with no source of net elec-tron emission. This condition lasted for 53 min-utes and data was obtained from the on-board taperecorder. Eventually H. V. trips occurred toT/S-2 and the overload integrator device shutT/S-2 down. The above conditions were repeated 3times, but the system never remained operatinglong enough to obtain a spin-rate thrust measure-ment. The conditions during this type of opera-tion are listed in Table 3 as curve 7. No curvewas plotted because the probe reading was alwaysat its maximum value. This value indicated aspacecraft potential of < -106 v. The actualvalue of spacecraft potential could have been anymagnitude up to the positive H. V. (screen) of3150 v. At such large negative spacecraft poten-tials the thrust should be severly reduced by beamturn around. Surprizingly, the accelerator grid,which was -1400 v with respect to the alreadynegative spacecraft, did not attract enough ionsto trip its overload value of 60 mA. The actualvalue was 33 mA as shown in Table 3. Apparently,the beam plasma shielded the accelerator grid andthe remaining (85-33) mA of beam returned to otherparts of the spacecraft where it was not sensed bytelemetry.
The above case has not been fully modeledanalytically, but space ions returning to thespacecraft were probably the order of 1 mA plusany sheath-enlargement factor. Change-exchange•beam ions might have contributed an estimated 9 mA(Fig. 5) still leaving about 40 mA returning toother parts of the spacecraft or thruster groundshield. This flux of returning ions did notapparent damage to the spacecraft which functionednormally during the beam turn around operation.T/S-2 itself might have become a casuality to beamturn around, because a day later, while operatingT/S-2 (neutralized by neut-1 and main-1) a perma-nent H. V. thruster body short-to-ground devel-oped. H. V. shorts are discussed in a later sec-tion, but note that this short was not the same asthe 1970-type which was a screen-to-accel gridshort.
Low-Mode Test.
Low mode is a main propellant control problemthat can exist if the propellant flow should ex-ceed a critical value. Flow rates higher than thecritical value cause a reduction in beam currentfor an increase in flow; thus, a normal controlloop will drive to maximum flow and the beam cur-rent will become lower and lower. The purpose ofthis section is not to describe how to avoid lowmode, but rather to publish flight data taken ofbeam plasma potential while a thruster was in lowmode. T/S-2 went into low mode during a test inwhich H. V. was turned on with no preheat andbefore the main discharge was lighted. Excesspropellant condensed in flow passages prior tolighting. Once lighted, heat from the dischargeevaporated the condensed mercury and drove theflow rate past the critical flow point. (Normal

preheating for 5 minutes prevented this condensa-tion.) The thruster remained in low mode for sev-eral hours before being commanded off. The dataof Fig. 8 and Table 3 (curves 8-10) were takenduring this time.
Figure 8 shows the beam plasma potential pro-file for a 10 mA beam at 3140 v. net acceleratingvoltage, and for two profiles in which neut-2 wasbiased +40 v. and -34 v. Also shown are space-craft potential level (measured by probe IJ^andthe respective neut-2 potential. Note all poten-tials were relative to space plasma which wasassumed zero. The profile for no neut-2 bias wasmuch flatter than for a normal beam. The reasonmay be an abundance of charge exchange plasma,caused by the high propellant flow rate, loweringthe impedance of the neutralizer plasma bridge,or/and a lower coupling voltages due to the loweramount of neutralizer electrons needed at the lowbeam current. Biasing of' neut-2 accentuated theprofile as shown in Fig.' 8.
H. V. Shorts
The table below summarizes H. V. shorts thathave occurred on SERT II flight thrusters. Fromtelemetry analysis of the V5 and V6 supplies itwas possible to conclude that all shorts exceptNo. 4 on T/S-2 were between V5 and V6, i.e., thescreen and accelerator grid. Also concluded wasthat the value of the short was below 10 K ohms.
Short no. Beam,hr
23853781
T/S-1
Year
T/S-2
Year
19701970
Beam,hr
2011 19702561 19792626 19792744* 1980
*This short between 2V5 and thruster(spacecraft) ground, all othershorts between V5 and V6.
Short 1, T/S-1, was removed by a single shutdown and normal preheat period. Short 2 stillexists in T/S-1 after 300 thermal recycles and 20attempts to sustain high voltage. T/S-2, short 1,occurred in 1970 and was not cleared until 1974following a spacecraft spin manneuver which placedthe thruster in a small artifical gravity of about0.01 "g". T/S-2, short 2, occurred during a testin which h'igh voltage was applied with no'dis-charge to measure grid insulator leakage. Noleakage was found, but a H. V. grid short devel-oped, possibly from a higher voltage stress on thegrids. The V5 and V6 supplies produced 10-percenthigher voltages without the normal beam load andthese voltages might have bent a grid web fragmentthat was weakened in the prior 550 hours of beamoperation. Short 2 was cleared by a cold restartapplication of H. V. after several hot restartsfailed T/S-2, short 3, occurred during anothertest of H. V. application with no discharge. Inthis case the main discharge lighted, produced abeam current for'2 to 15 seconds, and then T/S-2developed a V5-V6 short. Several hot and coldrestarts of high voltage were tried before theshort finally cleared following a long heatedperiod. The last short of T/S-2 was a short of<10 K ohms between 2V5 and thruster ground. This
short occurred after 1-1/2 hours steady stateoperation at 85 mA beam with neutralization fromneut-l/main-1, and also one day after operatingT/S-2 for 53 minutes with no neutralizer source.Short 4 still remains despite sixteen thermal re-cycling efforts to clear it.
The V5-V6 shorts were believed caused byneutralizer discharge ions striking the accelgrid, causing erosion and web fragments to beproduced. The web fragments would be electro-statically drawn to and short to the screen grid.The V5-ground short location was not as apparent.The most probable area was a plate attached to thethruster ground screen, underneith the neutralizercathode. This plate was in close proximity(~3 mm) to a surface of the thruster body (V5potential).
Plasma Beam Thrust
Plasma beam thrust is a new SERT II thrustoperating mode (utilizing only the main dischargechamber plasma) that was discovered by chance inlate 1979. At that time T/S-1 main discharge wasturned on and allowed to run continuous for endur-ance testing. After several days, it was noticedthat the spacecraft spin rate was changing at arate greater than normal'. T/S-1 was producingthrust, about 0.8 mN, with no (V5 and V6 turnedoff, see Fig. 2) voltages on the acceleratorgrids. Furthermore, no ion beam was indicated bytelemetry measuring circuits.
What apparently happened was that the main •discharge (V4) produced a mercury plasma at thelevel of the V4 voltage, 40 v. This plasma dif-fused through the accelerator grids, carrying anequal number of electrons and ions. Once by thegrids the ions were accelerated through a 40 v.sheath, producing a thrust beam. Electrons some-how were either carried along by the ion spacecharge or diffused into space plasma. This typeof plasma beam acceleration has been studiedearlier?. In this study?, however, the arcsource, which was similar to an electron bombard-ment discharge chamber, had no grids to impede theacceleration of plasma or ions from the discharge
•chamber.
In any event, T/S-1 was producing thrust andthe main discharge supply was the only supply thatcould give energy to produce a thrust beam.Subsequently, other tests were run at lower dis-charge voltage, which dropped the thrust level,and with the other thruster system, which producedabout the same level of thrust. The thrust mea-sured for 16 plasma beam thrust tests on SERT IIis shown in Table 4. Also in Table 4 are thrusteroperating conditions, estimated flow rate (fromground tests in 1970° and 19809), estimatedfloating levels of the V5 and V6 supplies,9 anda calculated plasma beam ion current. The beamcalculation assumed a one-dimensional ion beam ofnet energy .as listed in Table 4. The actualplasma beam has some degree of divergence, whichif incorporated in the calculated ion current,would increase the ion current (perhaps by 20percent). A qualitative idea of the divergencemay be seen on p. 37 of Ref. 10, or in Fig. 9 ofthis paper. The nominal performance of thethruster operating in the plasma thrust mode islisted below:
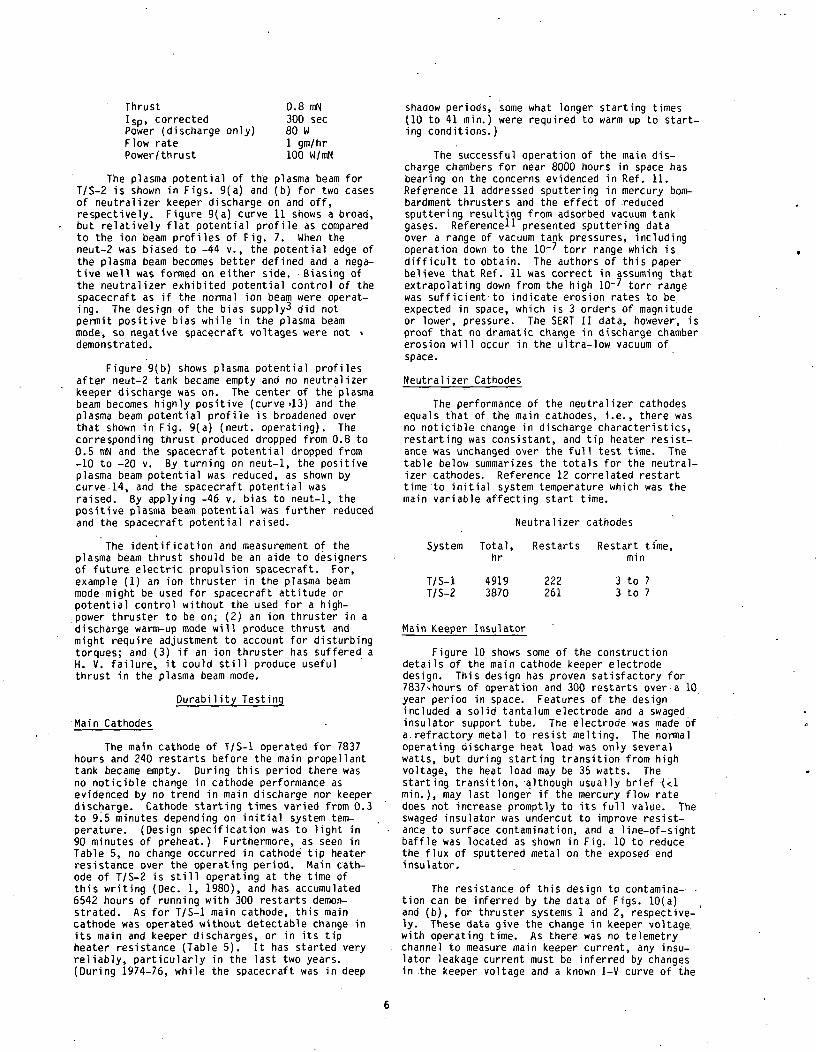
Thrust 0.8 mNISp, corrected 300 secPower (discharge only) 80 WFlow rate 1 gm/hrPower/thrust 100 W/mN
The plasma potential of the plasma beam forT/S-2 is shown in Figs. 9(a) and (b) for two casesof neutralizer keeper discharge on and off,respectively. Figure 9(a) curve 11 shows a broad,but relatively flat potential profile as comparedto the ion beam profiles of Fig. 7. When theneut-2 was biased to -44 v., the potential edge ofthe plasma beam becomes better defined and a nega-tive well was formed on either side. Biasing ofthe neutralizer exhibited potential control of thespacecraft as if the normal ion beam were operat-ing. The design of the bias supply^ did notpermit positive bias while in the plasma beammode, so negative spacecraft voltages were not <demonstrated.
Figure 9(b) shows plasma potential profilesafter neut-2 tank became empty and no neutralizerkeeper discharge was on. The center of the plasmabeam becomes highly positive (curve >13) and theplasma beam potential profile is broadened overthat shown in Fig. 9(a) (neut. operating). Thecorresponding thrust produced dropped from 0.8 to0.5 mN and the spacecraft potential dropped from-10 to -20 v. By turning on neut-1, the positiveplasma beam potential was reduced, as shown bycurve 14, and the spacecraft potential wasraised. By applying -46 v. bias to neut-1, thepositive plasma beam potential was further reducedand the spacecraft potential raised.
The identification and measurement of theplasma beam thrust should be an aide to designersof future electric propulsion spacecraft. For,example (1) an ion thruster in the plasma beammode might be used for spacecraft attitude orpotential control without the used for a high-power thruster to be on; (2) an ion thruster in adischarge warm-up mode will produce thrust andmight require adjustment to account for disturbingtorques; and (3) if an ion thruster has suffered aH. V. failure, it could still produce usefulthrust in the plasma beam mode.
Durability Testing
Main Cathodes
The main cathode of T/S-1 operated for 7837hours and 240 restarts before the main propellanttank became empty. During this period there wasno noticible change in cathode performance asevidenced by no trend in main discharge nor keeperdischarge. Cathode starting times varied from 0.3to 9.5 minutes depending on initial system tem-perature. (Design specification was to light in90 minutes of preheat.) Furthermore, as seen inTable 5, no change occurred in cathode tip heaterresistance over the operating period. Main cath-ode of T/S-2 is still operating at the time ofthis writing (Dec. 1, 1980), and has accumulated6542 hours of running with 300 restarts demon-strated. As for T/S-1 main cathode, this maincathode was operated without detectable change inits main and keeper discharges, or in its tipheater resistance (Table 5). It has started veryreliably, particularly in the last two years.(During 1974-76, while the spacecraft was in deep
shadow periods, some what longer starting times(10 to 41 min.) were required to warm up to start-ing conditions.)
The successful operation of the main dis-charge chambers for near 8000 hours in space hasbearing on the concerns evidenced in Ref. 11.Reference 11 addressed sputtering in mercury bom-bardment thrusters and the effect of reducedsputtering resulting from adsorbed vacuum tankgases. Reference** presented sputtering dataover a range of vacuum tank pressures, includingoperation down to the 10~ torr range which isdifficult to obtain. The authors of this paperbelieve that Ref. 11 was correct in assuming thatextrapolating down from the high 10~7 torr rangewas sufficient to indicate erosion rates to beexpected in space, which is 3 orders of magnitudeor lower, pressure. The SERT II data, however, isproof that no dramatic change in discharge chambererosion will occur in the ultra-low vacuum ofspace.
Neutralizer Cathodes
The performance of the neutralizer cathodesequals that of the main cathodes, i.e., there wasno noticible change in discharge characteristics,restarting was consistant, and tip heater resist-ance was unchanged over the full test time. Thetable below summarizes the totals for the neutral-izer cathodes. Reference 12 correlated restarttime 'to initial system temperature which was themain variable affecting start time.
Neutralizer cathodes
System Total, Restarts Restart time,hr min
T/S-1T/S-2
49193870
222261
3 to 73 to 7
Main Keeper Insulator
Figure 10 shows some of the constructiondetails of the main cathode keeper electrodedesign. This design has proven satisfactory for7837--hours of operation and 300 restarts over a 10year period in space. Features of the designincluded a solid tantalum electrode and a swagedinsulator support tube. The electrode was made ofa.refractory metal to resist melting. The normaloperating discharge heat load was only severalwatts, but during starting transition from highvoltage, the heat load may be 35 watts. Thestarting transition, although usually brief (<1min.), may last longer if the mercury flow ratedoes not increase promptly to its full value. Theswaged insulator was undercut to improve resist-ance to surface contamination, and a line-of-sightbaffle was located as shown in Fig. 10 to reducethe flux of sputtered metal on the exposed endinsulator.
The resistance of this design to contamina-tion can be inferred by the data of Figs. 10(a)and (b), for thruster systems 1 and 2, respective-'ly. These data give the change in keeper voltage,with operating time. As there was no telemetrychannel to measure main keeper current, any insu-lator leakage current must be inferred by changesin the keeper voltage and a known I-V curve of the

keeper power supply. The data of Fig. 10 weretaken during preheat conditions when voltage wasapplied, but no mercury flow was present to starta discharge. The data show a slight decrease inkeeper voltage with time. This change in keepervoltage resulted in no apparent change in startingor operation of the main cathode. The uncertaintyrange of the data is due to ±1/2 count differencein measured keeper voltage and solar array inputvoltage. Leakage currents, estimated from I-Vload, curves, are shown on Fig. 10 to give the,reader an idea of the magnitude of this current.(The "roll-off" or I-V slope of each supply wasunique and accounted for the varience betweenFigs. 10(a) and (b) in the values of leakage cur-rent shown.)
The conclusions from'Fig. 10 were: (1) noproblem resulted from the small amount of leakagecurrent that occurred, (2) this .current increasedwith time, probably due to surface build up at theexposed end of the swaged insulator, (3) futureinsulator designs should be at least equivalent tothat used, and (4) the roll-off design of thekeeper voltage supply should provide adequatestarting voltage for end-of-life leakage currentsas high as 20 mA.
Neutralizer Keeper Insulator
Figure 11 shows some of the constructiondetail of the neutralizer keeper electrodedesign. The sketch is to scale with the AlgOsinsulator being 0.6 cm across. Insulator shield-ing design included the keeper electrode itselfand a spacer washer between the keeper andAlgOs block to minimize contact between thetwo. (In retrospect, a spacer washer probablyshould have been used under the screw head,also.) The electrode was tantalum to avoid melt-ing for the same reasons noted above for the maincathode keeper.
Figure 11 also shows plots o'f neutralizerkeeper leakage current with total operating hoursfor both flight thruster systems. The current wasdirectly measured by telemetry before the dis-charge begins. The increase of this current withtime probably was caused by a bui.ld-up of con-densed sputtered metal on the A1203 insulator sur-faces. This build-up may have been sputteredaccelerator grid material (molybdenum). Thecurves are broken into sections of normal beamoperation (dashed curve), no beam with neutralizerand main discharges lighted (dotted curve), andfinally a period of only main discharge lighted(solid curve). Build up seemingly occurs duringbeam on periods, with a greater build up forthruster system 1 which had the longer beam onperiod. The no beam period was a time in whichthe leakage current apparently decreased. Theauthors formulate no reason for this decrease, butpoint out that this no-beam period included 9calendar years for thruster system 1. The 9-yearperiod for thruster system 2 occurred between the250 mA and 85 mA beam operating "periods. Thefinal period was one of no accelerator grid ero-sion and no change in leakage current. Also,during this period, the leakage current could bemeasured more accurately because no neutralizerdischarge occurs.
'Figure 12 shows the semiconducting nature ofthe build-up film on' the insulator. The data for •
Fig. 12 was taken after the neutralizer Hg tankswere empty and a longer preheating time was possi-ble to get leakage resistance values at thermalequalibrium. With Hg in the tank, the neutralizerdischarge lighted in 3 to 7 minutes. Oncelighted, the telemetry read the sum of leakageplus discharge current, with the latter being muchgreater (5 to 10 times). The arrows on the dataof Fig. 11 indicate leakage current values thatthe authors believe would have been reached, hadthe discharge not lighted. The plotted circlesare values of leakage current reached just beforedischarge lighting.
The conclusions reached from the data pre-sented in Figs. 11 and 12 were: (1) the neutral-izer keeper insulator shielding design was ade-quate, but not as good as that for the main keep-er; (2) the insulator surface build-up resulted inleakage currents of 10 to 29 mA during neutralizercathode lighting attempts, and a resulting fall-off of keeper starting voltages from 420 v. to arange of 250 to 300 v; (3) even at the reducedkeeper starting voltage, however, the neutralizercontinued to relight upon command, (4) more atten-tion should be given to future insulator shieldingdesigns to prevent sputtered metal from reachingcritical insulator areas; and (5) the design keep-er voltage "roff-off" should provide for a leakagecurrent margine of 10 to 20 mA at the minimumstarting keeper voltage.
H. V. Grid Insulators
Tests were made on T/S-2 in late 1979 inwhich H. V. was applied to the grids before thethruster discharges^had lighted. This was doneboth for a cool (60° C neut-2 tank) thruster and awarm (at normalooperating temperature, 112° C -neut-2 tank, 88° C ground screen) thruster. Inboth cases, there was no measurable leakage ineither 15 (<1.5 mA) or 16 (<0.1 mA) for V5 of 4020v. and V6 of -1650 v. This result of no measur-able insulator degradation agrees with resultsfrom thruster life tests in vacuum chambers andconfirms the insulator design. The insulatorswere A1203 balls with double cup, line-of-sight, shields. The grid insulators of T/S-1, ofcourse, could not be tested because of the H. V.grid short that was present.
Neutralizer Propellant Tanks
The neutralizer propellant tanks of eachthruster system were operated until they becameempty of mercury. This occurred on day 203, 1980for thruster system 1 and day 122, 1980 forthruster system 2. The purpose of this section isto present detailed performance data of the neu-tralizer propellant tanks and compare this perfor-mance with design predictions.
A schematic cross section of a neutralizertank is shown in Fig. 13. The tank consisted oftwo nearly equal volumes. One contain 1iquid mer-cury and the other contained a pressurizing gas(80 percent Ng, 20 percent Kr) (Krypton gas wasadded as a tracer gas for leak detection groundtests.) The two volumes were separated by a butylrubber bladder which terminated in an "0-ring"shape. This ",0-ring" formed a seal between thetwo halves of the tank. A pressure transducer wasmounted on the gas volume and a temperature sensor

was located externally on the essentially isother-mal tank.
As mercury flows out of the tank, the gasvolume increased and the pressure decreased.A plot of this pressure decrease with operatingtime is shown in Figs. 14(a) and (b) for neutral-izer tanks 1 and 2, respectively. (The pressurevalues were at discrete levels due to the teleme-try count system used.) The use of the pressurechange with time and the ideal gas law, permitteda calculation of the change in gas volume. Thegas volume change was equal to the change of themercury volume, and the mercury flow rate thuscould be calculated. A second way to calculatethe mercury flow rate was to integrate all flowperiods after the tank is empty and divide intothe total mercury loaded. Table 6 gives majorflow periods for each neutralizer tank and respec-tive data about flow rates. The flow rates basedon the integrated total flow are in good agreementwith ground based flow rate taken with "flowtubes" before launch. Flows rates earlier esti-mated,1 based on the ideal gas law, were 10 to 20percent higher than the integrated total flowrates. An error in the ideal gas low calculationswas caused by not accounting for diffusion orleakage loss of pressurizing gas through the rub-ber bladder.
A complete analysis of gas diffusion wassomewhat involved, but will be presented herebecause of possible impact on future propellantsystem design. There were two gas diffusion pathsof interest. One was straight through the bladderfrom the gas side to the mercury side. This pathwas of no importance in the SERT II design, butmay be significant in other designs. Any gas dif-fusing to the-mercury side will become trapped,setting up a near equal back pressure and reducingthe net diffusion rate. The only way for that gas.to escape would be past the "0-ring" seal or pastthe.natural mercury seal formed by liquid mercuryin the tube between the tank and the vaporizer.Neither of these escape paths were probable in theSERT II design. Future designs, however, shouldconfirm that a natural mercury seal exists, thatis, there is no surface roughness nor grooves onthe tube inside wall that would allow gas to slippast the liquid seal. The second diffusion pathof interest was the following: gas entered therubber bladder, traveled sideways in the rubberuntil it reached the "0-ring." It continuedthrough the rubber of the "0-ring" and escapedpast the unsealed outer joint between tank-halfflanges. Whereas this path was very tortuous, itdid constitute the major path of pressurzing gasloss. The rate of pressurizing gas lost duringstorage periods of 1971 to 1978 was able to bemeasured (see Fig. 14(a) or (b)). The measuredloss rates agreed within 20-percent with the cal-culated diffusion loss rate through the "0-ring"material.
During the storage periods the tank tempera-ture was cooler (35° to 60° C) than when thethruster was operating (98° to 105° C). Litera-ture values of butye rubber diffusion rates!3were used to extrapolate diffusion low ratesduring thruster operation at high temperatures.The diffusion rate was 25 times greater at 105° Cthan at 35° C. The higher temperature diffusionrate value was used to correct the pressure de-crease in the ideal gas low flow calculations.
When this was done, the flow rates thus calculatedwere within experimental error of those flow ratescalculated from integrated total flow data.
After the mercury was empty (4991 hr T/S-1and 3870 hr T/S-2) the gas reservoir pressuredropped rapidly. This drop in pressure was causedby gas diffusion directly through the butyl rubberbladder. The gas that diffused across the bladderwas now more free to flow through the empty mer-cury propellant line, through the porous tungstenvaporizer plug and out through the neutralizercathode orifice to space. The gas pressure decaycurve was used to calculate a gas flow rate. Thisflow rate agreed with a flow rate calculated frombutyl rubber diffusion rates, rubber thickness andsurface area. The agreement was further supportedby diffusion flow at two temperature levels giv'ingtwo points of comparison. The two rates can beseen on Fig. 14(b): a low rate (tank cold), from4120 to 6300 hours, and a high rate (tank hot)from 6300 to 9200 hours.
Conclusions based on neutralizer tank pres-sure data were:
(1) Neutralizer flow rate performance inspace was the same as for ground vacuum chamberthruster operation over all conditions tested.
(2) The design of a butyl-rubber bladderblow-down tank was validated for a 10-year periodwith the following constraints; thermally designthe tank to cool temperatures (20° C) where gasdiffusion through the bladder is low enough formission life, or depend on the liquid mercury toseal or trap the diffused gas.
(3) Under normal flow operation (some mercuryremaining in tank) the loss of pressurizing gaswas negliable. The total of any leakage plus dif-fusion measured over an 8-year storage period wasonly 1.7xlO-4 cm3/hr (STP). A small excess(10 to 15 percent) of pressurizing gas could pro-vide for this loss, even over a 10 year systemlife.
(4) There were no known materials compatabil-ity problems. The neutralizer tank provided pres-surized liquid mercury to the vaporizer for thefull life of the tank capacity. There were noknown leaks of mercury and the tank capacity wasexhausted when anticipated. The leakage of pres-surizing gas was less than specified for typicalgas-tight construction and had no impact on theflow-life of the system.
Main Propellant Tanks
The design of the main propellant tank fol-lowed the same philosophies as for the neutralizerpropellant tank, but the main tank was constructedin a larger size to hold 14 kg of mercury.Because the main tank was at high voltage, nopressure transducer was used to measure change ofpressurizing gas with time. Hence, there was noway to estimate flow rate as the mission pro-gressed. Once the main tank is empty, hpwever,the estimated flow rates could be integrated andcompared with the total used to give a measure ofconfirmation of the actual flow rates.
The main propellant tank of T/S-1 becameempty on December 1, 1980. Table 7 summarizes the

operating hours and estimated flows** for maintank-1. The estimated integrated total flow was13,830 gm which was only 1.6-percent less than theuseful mercury, 14,050 gm, loaded into the tank(50 gm of additional mercury was loaded into theline between the tank and vaporizer and. was con-sidered to be unavailable for use.) The 1.6-percent difference probably resulted from theaccuracy of the estimated flows while T/S-1 was indischarge operation. Discharge only operationflow rates accuracy was not emphasized in pre-launch tests because the original mission plan wasto run but a few hours at discharge only, with thebulk of operation to be at full beam current.Other uncertainties existed in the estimated "end-effects" of restarting, stopping and short clear-ing tests. All of these "end-effects," however,amount to a small total, and estimation in-accuracies were of no importance. Main tank-2,when run to exhaustion (est. time, March-April1981), will give more information on main flowrates.
The authors believe that the 1.6-percent dif-ference of main tank-1 constitutes excellant con-firmation that a mercury bombardment thrusteroperated at essentially the same propellant utili-zation in space as measured in laboratory vacuumtanks.
Vaporizers •
Because the vaporizers caused absoutely notrouble, their performance tended to be over-looked. Vaporizers were made of porous tungsten(2.4 micron bore diam, 70 and 76 percent dense)electron-beam welded into tantalum housings.Vaporizer design and flow information is docu-mented elsewhere14. The SERT II flight vapor-izers with stood flight qualification and launchvibration, 11 years in space, 5000 to 8000 hoursof operation, and 300 restart .cycles, all withoutfailure. The dynamic head (distance from tank tovaporizer) was kept small by design, so that novalve was necessary to withstand launch vibrationpressures that might force liquid mercury throughvaporizer pores. The vaporizer operating powerwith time (see tables 2 or 5) was nearly C9nstant,and the small differences that were measured wereprobably a result of a-varing thermal (sun-angle)environment more than anything else.
Concluding Remarks
As the greatly-extended life of the SERT IIspacecraft is nearing completion, it is time toreflect on the accomplishments of this electricpropulsion spacecraft. First, the 11-year usefullife of a spacecraft designed for 18-months, is atribute to the design and qualification team ofLewis Research Center employees and subcontractorsthat built the spacecraft in 1969. Next, theprime experiment, the ion thrusters, proved them-selves with remarkably durable and high qualityperformance while accomplishing one mission objec-tive after another. .It is true that the mainobjective, 6-months operating time in space fromone thruster system, was not reached in 1970; butone thruster did run for 5 months before a H. V.short stopped its beam. All other parts of thethruster system functioned as designed or better,until at last the propellant tanks became emptyand testing was no longer possible.
Extended mission objectives accomplishedwere: (1) clearing the H. V. short from T/S-2 andreestablishment of normal thruster operation in1979 and 1980 after 10 years space storage, (2)successfully demonstrating 300 restarts withoutdifficulty, (3) operating discharge chambers fornearly 8000 hours (11 months) in-space, (4) docu-menting a new form of plasma beam thrust from adischarge chamber, (5) acquiring in space informa-tion on low-energy plasma interactions betweenthruster systems and between thrusters and space-craft, and (6) the demonstration of "distant neu-tralization" of an ion beam from a neutralizer onemeter away.
More than anything else gained, was the con-fidence that mercury bombardment ion thruster sys-tems can be built and operated in space on a rou-tine basis with the same lifetime and performanceas measured in ground testing.
References
1. Ke'rslake, W. R., Goldman, R. G., andNeiberding, W. C., "SERT II: Mission,Thruster, Performance and In-Flight ThrustMeasurements," Journal of Spacecraft andRockets. Vol. 8, Mar. 1971, pp. 213-224.
2. Kerslake, W. R. and Ignaczak, L. R., "SERT II1979 Extended Flight Thruster System Perfor-mance," AIAA Paper 79-2063, Oct. 1979.
3. Kerslake,'W. R. and Domitz, S., "Neutraliza-tion Tests on the SERT II Spacecraft," AIAAPaper 79-2064, Oct. 1979.
4. Ignaczak, L. R., Stevens, N. 'J. andLeRoy, B. E., "Performance of the SERT IISpacecraft after 4-1/2 Years in Space," NASATM X-71632,, 1974.
5. Jones, S. G., Staskus, J. V., andByers, D. C., "Preliminary Results ofSERT II Spacecraft Potential MeasurementsUsing Hot-Wire Emissive Probes," AIAA Paper70-1127, Sep. 1970; also NASA TM X-52856,1970.
6. Kaufman, H. R., "Plasma Physics Analysis ofSERT II Operation," Colorado State Univ.,Fort Collins, CO, Jan. 1980. (NASACR-159814).
7. Burkhart, J. A., "Initial Performance Data ona Low-Power MPD Arc Thruster with a Down-stream Cathode," AIAA Paper 70-1084, Aug.1970.
8. Byers, D. C. and Staggs, J. F., "SERT IIFlight-Type Thruster System Performance,".AIAA Paper 69-235, Mar. 1969.
9. Wilbur, P. J. "Ion and Advanced ElectricThruster Research," Colorado State Univ.,Fort Collins, CO, 1981. (NASA CR-165253).
10. Wilbur, P. J., "Physical Phenomena in MercuryIon Thrusters," Colorado State Univ.,Fort Collins, CO, Dec. 1979. (NASACR-159784).
.11. Mantenieks, M. A. and Rawlin, V. K., "Sputter-ing in Mercury Ion Thrusters," AIAA Paper79-2061, Oct. 1979.
12. Kerslake, W. R. and Finke, R. C., "SERT IIHollow Cathode Multiple Restarts in Space,"AIAA Paper 73-1136,' Oct. 1973. .
13. Rittenhouse, J. B. and Singletary, J. B.,Space Materials Handbook. 3rd Edition, NASASP-3051, 1969, p. 313.
14. Kerslake, W. R., "Design and Test Porous-Tungsten Mercury Vaporizers," AIAA Paper72-484, Apr. 1972; also NASA TN D-6782, 1972.

TABLE 1. - SUMMARY OF OPERATING HOURS
FOR SERT II THRUSTERS
Year(s)
196919701971-721973-781979-80
Total beam
Total neut.
Total discharge
Thruster 1, hr
250 mAbeam
633794
i
200 mAbeam
83
85 mAbeam
83
j3879
V
Discharge only
w/neut
4334236
a!003
J
4997
w/o neut
b2940
jb7937
Year(s)
196919701971-721973-781979-80
Total beam
Total neut.
Total discharge
.Thruster 2, hr
250 mAbeam
432017
00.01
L
200 mAbeam
82
058
85 mAbeam
82
. 1606
j
2744
^
Discharge only
w/neut-
4820249
a!005
j4030
w/o neut
C2635
JC66Y65
aNeutralizer Hg tank empty at end of test hours.bMain Hg tank empty, Dec. 1, 1980 at end of test hours.cAs of Dec. 8, 1980; still-operating (est. empty in
2500 more hr).

e
oc
c
-s
ro
°-
g ~H
Oi O
^^ cn CM
S~2
Oi
SS2
xsju.2*~
2SS
r-l CO ^H
2SS
Igs
8Co2SS
®£iS
RSg .
sSs
g§2
ala
Ol CM r-H
lis
-H \O
§Sa*.
« >> « Eiic5cS 1
*CO10 in
ss
10 in
ss
_
—
ss
ss
ffj
01 01
o o
o o
o o
o o
o o
o o
o o
o o
0 0
o o
CMCM"
IMa
in v
ap
ori
ze
rh
ea
ter
to in
cn oin •
Ol f»-
^
^
**
Ot •
CO .
3s~.ES
"*• CO
m •
3s
%*z«
LO •
^
%'$
sz
Ma
in c
ath
od
eh
ea
ter
*3- CO
in -"
*r cn
d ~*
d -*
d -
O1 CMPO
01 O
01 CMPO
g°
rs°
ra°
?°
?°
s°
g°
9°
s's"
uefl
•oc<os:
oo
OO
00
o o
0 0
o o
o a
o o
o o
oo
0 0
o o
o o
o o
0 0
0 0
0 0
£J2
Beam
vo
lta
ge
Beam
cu
rre
nt
00
O O
O O
o o
0 0
o o
o o
o o
0 0
00
0 0
0 0
0 0
0 0
o o
0 0
0 0
^tO to
Acce
lera
tor
gri
d
OCM
CO* CM
in roPs. CM
CO CM
CO **
CO CM
CO CM
Sff
rs* CM
PO 01
d CM
r-< inCO CM
01 <*•
O POCO CSJ
CO CM
CM inco r\j
v O
CO CM
CO <0
CO CM
srs
as
(_ in
.sio
CO* M
d
CO ^
d
2S
s-.
CO -H
. PS.(M —1
y-*i53
d
CO ^H
d
2Sd
22CM .
O
22
O Ol
CO ^H
d
CO —t
Ss5s
• CMCO CM
co* oo"
Ne
utr
alize
rke
eper
m O
in O
ji Oi
^ o
— 0
*f O
—
cn 0
v 01
in 0
r*. O1
cn oi
--* o
-^ 0
— 0
PO 0
— • o
10 0
2
Sp
ace
cra
ftvo
lta
ge
Ne
utr
alize
re
mis
sio
n
01
cn
cn
OCM
if) OlO CM
~°
** CM
OCM
~£
cn CM
ff
CM CM
5°PO
«• o
•a
2°-S1
8°•ff
1°
1°
s°
1°•I
o o
Isc cu
's
3
to
s
UJ
Ol
s
to
s
"s
s.
s
3
1O
to
K
to
CM
0
felL. i—
"o
Tele
met
ry
i
1
%
1
CO
O O
cn
257S
S5S
*fr — 1
25TS
2~SS
COCMf-«
01 O
S -SS
01 CMssscn CMrs. CM O»
PS. CM
2 «CM
lO CM
Ol "~-~*ft O1CM
m ^
2oT2
§3*„
irfl
So
S CO
OO CO
-H r-t
32
CO 011-1
-_;-;
22
to to
S ps.10
^^
PS, lO
•0 01
'ffff
o o
O rs.
PO ~Hto 10
5> oT
CM cv
L.
Ma
in
vap
ori
zeh
ea
ter
in in
O d•H -H
in
CM r*.• in
"*
""
• to
-1
"^
in .
CM m
23
CO ^
CO >
i*. 10
£2
CO **l
CO ^
cn «r
22
IMa
in c
ath
od
eh
ea
ter
3|
S=
'.~
"
3-
•
3-
rn d
PS. CM• to
Ol *PO O
SISo"
•<j- d
i.—
CO PS.
0* *PO CM
13
^- to
CM ^«• o
«• to
(M P*.
oj d
ss
«
-oc
m m"S3
I!as•s-d
l|
3 01
•"•ff
Bo
So
CO 3
8O
Isd
d
d
*2O CM
~ff
O roS3
§8
11
g"i2
Beam
vo
lta
ge
Beam
cu
rre
nt
*3
i
§^j
S-
PO •
J
?*•:lO "H
in o
12i
12
siin -<
S2
-~
o i/>So
S"•* o
w
s0:o- o
-?
S2
s'a-
Acce
lera
tor
gri
d
CM O
tO CM
tO CM
r-. 0
rs" CM
• >
ss
d CM
in CM
in POPS. CM
^<o
r-'~
-*,-« 10
£"
CO CM
to o
sit
Ne
utr
alize
rh
ea
ter
2|
in CMft ~H
• •"d
isd
> to
• tO
~#
-^ss
d
CM •O
52
~2
Sd
22o
co m
00 10
CM •&CO IO
ps* (MCM '
-c?
2*2
Ne
utr
alize
rke
eper
o
O m^ Ol
d
°t Si
d
d
t(- Ol
d
^ sd
o
o
d
d
' 8d
•~> —
£ S
S Io
3d
— ' 931 0
d
en"
Sp
ace
cra
ftvo
lta
ge
Ne
utr
aliz
er
em
issi
on
?^ i
^ cn CM
°:3 s"^
PO CM £
"s
• to in
"^ __,
ft CM
• in mrs. CM
•» Ol PS.
"s
Ol tM
CO CM
"s
CO <NJ
".=
. m *j-
CO Ps. 0
sl so «• cn
s>9 CM CO
o'd"
<u
is 1= s &s" 5
s 13 §
«j t.
V 0.
tj "o
I iii/l rg
It 1^_. 10 J<
SCO U «
.? g. ^ *~" —
O <Q CM 0*
IssSl 5
S«5t- S> o •<- - c
O Q.-0 "U 0)•*-• O O> •'-
S J-> O I- -C
Pii| :"iiiyc'+j o e J2 «
(O W i. *O 3 t
" S f e

7£
"7
1
1
CM1
4-1
I
cn •
•—1
aioo •
•— e""*
2f
CM
cn <js;
CM
CO <|
CM
S =>'CM
CM "=
IO •
Sfcv
i-
^IrtV)
ft.
rO "O 1--o jz
CMCM CM
4-C 4- <-H
0 0 |4- i— <
C .— 1 4- i— IO 1 O 1 * 4J -- *
C C H ro 1_ .,_, .,- ,_( .r- | .C 4->
I iO | fO C 1_ t/1c E c E •£ o»coeu
cz E cn E cn i_ uicu c c E o i- o.i_ .^-»- .ft- O CX O EOJ 4- -4-» 4- 4-> V. (O 4- «3
O) O i- O 1- t. LOi. CU CU C C O ) .
• O C X T 3 C X O -1-3^-4- C U O C U O - - - r o o
E 01 VI 4J E CX tl
O ) ' ' - O - < - O N K . C U
r— -Q <O ro
'g 1 1 1 1 I- CU E
O O) QJ QJ QJ OJ O Q r O ' —
4_ 4-4- 4- 4-4-4-
OOOOOOO OOO
>,4- C » CX4- 4-4-4-O O E O OOO
UJ
00 OOO
4_J 4J 4J 4J
c c a c a Q. a. cccO O E O E E E O O O
UJ LU UJ UJ
2° -3 5255-s§§°5 252
—-co co co co in — ^.X-X^-Kf O C M C M C M C M C O ' O ( O f O r o
fO^MOuOv£)Ln (0 r o r o r O
— -o r-i in o O •— - — »— -— *
- — -O CM i-H O A • • —
o «a- o u3 o o o o o <»•r o 7 *7
O O fc ro ro ro
CM CM CM CM
f— I •— < <— 1 --4 .— I •— 41
O O O O Oo - o LO to in
"T l *7*T"7
ro
O 0 OOO --i m in LO in c
ro ro ro ro ro«
ro ro in ro ^ OOO CCOCO CO CO ^-4—1^
^c
^H CM ro'^- in uo i — co cn o
CM in ro i— t ^- cn — i ^•^•^i
5 c? $ <uCD 1 "- | T5
cu •<— torO -O O.4J -O EE cu o <o cu (/>rO ro 4-» QJ (O i—
»— ••- O Q.-I- Q.CX-Q C O J3
C•— CM CNJ --H •-* ••-
O OJ CU CU CU OZ Z Z Z Z CO
4-
O 0
>,
4- 4- 4- C C CXO O O O O E
UJ
O *
4-)
c c a -._ »0 0 E
UJ
ro fO ro ^
^— -— *— «.ro o Oro W *O i— t to
• — •- — •• — • i— (
— *• — -• — -CO cn r-.(TS ro rO CM CM O
tO (O"fl y3 SS
^- — — O O O
o *r o _ ^1
000
CM
cn r* in uD vo coCM CM ro T— 1 .-H in
CM CM CM CM
CM CM «-H CM UO rO
1) .-H ,-t
= CM O 00 CO cvj CM+ •-! CM + +
/I3
-» O «-« OOO
O O CM ro O OE CM
x, <* *• ro
3-
vj O O
r
-j
i— t CM ro - in vo
r P . -4 CM CM roCM CM '-n m tn %o
jiNu
Sis .°24>i8"
« ? = >O L. >(/) ra
X *
pht_0)
U£
5* «•Is "5 us
0}
u 1£
S »— l_ >
E &*J (U *3 JC CO„
1 s*c"~ W &E — §
£ ™.^ll>10 0-0 «
"a **
8 ~ .1 i'0
"io u -
tsihi£^O *J
s e » eZ < 3 -C
2 & £3 U C
5=
<0 p.
«l
ro
S 5•=87"*- -— Oo cr* *J
>, 5*« -o
^ <a oTu-g^ STs 3 ?s
O. D1 ro
l_V
1
1_
<u
03<SI
^HlOOtV^O'OC3'^<*0iuOiomio<uO«t/)
cOr-»coeNjr^ior-»f-»(*if*)(v/«rMn **)c\j
10 tn * ^O ^0 M3
in in^ i/>M f-lCO M 1
10
csj cgr- csj ui
S1^?? J
yy?y s0 0
d "8
rw csjoj esjrg csj <\j to
cn
S 3 10 3 S 10 to '«
cn cn «• CTI *
ir> un :\j ao n r co cor-I^HO^H^H^H— 4^^
CMCMCM CM M CM ^J CM
~»~ IT I IS
VLnto oim^int*!
^
f-*voir>LOio^-«-(\iO OO O OO O O
IIlllIHio
c\r fo »3- f-* «• to — i c\(OW^^^"=O^O»CO^H^^^H^H^H— <O*-<
? , , I 1 . , ,
§ o o o ^^ CM ^H foOOO OOO O
O 1 1 1 1 1 1 1
SSSSS3S20 1 1 1 1 1 1 1
SSSeoSS-^SaoCMiocooocoocvjesjMcnrotviScg
uU.J.jiciJ.iicih,i£>«3®U3«5eSii)
fC coo25S0<v 'CMCMPlroro^iScv
-1
2 8= * s
*» CO
^^ 3 ^o<-
in
l£.UJ HI l£> 3- C<*tt*y m ncj <•
cn^H ~H cn ^H eU-) lO IO LO IO L
ui ui - LO i/>
a
S =
<»> ro vn rom r
ii$i& «
CM CO ^J (0 ^ <
o «•> co *" >-* c
CM CM CM C\J f-> ^CXJ 0-cn
tO tO vO CM -^ C*
o o co o o a
SSSSS S
asssis ?
<• CM e\j i 10 o>
LO kf> ro i \O f
\ff
<fi LO n ^ r^00000
g???g
O
O CNJ i« ro cn
?- * * *S CM CM IO (O »-
^- ^ to cn c
00000 C
0 1 1 1 I
SSS3Sy+ * + +
O cn o ^H r»O i « r CM r«* ic
. o 10 CM ao c\— t o ^t CM CM u
1S5^ '3S r-« CO 10 CM CS
cn o -H CM u
ID lO
8
1 ^ (*i1 >o«
M CO Q•7 (VM
1 CO CO
3 22
S SSA J.J,» »
• :•„"
' 7>'
3 O O
3 0*0
S SS
? S5
i ssj ro CM
-. CM H
J ,"M CM
•> LO -J1
ss11(O r .
0
CO COf- r««<• w
9 '
CMOOCM
° fc
o ato en
?F•-O Cr . c
S 2CM f
siSCM
r-t IG
* =;?
^.88
»
f
i - ^<a &
*J >» CM
" §• -D? . w c
If5 7He 1IO 3 L. -
^£2 Ie ir, B "3i_ cy t. w 31
*&* -'ti Etl ^?E cn E^ -^ j «• *T
d) ra <u ajU 1/1 C
<U 1_ CU (0 1-
f f« f f . *3il^s^si1> Q- > S '^ "-Q« ^ O-D o <*- cn
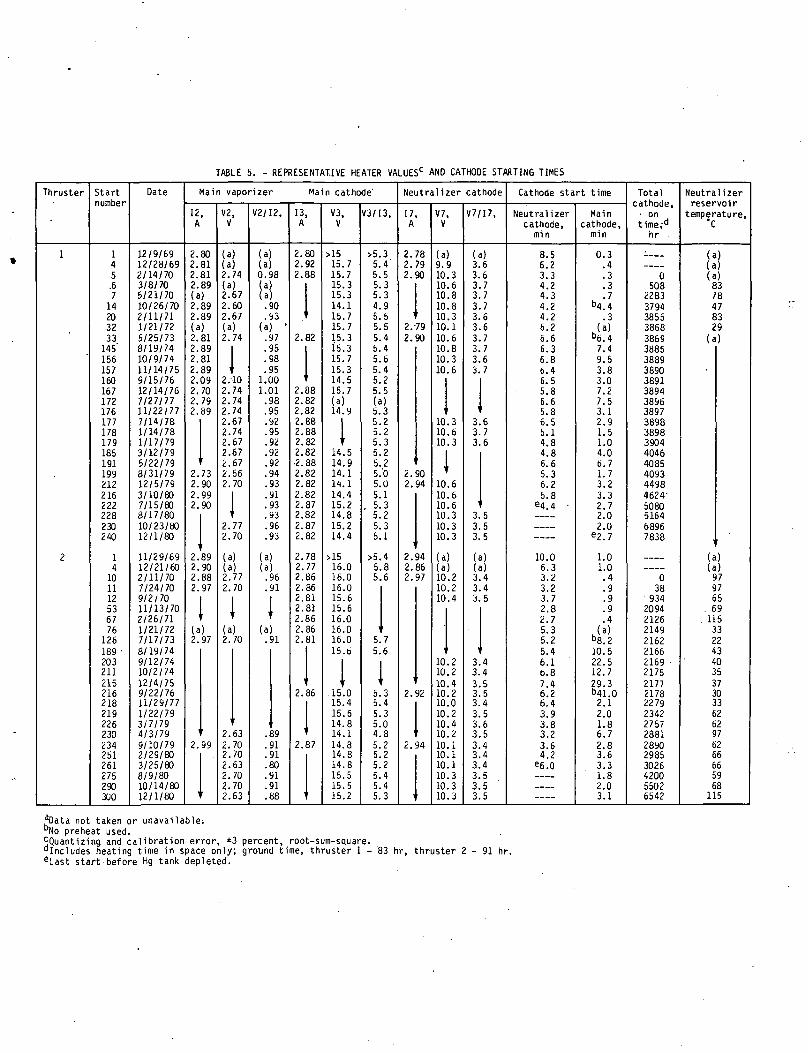
TABLE 5. - REPRESENTATIVE HEATER VALUES0 AND CATHODE STARTING TIMES
Thruster
1
2
Startnumber
145.67
14203233
145'156157160167172176177178179185191199212216222228230240
14
101112536776
126189 •203211215216218219226230234251261275290300
Date
12/9/6912/28/692/14/703/8/705/21/7010/26/702/11/711/21/725/25/738/19/7410/9/7411/14/759/15/7612/14/767 / 2 7 / 7 711/22/777/14/781/14/781/17/793/12/795/22/798/31/7912/5/793/10/807/15/808/17/8010/23/8012/1/80
11/29/6912/21/602/11/707/24/709/2/7011/13/702/26/711/21/727/17/738/19/749/12/7410/2/7412/4/759/22/7611/29/771/22/793 / 7 / 7 94 /3 /799/10/792/29/803/25/808/9/8010/14/8012/1/80
M a i n vaporizer
12,A
2.2.2.2.
80818189
(a)2.2.
8989
(a)2.2.2.2.2.2.2.2.
2.2.2.2.
.2.2.2.2.
8189818909707989
73909990
89908897
( a )2.
2.
i
97
99
V2,V
(a)(a)2.74(a)2.672.602.67(a)2. 74
2.102.742. 742.742.672.2.
7467
2.672.2.2.
'2.2.
675670
7770
(a)(a2.2.
7770
(a)2.
2.2.2.2.2.2.
70
637070637070
2.63
V 2 / I 2 ,
(a(a)0.98(a)(a.90.93
(a) '.97.95.98.95
1.001.01.98.95.92.95.92.92.92.94.93.91.93.93.96.93
(a )(a).96.91
,'(a).91
'.89.91.91.f30.91.91.88
M a i n cathode'
13,A
2.802.922.88
2.82
2. 382.822.822.882.882.822.82•2.882.822.822.822.872.822.872.82
2.2.
7877
2.862.862.812.812.862.862.81
'2.86'
,
2.87
'
V3,V
>1515.715.715.315.314.115.715.715.315.315.715.314.515.7( a )14.9
111
14.514.914.114.114.415.214.815.214.4
>1516.016.016.015.615.616.016.016.015.6
11f
.15.015.415.614.814.114.814.814.815.515.515.2
V3/ I3 ,
>5.5.'5.5.5.4.5.5.5.5.5.5.5.5.
34533955446425
(a)5.5.5.5.5.5.5.5.5.
. 5.5.5.5.
>5.5'5
l
5.5.
5.5.5.5.4.5.5.5.5.5.5.
322322'0013231
486
76
34308222443
Neutral izer cathode
17,A
2.782.792.90
2.792.90
'
2.902.94
1
2.942.862.97
2.92
2.94
'
V7V
1
(a)9.10101010101010101010
'101010
101010101010
9.3.6.8.8.3.1.6.8.3.6
.3
.6
.3
.6
.6
.6
.3
.3
.3
(a )( a )101010
1
1010101010101010101010101010
.2
.2
.4
.2
.2
.4
.2
.0
.2
.4
.2
.1
.1
.1
.3
.3
.3
V 7 / I 7 ,
(a )3.3.3.3.3.3.3.3.3.3.3.
'3.3.3.
3.3.3.
66777667767
676
555
( a )(a )3.3.3.
i3.3.3.3.3.3.3.3.3.3.3.3.3.3.
445
44554565444555
Cathode start time
Neutral izercathode,
m i n
8.56.23.34.24.34.24.26.26.66.36.86.46.55.86.65.86.55.14.84.86.65.36.25.8
e4.4 •
10.06.33.23.23.72.82.75.35.25.46.16.87.46.26.43.93.83.23.64.2
66.0
M a i ncathode,
m i n
0.3.4.3.3.7
b4.4.3
( a )b6.4
7.49.53.83.07.27.53.12.91.51.04.06.71.73.23.32.72.02.0
e2.7
1.01.0.4.9.9.9.4
( a )b8.210.522.512.729.3b41.02.12.01.86.72.83.63.31.82.03.1
Totalcathode,
• ontime,-d
hr .
!
0508
22833794385538683869388538893890389138943896389738983898390440464085409344984624'5080516468967838
038
' 934209421262149216221662169 •2175217721782279234227572881289029853026420055026542
Neutral izerreservoir
temperature,"C
( a )(a )( a )8378478329
( a )
,
(a)(a)979765
. 6911533224340353730336262976266665968
115
*Data not taken or unavailable;bNo preheat used.cQuantizing and calibration error, ±3 percent, root-sum-square."Includes heating time in space only; ground time, thruster I - 83 hr, thruster 2 - 9 1 hr.eLast start-before Hg tank depleted.

TABLE 6. - SUMMARY OF NEUTRALIZER FLOW RATES AND N2 DIFFUSION RATES
(a) Neutral izer tank 1
Period name
1969-70 prelaunch testing1970 normal beam, 250 mA1971-79 restarts/ storage1979-80 plasma-mode operation222 cool down, after flow periods1980 hot, Hg tank empty
Operatingperiod,
hr
0-83.83-3877
3877-41664166-4991
C4991-6496
Differentialhours
Oper.1
833794289825
Calendar
12483815
&81.1007600
1505
Mercury flow
Space
Total,gms
2065066188O Q
0
Rate,mA
22±240 (est)
46±6
0
Ground
Rate,•mA
40 (est)18±1
47±10
Tanktemp . ,
°C
2398
«35 to 60105
105
N2 loss by dif-ussion (avg. ) ,
N/cm2/hr
o.ooexioH0.27xlO~4
0.02 to'0.12xlO-40.35xlO~4
8.3xlO-4
(b) Neutral izer tank 2
Period name
1969-70 prelaunch testing1970 normal beam, 250 mA1971-79 restarts/ storage1979-80 low beam, 85 mA1980 plasma-mode operation261 cool down, after flow periods1980 cold, Hg tank empty1980 hot, Hg tank empty
Operatingperiod,
hr
0-6363 2080
2080-23592359-29652965-3870
4120-63006300-9200
Differentialhours
Oper.
632017269606905
Calendar
12245905
b76,50017501004
21702900
Mercury flow
Space
Total,gms
2031784133389I I00
Rate,mA
21±340 (est)
35±645*6
00
Ground
Rate,mA
40 (est)20±1
36±247±10
Tanktemp.,
°C
2398
«35 to 6098105
60105
N£ loss by dif-ussion (avg.),N/cm2/hr -
o.ooexicr40.4xlCT4
0.02 to 0.12xlO-4
0.4xlO-40.5xlO-4
l.SxlO-47.2xlO-4
aTemperature range due to various lengths of spacecraft shadowing periods.bHg lost through vaporizer during storage periods was calculated at 0.5 gm total for mission.CN2 pressure at zero counts (<0.17 N/cm').
TABLE 7." - SUMMARY OF ESTIMATED FLOW RATES, MAIN TANK, SYSTEM 1
Operating period
1969 prelaunch testing1970 full beam (250 mA)1970-72 short-clearing tests .1973-78 operation (146 starts)240 starts: prestart overshoot
cool down after flow1979-80 discharge operation:
C anode (40 v.)B anode (33 v. )
Total used, estimatedTotal loaded (useful)Difference (1.6 percent)
Time,hr
8337947236
5533390
Estimatedflow,mA
291 •291100135
—135184
Hg,gm
1818,260
54341629
5634,660
13,83014,050
220alncludes 4 gm He
storage periocestimated lost through vaporizer durings (30° to 50° C).

SPIN AXIS
-^1980N\
(PITCH AXIS) \
GROUND-' TRACKING
STATIONS
- E
NEAR-POLARCIRCULARORBIT
SPIN-STABILIZED POSITIONCMon
VEHICLE COORDINATE SYSTEM IN ORBIT VIEWED FROM SUN
Figure 1. - SERTII spacecraft in orbit Artist's conception).

o
rgJ
<_)>-,21_TOL_CD
1•O
n>_>,
a
oiwI
CNJ
E&
cm
Q.1/1
oLU
o.co
', CONTINUOUS , PARTIAL-^SUNLIGHT * SHADOW
CONTINUOUSSUNLIGHT
DESPIN USINGCOLD GAS SYSTEM
6 - CONTINUOUS_ SUNLIGHT
— T/S-2PLASM A MODE -
DAY OF 1979
(a) 1979.
PARITAL CONTINUOUS SUNLIGHT
SHADOWUNTIL DAY 120, 1981'
100 200DAY OF 1980
300
(b) 1980.
Figure 4. - Plot of SERTII spacecraft spin rate.

-103 m i J
.,.---N-.T tm3 (A™™ !-- ------ -CURRENT NEUTRALIZATIONFROMT/S-l(UPT085mA)
-25 M/cnr
(AMBIENT)
AMBlE^frELECTRONFLUX; ~<lmA/m \JONS~85mA ^EXCESS ELECTRONSOF BEAM LENGTH
. PRIMARYBEAMNi~108/cm3
IONS~9mAs
•^NrUTRALIZER
. ,J ,^-lm R ,^^^^ N=-108/cm3
r NEUTRALIZER \/ Ni-loAcm3 N
' IONS-2mA \
VMAIN DISCHARGED\ • i i rtlOl 3Nr
CD-108M-31
Figure 5. - Spacecraft plasma current diagram.

OO
<S< CO CO LU
_1 CSJ CVJ< I I
O LU LU
Of
O
I !I i
•a_N
"2
•5
CQ<U00
Oto
a: aj .«1 EO (D
S110A 'iVIiNlLOd
SS3CO O
OD
30V110AWV39
30V110AUVM033VdS
'NOISSIW3iN30y3d

o 5 o
iS St< S
O <S" LU S
Qd ^ Q_ -- — ___
1— S LUZ3 O 00 1— ._LU Qi O = ( ' :^Z. LL. Q; S I
0 1 'I |
LU l
p^ ^O
o
1 1
LU '
x' ^2
^s
— "^ \
\
1 1 1 1 ! 1
S <;S o
20 40
60
80
•RAL
IZAT
1 O
N F
ROM
MA
IN -
Figu
re 7
. -
Con
clud
ed.
^~
LU
e~* ^3 c? CJ -^D O ^3 ^3 ^P G> ^3 ^3 ^3 Olf\ ^ fft CVJ i-H i— 1 CSJ f^ ^ IA ^O Is*- *— '
S110A 'iVIiNlLOd
fe • <
L U ^ O O C O^^^ I I M. IJ CM• •
cm ,
o
IQ_
sg£»;§•-Q- —I I
. *i ----
0o^
0oo S
Q 1—il— 0 =
6 Vo6-
S
_= S
oo
S ° S 8 R s
S110A 'IVIiNlLOd

CO
to ^ < 2 -j•* LU CO S ^-J ^ _ O fZ0. z > 0- z
O^ ,_LDz^ ioD£ ^~
SO ° LU i—I UJ I
R ^ CNJ ft; ty
g
g
§p
O <"Z ~r"™" rtj
^ *UJQ.OCVII
S OOJI
0 1—01 =3o r; tyCQ (OO ~QiO.
CO i/1 *—E T Q>~ _«
^£ 1Q- „ ra
"S E 3= h
• ^O^ 3^— 1_
A 'lVUN310d
CO
CO "
> •
o
I j
JD.ro_
E oi i—i
-i ta? <L>r= CO
:iu E>M <|.
"- &o> oS
I I
o> i_C CD
.2 i_
SilOA 'iVUNliOd

CO
oLUO
JL c_>LU
o
O
a; a
CO>CO
0£.
&CO
I I
.aro
O t±ivO Z co
~ >-
OfLTV LLJ
a.o
CO
o
c^ 'I
i
cfI—I
£3.21
(indNI A 09 01 Q3ZHVWilON)39yVH3SIQ ON '39V110A y3d33>l NIVW
A '1VllN3iOd

O
oo
>-
e s
= £a; ?r
0)1 '8I/8A '33NVlSIS3ilH3d33>i
Of.
o
o
O LU"Z. CO
<E
I I I
& Oi5<
ij=
o
00 00
Oir\CM
k-o
LUCO, ,v
Ub.
~ %
& Ofu5 ^= =
•* Q! iUJ ^LiJ ^< eI
CVI LU
ze1.
- N
eu

PRESSURE
LIQUID/ MERCURY
BUYTLRUBBER
\ BLADDER' ^ ' mm thick
TEMPERATURESENSOR
,-304 STAINLESS STEEL WALLS
TO VAPORIZER
^PERFORATED LINER FORLAUNCH VIBRATION SUPPORT
Figure 13. - Schematic of neutralizer propellant tank construction design.
u
<Co
rSENSORLIMIT
25
G 20o8
15
10
1971-79 RESTARTS
11970'-'-OPERATION"-_ 250 mA
"-_ BEAM
/ / OPERATIONPLASMA-MODE
^Hg TANK EMPTY
r- TANK HOT
1
•GAS TANK' EMPTY
2000 4000 6000OPERATING TIME, HRS
8000
(a) NEUTRALIZER TANK-L
Figure 14. - History of neutralizer tank pressure.

a 25
250 mABEAM ^HtV< SHORT
r OPERATION //-Wl-78 RESTARTS/-1979-80 operation
/ 85 mA BEAM
/ /- Hg TANK EMPTY^m
"E 20'SENSOR ••
P.IMIT
o
15
10
00
\ 1
/-TANK HOT
ATANK COLD
t/
0 2000 4000 6000 8000 10,000OPERATING TIME, HRS
(b) NEUTRALIZER TANK - 2.
Figure 14. - Concluded. History of neutralizer tank pressure.

1. Report No.
NASA TM-816854. Title and Subtitle
2. Government Accession No.
SERT H 1980 EXTENDED FLIGHT THRUSTER EXPERIMENTS
7. Author(s)
W. R. Ker slake and L. R. Ignaczak
9. Performing Organization Name and Address
National Aeronautics and SpaceLewis Research CenterCleveland, Ohio 44135
12. Sponsoring Agency Name and Address
National Aeronautics and SpaceWashington, D.C. 20546
15. Supplementary Notes
Administration
Administration
3. Recipient's Catalog No.
5. Report Date
6. Performing Organization Code
506-55-328. Performing Organization Report No.
E-69510. Work Unit No.
11. Contract or Grant No.
13. Type of Report and Period Covered
Technical Memorandum14. Sponsoring Agency Code
Prepared for the Fifteenth International Electric Propulsion Conference cosponsored by the AmericanInstitute of Aeronautics and Astronautics, the Japan Society for Aeronautical and Space Sciences, andDeutsche Gesselschaft fur Luft- und Raumfahrt, Las Vegas, Nevada, April 21-23, 1981.
16. Abstract
The SERT H spacecraft, launched in 1970, hasmittent status since 1971. This paper presentsthrough December 1980. Nearof thruster endurance, testing.
been maintained in an operational, but inter-the flight results obtained from mid 1979
continuous solar power in 1979 and 1980 has enabled long periodsThree of four propellant tanks have been exhausted with no signif-
icant change in thruster system operation before being empty. A new plasma mode thrust hasbeen characterized and direct thrust measurements obtained. Other tests, including beamneutralization by various neutralizer sources, give insight to electron conduction across plasmasin space and provide a basis to
i17. Key Words {Suggested by Authcr(s) )
Ion thruster! Spacecraft propulsioni
i
19. Security Classtf. (of this reoo'tii; Unclassified
model neutralization of thruster arrays.
-
18. Distribution Statement
Unclassified. - unlimitedSTAR Category 20
20. Security Classif. (of this page)
Unclassified21. No. of Pages 22. Price'
' FQ: sale by i he National Technical Information Service. Springfield. Virginia 22161

National Aeronautics andSpace Administration
Washington, D.C.20546
Official Business
Penalty for Private Use, $300
SPECIAL FOURTH CLASS MAILBOOK
Postage and Fees PaidNational Aeronautics andSpace AdministrationNASA-451
NASA POSTMASTER: If Undeliverable (Section 158Postal Manual) Do Not Return


