Sequencing the real time of the elderly: Evidence from ... · Sequencing the real time of the...
36
DEMOGRAPHIC RESEARCH VOLUME 35, ARTICLE 25, PAGES 711−744 PUBLISHED 14 SEPTEMBER 2016 http://www.demographic-research.org/Volumes/Vol35/25/ DOI: 10.4054/DemRes.2016.35.25 Research Article Sequencing the real time of the elderly: Evidence from South Africa Erofili Grapsa Dorrit Posel ©2016 Erofili Grapsa & Dorrit Posel. This open-access work is published under the terms of the Creative Commons Attribution NonCommercial License 2.0 Germany, which permits use, reproduction & distribution in any medium for non-commercial purposes, provided the original author(s) and source are given credit. See http:// creativecommons.org/licenses/by-nc/2.0/de/
Transcript of Sequencing the real time of the elderly: Evidence from ... · Sequencing the real time of the...

DEMOGRAPHIC RESEARCH VOLUME 35, ARTICLE 25, PAGES 711−744 PUBLISHED 14 SEPTEMBER 2016 http://www.demographic-research.org/Volumes/Vol35/25/ DOI: 10.4054/DemRes.2016.35.25 Research Article
Sequencing the real time of the elderly: Evidence from South Africa
Erofili Grapsa
Dorrit Posel
©2016 Erofili Grapsa & Dorrit Posel. This open-access work is published under the terms of the Creative Commons Attribution NonCommercial License 2.0 Germany, which permits use, reproduction & distribution in any medium for non-commercial purposes, provided the original author(s) and source are given credit. See http:// creativecommons.org/licenses/by-nc/2.0/de/

Contents
1 Introduction 712 2 Context 713 2.1 Postretirement use of time 713 2.2 The South African context 714 2.3 Time use studies of South Africa 715 3 Methods 716 3.1 Data 716 3.2 Mean added time 717 3.3 Features of real time data 718 3.4 Optimal matching 718 3.5 Cluster analysis 719 3.6 Multinomial logit regression 720 4 Results 720 4.1 Descriptive analysis of time use among the elderly 720 4.2 Cluster analysis 724 4.3 Regression analysis 727 5 Discussion and conclusion 730 6 Acknowledgements 733 References 734 Appendix 738

Demographic Research: Volume 35, Article 25 Research Article
http://www.demographic-research.org 711
Sequencing the real time of the elderly: Evidence from South Africa
Erofili Grapsa1
Dorrit Posel2
Abstract
BACKGROUND Understanding how the elderly in developing countries spend their time has received little attention. Moreover, the potential of time use data to discern variation in activity patterns has not been fully realized by methods which use a mean added time approach.
OBJECTIVES To uncover patterns of time use among the elderly (60 years and older) in South Africa by applying an innovative methodology that incorporates the timing, duration, and frequency of activities in the analysis.
METHODS We use sequence analysis, which treats the daily series of activities of each individual as a sequence, and cluster analysis, to group these sequences into common clusters of time use behaviour. We then estimate multinomial logit regressions to identify the characteristics of the elderly which predict cluster membership.
RESULTS We find that the time use behaviour of the elderly in South Africa can be divided into five distinct clusters, according to the relative importance in their day of personal care, household maintenance, work, mass media, and social or cultural activities. In comparison to men, women are overrepresented in the cluster where household work dominates, while they are underrepresented in the cluster of the elderly who engage in production work. A range of other individual and household characteristics are also important in predicting cluster membership.
1 Research Associate, Institute of Social and Economic Research, Rhodes University, South Africa. E-Mail: [email protected]. 2 Professor and Helen Suzman Chair, School of Economic and Business Sciences, and lead investigator in the DST-NRF Centre of Excellence in Human Development, University of the Witwatersrand, Johannesburg, South Africa. E-Mail: [email protected].

Grapsa and Posel: Sequencing the real time of the elderly: Evidence from South Africa
712 http://www.demographic-research.org
CONTRIBUTION Sequence and cluster analysis permit a nuanced examination of the differences and commonalities in time use patterns among the elderly in South Africa. There is considerable potential to extend these methods to other studies of time use behaviour.
1. Introduction
With an increase in the life expectancy of older adults, a growing body of research has developed in recent decades exploring how the elderly spend their time. In describing the nature, determinants, and consequences of time use among the elderly, studies consistently find evidence of gender differences in time allocation and, particularly, a persistent gender division in housework (cf. Bengtson, Rosenthal, and Burton 1990; Szinovacz 2000; Gauthier and Smeeding 2003; Solomon, Acock, and Walker 2004; Leopold and Skopek 2014).
Much of the research that has investigated the time use of the elderly has been conducted in developed-country contexts where there is little variation in household form, and where older adults often live in single-generation households. In this study we investigate the time allocations of the elderly in South Africa, a developing country with a plurality of family types, where many of the elderly live in multi-generational households.
We analyse data collected in the 2010 Time Use Survey, a nationally representative household survey which collected a daily time diary from approximately 39,000 individuals in South Africa. This time data is typically analysed using a mean added (or total) time approach. This is a useful and convenient method to describe the daily use of time and how this varies, for example, by gender and age. However, in this study we augment this method by using sequence and cluster data methods to analyse the real time of the elderly. These methods allow us to create a typology of time use behaviour among the elderly, based not only on the total amount of time allocated to different activities but also on the series of activities undertaken during the day, and on their timing and ordering.
We focus on gender differences in the daily activities of the elderly in South Africa, but we also consider how time use patterns vary according to other characteristics of the elderly, including the composition and economic status of their household. In the next section we review the South African context, and in section 3 we describe the data that we analyse and the sequence and cluster methods which we use in our analysis. In sections 4, 5, and 6 we present and discuss our empirical analysis, and in the final section we conclude with a discussion of our main findings.

Demographic Research: Volume 35, Article 25
http://www.demographic-research.org 713
2. Context
2.1 Postretirement use of time
Until a few decades ago, retirement was assumed to be the period of rest in an individual’s life course, where the elderly would slowly disengage from society (Boudiny 2013). However, with an increase in life expectancy, particularly in developed countries, time spent in retirement has increased considerably, and a large body of literature has developed which investigates how the elderly spend their time. This work is motivated, in part, by the consequences of population ageing for the health care system (for example), and for demand on the public purse more generally.
In the late 1990s the World Health Organisation adopted the concept of active ageing (Walker 2002; Boudiny 2013), which can be broadly defined to include not only paid employment and physical activity but also leisure activities that require mental (and not necessarily physical) effort or that involve social interaction, as well as education, participation in community life, for example, through volunteering work, and active engagement in household work and the care of others (Boudiny 2013). Active ageing is seen as a key ingredient to successful ageing and is associated with higher levels of life satisfaction and good health among the elderly (Gauthier and Smeeding 2003).
A particular focus of this literature is whether and how patterns of time use and activity vary by gender. Studies have consistently found that among working‒age adults, women spend more time on housework and on the provision of care (to children and kin) than men (Baxter 1997; Gerstel 2000; Bianchi, Robinson, and Milkie 2006). As adults age, however, the demands of work and family life change: when children leave the home, less housework and childcare needs to be provided, and retirement from full-time employment reduces the work‒home trade-off. Yet many studies have found that a gender division of labour in housework and care activities persists among the elderly, even if the time spent by men on these activities increases following retirement (cf. Bengtson, Rosenthal, and Burton 1990; Szinovacz 2000; Gauthier and Smeeding 2003; Solomon, Acock, and Walker 2004; Hank and Jürges 2007; Leopold and Skopek 2014)
Much of this literature has focused on the time-use behaviour of the elderly in developed countries (particularly in North America and Europe). This is unsurprising, as few developing countries collect time use data. South Africa is one of only a few countries in Africa to have conducted these surveys (Statistics South Africa 2013), and it is a particularly interesting developing country in which to study the time allocations of the elderly.

Grapsa and Posel: Sequencing the real time of the elderly: Evidence from South Africa
714 http://www.demographic-research.org
2.2 The South African context
For many South Africans the nuclear family is not the dominant social unit, and the transitions in household forms that are typically associated with ageing in developing countries (such as the ‘empty-nest’ syndrome) are less common. According to the 2011 Population Census data for South Africa, for example, only 13% of the elderly (60 years and older) live alone and a further 13% live with only one other elderly person. However, this also varies substantially according to the elderly’s (self‒reported) racial classification: Whites are the most likely to live alone or with another elderly person (58%) while Africans are the least likely (16%).3
Domestic practices in South Africa continue to be shaped by culturally specific practices. The conjugal unit as the basis for household formation historically applies only to a minority of (particularly White) South Africans. The African tradition of family formation, by contrast, is based on a consanguineal and specifically patrilineal system of descent (Russell 2003). This system proved “resilient and adaptable” (Russell 2003: 10) as socioeconomic circumstances for Africans changed during apartheid and then during the post-apartheid decades.
Kin relations have been very important in helping to absorb the negative consequences of stubbornly high rates of unemployment and a high prevalence of HIV/AIDS. Research emphasizes the importance of particularly grandmothers in providing financial and physical support to coresident young children (Duflo 2003; Case and Menendez 2007; Schatz and Ogunmefun 2007). An important source of the financial support derives from the social pension, a means-tested and noncontributory social grant paid to men and women on reaching the age of 60.4 The large majority of elderly South Africans receive this grant, most of whom are elderly Africans (Budlender and Lund 2011).
Studies of pension receipt and the living arrangements of the elderly in developed countries have found very strong empirical support for the receipt of a pension enabling the elderly to live independently (cf. Costa 1997; 1999, Engelhardt, Gruber, and Perry 2002). In South Africa, by contrast, there is no evidence that eligibility for the social pension increases the likelihood that the elderly will live independently of other family members (Edmonds, Mammen, and Miller 2005). Household living arrangements do change with pension receipt. However, Edmonds and coauthors (2005) find that the social pension is associated with an increase in the number of young children and young
3 Own calculations using the 2011 South African Population Census data (weighted 10% sample). 4 In the post-apartheid period the age eligibility for women to receive the social pension has always been 60 years, but for men the age threshold was lowered from 65 to 63 years in 2008, to 61 years in 2009, and to 60 years in 2010.
Demographic Research: Volume 35, Article 25
http://www.demographic-research.org 715
women (18‒23 years) in the pensioner’s household, and a decrease in the presence of prime working-age women (30‒39 years) (see also Ranchhod and Wittenberg 2016).
Subsequent studies have shown that the receipt of the social pension by elderly women is associated with the labour migration of working-age women from pension-receiving households (Posel, Fairburn, and Lund 2006; Ardington, Case, and Hosegood 2007). This may be because the social pension relieves income constraints on migration, and also because with the receipt of the pension, grandmothers are able to provide financially for the children who are ‘left behind’. There is also evidence that given very high unemployment rates and no state support expressly for the unemployed, the unemployed attach themselves to households in which social pensions and other sources of income are received (Klasen and Woolard 2009).
While the role of grandmothers as the physical and financial carers of children is highlighted in this literature, to our knowledge there has been little empirical work which describes the daily activity patterns of elderly women more comprehensively, or which considers how elderly men in South Africa spend their time.
2.3 Time use studies of South Africa
To date, two time use surveys have been undertaken in South Africa, in 2000 and 2010, both by Statistics South Africa (StatsSA), the official statistical agency in the country. Studies using these surveys find clear evidence of a gender division of labour, with women spending far more time on domestic and care activities and men allocating more time to production activities (Budlender, Chonokoane, and Mpetsheni 2001; Charmes 2006; Guryan, Hurst, and Kearney 2008; Wittenberg 2009; Statistics South Africa 2013; Ranchhod and Wittenberg 2016).
However, the time allocations of the elderly have not been the focus of time use research in South Africa, and in some cases where studies consider prime-age adults or parents with coresident children, the elderly are excluded from the sample. One exception is a recent study by Ranchhod and Wittenberg (2016), which considers time use among Africans who do not live alone. The main objective of the research is to explore whether the time allocations of prime-aged adults change if they live in pension-receiving households. But the study also examines whether time allocations (and household composition) of adults change at the point where they become age-eligible for the pension. The research identifies a decline in paid work among elderly men at pension age but a (smaller) increase in the average time spent in informal production. Prime-age women living with pensioners do less childcare but, perhaps surprisingly in light of other research, there is no evidence that time allocated to childcare is higher among (female) pensioners than among other adults.

Grapsa and Posel: Sequencing the real time of the elderly: Evidence from South Africa
716 http://www.demographic-research.org
Studies which analyse time use data in South Africa employ a mean added (or total) time approach, an approach which is also commonly adopted in studies of time use data in other countries. The total time which each individual spends on a particular activity is averaged over individuals, and then compared by gender, race, or other kinds of characteristics.
In this study we seek to add to the literature in two ways: first, through a focused examination of time use patterns among the elderly in South Africa, and second, by applying methodologies that allow us to analyse the real time of the elderly, which includes not only the duration of activities but also their timing during the day – when they occur, and in what sequence. By detailing and comparing time allocations across more dimensions, the approach permits a more textured description of time use behaviour among the elderly, and a richer analysis of the differences and similarities in this behaviour across the elderly population.
We explore time use patterns through the prism of gender because we are interested in whether the days of elderly women and men in South Africa are structured differently, in ways consistent with a traditional gender division of labour. But we also consider whether there are cleavages in time use patterns according to a range of other characteristics that reflect the cultural and economic diversity of the elderly population and the households in which they live.
3. Methods
3.1 Data
We analyse data collected in the 2010 South African Time Use Survey (TUS), a large and nationally representative survey of the noninstitutional population5 conducted by Statistics South Africa (StatsSA). Of a sample size of 39,018 individuals, 5,078 (or 13%) are elderly adults aged 60 or older.
The TUS was conducted in the fourth quarter of 2010, with information collected in the last week of each month. The sample was selected through a three‒stage sampling process: on enumeration areas or primary sampling units (PSUs); on households within PSUs; and then on two individuals (aged 10 or older) within the household. Sampling weights are provided to adjust for the probability of inclusion in the sample and for non‒response, and they have been used throughout the analysis.
Time use is captured through a time diary for the 24 hours before the survey (from 4 a.m. to 4 a.m. of the day of the interview) (Statistics South Africa 2013). In addition
5 The sample also excludes those living in worker hostels.

Demographic Research: Volume 35, Article 25
http://www.demographic-research.org 717
to the diary, a household questionnaire was administered to identify the household roster and to collect household-level information, and a person‒level questionnaire was administered to the two individuals selected per household.
To post-code the activities that were reported in the time diaries, StatsSA used a classification system developed by the United Nations Statistical Division that creates categories consistent with the System of National Accounts (SNA). Ten activity types are identified across the three broad categories of SNA production, non-SNA production, and nonproductive activities. In our analysis we grouped the three SNA production activities into a single category of ‘work’, representing formal employment, home-based production and informal work, and primary production (including subsistence farming). We retained the three distinct activity types for non-SNA production (household maintenance, care of persons, and community service), and the four for nonproductive activities (personal care,6 learning, mass media use, and social or cultural activities), yielding eight distinct activity groups or types.
In the TUS, activities were recorded in 30‒minute slots where up to three activities could be recorded per slot as either sequential or simultaneous activities. Of the 243,744 timeslots for the elderly, only 8.7% (21,188) have multiple activities, and of these, 66.7% are sequential and 33.3% are simultaneous.
3.2 Mean added time
In Section 4 we describe the time use of the elderly first by reporting the average total time that the elderly spend on each of the eight activity types in the day, and how this varies between elderly women and men. We consider three different ways of aggregating time, taking multiple activities into account. First, we allocate the full 30 minutes to the first activity reported; second, we use the ‘divided’ time approach where the 30-minute slot has been divided by the total number of sequential and simultaneous activities; and third, we include the ‘full’ time spent in each simultaneous activity, so the day may add up to more than 24 hours. Given that the reporting of sequential and simultaneous activities among the elderly is low, we find only small differences in mean-time allocations using the different methods. In the remainder of the analysis we focus on the first activity reported for each time slot7, but we tested that our results were robust to modelling on the second activity where this was reported.
6 Consistent with this classification system, we retain sleep as part of personal care, rather than present this as a separate activity type. The majority of time slots allocated to personal care (66%) are spent on sleep, and all remaining activity types occur during waking hours. 7 Given the computational requirements of the sequence methods which we use, we did not further sub-divide the thirty minute slots into fifteen or ten minute slots.

Grapsa and Posel: Sequencing the real time of the elderly: Evidence from South Africa
718 http://www.demographic-research.org
Mean time allocations are a useful way of summarising time use behaviour, but these measures do not incorporate information which is also available in time diaries, on how activities are ordered during the course of the day or their timing or frequency (Gershuny and Sullivan 1998). They therefore say little about the structure and rhythm of time allocations during the day, and this limits our ability to discern and compare overall patterns in time use among the elderly.
3.3 Features of real time data
To add to the description, and to further the analysis of variation in time allocations, we therefore use an approach that analyses the real time of the elderly. We consider the whole series of a person’s activities during the 24-hour period, with each activity representing a state that has a starting time and a duration, and that begins when the previous state ends. This ordered set of states (activities) represents a sequence. Within each sequence there are 48 points, capturing the number of half‒hour slots in the day. For example, a possible sequence for a 24-hour day which starts at 4 a.m., is personal care (8) – work (10) – personal care (2) – work (6) – personal care (2) ‒ mass media use (4) – personal care (16), with the number in parenthesis denoting the number of half-hour slots over which this activity is reported.
Using the daily diaries we identify an activity sequence for every elderly person in the sample and, as there are no missing data for the time slots of the elderly, this yields 5,078 sequences. To analyse this sequence data8 we use optimal matching (OM) techniques and cluster analysis.
3.4 Optimal matching
OM methods were first developed in computer sciences, and were then incorporated into other scientific fields (particularly to analyse protein and molecule sequences) (Lesnard 2010). They have since been applied in the social sciences, where they have been used to analyse life trajectories, career paths, and school to work transitions (cf. Abbott and Forrest 1986; Halpin and Chan 1998; Abbott and Tsay 2000; McVicar and Anyadike‒Danes 2002), and, in a small number of studies, to analyse time diaries (Lesnard 2004; 2008; 2010; Vrotsou, Ynnerman, and Cooper 2014).
OM methods provide a measure of the similarity (or dissimilarity) between sequences by calculating the distance between sequences. The OM distance is a
8 The dataset used for sequence analysis is in wide format, with one row (activity sequence) per individual.

Demographic Research: Volume 35, Article 25
http://www.demographic-research.org 719
measure of the minimum combination of operations that would be needed to convert one sequence into another, where these operations represent the replacement, insertion, and deletion of sequence states.9 Two identical sequences would require zero operations and their distance measure would therefore be zero, while the maximum theoretical OM distance between any two sequences (using the predetermined operation costs for this analysis) is approximately twice the maximum length of the sequence (Gabadinho et al. 2011).10 (A simplified example of how the distance measure between sequences is calculated is included in the Appendix.)
3.5 Cluster analysis
We then perform cluster analysis using the dissimilarity (distance) measure which we obtain from OM. Cluster analysis is suitable for studying the internal structure of multidimensional and complex data such as sequence data, which cannot be described only through classical statistics such as mean and variance. The analysis groups sequences that are similar to each other (according to a certain criterion) into clusters. We use agglomerative hierarchical clustering to construct a hierarchy of clusters (Rousseeuw and Kaufman 2008). The algorithm begins by assigning each sequence its own cluster and then merging the nearest clusters until a large cluster remains.
The algorithm requires defining cluster proximity, and several methods are available in the literature. Of these methods, Ward’s method (Ward Jr. 1963) provided the most distinct final clusters and was therefore chosen for the analysis. In Ward’s method each cluster is represented by its centroid (mean), and proximity is measured by the increase in the error sum of squares (SSE)11 that occurs from merging two clusters. Ward’s method attempts to minimise the sum of squared distances of points from their cluster centres. The OM distance matrix is used at each step to obtain the cluster centres and to update the distance between the newly created clusters following a merge.
9 Each of these operations is assigned a ‘cost’ and, to measure distance, the OM algorithms identify the combination of operations with the lowest cost. We used the transition rates from one activity to another to obtain the substitution cost matrix, and a fixed cost equal to one for insertion and deletion costs. These costs have been used extensively in the literature, and they proved at least as effective at identifying distinct activity patterns as other costs for our dataset. For a review of the different distance measures used in the literature, see Studer and Rischard (2016). 10 The distance measure is a matrix of minimum distances between each sequence. In our sample, this is a 5078×5078 matrix. The number of distances to compute between each sequence is therefore (5078×5077)/2 = 12,890,503. 11 SSE is the sum of the squared differences between each observation and its group mean. It can be used as a measure of variation within a cluster, since if all observations within a cluster are identical the SSE would be equal to zero. With Ward’s method, after all potential cluster merges are considered, the one within which the observations are closest to the cluster mean is chosen.

Grapsa and Posel: Sequencing the real time of the elderly: Evidence from South Africa
720 http://www.demographic-research.org
After visually inspecting the dendrogram of hierarchical clustering (shown and discussed in the Appendix), as well as the final activity distribution graphs, we identified five distinct clusters of activity patterns among the elderly. These clusters are mainly distinguished by the relative importance of personal care, household maintenance, working, the use of mass media, and social or cultural activities in the elderly’s day. The clusters are described in Section 5.
3.6 Multinomial logit regression
We use multinomial logit regression analysis to identify which characteristics of the elderly, or of their households, predict their membership in one of the five clusters.12 In addition to gender we consider other individual characteristics (age, race, education, marital status, and receipt of either a social pension or a private pension) and household characteristics (household wealth, whether a domestic helper is employed, and the location and composition of the household).
Household wealth is measured using an asset index, which we constructed using principal components analysis of a range of assets (including household ownership of a washing machine, car, television, computer, and dishwasher) and the nature of the individual’s dwelling type (for example, type of formal or informal housing). We then divided the asset score into quintiles, with the fifth quintile representing the richest households.
We also control for the day of the week that the time diary was provided and for whether or not this was viewed as a typical day. The results of the regression analysis are presented and discussed in Section 6 (the descriptive statistics for these covariates are reported in Appendix Table A‒1).
4. Results
4.1 Descriptive analysis of time use among the elderly
Table 1 reports the average total time spent by elderly women and men in South Africa, across the eight different activity groups we use in the study. Three possible ways of aggregating time in the 30‒minute slots are presented in the table. For ‘1st activity’, the full 30 minutes have been allocated to the first activity reported; for ‘divided time’,
12 Sequence and cluster analysis were done in R using package TraMiner and cluster (R Core Team 2014; Gabadinho et al. 2011; Maechler et al. 2014), while data cleaning and regression analysis were conducted using Stata.

Demographic Research: Volume 35, Article 25
http://www.demographic-research.org 721
each 30-minute period has been divided by the total number of all activities performed in the specific timeslot; and for ‘full time’, simultaneous activities have been assigned their full duration, so that the total day for an individual may add up to more than 24 hours.
Because the reporting of multiple activities is low among the elderly (characterising less than 9% of the time slots), the three approaches yield mostly small differences in the mean total time spent on activities, and none of the mean differences by approach is statistically significant. The largest absolute differences are in the average time allocations to activities that are most likely to be concurrent: mass media (such as watching television, listening to the radio, reading or using the internet); social or cultural activities (including socialising, participating in or watching sports, and participating in religious or cultural activities); and personal care (sleeping, eating, personal hygiene, and health care).
Table 1: Mean added time by activity among the elderly in South Africa 1st activity Divided time Full time Women Men Women Men Women Men Work 61.7
(3.50) 130.6
(8.36) 61.1 (3.48)
129.4 (8.27)
62.0 (3.49)
130.7 (8.32)
Household maintenance
203.8 (4.33)
111.5 (4.37)
194.7 (4.19)
107.0 (4.18)
204.9 (4.44)
110.8 (4.32)
Care of persons 12.8 (1.33)
9.7 (6.32)
13.5 (1.32)
8.2 (4.39)
14.7 (1.44)
12.3 (7.54)
Community service 5.8 (0.96)
5.5 (0.97)
5.7 (0.95)
5.4 (0.97)
5.8 (0.95)
5.5 (0.97)
Personal care 886.0 (5.41)
884.9 (7.69)
885.1 (5.22)
882.3 (7.46)
897.1 (5.19)
896.1 (7.49)
Mass media 132.8 (3.48)
156.6 (5.51)
136.3 (3.34)
163.3 (4.93)
152.0 (3.67)
180.8 (6.31)
Learning 2.8 (0.88)
2.2 (0.42)
2.8 (0.87)
2.2 (0.41)
2.9 (0.88)
2.4 (0.42)
Social/cultural 134.5 (3.96)
139.0 (6.22)
140.7 (4.01)
142.2 (5.72)
157.7 (4.69)
158.1 (6.23)
Source: TUS 2010 Note: The data are weighted using population weights. Standard errors are in parentheses. The sample is restricted to all men and women aged 60 years and older.

Grapsa and Posel: Sequencing the real time of the elderly: Evidence from South Africa
722 http://www.demographic-research.org
The patterns of average time allocations are also consistent across the three approaches. On average, the elderly in South Africa spend most of the day (almost 15 hours) on personal care, and there is little difference between elderly men and women in these average allocations. However, there are significant differences by gender in other time allocations, particularly regarding household maintenance, mass media, and work, and these patterns are robust for all three measures of mean added time.
Aside from personal care, the modal (mean time) activity among elderly women is household maintenance (including housework and personal and household shopping), which accounts for over three hours, on average, of their daily time use. Among elderly men, by contrast, when time is not spent on personal care the modal activity involves the use of mass media. On average, elderly women spend approximately 90 minutes more per day than elderly men on household maintenance, while elderly men allocate approximately 30 minutes more to mass media activities. However, elderly men on average spend over an hour more than elderly women on production activities (or work, broadly defined). Elderly women spend more time than men on providing care, but the average gender differences are small and, consistent with findings from Ranchhod and Wittenberg (2016), care work absorbs only a small part of the day for elderly women.
Rather than describe mean time allocations by activity type, Figure 1 provides a graphical representation of the real time activity trajectories of elderly women and men in South Africa. The activity distribution graphs are constructed by calculating the proportion of the elderly who perform a specific activity at the start of each 30-minute time slot during the day.
The graphs provide insight into the timing of daily activities, showing how activities are structured around certain socially determined fixed points in the day, such as lunch time (the share of the elderly involved in personal care peaks at 1 p.m.) and the airing of popular South African television shows (mass media usage is highest around 8 p.m.).
Gender differences in time use patterns are also clearly visible and largely mirror the mean time allocations reported in Table 1. Compared to elderly men, a smaller share of elderly women works or is involved in mass media activities, while a larger share spends time on household maintenance during the day. At any time during the day, the proportion of men doing housework never exceeds the respective proportion of women.

Demographic Research: Volume 35, Article 25
http://www.demographic-research.org 723
Figure 1: Activity distribution for elderly women and men during a day (24 hours)
Source: TUS 2010 Note: The data are weighted using population weights. The sample is restricted to all men and women aged 60 years and older. The graphs plot the proportion of the elderly who are involved in a particular activity at the start of every 30‒minute time slot.
The figures also reveal differences in the timing of activities. In particular, elderly
women start the day earlier than elderly men: a larger share is active before 9 a.m., and specifically in household activities. During the course of the day a higher proportion of elderly men enjoys leisure or personal care activities at more time points than women, with the largest differences at 6.30 a.m. (when men are still sleeping), 1 p.m., and from 5.30 p.m. to 6.30 p.m. The respective proportion of women is higher than men around 2.30 p.m., perhaps representing an afternoon break from housework.
Among both elderly women and men, the share allocating time to housework is highest in the morning. However, whereas housework peaks at around 8.30 a.m. for women (with 35% of elderly women performing housework), it peaks at around 10.30 a.m. for elderly men (with 22% performing some household maintenance activity). Among elderly women there is another (although smaller) peak in housework in the early evening (between 4 p.m. and 6 p.m.).
Female
Freq
.(n=3
232)
4:00 9:00 14:00 20:00 1:00
0.0
0.2
0.4
0.6
0.8
1.0
Male
Freq
.(n=1
846)
4:00 9:00 14:00 20:00 1:00
0.0
0.2
0.4
0.6
0.8
1.0
Care of personsCommunity serviceHousehold maintenanceLearning
Mass mediaPersonal careSocial/CulturalWork

Grapsa and Posel: Sequencing the real time of the elderly: Evidence from South Africa
724 http://www.demographic-research.org
4.2 Cluster analysis
To further explore these patterns and variation in the real time trajectories of the elderly, we considered each person’s use of time during the 24-hour day as a sequence of activities. We then applied optimal matching techniques to obtain a measure of similarity between these sequences, and agglomerative hierarchical cluster analysis to group similar sequences into clusters of time use behaviour.
Cluster analysis produces five distinct clusters of daily time use patterns among the elderly in South Africa. These are described and illustrated in Figure 2 and Table 2. Figure 2 plots the modal activity type among the elderly in each cluster, over the course of the 24-hour day. The graphs display only the modal activity per time slot, undertaken by the elderly in the respective cluster, and they therefore do not show all activity types that were performed in each slot. Table 2 reports the mean time spent in each activity type by cluster.
Almost 21% of elderly South Africans are classified in cluster 1 according to their daily activities. Aside from personal care, the main activity type of this cluster is mass media use, which is the modal activity from 2 p.m. to 9 p.m. and accounts for more than five hours on average of the elderly’s daily time allocation. Household maintenance is the next most common daytime activity in this cluster, typically undertaken between 8 a.m. and 12 p.m., and accounting for over three hours on average of daily time use.
Cluster 2 is the largest cluster and characterises 23% of the elderly. The main daytime activity in this cluster is household maintenance, accounting for almost six hours per day on average. Housework and related activities are typically undertaken from 7 a.m. to 1 p.m., and then again from 4 p.m. to 6 p.m.
The smallest cluster is cluster 3, which comprises approximately 17% of the total elderly population. The dominant daytime activity in this cluster is production work, which is the modal activity from 7 a.m. to 5 p.m. (with a ‘personal care’ or lunch break around 1 p.m.) and which consumes an average of seven hours per day of the elderly’s time
Approximately 20% of the elderly are in cluster 4, where the modal activity type from 9 a.m. to 6 p.m. involves social or cultural activities. On average, over six hours per day are spent socialising with friends or family, participating in or watching sports, and participating in religious or cultural activities.
Cluster 5 comprises 18% of the elderly. Throughout the day the modal activity in this cluster is personal care, which accounts for more than 19 hours on average of the elderly’s daily time allocation. Although personal care is by far the most dominant activity, the elderly in this cluster also spend a few hours a day on mass media (156 minutes on average) and social and cultural activities (52 minutes).

Demographic Research: Volume 35, Article 25
http://www.demographic-research.org 725
Figure 2: Modal activity by cluster type for elderly South Africans during a 24-hour day
Source: TUS 2010 Note: The sample is restricted to all men and women aged 60 years and older.

Grapsa and Posel: Sequencing the real time of the elderly: Evidence from South Africa
726 http://www.demographic-research.org
Table 2: Average added time (minutes) spent in each activity type by activity cluster
Cluster 1 Cluster 2 Cluster 3 Cluster 4 Cluster 5 Care of persons 15.2
(2.8) 28.3
(11.5) 3.0
(0.72) 3.5
(0.58) 3.8
(0.98) Community service 17.4
(2.89) 2.5
(0.66) 2.0
(0.64) 5.4
(1.36) 0.4
(0.17) Household maintenance 202
(5.81) 345.4
(8.28) 91.5 (4.99)
94.9 (3.9)
47.6 (3.01)
Learning 6.4 (2.41)
1.0 (0.24)
2.6 (0.66)
1.3 (0.42)
1.2 (0.37)
Mass media 305.2 (6.09)
83.3 (4.41)
90 (4.90)
78.8 (3.59)
156.4 (6.86)
Personal care 784 (5.16)
863.3 (7.73)
769.7 (8.45)
868.9 (7.1)
1171.3 (8.18)
Social/cultural 99.8 (4.21)
101.1 (6.91)
62.3 (4.04)
370.9 (7.17)
51.8 (3.10)
Work 10.6 (1.52)
15.0 (1.43)
418.9 (9.73)
16.3 (1.66)
7.6 (1.03)
Source: TUS 2010. Notes: The percentages are weighted using population weights. Standard errors are in parentheses. The sample is restricted to all men and women aged 60 years and older.
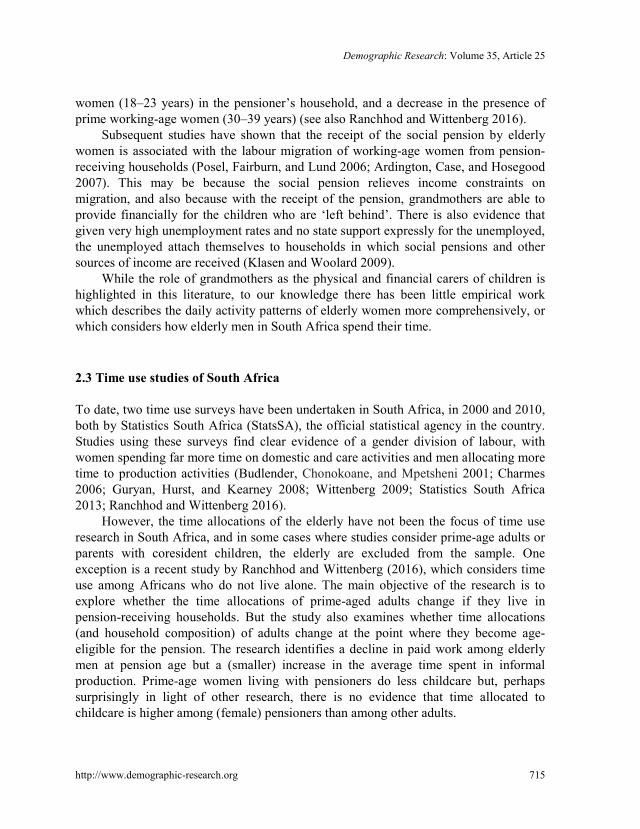
A descriptive comparison of mean added time and real time by gender shows that
elderly women devote considerably more time than elderly men to household maintenance, and less time to production work. Cluster analysis of the real time use of the elderly augments this evidence, by revealing the concentration of women and men in different activity clusters. This is illustrated in Table 3, where we report the distribution of elderly men and women in each cluster.
Compared to their share in the total elderly population (57.5%), elderly women are considerably overrepresented in cluster 2, where household maintenance is the dominant activity type, while they are clearly underrepresented in cluster 3, where work is the main activity type. Elderly women comprise 71% of the elderly in cluster 2, and only 44% of the elderly in cluster 3. Elderly women are also underrepresented in cluster 5, where personal care is the modal activity during the day, although the gender imbalance is less stark.
In addition to gender, there are other individual characteristics and household characteristics that are associated with the cluster membership of the elderly. These are explored and discussed in the next section.
Demographic Research: Volume 35, Article 25
http://www.demographic-research.org 727
Table 3: Cluster distribution by gender (elderly population) Women Men Cluster Unweighted
N (%) Unweighted
N (%)
1 650 57.9 (2.17) 404 42.1 (2.17)
2 969 71.3 (2.89) 269 28.7 (2.89)
3 429 44.1 (2.37) 421 55.9 (2.37)
4 643 58.3 (2.12) 389 41.7 (2.12)
5 541 53.4 (2.38) 363 46.6 (2.38)
Total 3232 57.5 (1.08) 1846 42.5 (1.08) Source: TUS 2010. Notes: The cluster shares by gender are weighted using population weights. Standard errors are in parentheses. The sample is restricted to all men and women aged 60 years and older.
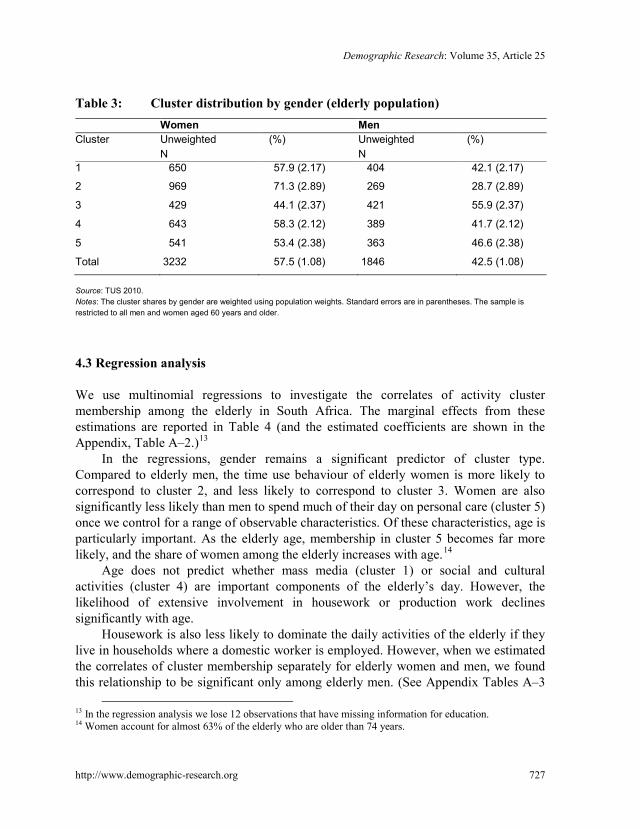
4.3 Regression analysis
We use multinomial regressions to investigate the correlates of activity cluster membership among the elderly in South Africa. The marginal effects from these estimations are reported in Table 4 (and the estimated coefficients are shown in the Appendix, Table A‒2.)13
In the regressions, gender remains a significant predictor of cluster type. Compared to elderly men, the time use behaviour of elderly women is more likely to correspond to cluster 2, and less likely to correspond to cluster 3. Women are also significantly less likely than men to spend much of their day on personal care (cluster 5) once we control for a range of observable characteristics. Of these characteristics, age is particularly important. As the elderly age, membership in cluster 5 becomes far more likely, and the share of women among the elderly increases with age.14
Age does not predict whether mass media (cluster 1) or social and cultural activities (cluster 4) are important components of the elderly’s day. However, the likelihood of extensive involvement in housework or production work declines significantly with age.
Housework is also less likely to dominate the daily activities of the elderly if they live in households where a domestic worker is employed. However, when we estimated the correlates of cluster membership separately for elderly women and men, we found this relationship to be significant only among elderly men. (See Appendix Tables A‒3
13 In the regression analysis we lose 12 observations that have missing information for education. 14 Women account for almost 63% of the elderly who are older than 74 years.

Grapsa and Posel: Sequencing the real time of the elderly: Evidence from South Africa
728 http://www.demographic-research.org
and A‒4 for the marginal effects of the separate gender estimations.) Cluster 2 membership is also less likely if there are more female adults (16 to 59 years) in the household, a result which is robust among both elderly women and men, and which suggests that the elderly (and particularly elderly women) assume responsibility for housework in the absence of younger women in the household.
Cluster 2 membership is significantly more likely if the elderly receive either a social grant or a social pension. However, this is driven by elderly women – there is no relationship between pension receipt and involvement in household maintenance among elderly men.
A number of studies have emphasised the role of grandmothers and the importance of the social pension in providing childcare support. We did not find strong evidence of childcare in the time allocations of elderly women (in either the description of average time allocations or in the cluster analysis of real time). However, it is possible that the responsibilities associated with children are subsumed within a broader spectrum of housework activities (such as cooking and cleaning), helping to account for the positive relationship among women between social pensions and cluster 2 membership.
Consistent with other research for South Africa (Ranchhod 2006), the elderly who receive a pension (whether social or private) are significantly less likely to be working (cluster 3). The elderly living in richer households (with more assets, including media devices) are also less likely to work and they spend more time on mass media activities and some household maintenance (cluster 1). But the elderly are more likely to work as the number of male adults and the number of young children (0 to 5 years) in the household increase. This could reflect greater demands on the elderly to continue working to provide economic support for dependent household members, or that family members without other means of support join the household because the elderly are (still) working.
The time use behaviour of the elderly also varies between urban and rural areas. The elderly in rural areas (both women and men) spend more time on work activities (which include home-based production, subsistence farming, and the collection of wood and water), but they spend less time on mass media activities, which is likely to reflect lower access to electricity and media devices in these areas.
The marital status and education of the elderly appear to have little independent association with the time use behaviour of the elderly, and, controlling for other covariates, the race associations are also not very marked. In comparison to elderly Africans, social and cultural activities (cluster 4) are less dominant among elderly Whites, while elderly Coloureds are less likely to work and more likely to spend time on mass media and household maintenance.
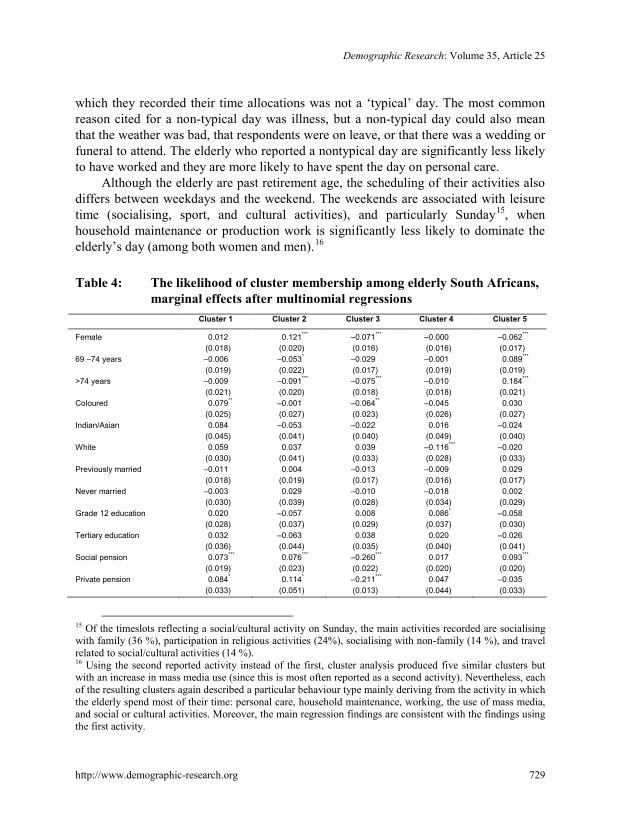
The time use allocations of the elderly differ significantly according to when they completed the time diary. Approximately 11% of the elderly reported that the day on
Demographic Research: Volume 35, Article 25
http://www.demographic-research.org 729
which they recorded their time allocations was not a ‘typical’ day. The most common reason cited for a non-typical day was illness, but a non-typical day could also mean that the weather was bad, that respondents were on leave, or that there was a wedding or funeral to attend. The elderly who reported a nontypical day are significantly less likely to have worked and they are more likely to have spent the day on personal care.
Although the elderly are past retirement age, the scheduling of their activities also differs between weekdays and the weekend. The weekends are associated with leisure time (socialising, sport, and cultural activities), and particularly Sunday15, when household maintenance or production work is significantly less likely to dominate the elderly’s day (among both women and men).16
Table 4: The likelihood of cluster membership among elderly South Africans,
marginal effects after multinomial regressions Cluster 1 Cluster 2 Cluster 3 Cluster 4 Cluster 5
Female 0.012 0.121*** ‒0.071*** ‒0.000 ‒0.062*** (0.018) (0.020) (0.016) (0.016) (0.017) 69 ‒74 years ‒0.006 ‒0.053* ‒0.029 ‒0.001 0.089*** (0.019) (0.022) (0.017) (0.019) (0.019) >74 years ‒0.009 ‒0.091*** ‒0.075*** ‒0.010 0.184*** (0.021) (0.020) (0.018) (0.018) (0.021) Coloured 0.079** ‒0.001 ‒0.064** ‒0.045 0.030 (0.025) (0.027) (0.023) (0.026) (0.027) Indian/Asian 0.084 ‒0.053 ‒0.022 0.016 ‒0.024 (0.045) (0.041) (0.040) (0.049) (0.040) White 0.059 0.037 0.039 ‒0.116*** ‒0.020 (0.030) (0.041) (0.033) (0.028) (0.033) Previously married ‒0.011 0.004 ‒0.013 ‒0.009 0.029 (0.018) (0.019) (0.017) (0.016) (0.017) Never married ‒0.003 0.029 ‒0.010 ‒0.018 0.002 (0.030) (0.039) (0.028) (0.034) (0.029) Grade 12 education 0.020 ‒0.057 0.008 0.086* ‒0.058 (0.028) (0.037) (0.029) (0.037) (0.030) Tertiary education 0.032 ‒0.063 0.038 0.020 ‒0.026 (0.036) (0.044) (0.035) (0.040) (0.041) Social pension 0.073*** 0.076*** ‒0.260*** 0.017 0.093*** (0.019) (0.023) (0.022) (0.020) (0.020) Private pension 0.084* 0.114* ‒0.211*** 0.047 ‒0.035 (0.033) (0.051) (0.013) (0.044) (0.033)
15 Of the timeslots reflecting a social/cultural activity on Sunday, the main activities recorded are socialising with family (36 %), participation in religious activities (24%), socialising with non-family (14 %), and travel related to social/cultural activities (14 %). 16 Using the second reported activity instead of the first, cluster analysis produced five similar clusters but with an increase in mass media use (since this is most often reported as a second activity). Nevertheless, each of the resulting clusters again described a particular behaviour type mainly deriving from the activity in which the elderly spend most of their time: personal care, household maintenance, working, the use of mass media, and social or cultural activities. Moreover, the main regression findings are consistent with the findings using the first activity.

Grapsa and Posel: Sequencing the real time of the elderly: Evidence from South Africa
730 http://www.demographic-research.org
Table 4: (Continued) Cluster 1 Cluster 2 Cluster 3 Cluster 4 Cluster 5
Employs domestic help ‒0.032 ‒0.102*** ‒0.018 0.043 0.108** (0.024) (0.030) (0.025) (0.031) (0.033) Rural ‒0.083*** ‒0.024 0.129*** 0.010 ‒0.033 (0.017) (0.018) (0.019) (0.018) (0.017) Asset quintile (2) 0.088*** 0.013 ‒0.058* ‒0.049 0.006 (0.020) (0.023) (0.023) (0.025) (0.022) Asset quintile (3) 0.153*** ‒0.004 ‒0.078** ‒0.061* ‒0.011 (0.021) (0.022) (0.026) (0.026) (0.022) Asset quintile (4) 0.185*** 0.008 ‒0.113*** ‒0.068* ‒0.013 (0.022) (0.026) (0.028) (0.030) (0.024) Asset quintile (5) 0.146*** 0.050 ‒0.087* ‒0.109** ‒0.000 (0.028) (0.038) (0.036) (0.034) (0.035) Number: female adults ‒0.015 ‒0.044*** ‒0.001 0.018* 0.041*** (0.010) (0.012) (0.008) (0.008) (0.008) Number: male adults ‒0.025** 0.005 0.030*** ‒0.008 ‒0.002 (0.010) (0.010) (0.009) (0.009) (0.008) Number: children 0‒5 yrs 0.020 ‒0.007 0.028** ‒0.019 ‒0.021* (0.013) (0.015) (0.009) (0.011) (0.011) Number: children 6‒15 yrs ‒0.024* 0.008 0.006 0.013 ‒0.004 (0.009) (0.009) (0.007) (0.007) (0.007) Saturday ‒0.021 ‒0.018 ‒0.046 0.087** ‒0.002 (0.032) (0.035) (0.030) (0.032) (0.030) Sunday ‒0.018 ‒0.080*** ‒0.088*** 0.201*** ‒0.015 (0.021) (0.023) (0.019) (0.024) (0.020) Non‒typical day ‒0.088*** 0.005 ‒0.111*** 0.046 0.149*** (0.025) (0.039) (0.017) (0.024) (0.028) Observations 5066
Source: TUS 2010. Notes: The data are weighted using population weights. The omitted categories are: male; aged 60 to 68; African; currently married; less than grade 12 education; no social pension receipt; no private pension receipt; urban area of residence; in the first asset quintile, weekday; and typical day. Female and male adults are aged 16 to 59 years. Standard errors are in parentheses. The marginal effects are calculated as a change in the probability of cluster membership for a one‒unit change in the continuous variables and for a discrete change in the dummy variables. * p < 0.05, ** p < 0.01, *** p < 0.001.
5. Discussion and conclusion
In a 24 hour day, the elderly in South Africa devote an average of 15 hours to personal care, three hours to household maintenance, two hours to mass media and to social/cultural activities respectively; 90 minutes to work; and less than 30 minutes in total to the care of others, community service, and learning. However, these average time allocations conceal considerable heterogeneity in time use patterns among the elderly and they say nothing about how different activities are distributed during the course of the day (or over the week).
We explored patterns of time use by comparing the real time daily trajectories of the elderly, which we captured as sequences of activity states. We first used optimal
Demographic Research: Volume 35, Article 25
http://www.demographic-research.org 731
matching techniques and cluster analysis to group these trajectories into clusters of similar time use patterns. These methods allowed us to identify clusters according to only the time use behaviour of the elderly (the timing, duration, and ordering of activities), without having to impose any restrictions on the sample or on time allocations. We then used multinomial regression analysis to identify the individual- and household-level correlates of cluster membership.
The analysis produced five distinct clusters of time use behaviour among the elderly. In one cluster (cluster 5), personal care activities (eating, sleeping, personal hygiene and health care) dominate time use throughout the day. The elderly in this cluster are significantly more likely to be older, male, living in a household with other female adults and where a domestic worker is employed, and to report having a non‒typical day. But this cluster represents the time use behaviour of only 18% of the elderly. The remaining 82% are members of a cluster where more active pursuits dominate daytime hours: household maintenance, work, mass media usage (combined with some household work), and social, sport, and cultural activities.
Time use patterns vary significantly between elderly women and men, and we find clear evidence of a traditional gender division of labour among the elderly. An added time approach shows that, on average, during the day elderly women spend 90 minutes more than elderly men on household maintenance, and one hour less on production work. Cluster analysis goes beyond these average allocations by showing that one group of the elderly (comprising approximately 23% of the elderly population) ‘specialises’ in household work, in that this is the modal (nonpersonal care) activity around which the ‘working day’ is structured, while another group (accounting for 17% of the elderly) specialises in production work. Among the elderly who specialise in household maintenance (cluster 2), over 70% are women, while women comprise only 44% of the cluster of the elderly who work during the day (cluster 3).
The division of labour in the household is bisected not only by gender but also by age. In multi-generational households, elderly women (and men) are significantly less likely to assume responsibility for household maintenance if they live in households with their daughters or other nonelderly women. This suggests that household work remains gendered in more complex households, but that it is undertaken by younger women in the household.
Although we find significant gender differences in the allocation of time to housework and production work among the elderly, we do not find sizeable differences in time spent on care of others (which would include childcare, and care of the ill). Moreover, very little time is devoted to caring activities specifically. Even among African grandmothers who live with at least one child, less than 30 minutes on average is allocated to the care of others in the 24-hour day. These time use patterns suggest that the support which grandmothers provide to children, and which is emphasised in the

Grapsa and Posel: Sequencing the real time of the elderly: Evidence from South Africa
732 http://www.demographic-research.org
literature on childcare and household relations in South Africa, derives more from housework and financial support than from the dedicated physical care of children. This would help to account for why the relationship between pension receipt and time use behaviour among the elderly is gendered.
Both elderly women and men who receive a pension (whether social or private) are less likely to spend their day working. Among elderly men, pension receipt is associated with more time spent on leisure, and specifically on social, sport, or cultural activities (cluster 4) or mass media usage (cluster 1). Among elderly women, by contrast, pension recipients are more likely to spend their time on household maintenance.
The conjugal nuclear family characterises only a minority of households in South Africa, and the time use patterns of the elderly vary not according to their marital status but according to the composition of their household. Housework is less likely to dominate daytime hours if the elderly live with nonelderly women. However, the presence of nonelderly men increases (rather than reduces) the likelihood that the elderly are working. This positive relationship may derive from the elderly working in family enterprises with their sons, but it is also consistent with other research that finds that the unemployed attach themselves to, or continue to live in, households where other members (including elderly parents) have employment.
The analysis of the daily time trajectories of the elderly also reveals distinct rhythms to the structuring of activities during the day and over the week. Elderly women are more likely than men to start the day early; during the course of the day, the proportion of men who spend time on leisure or personal care is typically higher than the proportion of women (except after lunchtime); most housework is performed during the morning, with another peak in the late afternoon and early evening; social, sport and cultural activities are typically undertaken during the day; and mass media usage among the elderly peaks at night, during prime television viewing time. Work is the dominant activity among only 17% of the elderly, but the elderly’s week remains structured, between a ‘working’ week and the weekend. Sunday is a day of rest, where the elderly are less likely not only to work but also to spend time on household maintenance, and are more likely to engage in social and cultural activities.
The sequence and cluster modelling methods which we successfully applied to time diary data create a typology of time use behaviour among the elderly in South Africa, and they thereby permit a more nuanced analysis of the differences and commonalities in this behaviour than that provided by a mean added time approach. By analysing the real time trajectories of the elderly, we could group their time use not only according to the average time allocated to specific activities but also according to the series of activities undertaken over the course of the day, and to the order and timing of those activities. In this study of the elderly we did not consider how their time use

Demographic Research: Volume 35, Article 25
http://www.demographic-research.org 733
patterns differ from those of nonelderly adults. The analysis of the daily time trajectories of nonelderly adults using the same modelling methods is a project for future research. More generally, we believe that there is considerable potential to extend the application of these methods to other studies of time diary data.
6. Acknowledgements
We thank two anonymous reviewers for their helpful comments on the paper.

Grapsa and Posel: Sequencing the real time of the elderly: Evidence from South Africa
734 http://www.demographic-research.org
References
Abbott, A. and Forrest, J. (1986). Optimal matching methods for historical sequences. The Journal of Interdisciplinary History 16(3): 471–494. doi:10.2307/204500.
Abbott, A. and Tsay, A. (2000). Sequence analysis and optimal matching methods in sociology. Sociological Methods and Research 29(1): 3–33. doi:10.1177/00491 24100029001001.
Ardington, C., Case, A., and Hosegood, V. (2007). Labour supply responses to large social transfers: Longitudinal evidence from South Africa. American Economic Journal: Applied Economics 1(1): 22–48. doi:10.1257/app.1.1.2.
Baxter, J. (1997). Gender equality and participation in housework: A cross-national perspective. Comparative Family Studies 28(3): 220–248.
Bengtson, V., Rosenthal, C., and Burton, L. (1990). Families and aging: Diversity and heterogeneity. In: Binstock, R.H. and George, L.K. (eds.) Handbook of aging and the social sciences. 3. San Diego: Academic Press: 263–282.
Bianchi, S.M., Robinson, J.P., and Milkie, M.A. (2006). Changing rhythms of American family life. New York: Russell Sage.
Boudiny, K. (2013). ‘Active ageing’: From empty rhetoric to effective policy tool. Ageing and Society 33(6): 1077–1098.
Budlender, D., Chonokoane, N., and Mpetsheni, Y. (2001). A survey of time use: How South African women and men spend their time. Resource document. Pretoria: Statistics South Africa.
Budlender, D. and Lund, F. (2011). South Africa: A legacy of family disruption. Development and Change 42(4): 925–946. doi:10.1111/j.1467‒7660.2011.0171 5.x.
Case, A. and Menedez, A. (2007). Does money empower the elderly? Evidence from the Agincourt Demographic Surveillance Unit. Scandinavian Journal of Public Health 35(3): 157–164. doi:10.1080/14034950701355445.
Charmes, J. (2006). A review of empirical evidence on time use in South Africa from UN-sponsored surveys. In: Blackden, C.M. and Wodon, Q. (eds.) Gender, time use, and poverty in sub-Saharan Africa. Washington, D.C.: The World Bank: 39–72.
Demographic Research: Volume 35, Article 25
http://www.demographic-research.org 735
Costa, D. (1997). Displacing the family: Union army pensions and elderly living arrangements. Journal of Political Economy 105(2): 1269–1292. doi:10.1086/516392.
Costa, D. (1999). A house of her own: Old age assistance and the living arrangements of older nonmarried women. Journal of Public Economics 72(1): 39–59. doi:10.1016/S0047‒2727(98)00094‒2.
Duflo, E. (2003). Grandmothers and granddaughters: Old age pensions and intrahousehold allocation in South Africa. The World Bank Economic Review 17(1): 1–25. doi:10.1093/wber/lhg013.
Edmonds, E., Mammen, K., and Miller, D.L. (2005). Rearranging the family? Income support and elderly living arrangements in a low income country. Journal of Human Resources XL (1): 186–207. doi:10.3368/jhr.XL.1.186.
Engelhardt, G., Gruber, J., and Perry, C. (2002). Social security and elderly living arrangements. NBER Working Paper No. 8911. Cambridge: NBER. doi:10.3386/w8911.
Gabadinho, A., Ritschard, G., Muller, N., and Studer, M. (2011). Analyzing and visualizing state sequences in R with TraMineR. Journal of Statistical Software 40(4):1–37. doi:10.18637/jss.v040.i04.
Gauthier, A.H. and Smeeding, T.M. (2003). Time use at older ages: Cross‒national differences. Research on Aging 25(3): 247–274. doi:10.1177/016402750302500 3003.
Gershuny, J. and Sullivan, O. (1998). The sociological uses of time-use diary analysis. European Sociological Review 14(1): 69–85 .
Gerstel, N. (2000). The third shift: Gender and care work outside the home. Qualitative Sociology 23(4): 467–483. doi:10.1023/A:1005530909739.
Guryan, J., Hurst, E., and Kearney, M.S. (2008). Parental education and parental time with children. NBER Working Paper No. 13993. Cambridge: NBER. doi:10.33 86/w13993.
Halpin, B. and Chan, T.W. (1998). Class careers as sequences: An optimal matching analysis of work-life histories. European Sociological Review 14(2): 111–130. doi:10.1093/oxfordjournals.esr.a018230.
Hank, K. and Jürges, H. (2007). Gender and the division of household labor in older couples. A European perspective. Journal of Family Issues 28(3): 399–421. doi:10.1177/0192513X06296427.

Grapsa and Posel: Sequencing the real time of the elderly: Evidence from South Africa
736 http://www.demographic-research.org
Klasen, S. and Woolard, I. (2009). Surviving unemployment without state support: Unemployment and household formation in South Africa. Journal of African Economies 18(1): 1–51. doi:10.1093/jae/ejn007.
Leopold, T. and Skopek, J. (2014). Gender and the division of labor in older couples: How European grandparents share market work and childcare. Social Forces 93(1): 63–91. doi:10.1093/sf/sou061.
Lesnard, L. (2004). Schedules as sequences: a new method to analyze the use of time based on collective rhythm with an application to the work arrangements of French dual-earner couples. Electronic International Journal of Time Use Research 1(1): 60–84. doi:10.13085/eIJTUR.1.1.60‒84.
Lesnard, L. (2008). Off‒scheduling within dual‒earner couples: An unequal and negative externality for family time. American Journal of Sociology 114(2): 447–490. doi:10.1086/590648.
Lesnard, L. (2010). Setting cost in optimal matching to uncover contemporaneous socio‒temporal patterns. Sociological Methods & Research 38(3): 389–419. doi:10.1177/0049124110362526.
Maechler, M., Rousseeuw, P., Struyf, A., Hubert, M., and Hornik, K. (2014). cluster: Cluster Analysis Basics and Extensions. R package version 1.15.3.
McVicar, D. and Anyadike‒Danes, M. (2002). Predicting successful and unsuccessful transitions from school to work by using sequence methods. Journal of the Royal Statistical Society. Series A (Statistics in Society) 165(2): 317–334. doi:10.1111/1467‒985X.00641.
Posel, D., Fairburn, J., and Lund, F. (2006). Labour migration and households: A reconsideration of the effects of the social pension on labour supply in South Africa. Economic Modelling 23(4): 836–853. doi:10.1016/j.econmod.2005. 10.010.
R Core Team (2014). R: A Language and Environment for Statistical Computing. R Foundation for Statistical Computing. Vienna: Austria.
Ranchhod, V. (2006). The effect of the South African old age pension on labour supply of the elderly. South African Journal of Economics 74(4): 724–744.
Ranchhod, V. and Wittenberg, M. (2016). The social pension and time allocation in poor South African households. In: Besley, T. (ed.) Contemporary issues in development economics. London: Palgrave Macmillan: 91–111. doi:10.1057/978 1137529749_7.

Demographic Research: Volume 35, Article 25
http://www.demographic-research.org 737
Rousseeuw, P. and Kaufman, L. (2008). Finding groups in data: An introduction to cluster analysis. New Jersey: Wiley & Sons.
Russell, M. (2003). Understanding black households: The problem. Social Dynamics 29(2): 5–47. doi:10.1080/02533950308628674.
Schatz, E. and Ogunmefun, C. (2007). Caring and contributing: The role of older women in rural South African multi-generational households in the HIV/AIDS era. World Development 35(8): 1390–1403. doi:10.1016/j.worlddev.2007. 04.004.
Solomon, C.R., Acock, A.C., and Walker, A.J. (2004). Gender ideology and investment in housework. Journal of Family Issues 25(8): 1050–1071. doi:10.1177/01925 13X03261323.
Statistics South Africa (2013). A survey of time use, 2010. Pretoria: Statistics South Africa.
Studer, M. and Ritschard, G. (2016). What matters in differences between life trajectories: A comparative review of sequence dissimilarity measures. Journal of the Royal Statistical Society: Series A (Statistics in Society) 179(2): 481–511. doi:10.1111/rssa.12125.
Szinovacz, M. (2000). Changes in housework after retirement: A panel analysis. Journal of Marriage and the Family 62(1): 78–92. doi:10.1111/j.1741‒3737.2000.00078.x.
Vrotsou, K., Ynnerman, A., and Cooper, M. (2014). Are we what we do? Exploring group behaviour through user-defined event-sequence similarity. Information Visualization 13(3): 232–247. doi:10.1177/1473871613477852.
Walker, A. (2002). A strategy for active ageing. International Social Security Review 55(1): 121–139. doi:10.1111/1468‒246X.00118.
Ward, J. Jr. (1963). Hierarchical grouping to optimize an objective function. Journal of the American Statistical Association 58(301): 236–244. doi:10.1080/01621459. 1963.10500845.
Wittenberg, M. (2009). Lazy rotten sons? Relatedness, gender and the intra‒household allocation of work and leisure in South Africa. Southern Africa Labour and Development Research Unit Working Paper Number 28. Cape Town: University of Cape Town.

Grapsa and Posel: Sequencing the real time of the elderly: Evidence from South Africa
738 http://www.demographic-research.org
Appendix
Sequence analysis: Optimal matching distance (simplified example)
Consider three activity sequences of equal length, with six time points (instead of 48):
a) PC‒W‒W‒W‒MM‒PC b) PC‒W‒W‒HM‒MM‒PC c) HM‒HM‒HM‒L‒L‒L
The optimal matching distance is defined as the minimum cost of transforming one
sequence into the other. This cost depends on what transforming operations would be needed (replacement, or insertion or deletion of an element) and on their respective individual costs. For this example, assume that the costs of insertion or of deletion (indel) equal 1, and that the cost of replacement or substitution equals 2.
In order to transform sequence a) above into sequence b) (and vice versa) we need one substitution (involving HM and W). Therefore, the distance between the two sequences is 1×2=2. Six substitutions are required to turn sequence a) into c), so the distance between them is 6×2=12 (which is the maximum distance between these two sequences of the same length and with the specified individual costs). Note that no insertion/deletion operations are used in the above example.
In our main analysis the transition rate between activities is used to obtain the substitution cost matrix. The transition rate describes the probability that an individual will switch from one activity to another at a certain time point. When used in obtaining the substitution costs, it helps to incorporate the internal structure and ordering of activities in the distance measure, since not all activity switches are likely to happen at all time points.

Demographic Research: Volume 35, Article 25
http://www.demographic-research.org 739
Dendrogram from cluster analysis
Figure A‒1: Hierarchical agglomerative clustering of activity sequences among the elderly in South Africa
The dendrogram is an important tool to visualise how the clustering is performed and to obtain an image of the data structure. The vertical axis represents the distance between sequences or clusters of sequences. The interpretation of the dendrogram starts at the bottom, when the algorithm finds the pair of sequences that are the most similar and then merges them into one cluster with distance equal to the height shown on the y-axis. The point at which the sequences are joined is called a node. Ward’s method (Ward Jr. 1963) is used at subsequent steps to calculate the updated distance between the merged pair and the other sequences. Inspection of the dendrogram reveals five distinct clusters of sequences, with cluster 5 being the most separate from the others. The validity of the five clusters is checked by obtaining the activity distribution graphs for each cluster, which provides evidence of the distinct activity patterns by cluster.

Grapsa and Posel: Sequencing the real time of the elderly: Evidence from South Africa
740 http://www.demographic-research.org
Descriptive statistics for the sample
Table A‒1: Sample characteristics of the elderly Female Male Total N (%) N (%) N (%) Age 60‒68 1633 (50.5) 1009 (54.7) 2642 (52.0) 69‒74 752 (23.3) 458 (24.8) 1210 (23.8) >74 847 (26.2) 379 (20.5) 1226 (24.1) Race African 2372 (73.4) 1211 (65.6) 3583 (70.6) Coloured 320 (9.9) 198 (10.7) 518 (10.2) Indian/Asian 83 (2.6) 67 (3.6) 150 (3.0) White 457 (14.1) 370 (20) 827 (16.3) Marital status Currently married 916 (28.3) 1262 (68.4) 2178 (42.9) Previously married 1982 (61.3) 466 (25.2) 2448 (48.2) Never married 334 (10.3) 118 (6.4) 452 (8.9) Education Less than grade 12 2826 (87.6) 1444 (78.4) 4270 (84.3) Grade 12 219 (6.8) 227 (12.3) 446 (8.8) Tertiary 180 (5.6) 170 (9.2) 350 (6.9) Social pension 2511 (77.7) 1154 (62.5) 3665 (72.2) Private pension 232 (7.2) 225 (12.2) 457 (9) Employs domestic help 295 (9.1) 242 (13.1) 537 (10.6) Geography type Urban 1659 (51.3) 1082 (58.6) 2741 (54) Rural 1573 (48.7) 764 (41.4) 2337 (46) Asset index quintile Asset quintile (1) 679 (21.0) 347 (18.8) 1026 (20.2) Asset quintile (2) 680 (21.0) 339 (18.4) 1019 (20.1) Asset quintile (3) 692 (21.4) 311 (16.9) 1003 (19.8) Asset quintile (4) 638 (19.7) 393 (21.3) 1031 (20.3) Asset quintile (5) 543 (16.8) 456 (24.7) 999 (19.7) Household composition (averages) Number of female adults
0.60
0.66
0.62
Number of male adults 0.58 0.45 0.53 Number of children (0‒5 years) 0.35 0.25 0.32 Number of children (6‒15 years) 0.62 0.46 0.56 Day Weekday 2495 (77.2) 1460 (79.1) 3955 (77.9) Saturday 177 (5.5) 104 (5.6) 281 (5.5) Sunday 560 (17.3) 282 (15.3) 842 (16.6) Typical day 2852 (88.2) 1671 (90.5) 4523 (89.1) Total 3232 (63.6) 1846 (36.4) 5078
Source: TUS 2010. Note: The data are not weighted. The elderly are aged 60 years and older. Female and male adults are aged 16 to 59 years. There are 12 missing observations for education.

Demographic Research: Volume 35, Article 25
http://www.demographic-research.org 741
Multinomial logit regressions: Estimated coefficients and regressions by gender
Table A‒2: Multinomial logit regression of cluster membership using cluster 2 as baseline
Cluster 1 Cluster 3 Cluster 4 Cluster 5
Female ‒0.502** ‒1.072*** ‒0.638*** ‒0.987*** (0.169) (0.166) (0.156) (0.168) 69‒74 years 0.207 0.067 0.253 0.848*** (0.173) (0.173) (0.171) (0.182) >74 years 0.397* ‒0.078 0.421* 1.466*** (0.182) (0.194) (0.168) (0.169) Coloured 0.408* ‒0.540* ‒0.251 0.159 (0.193) (0.271) (0.220) (0.224) Indian/Asian 0.698* 0.110 0.343 0.125 (0.337) (0.430) (0.384) (0.383) White 0.140 0.045 ‒0.943** ‒0.323 (0.261) (0.307) (0.318) (0.325) Previously married ‒0.074 ‒0.109 ‒0.066 0.164 (0.149) (0.162) (0.143) (0.155) Never married ‒0.138 ‒0.205 ‒0.236 ‒0.126 (0.263) (0.305) (0.303) (0.278) Grade 12 education 0.366 0.357 0.697* ‒0.110 (0.276) (0.313) (0.312) (0.369) Tertiary education 0.459 0.559 0.434 0.155 (0.343) (0.358) (0.372) (0.438) Social pension 0.098 ‒1.871*** ‒0.377 0.232 (0.197) (0.195) (0.206) (0.238) Private pension ‒0.055 ‒3.153*** ‒0.277 ‒0.692 (0.265) (0.401) (0.340) (0.356) Employs domestic help 0.392 0.497 0.857** 1.191*** (0.280) (0.303) (0.301) (0.303) Rural ‒0.364* 0.985*** 0.199 ‒0.077 (0.150) (0.173) (0.147) (0.152) Asset quintile (2) 0.720** ‒0.432* ‒0.317 ‒0.055 (0.237) (0.191) (0.180) (0.193) Asset quintile (3) 1.148*** ‒0.504* ‒0.318 ‒0.085 (0.229) (0.210) (0.183) (0.192) Asset quintile (4) 1.228*** ‒0.838*** ‒0.425 ‒0.161 (0.242) (0.242) (0.217) (0.213) Asset quintile (5) 0.880** ‒0.819* ‒0.860** ‒0.270 (0.301) (0.320) (0.285) (0.299)

Grapsa and Posel: Sequencing the real time of the elderly: Evidence from South Africa
742 http://www.demographic-research.org
Table A‒2: (Continued) Cluster 1 Cluster 3 Cluster 4 Cluster 5
Number of female adults 0.123 0.214* 0.329*** 0.483*** (0.094) (0.092) (0.087) (0.091) Number of male adults ‒0.161 0.188* ‒0.056 ‒0.034 (0.084) (0.083) (0.080) (0.078) Number of children 0‒5 yrs 0.130 0.211* ‒0.080 ‒0.109 (0.112) (0.107) (0.104) (0.110) Number of children 6‒15 yrs ‒0.159* 0.019 0.046 ‒0.051 (0.077) (0.072) (0.068) (0.074) Saturday ‒0.036 ‒0.207 0.549* 0.094 (0.279) (0.307) (0.249) (0.285) Sunday 0.307 ‒0.206 1.291*** 0.378 (0.208) (0.255) (0.185) (0.217) Non‒typical day ‒0.551 ‒0.944*** 0.248 0.746** (0.329) (0.280) (0.238) (0.252)
Observations 5066
Source: TUS 2010. Notes: The data are weighted using population weights. The omitted categories are: male; aged 60 to 68; African; currently married; less than grade 12 education; no social pension receipt; no private pension receipt; urban area of residence; in the first asset quintile, weekday; and typical day. Female and male adults are aged 16 to 59 years. Standard errors are in parentheses. * p < 0.05, ** p < 0.01, *** p < 0.001.
Table A‒3: The likelihood of cluster membership among elderly female South
Africans, marginal effects after multinomial regressions Cluster 1 Cluster 2 Cluster 3 Cluster 4 Cluster 5 69‒74 years 0.025 ‒0.086** ‒0.046* ‒0.013 0.120*** (0.026) (0.026) (0.020) (0.022) (0.023) >74 years ‒0.047 ‒0.080** ‒0.060** 0.001 0.186*** (0.026) (0.029) (0.021) (0.024) (0.025) Coloured 0.059 0.006 ‒0.057* ‒0.020 0.012 (0.031) (0.039) (0.027) (0.034) (0.033) Indian/Asian 0.084 ‒0.082 ‒0.049 0.050 ‒0.003 (0.056) (0.058) (0.047) (0.070) (0.045) White 0.051 0.013 0.044 ‒0.089* ‒0.018 (0.039) (0.056) (0.048) (0.037) (0.040) Previously married ‒0.008 ‒0.014 0.004 ‒0.004 0.022 (0.023) (0.026) (0.020) (0.022) (0.021) Never married 0.052 0.009 0.010 ‒0.038 ‒0.034 (0.036) (0.038) (0.030) (0.029) (0.029) Grade 12 education 0.043 ‒0.080 0.003 0.075 ‒0.041 (0.038) (0.052) (0.039) (0.055) (0.047) Tertiary education 0.039 ‒0.063 0.035 0.008 ‒0.019 (0.047) (0.059) (0.046) (0.053) (0.053) Social pension 0.043 0.122*** ‒0.223*** 0.004 0.054 (0.026) (0.033) (0.029) (0.027) (0.029)

Demographic Research: Volume 35, Article 25
http://www.demographic-research.org 743
Table A‒3: (Continued) Cluster 1 Cluster 2 Cluster 3 Cluster 4 Cluster 5 Private pension 0.066 0.151* ‒0.144*** ‒0.053 ‒0.021 (0.045) (0.071) (0.016) (0.044) (0.043) Employs domestic help ‒0.049 ‒0.092 ‒0.051 0.014 0.178*** (0.031) (0.049) (0.028) (0.043) (0.045) Rural ‒0.100*** ‒0.027 0.117*** 0.049* ‒0.039 (0.020) (0.025) (0.026) (0.024) (0.021) Asset quintile (2) 0.051* 0.030 ‒0.051 ‒0.025 ‒0.005 (0.026) (0.032) (0.028) (0.030) (0.027) Asset quintile (3) 0.143*** ‒0.011 ‒0.098*** ‒0.007 ‒0.027 (0.027) (0.031) (0.029) (0.029) (0.027) Asset quintile (4) 0.161*** 0.017 ‒0.110** ‒0.045 ‒0.023 (0.029) (0.037) (0.036) (0.035) (0.030) Asset quintile (5) 0.135*** 0.027 ‒0.087 ‒0.046 ‒0.029 (0.037) (0.052) (0.046) (0.046) (0.041) Number of female adults ‒0.009 ‒0.052** 0.002 0.023* 0.036*** (0.014) (0.017) (0.009) (0.011) (0.010) Number of male adults ‒0.016 0.003 0.027** ‒0.018 0.004 (0.012) (0.013) (0.010) (0.010) (0.009) Number of children 0‒5 yrs 0.024 ‒0.008 0.019 ‒0.022 ‒0.013 (0.015) (0.020) (0.010) (0.013) (0.012) Number of children 6‒15 yrs ‒0.020 0.010 ‒0.001 0.017* ‒0.006 (0.011) (0.013) (0.007) (0.009) (0.009) Saturday 0.013 ‒0.060 ‒0.025 0.111** ‒0.039 (0.043) (0.043) (0.033) (0.040) (0.031) Sunday ‒0.042 ‒0.093** ‒0.052* 0.208*** ‒0.022 (0.024) (0.031) (0.021) (0.029) (0.025) Non‒typical day ‒0.057 ‒0.015 ‒0.098*** 0.042 0.128*** (0.029) (0.037) (0.017) (0.030) (0.031) Observations 3225
Source: TUS 2010. Notes: The data are weighted using population weights. The omitted categories are: aged 60 to 68; African; currently married; less than grade 12 education; no social pension receipt; no private pension receipt; urban area of residence; in the first asset quintile, weekday; and typical day. Female and male adults are aged 16 to 59 years. Standard errors are in parentheses. The marginal effects are calculated as a change in the probability for a one‒unit change in the continuous variables and for a discrete change in the dummy variables. * p < 0.05, ** p < 0.01, *** p < 0.001.
Table A‒4: The likelihood of cluster membership among elderly male South
Africans, marginal effects after multinomial regressions Cluster 1 Cluster 2 Cluster 3 Cluster 4 Cluster 5 69‒74 years ‒0.030 ‒0.017 ‒0.016 0.014 0.050 (0.026) (0.032) (0.028) (0.029) (0.028) >74 years 0.044 ‒0.100*** ‒0.096** ‒0.024 0.176*** (0.033) (0.024) (0.031) (0.028) (0.034) Coloured 0.097** ‒0.006 ‒0.069 ‒0.066 0.044 (0.037) (0.036) (0.039) (0.038) (0.043) Indian/Asian 0.095 ‒0.027 ‒0.003 ‒0.015 ‒0.050 (0.068) (0.052) (0.070) (0.067) (0.067) White 0.066 0.051 0.052 ‒0.140*** ‒0.029 (0.043) (0.047) (0.050) (0.040) (0.052)

Grapsa and Posel: Sequencing the real time of the elderly: Evidence from South Africa
744 http://www.demographic-research.org
Table A‒4: (Continued) Cluster 1 Cluster 2 Cluster 3 Cluster 4 Cluster 5 Previously married ‒0.003 0.018 ‒0.036 ‒0.026 0.046 (0.029) (0.027) (0.029) (0.024) (0.027) Never married ‒0.106** 0.052 ‒0.021 0.005 0.071 (0.035) (0.070) (0.049) (0.058) (0.050) Grade 12 education ‒0.006 ‒0.028 0.010 0.102* ‒0.078 (0.039) (0.039) (0.044) (0.051) (0.040) Tertiary education 0.015 ‒0.051 0.042 0.043 ‒0.049 (0.048) (0.044) (0.056) (0.057) (0.056) Social pension 0.096*** 0.029 ‒0.300*** 0.037 0.139*** (0.028) (0.028) (0.030) (0.027) (0.030) Private pension 0.101* 0.080 ‒0.298*** 0.163** ‒0.046 (0.043) (0.050) (0.018) (0.060) (0.048) Employs domestic help ‒0.016 ‒0.086** 0.015 0.087* ‒0.001 (0.034) (0.029) (0.041) (0.044) (0.041) Rural ‒0.057* ‒0.020 0.143*** ‒0.034 ‒0.031 (0.027) (0.028) (0.028) (0.027) (0.027) Asset quintile (2) 0.135*** ‒0.000 ‒0.065 ‒0.092* 0.022 (0.031) (0.033) (0.038) (0.044) (0.034) Asset quintile (3) 0.161*** 0.022 ‒0.045 ‒0.150** 0.012 (0.030) (0.033) (0.045) (0.047) (0.033) Asset quintile (4) 0.220*** 0.013 ‒0.116** ‒0.121* 0.003 (0.030) (0.035) (0.043) (0.050) (0.037) Asset quintile (5) 0.158*** 0.080 ‒0.093 ‒0.195*** 0.050 (0.036) (0.051) (0.055) (0.051) (0.057) Number of female adults ‒0.022 ‒0.030* ‒0.007 0.010 0.049*** (0.013) (0.014) (0.013) (0.013) (0.012) Number of male adults ‒0.037* 0.005 0.031* 0.010 ‒0.009 (0.016) (0.016) (0.015) (0.016) (0.013) Number of children 0‒5 yrs 0.007 ‒0.015 0.038* ‒0.006 ‒0.024 (0.021) (0.021) (0.017) (0.019) (0.019) Number of children 6‒15 yrs ‒0.029 0.005 0.017 0.004 0.003 (0.016) (0.012) (0.012) (0.012) (0.011) Saturday ‒0.056 0.030 ‒0.078 0.053 0.050 (0.042) (0.055) (0.049) (0.049) (0.056) Sunday 0.032 ‒0.072* ‒0.141*** 0.181*** ‒0.001 (0.037) (0.028) (0.033) (0.040) (0.030) Non‒typical day ‒0.126*** 0.017 ‒0.125*** 0.041 0.192*** (0.029) (0.052) (0.032) (0.036) (0.045) Observations 1841
Source: TUS 2010. Notes: The data are weighted using population weights. The omitted categories are: aged 60 to 68; African; currently married; less
than grade 12 education; no social pension receipt; no private pension receipt; urban area of residence; in the first asset quintile, weekday; and typical day. Female and male adults are aged 16 to 59 years. Standard errors are in parentheses. The marginal effects are calculated as a change in the probability for a one‒unit change in the continuous variables and for a discrete change in the dummy variables.
* p < 0.05, ** p < 0.01, *** p < 0.001.