Sequence and structure databanks can be divided into many different categories. One of the most...
12
Sequence and structure databanks e divided into many different categories. f the most important is Supervised databanks with gatekeeper. Examples: Swissprot Refseq (at NCBI) Entries are checked for accuracy. + more reliable annotations Repositories without gatekeeper. Examples: GenBank EMBL TrEMBL Everything is accepted + everything is available
-
date post
20-Dec-2015 -
Category
Documents
-
view
217 -
download
0
Transcript of Sequence and structure databanks can be divided into many different categories. One of the most...

Sequence and structure databanks can be divided into many different categories. One of the most important is
Supervised databanks with gatekeeper. Examples:
SwissprotRefseq (at NCBI)
Entries are checked for accuracy.+ more reliable annotations-- frequently out of date
Repositories without gatekeeper. Examples:
GenBankEMBLTrEMBL
Everything is accepted + everything is available-- many duplicates-- poor reliability of annotations
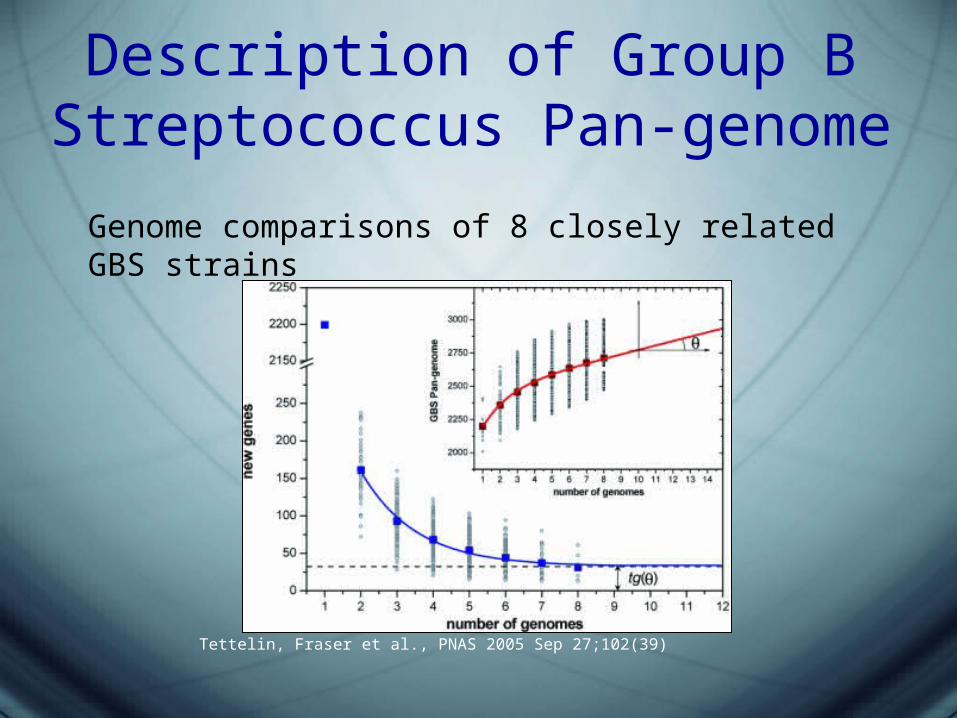
Description of Group B Streptococcus Pan-genome
Genome comparisons of 8 closely related GBS strains
Tettelin, Fraser et al., PNAS 2005 Sep 27;102(39)

Method

Bacterial CoreGenes that are shared among all
Bacteria
Bit score cutoff 50.0 (~10E-4)
f(x) = A1*exp(-K1*x) + A2*exp(-K2*x) + A3*exp(-K3*x) + Plateau

Genes without homologs
f(x) = A1*exp(-K1*x) + A2*exp(-K2*x) + A3*exp(-K3*x) + A4*exp(-K4*x)
+ A5*exp(-K5*x) + Plateau

Decomposed function

Core
Essential genes(Replication, energy,
homeostasis)
~ 116 genefamilies
Extended Core
Set of genes that define groups or species
(Symbiosis,photosynthesis)
~ 17,060 genefamilies
Accessory PoolGenes that can be used to distinguish strains or
serotypes(Mostly genes of unknown functions)
~ 114,800 geneFamilies uncovered so far
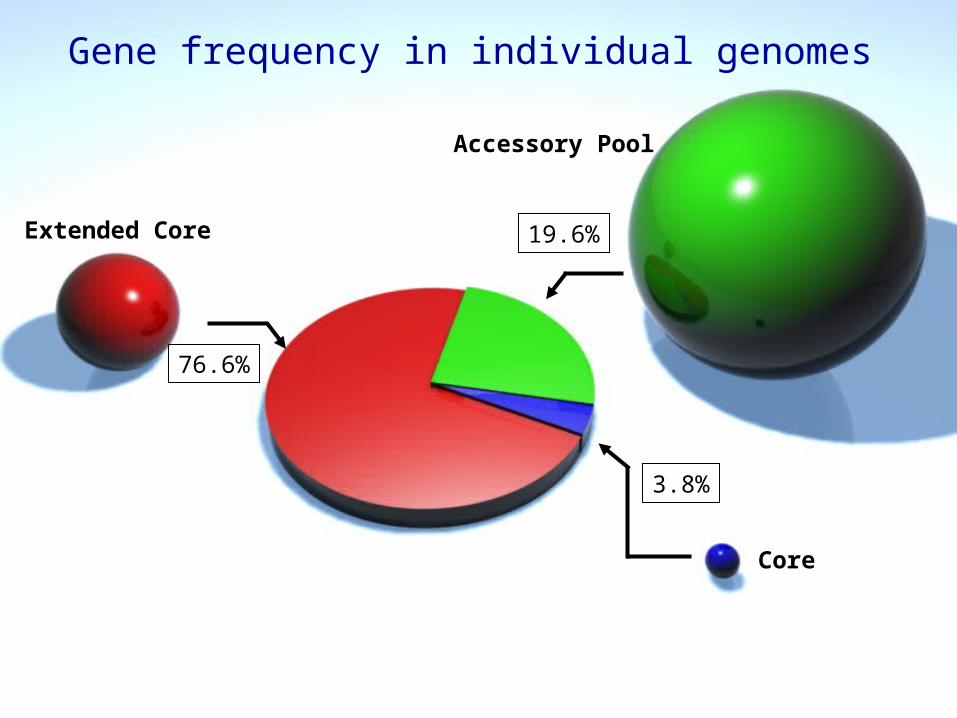
76.6%
3.8%
19.6%
Gene frequency in individual genomes
Core
Extended Core
Accessory Pool

f(x) = A1*exp(-k1*x) + A2*exp(-k2*x) + A3*exp(-k3*x) + A4*exp(-k4*x) + A5*exp(-k5*x) + Plateau
1/k1 = 0.48 1/k2 = 2.31/k3 = 10.161/k4 = 31.401/k5 = 162.6
A1 = 939.4A2 = 731.1A3 = 455.2A4 = 328.6A5 = 385.5
Number of genomes added
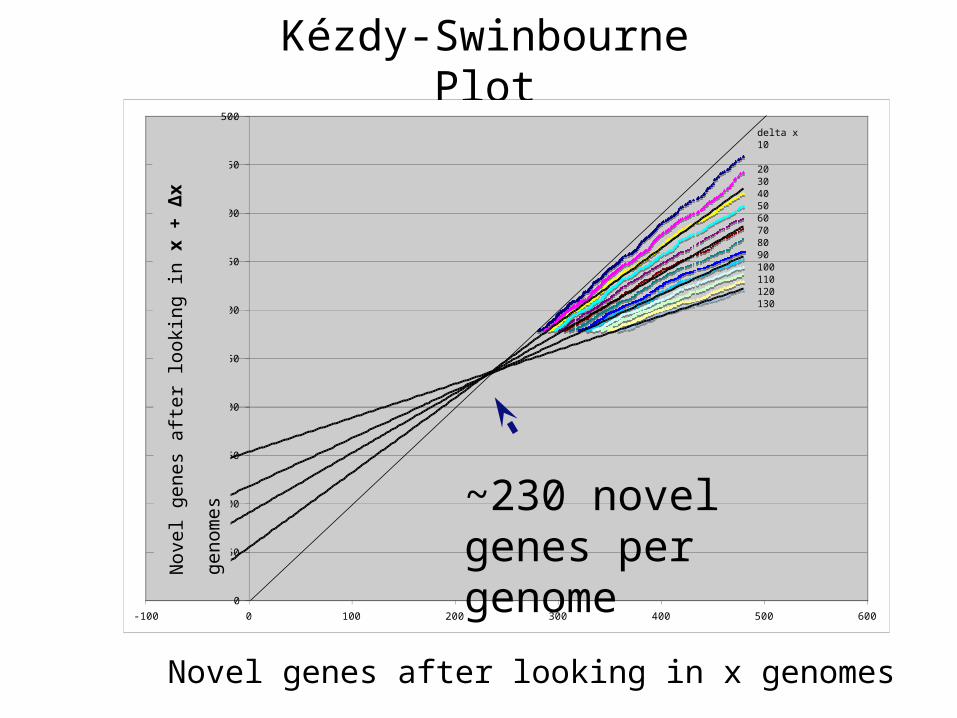
Kézdy-Swinbourne Plot
0
50
100
150
200
250
300
350
400
450
500
-100 0 100 200 300 400 500 600
delta x = 10
2030405060708090100110120130
Novel genes after looking in x genomes
Nov
el g
enes
aft
er lo
oki
ng
in x
+ ∆
x ge
nom
es
~230 novel genes per genome
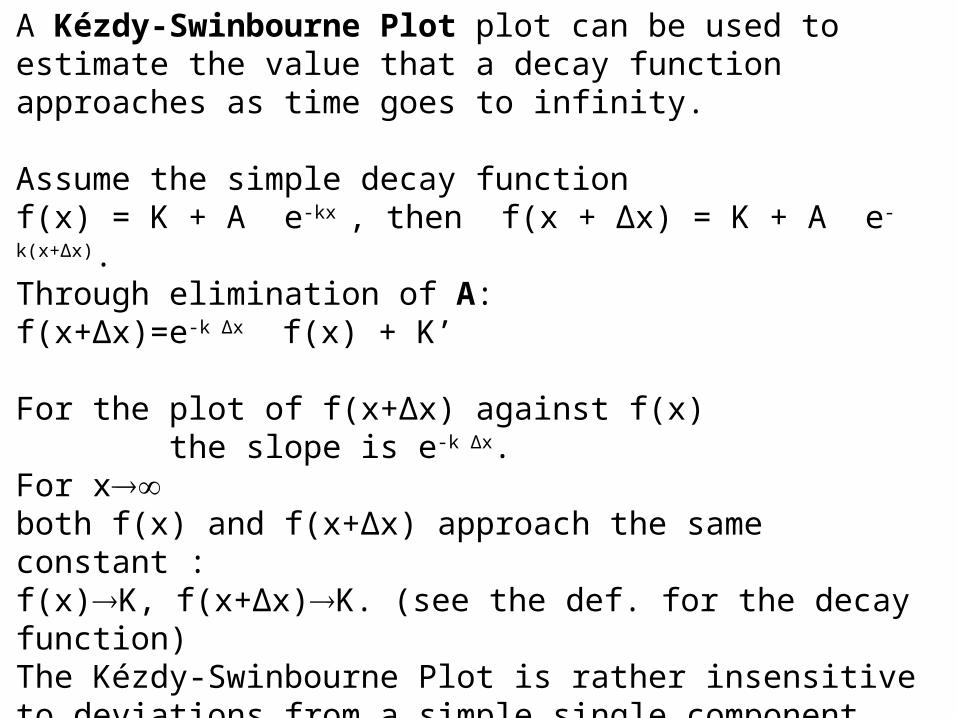
A Kézdy-Swinbourne Plot plot can be used to estimate the value that a decay function approaches as time goes to infinity.
Assume the simple decay function f(x) = K + A e-kx , then f(x + ∆x) = K + A e-k(x+∆x).Through elimination of A: f(x+∆x)=e-k ∆x f(x) + K’
For the plot of f(x+∆x) against f(x) the slope is e-k ∆x. For x both f(x) and f(x+∆x) approach the same constant : f(x)K, f(x+∆x)K. (see the def. for the decay function)The Kézdy-Swinbourne Plot is rather insensitive to deviations from a simple single component decay function.
More at Hiromi K: Kinetics of Fast Enzyme Reactions. New York: Halsted Press (Wiley); 1979

Kézdy-Swinbourne Plot
0
50
100
150
200
250
300
350
400
450
500
-100 0 100 200 300 400 500 600
delta x = 10
2030405060708090100110120130
Novel genes after looking in x genomes
Nov
el g
enes
aft
er lo
oki
ng
in x
+ ∆
x ge
nom
es
~230 novel genes per genome