
Septic Audit Project Final Report - Corangamite Shire · 1 Planning scheme zones thematically...
69
Transcript of Septic Audit Project Final Report - Corangamite Shire · 1 Planning scheme zones thematically...

1

11
......................................................................................................................... i
......................................................................................................... ii ........................................................................................................... 1
................................................................................ 2
........................................................................................................................... 4
.............................................................................. 4
.......................................................................................................... 4
........................................................................................ 4
................................................................................... 5
.................................................................................. 5
............................................................................................ 6
.......................................................................................... 6
....................................................................................... 6
........................................................ 7
.............................................................................................. 7
.............................................................................................. 8
........................................................................................................... 8
........................................................................... 9
.............................................................................................. 9
.................................................. 9
................... 9
............................. 13
................................... 13
.............................................................................. 17
............................................................................................... 17
..................... 17
.................................................................................. 17
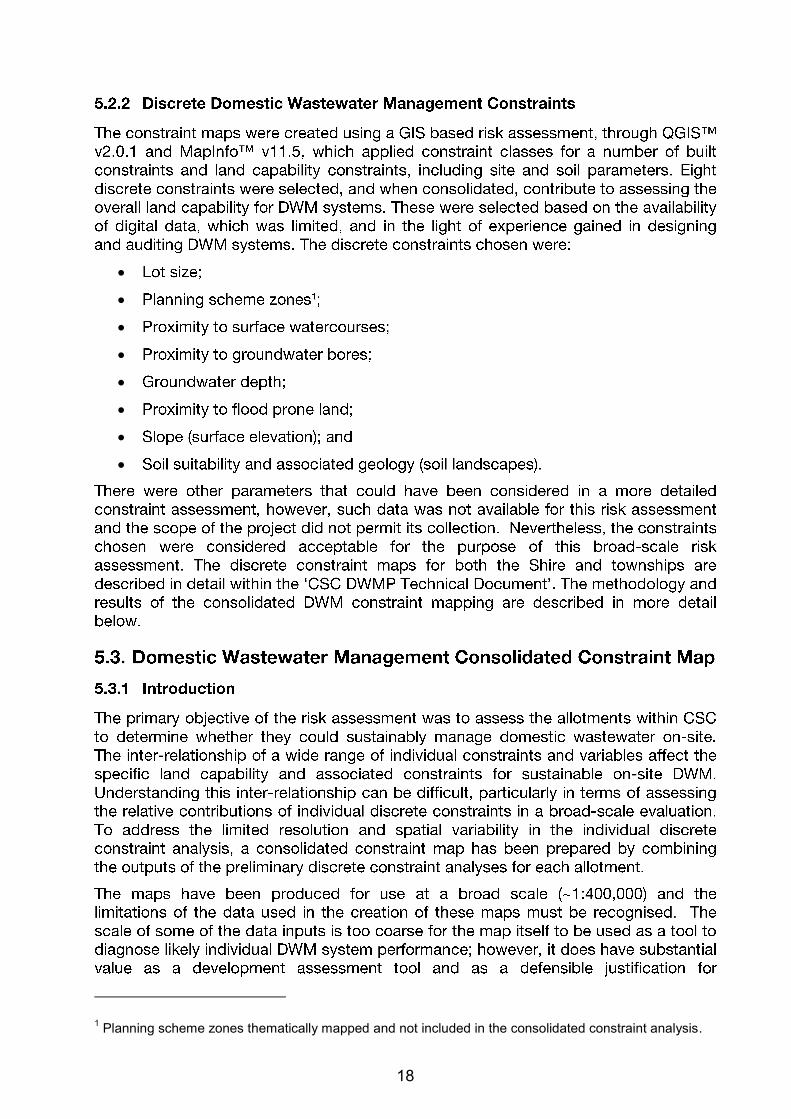
........................ 18
................ 18
................................................................................................ 18
............................................ 19
.................................................... 21

.......... 23
........................................ 48
................................................................................................. 49
...................................................................................... 50
............................................................................. 50
............................................................. 50
............................................................................ 50
.......................................................................... 50
....................................................................................................... 51
................................................................................... 51
........................................................................................................... 54
.................................................................................................... 56
............................................................................................................. 59

i

ii
iii

iv

v

1

2

3

4

5

6

7
8

9

10

11

12

13

14
15

16

17
18
1 Planning scheme zones thematically mapped and not included in the consolidated constraint analysis.

19

20

21

22
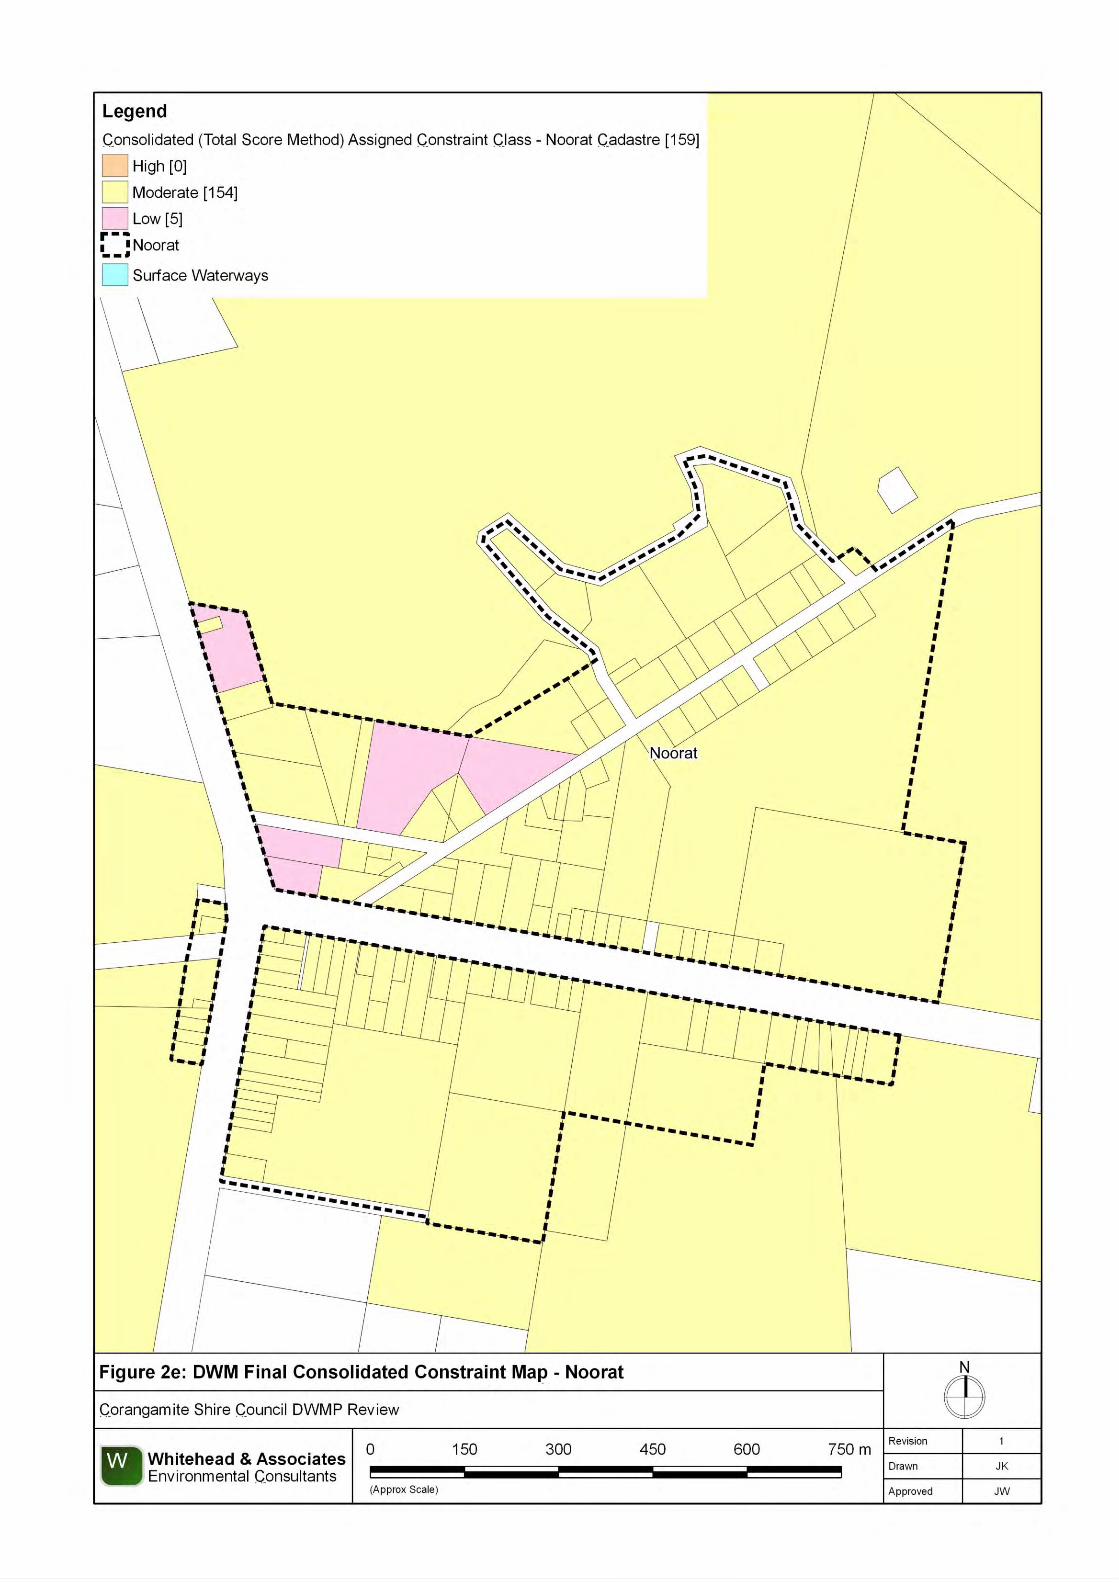
2 For the consolidated constraint of a given lot to be assigned a high constraint class, there needs to be at least one high discrete constraint and the rest all moderate constraints or varying combination with more than one high constraint or the depth to groundwater is ‘non-compliant’ which will increase a moderate constraint to a high constraint.
High = 13 - 18 Moderate = 7 - 12 Low = 6

23

24

25

26

27

28

29

30

31

32

33

34

35

36

37

38
39

40

41

42

43
44

45

46

47

48

49

50
51
o o
o
o o
o o
52
53
55

56

57
58

59

60
150
DLR
(mm/day)
Base
Area (m2)
Length
0.5m Wide
Trench
DLR
(mm/day)
Base
Area (m2)
Length
0.5m
Wide
Trench
DLR
(mm/day)
Base
Area (m2)
DLR
(mm/day)
Base
Area (m2)
Length
0.5m
Wide
Trench
1 300 13 12 242 450 19 18 363 600 25 24 484 750 31 30 605 900 38 36 72
1 300 13 10 202 450 19 15 303 600 25 20 404 750 31 25 505 900 38 30 60
1 300 20 40 20 40 13 10 202 450 30 60 30 60 19 15 303 600 40 80 40 80 25 20 404 750 50 100 50 100 31 25 505 900 60 120 60 120 38 30 60
1 300 20 40 20 40 13 10 202 450 30 60 30 60 19 15 303 600 40 80 40 80 25 20 404 750 50 100 50 100 31 25 505 900 60 120 60 120 38 30 60
1 300 30 60 30 60 19 10 202 450 45 90 45 90 28 15 303 600 60 120 60 120 38 20 404 750 75 150 75 150 47 25 505 900 90 180 90 180 56 30 60
1 300 30 60 30 60 19 10 202 450 45 90 45 90 28 15 303 600 60 120 60 120 38 20 404 750 75 150 75 150 47 25 505 900 90 180 90 180 56 30 60
1 300 50 100 38 75 38 15 302 450 75 150 56 113 56 23 453 600 100 200 75 150 75 30 604 750 125 250 94 188 94 38 755 900 150 300 113 225 113 45 90
1 300 75 150 60 120 5 60 30 602 450 113 225 90 180 90 45 903 600 150 300 120 240 120 60 1204 750 188 375 150 300 150 75 1505 900 225 450 180 360 180 90 180
1 300 60 120 38 75 38 25 502 450 90 180 56 113 56 38 753 600 120 240 75 150 75 50 1004 750 150 300 94 188 94 63 1255 900 180 360 113 225 113 75 150
1 300 30 602 450 45 903 600 60 1204 750 75 1505 900 90 180
1 300 38 752 450 56 112.53 600 75 1504 750 94 187.55 900 113 225
1 300 60 1202 450 90 1803 600 120 2404 750 150 3005 900 180 360
1 300 60 1202 450 90 1803 600 120 2404 750 150 3005 900 180 360
1 300 60 1202 450 90 1803 600 120 2404 750 150 3005 900 180 360
6b <0.06
6c <0.06
5 (See Note to Table N1)
5 (See Notes 2, 3 and 5 in Table L1)
(See Notes 2 and 3 in Table L1)
5c <0.06 8
6a 0.06 - 0.5
5 8 8 12
5b 0.06 - 0.12 10
6 8 8 20
4c 0.06 - 0.12 4 5 (See Note to Table
N1)
10
10 12 16 30
15 15 24 30
3b 0.5 - 1.5 10 10 16 30
NA 24 30
2b 1.4 - 3.0 15 15 24 30
Measured or
Indicative Ksat
(m/day)
>3.0 24NANA
>3.0 NA
House Size
(Number of
Bedrooms)
Wastewater
Volume
(L/day)
1.5 - 3.0
0.5 - 1.5
0.12 - 0.5
0.12 - 0.5
5
Primary Effluent
Daily Water Use Per Equivalent Persons (EP) (L)
Recommended Maximum Design Loading/Irrigation Rates (Table 9, Appendix A, EPA 891.3)
Absorption Trenches/Beds &
Wick Trench/Beds
Evapotranspiration - Absorption
Beds & Trenches
Absorption Trenches/Beds &
Wick Trench/Beds
Secondary EffluentPrimary Effluent
MoundsSoil
Category
AS/NZS
1547:2012
1 25
2a
3a
4a
4b
5a

61
150
Irrigation
Area (m2)
Irrigation
Area (m2)
1 300 602 450 903 600 1204 750 1505 900 180
1 300 602 450 903 600 1204 750 1505 900 180
1 300 60 752 450 90 1133 600 120 1504 750 150 1885 900 180 225
1 300 75 862 450 113 1293 600 150 1714 750 188 2145 900 225 257
1 300 75 862 450 113 1293 600 150 1714 750 188 2145 900 225 257
1 300 86 1002 450 129 1503 600 171 2004 750 214 2505 900 257 300
1 300 85.7 1002 450 128.6 1503 600 171.4 2004 750 214.3 2505 900 257.1 300
1 300 85.7 1002 450 128.6 1503 600 171.4 2004 750 214.3 2505 900 257.1 300
1 300 100 1202 450 150 1803 600 200 2404 750 250 3005 900 300 360
1 300 100 1202 450 150 1803 600 200 2404 750 250 3005 900 300 360
1 300 100 1202 450 150 1803 600 200 2404 750 250 3005 900 300 360
1 300 1502 450 2253 600 3004 750 3755 900 450
1 300 1502 450 2253 600 3004 750 3755 900 450
1 300 1502 450 2253 600 3004 750 3755 900 450
2 (See Note 2 in Table
M1)
2 (See Note 2 in Table
M1)
6b <0.062
(See Note 2 in Table M1)
5c <0.063
(See Note 1 in Table M1)
2.5 (See Note 4 in Table
M1)
3
4c 0.06 - 0.123.5
(See Note 1 in Table M1)
3
4 (See Note 1 in Table
M1)3.5
4a 0.5 - 1.53.5
(See Note 1 in Table M1)
3
NA
5 (See Note 2 in Table M1)
2b 1.4 - 3.0 4
Recommended Maximum Design Loading/Irrigation Rates (Table 9, Appendix A, EPA 891.3)
Soil
Category
AS/NZS
1547:2012
Measured or
Indicative Ksat
(m/day)
House Size
(Number of
Bedrooms)
Wastewater
Volume
(L/day)
Daily Water Use Per Equivalent Persons (EP) (L)
DIR (mm/day)
NA
DIR values from this Table may be used in the MAV Water & Nutrient Balance Model
Sub-surface and Surface
Irrigation (See Table M1 in
AS/NZS 1547:2012 )
LPED (See Table M1 in
AS/NZS 1547:2012 )
Secondary Treated Effluent
DIR (mm/day)
>3.01
2a >3.0
3a 1.5 - 3.0
3b 0.5 - 1.5
4b 0.12 - 0.53.5
(See Note 1 in Table M1)
5a 0.12 - 0.53
(See Note 1 in Table M1)
2.5 (See Note 4 in Table
M1)
5b 0.06 - 0.123
(See Note 1 in Table M1)
2.5 (See Note 4 in Table
M1)
6a 0.06 - 0.5
6c <0.06