SEPTEMBER QUARTER 2019 - Women's money matters. …
37
Our dedicated & fearless sponsors 10 th Anniversary Report: Fearlessly Supporng the Economic Progress of Women SEPTEMBER QUARTER 2019
Transcript of SEPTEMBER QUARTER 2019 - Women's money matters. …
Our dedicated & fearless sponsors
10th Anniversary Report:Fearlessly Supporting the Economic Progress of Women
SEPTEMBER QUARTER 2019
Financy Women’s Index Report: July 2019 – September 2019
2FWX© | Financy.com.au | proudly sponsored by OneVue, AMP Australia & AFA
FOREWORD 3
10 BIG IDEAS FOR PROGRESS 4
LEADERSHIP THOUGHTS 6
ECONOMIC EQUALITY 8
KEY RESULTS 9
TERTIARY EDUCATION 12
WOMEN IN UNPAID WORK 16
WOMEN IN THE PAID WORKFORCE 20
GENDER PAY GAP 25
WOMEN ON BOARDS 30
SUPERANNUATION GAP 32
FWX ADVISORY COMMITTEE 35
METHODOLOGY 36
ABOUT THE WOMEN’S INDEX & DISCLAIMER 37
CONTENTS:
THE 10TH QUARTERLY REPORT OF THE FINANCY WOMEN’S INDEXJULY – SEPTEMBER 2019A Financy initiative, fearlessly supported by OneVue, AMP Australia & AFA
FWX© | Financy.com.au | proudly sponsored by OneVue, AMP Australia & AFA 3
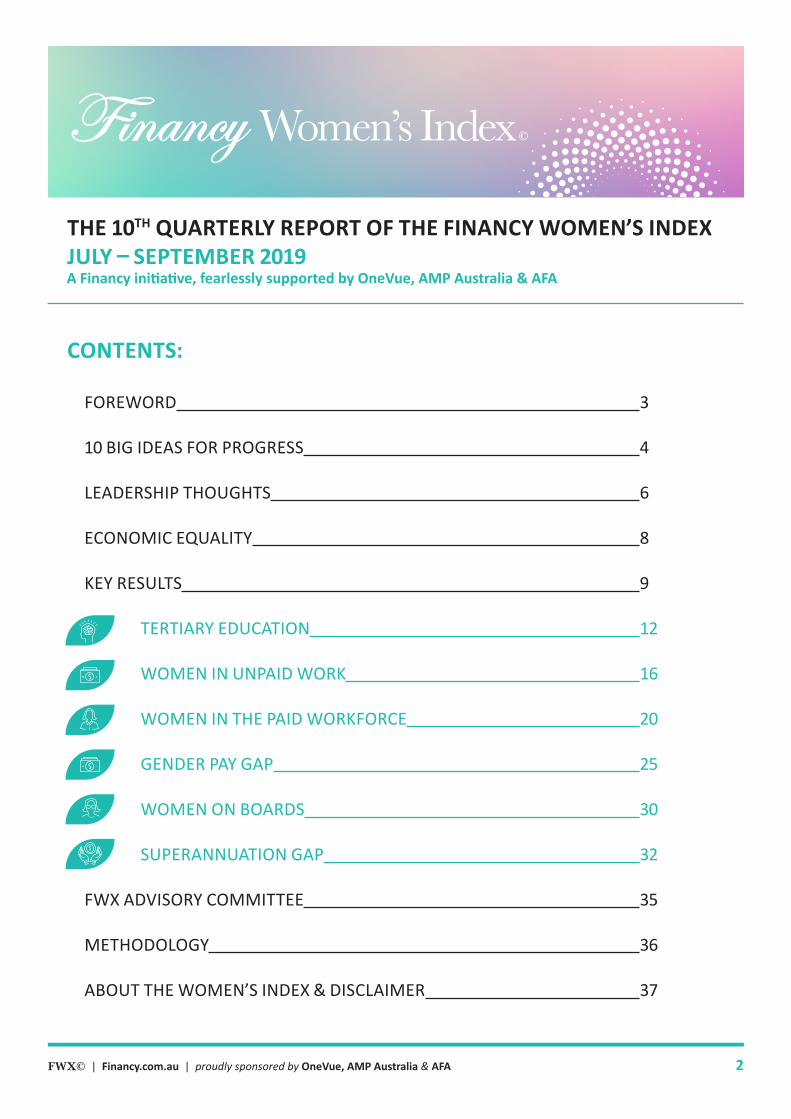
Financial inequality is a major obstacle to the progress of women.
The Financy Women’s Index is a scorecard that measures financial progress and inequality across eight areas that are important to the advancement of Australian women.
This September quarter Index is made possible with the sponsorship support of OneVue Holdings, AMP Australia and the Association of Financial Advisors.
This Report provides analysis and commentary on the gains and challenges facing women in pursuit of economic equality with men.
Estimated time frames of inequality and suggested actions are also provided to both highlight and help address areas of disadvantage and in support of financial progress.
The Women’s Index is written for Australian women, business and government.
Financy Women’s Index Report: July 2019 – September 2019
It is made possible with the help of Financy Women’s Index (FWX) Advisory panelists Dr Shane Oliver, Nicki Hutley, Roger Wilkins, Joanne Masters, Heidi Sundin, Bruce Hockman, as well as the Australian Bureau of Statistics and data analyst Dan Petrie. Creative works are produced by We Are Why Pty Ltd.
The Report is written by Bianca Hartge-Hazelman and includes analysis of government and industry statistics, as well as national survey data on unpaid work, tertiary education, employment, workplace participation, wages, superannuation, data on the board representation of Australia’s largest companies.
Ultimately, the purpose of the Index is to help inspire women to live more courageously and confidently – to be Fearless.
Inspiring women through insightsto live more courageously & confidently– to be FEARLESS
Financy Women’s Index Report: July 2019 – September 2019
4FWX© | Financy.com.au | proudly sponsored by OneVue, AMP Australia & AFA
What’s needed is an Australian workforce that truly supports both genders, without the conscious or unconscious penalty for difference. It’s commonly cited that women tend to be at a financial disadvantage to men because of career breaks or because we choose to do more unpaid work, particularly as primary carers of loved ones. But as this Financy Women’s Index shows, career breaks and a significant imbalance in unpaid work, aren’t the only reason for economic inequality in Australia. Financial disadvantage starts early. We see it in 15-year-old girls with gender gaps in unpaid and paid work, even pocket money. We see it in graduate salaries, only to watch the gender pay gap widen the longer a woman stays in the workforce. We also see it in the retirement phase. While an evolution of the workforce is underway, bigger ideas are needed to fast track economic equality in the school system, the workforce, society and at home. So as part of the 10th edition of the Financy Women’s Index (FWX), I will leave you with ten big ideas that we believe would make a transformational impact in the quest for financial equality in Australia.
These ideas are the result of brainstorming efforts by the FWX Advisory committee and the government funded organisation, economic Security4Women.
10TH BIRTHDAY & 10 BIG IDEAS ON ECONOMIC EQUALITY
As a 10-year-old girl, gender equality was foreign to me but if I actually reflect on my childhood it was about that age that I remember being told to stop throwing a ball like a girl. Admittedly my pass of a softball was more of a flop than a dazzling angling of the elbow and flick of the wrist. My brother had a style down pat that allowed a ball to travel further and faster, so I copied him and developed a competitive edge. I hear similar stories from many women, which at times have seen them adapt to essentially be more like a man in a man’s game, a man’s workforce, and a man’s world. While this experience is slowly changing as gender struggles are highlighted and differences often celebrated, the fact remains that the Australian workforce is still influenced by a historically male dominated culture, particularly at the leadership level. Some large corporations are however more progressive and are adopting non-gendered flexible work and parental leave policies, others have recognised that diversity of leadership at the top breeds diversity across an organisation, and even some financial institutions are boldly investing in support of gender equality on the basis that it can produce better returns for investors. Despite this, many women are still waiting for their employers to catch up. They may even be asking for change but until it happens they adhere to gender stereotypes that again require them to juggle being more like the traditional man at work, and woman at home.
Bianca Hartge-HazelmanFounder of the FinancyWomen’s Index
Financy Women’s Index Report: July 2019 – September 2019
5FWX© | Financy.com.au | proudly sponsored by OneVue, AMP Australia & AFA
10TH BIRTHDAY & 10 BIG IDEAS ON ECONOMIC EQUALITY
1. 2.3.4.5.6.7.8.9.
10.
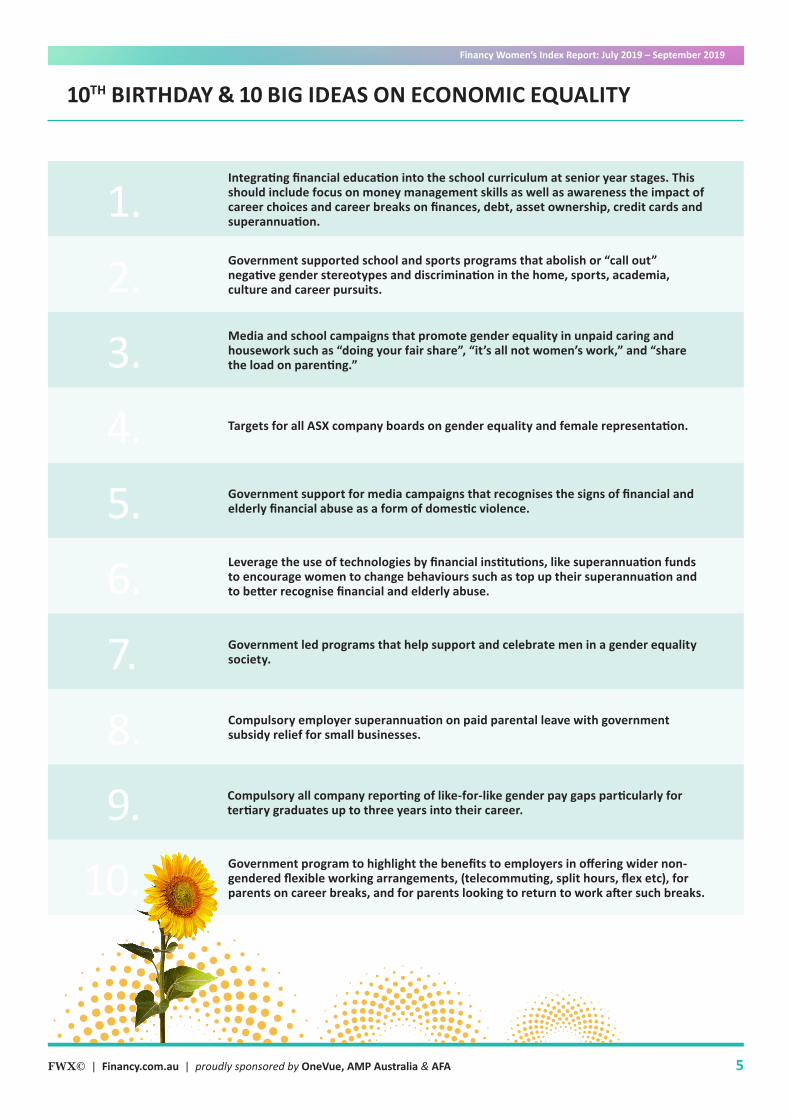
Government support for media campaigns that recognises the signs of financial and elderly financial abuse as a form of domestic violence.
Leverage the use of technologies by financial institutions, like superannuation funds to encourage women to change behaviours such as top up their superannuation and to better recognise financial and elderly abuse.
Government led programs that help support and celebrate men in a gender equality society.
Compulsory all company reporting of like-for-like gender pay gaps particularly for tertiary graduates up to three years into their career.
Government program to highlight the benefits to employers in offering wider non-gendered flexible working arrangements, (telecommuting, split hours, flex etc), for parents on career breaks, and for parents looking to return to work after such breaks.
Compulsory employer superannuation on paid parental leave with government subsidy relief for small businesses.
Integrating financial education into the school curriculum at senior year stages. This should include focus on money management skills as well as awareness the impact of career choices and career breaks on finances, debt, asset ownership, credit cards and superannuation.
Government supported school and sports programs that abolish or “call out” negative gender stereotypes and discrimination in the home, sports, academia, culture and career pursuits.
Media and school campaigns that promote gender equality in unpaid caring and housework such as “doing your fair share”, “it’s all not women’s work,” and “share the load on parenting.”
Targets for all ASX company boards on gender equality and female representation.
Financy Women’s Index Report: July 2019 – September 2019
6FWX© | Financy.com.au | proudly sponsored by OneVue, AMP Australia & AFA
Connie McKeageCEOOneVue
LEADERSHIP THOUGHTS: THE EMPEROR’S NEW CLOTHES
I always look forward to reading the Women’s Index. I want to know what has been achieved in the quarter and I need to see what more we can do to progress faster. Each time I see the percentage of unpaid work undertaken by women however and I look around me, especially households with younger children, I can’t help but wonder if we have just packed on full time employment on top of our unpaid domestic duties.
If we are to succeed in the work force and increase the percentages of women in management then we need to let go. Of course women can have it all, we just cannot do it all.
We must learn to delegate the things that really don’t positively impact the quality of our relationships and focus on the things that do.
If we don’t we will be hurt by burnout and burnout affects not only us but also our families, employees, and the companies we work for.
So ladies if you are headed up the ladder look after yourself and get some help. You don’t have to take on the burden of the physical and emotional stress of high levels of unpaid work in addition or instead of employment.
So let’s not only start taking control of our work lives let’s start taking control of our lives. If you need to start with outsourcing the ironing just give me a call – I have the name of a great ironing service, pick up and delivery!
Yes I can see that we’re making progress – slowly but surely – but like short-term investment returns let’s not take it as an indicator of longer term performance.
More women are entering the workforce, the numbers look great – if you’ve miss the fact that the largest percentage increase is in women over 50. Why are we entering the workforce later in life? Is it driven by a burning ambition now that we are empty nesters or the fact that we have faced the stark reality that we don’t have enough money to retire.
And don’t get me going about unpaid work. Let’s face it – the majority of women do more work around the house, whether or not they are in paid employment. So what does this all add up to?
Well it’s been a long day and I still need to order the groceries online, the ironing needs to be organised, the dogs fed, and oh right I have pack a suitcase for my interstate trip tomorrow. Yes our household runs like a well-oiled machine - until it doesn’t. Does this sound familiar?
What we don’t see in the numbers is the number of people, especially women who are burning out trying to do it all.
In fact, burnout is becoming so common that the World Health Organization (WHO) recently classified it as an “occupational phenomenon” and added it to their International Classification of Diseases.
Financy Women’s Index Report: July 2019 – September 2019
7FWX© | Financy.com.au | proudly sponsored by OneVue, AMP Australia & AFA
LEADERSHIP THOUGHTS: NOT JUST A WOMAN’S ISSUE
We know that the gender retirement gap is reducing, with statistics from the ABS showing the gap is now at 28 per cent.
This is a record low, although we shouldn’t lose sight of the fact the difference between the retirement incomes of men and women is still incredibly large.
Solving the gender retirement gap will take a combined effort from government and business.
Workplace flexibility is one of the keyways to help parents stay in the workforce.
It’s a fact of life working mums and dads have a lot on their plate – the mental load is a very real thing.
Progressive companies who offer parents flexibility to help with school start times for example, retain some of their best and brightest employees who otherwise may have retreated from the workforce.
Increasing education standards, starting in school, about how our superannuation system works and the impact if making voluntary contributions to help make up for time spent out of the workforce may also be effective.
At a government level, particularly with the Retirement Income Review underway we should be working towards policies to help working parents make up the retirement super gap.
There’s no one silver bullet here and realistically solving this problem will take time – but that shouldn’t stop us from trying. My children are now older and my husband and I have combined our super so that we can grow it together.
My aspiration is for us to get to a point through awareness, education and action, where all Australians can retire with an income that enables them to live their best life after work.
Too often the retirement super gap is pegged as an issue for women alone and I think this position misses the mark.
The retirement super gap is an issue for all Australian families. For us to make real headway to achieve equality between men and women in retirement, we need to consider how we as a country support the people who take time out of the workforce to do the important job of raising the next generation.
Our super system is built on the basic premise the more you put in the more you have to take out in when you stop working.
This is good news for those who are employed full time without career breaks, but for women predominantly, who take time out to care for children, it can have a devastating impact on the amount of money they have in retirement.
In my personal case, it was the reverse. My husband has been the primary carer for our two children. However, after 25 years of working as an ambulance officer, and having taken several career breaks to support our children and to help me lean in at work – we realised he had built up very little super.
This is a problem echoed around the dinner tables of families across Australia.
We know that it mainly impacts women, but as we break down gender stereotypes and change the ingrained views about the roles men and women play working and raising our young – we will find the retirement income gap becomes a bigger issue for men as well.
Latest figures from the Australian Bureau of Statistics (ABS) show 70 per cent of women with children under 15 are now in paid employment.
There has also been a rise in both parents working five days per week, with 21 per cent of families with children aged 0-4 years old now employed fulltime.
The traditional dynamics of the Australian family unit are changing. If you live in a capital city in Australia, particularly Sydney or Melbourne, two incomes are often required to support ever increasing mortgages.
This means women are now contributing more money to their super which is a good thing for retirement.
Lara BourguignonAMP Managing Director Superannuation
WORK WORK
WAGESWAGES
WEALTHWEALTH
LEADERSHIPLEADERSHIP
2019Economic
Progress
ECONOMIC EQUALITY
Financy Women’s Index Report: July 2019 – September 2019
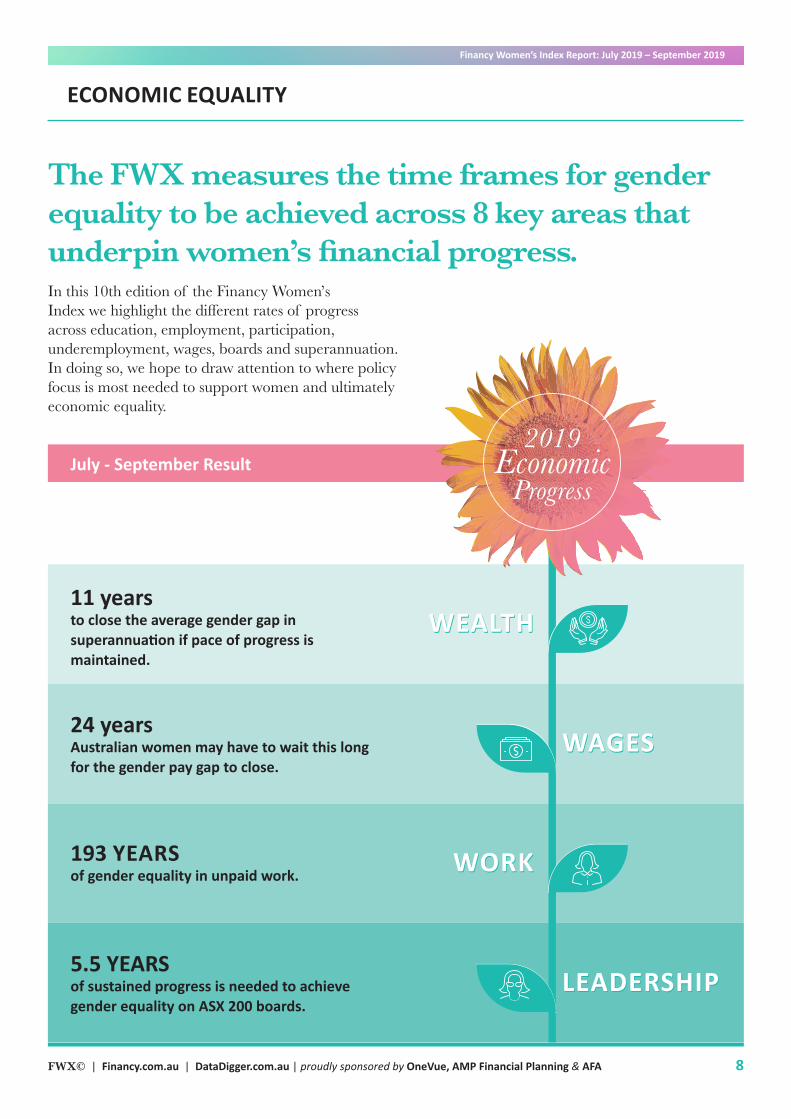
The FWX measures the time frames for gender equality to be achieved across 8 key areas that underpin women’s financial progress.
FWX© | Financy.com.au | DataDigger.com.au | proudly sponsored by OneVue, AMP Financial Planning & AFA 8
193 YEARSof gender equality in unpaid work.
July - September Result
24 years Australian women may have to wait this long for the gender pay gap to close.
5.5 YEARSof sustained progress is needed to achieve gender equality on ASX 200 boards.
11 yearsto close the average gender gap in superannuation if pace of progress is maintained.
In this 10th edition of the Financy Women’s Index we highlight the different rates of progress across education, employment, participation, underemployment, wages, boards and superannuation.In doing so, we hope to draw attention to where policy focus is most needed to support women and ultimately economic equality.
Financy Women’s Index Report: July 2019 – September 2019
9FWX© | Financy.com.au | proudly sponsored by OneVue, AMP Australia & AFA
Key findings
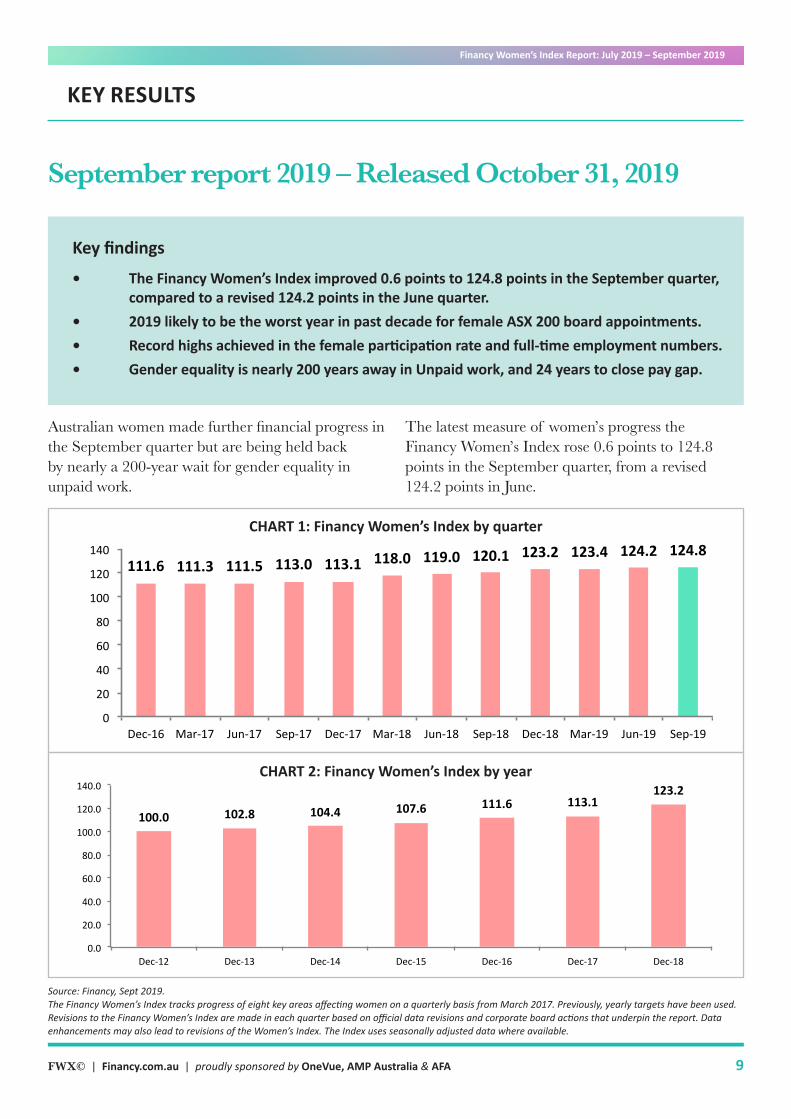
• The Financy Women’s Index improved 0.6 points to 124.8 points in the September quarter, compared to a revised 124.2 points in the June quarter.
• 2019 likely to be the worst year in past decade for female ASX 200 board appointments.• Record highs achieved in the female participation rate and full-time employment numbers.• Gender equality is nearly 200 years away in Unpaid work, and 24 years to close pay gap.
September report 2019 – Released October 31, 2019
KEY RESULTS
Australian women made further financial progress in the September quarter but are being held back by nearly a 200-year wait for gender equality in unpaid work.
The latest measure of women’s progress the Financy Women’s Index rose 0.6 points to 124.8 points in the September quarter, from a revised 124.2 points in June.
111.6 111.3 111.5 113.0 113.1 118.0 119.0 120.1 123.2 123.4 124.2 124.8
172.0
0
20
40
60
80
100
120
140
160
180
200
Dec-16 Mar-17 Jun-17 Sep-17 Dec-17 Mar-18 Jun-18 Sep-18 Dec-18 Mar-19 Jun-19 Sep-19 FWXTarget
Women'sIndex
CHART 1: Financy Women’s Index by quarter
100.0 102.8 104.4 107.6 111.6 113.1123.2
0.0
20.0
40.0
60.0
80.0
100.0
120.0
140.0
Dec-12 Dec-13 Dec-14 Dec-15 Dec-16 Dec-17 Dec-18
Women'sIndexbyYearCHART 2: Financy Women’s Index by year
Source: Financy, Sept 2019.The Financy Women’s Index tracks progress of eight key areas affecting women on a quarterly basis from March 2017. Previously, yearly targets have been used. Revisions to the Financy Women’s Index are made in each quarter based on official data revisions and corporate board actions that underpin the report. Data enhancements may also lead to revisions of the Women’s Index. The Index uses seasonally adjusted data where available.
Financy Women’s Index Report: July 2019 – September 2019
10FWX© | Financy.com.au | proudly sponsored by OneVue, AMP Australia & AFA
The September quarter gain, which is less than the 0.8 point improvement in the June quarter, reflects improved progress in female full-time employment and participation, but weakness in the unpaid work gender disparity and a slight drop in female board representation.
Women occupied 29.5% of ASX 200 board positions in September, compared to 29.7% in June, which is also where it stood in December of 2018.
In the year to September, the Women’s Index climbed 4.7 points, which is a solid result but not nearly as strong as the 7.1 point gain in the 12 months to September 2018, which reflects a better period for Corporate Australia taking action on improving gender diversity on ASX 200 boards.
The dip in ASX 200 female directorships comes as the number of women employed full-time in the Australian workforce hit a record high of 3.31 million in September compared to a revised 3.26 million in June.
The participation rate of women rose to a seasonally adjusted 61.2% in September from 60.9% in June, while for men it fell to 71.2% from 71.3% over the same period.
The September Women’s Index quarterly result also benefited from a narrowing of the gender pay gap and superannuation savings gap.
Australia’s gender pay gap fell to a fresh low of 14.02% in the quarter, helped by increased full-time workforce participation among women.
The average Australian woman is also likely to retire with 28% less in superannuation savings than the average man, according to the Australian Bureau of Statistics (ABS) superannuation balance data for the 2017-18 financial year. This is an improvement on the 34% gap recorded in the 2015-16 financial year.
KEY RESULTS
The September quarter result means that Australian women have made 24.8% progress since 2012 in addressing financial inequalities across eight key areas measured by the Index, which are tertiary education, employment, work participation, underemployment, wages, unpaid work, leadership and superannuation.
In this 10th edition of the Financial Women’s Index, we have delved further into these eight areas to calculate the extent of inequality by measuring the average annual growth rate between the September 2019 and 2012.
What we have discovered is that the pace of progress is extremely varied and this is holding back women and ultimately economic equality.
The most significant gender imbalance, which is restricting the economic advancement of many women, is unpaid work.
Women, regardless of whether or not they have children, are doing significantly more than men in terms of unpaid primary caring responsibilities, domestic household errands, housework and outdoor tasks.
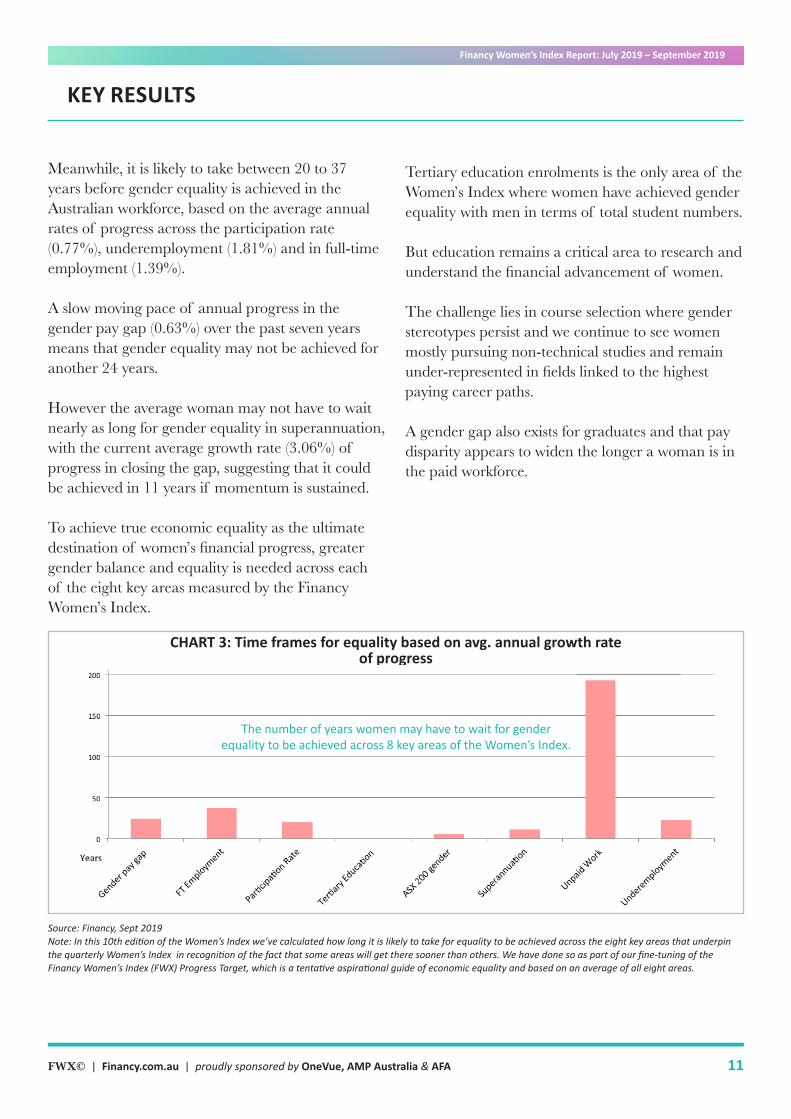
Based on an annual rate of progress of 0.25% over the past seven years, it could take 193 years before gender equality is achieved in unpaid work.
This growth rate, takes into account that in 2017 women were doing slightly less unpaid work than they did in 2016, particularly housework and caring for children.
By contrast, the pace of progress towards 50/50 gender diversity on the boards of the top 200 listed Australian companies stands at 10%, which means that board equality could be achieved in just 5.5 years time.
Financy Women’s Index Report: July 2019 – September 2019
11FWX© | Financy.com.au | proudly sponsored by OneVue, AMP Australia & AFA
KEY RESULTS
Tertiary education enrolments is the only area of the Women’s Index where women have achieved gender equality with men in terms of total student numbers.
But education remains a critical area to research and understand the financial advancement of women.
The challenge lies in course selection where gender stereotypes persist and we continue to see women mostly pursuing non-technical studies and remain under-represented in fields linked to the highest paying career paths.
A gender gap also exists for graduates and that pay disparity appears to widen the longer a woman is in the paid workforce.
Meanwhile, it is likely to take between 20 to 37 years before gender equality is achieved in the Australian workforce, based on the average annual rates of progress across the participation rate (0.77%), underemployment (1.81%) and in full-time employment (1.39%).
A slow moving pace of annual progress in the gender pay gap (0.63%) over the past seven years means that gender equality may not be achieved for another 24 years.
However the average woman may not have to wait nearly as long for gender equality in superannuation, with the current average growth rate (3.06%) of progress in closing the gap, suggesting that it could be achieved in 11 years if momentum is sustained.
To achieve true economic equality as the ultimate destination of women’s financial progress, greater gender balance and equality is needed across each of the eight key areas measured by the Financy Women’s Index.
Source: Financy, Sept 2019Note: In this 10th edition of the Women’s Index we’ve calculated how long it is likely to take for equality to be achieved across the eight key areas that underpin the quarterly Women’s Index in recognition of the fact that some areas will get there sooner than others. We have done so as part of our fine-tuning of the Financy Women’s Index (FWX) Progress Target, which is a tentative aspirational guide of economic equality and based on an average of all eight areas.
CHART 3: Time frames for equality based on avg. annual growth rate of progress
The number of years women may have to wait for gender equality to be achieved across 8 key areas of the Women’s Index.
Financy Women’s Index Report: July 2019 – September 2019
12FWX© | Financy.com.au | proudly sponsored by OneVue, AMP Australia & AFA
TERTIARY EDUCATION
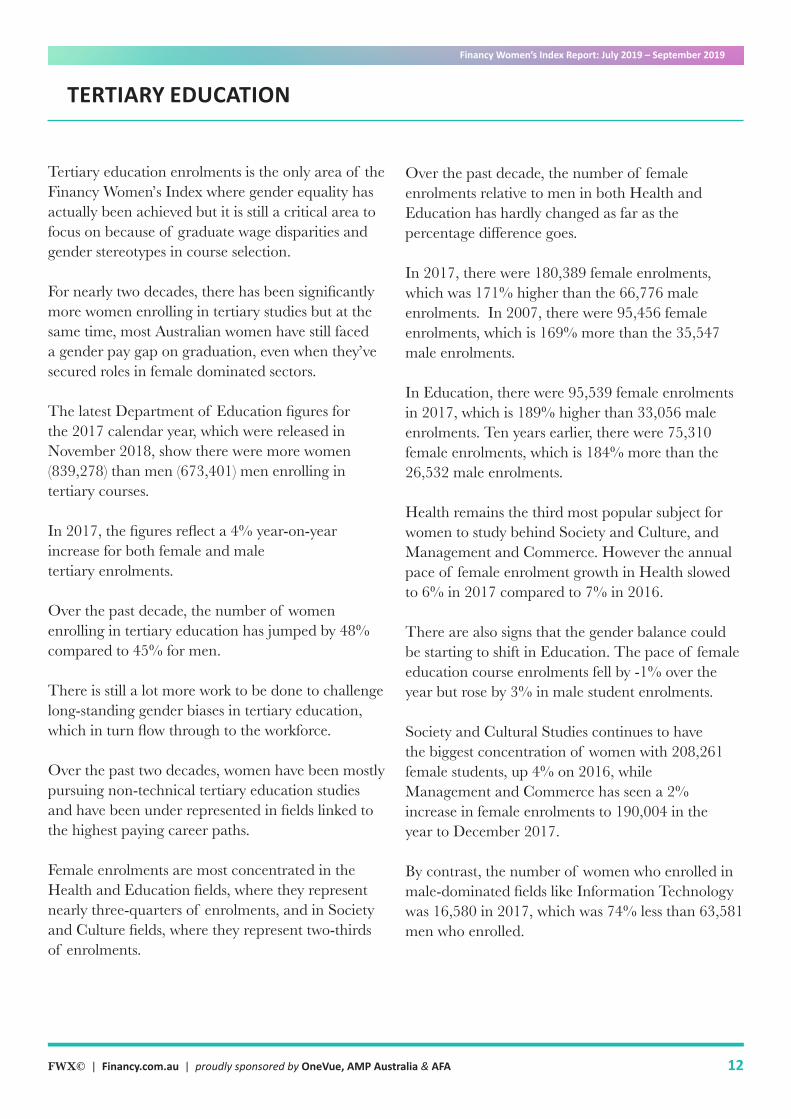
Tertiary education enrolments is the only area of the Financy Women’s Index where gender equality has actually been achieved but it is still a critical area to focus on because of graduate wage disparities and gender stereotypes in course selection.
For nearly two decades, there has been significantly more women enrolling in tertiary studies but at the same time, most Australian women have still faced a gender pay gap on graduation, even when they’ve secured roles in female dominated sectors.
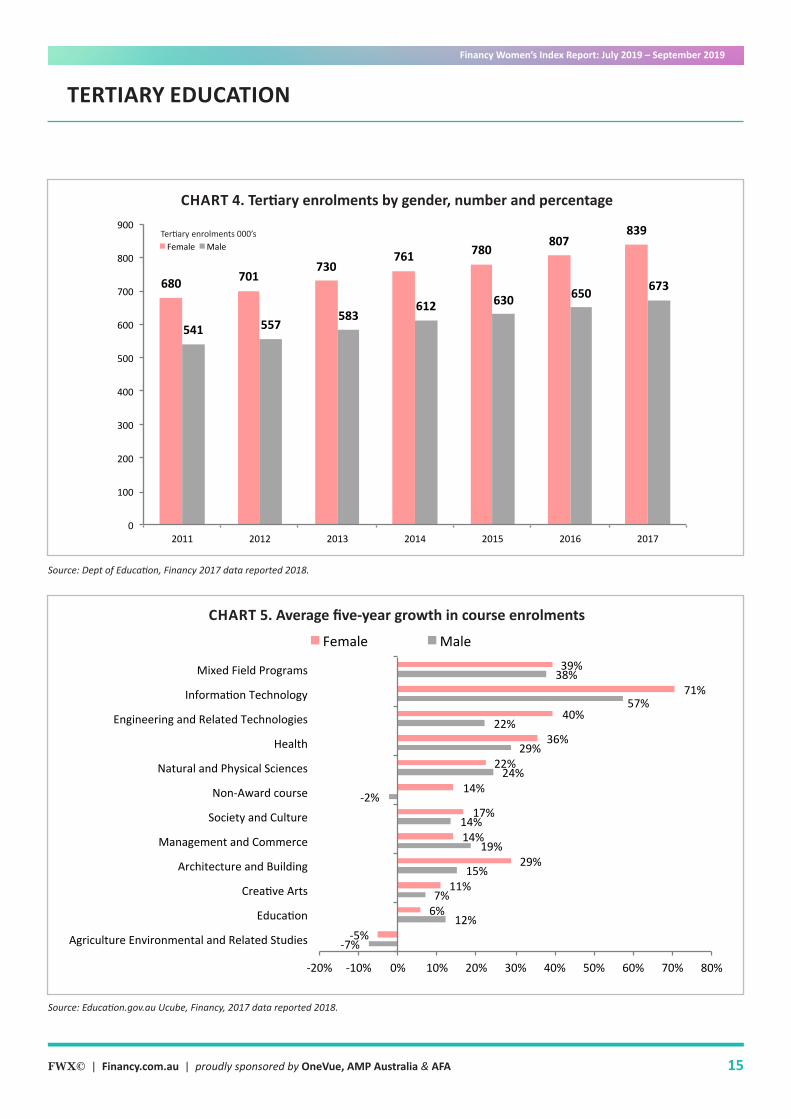
The latest Department of Education figures for the 2017 calendar year, which were released in November 2018, show there were more women (839,278) than men (673,401) men enrolling in tertiary courses.
In 2017, the figures reflect a 4% year-on-year increase for both female and male tertiary enrolments.
Over the past decade, the number of women enrolling in tertiary education has jumped by 48% compared to 45% for men.
There is still a lot more work to be done to challenge long-standing gender biases in tertiary education, which in turn flow through to the workforce.
Over the past two decades, women have been mostly pursuing non-technical tertiary education studies and have been under represented in fields linked to the highest paying career paths.
Female enrolments are most concentrated in the Health and Education fields, where they represent nearly three-quarters of enrolments, and in Society and Culture fields, where they represent two-thirds of enrolments.
Over the past decade, the number of female enrolments relative to men in both Health and Education has hardly changed as far as the percentage difference goes.
In 2017, there were 180,389 female enrolments, which was 171% higher than the 66,776 male enrolments. In 2007, there were 95,456 female enrolments, which is 169% more than the 35,547 male enrolments.
In Education, there were 95,539 female enrolments in 2017, which is 189% higher than 33,056 male enrolments. Ten years earlier, there were 75,310 female enrolments, which is 184% more than the 26,532 male enrolments.
Health remains the third most popular subject for women to study behind Society and Culture, and Management and Commerce. However the annual pace of female enrolment growth in Health slowed to 6% in 2017 compared to 7% in 2016.
There are also signs that the gender balance could be starting to shift in Education. The pace of female education course enrolments fell by -1% over the year but rose by 3% in male student enrolments.
Society and Cultural Studies continues to have the biggest concentration of women with 208,261 female students, up 4% on 2016, while Management and Commerce has seen a 2% increase in female enrolments to 190,004 in the year to December 2017.
By contrast, the number of women who enrolled in male-dominated fields like Information Technology was 16,580 in 2017, which was 74% less than 63,581 men who enrolled.
Financy Women’s Index Report: July 2019 – September 2019
13FWX© | Financy.com.au | proudly sponsored by OneVue, AMP Australia & AFA
TERTIARY EDUCATION
Engineering and Related Technologies had the most significant gender difference by percentage. There were 20,668 female enrolments in 2017, which is 78% less than the 94,608 male enrolments.
According to the 2019 Graduate Outcomes Survey, the 2016 gender gap in graduate median salaries was $2,500 or 4.2% with men earning $60,000 and women earning $57,500.
In 2019, the Survey looked again at the same cohort of graduates and found the gender gap had widened to $4,900 or 6.5% with men earning $75,900 and women earning $71,000.
We have previously quoted the Graduate Outcomes Survey as explaining the gender gap by noting the likely difference in course areas studied that achieve lower salaries e.g. Humanities, whereas males tend to graduate from more highly remunerated fields e.g. Engineering.
However further analysis of this data would suggest this isn’t the only reason and that female graduates tend to earn less than their male graduates within the same field of education.
For example, undergraduate study areas with large gender gaps in salaries three years out from starting work include Architecture and Built Environment, with males earning $12,900 or 17% more than women.
Agriculture and Environmental Studies also has men earning $7,000 or 10% more than women three years after graduation, in Nursing men are also earning $7,500 or 9% more, and in Health Services and Support men earn $7,200 or 9% more than women.
In the most popular study area for both genders, Business and Management, men are earning $6,400 or 8% more than women.
The exceptions are in Computing and Information Systems where there is a reverse gender gap with women earning $2,100 or 3% more than men, in Social Work, women earned $1,600 or 2% more than men, in Psychology the gap is $1,300 or 2% and in Engineering women earn $1,000 or 1% more than men.
Tertiary education captures university and vocational courses, which are generally pursued after completion of high school.
Financy Women’s Index Report: July 2019 – September 2019
14FWX© | Financy.com.au | proudly sponsored by OneVue, AMP Australia & AFA
TERTIARY EDUCATION
Suggested actions to improve the progress of women’s education:
For much of the past two decades, educational progress for women has not delivered nearly the same degree of labour market progress.
Challenging gender stereotypes is necessary if we want to improve career and earnings outcomes for women due to the fact that the sectors they often choose to pursue tend to be lower paid.
Measures to increase awareness of expected graduate and workforce salaries among prospective female tertiary, and high school students remain needed to ensure that young generations are fully informed of the potential financial aspect of their decisions. In addition, there is a need for greater awareness of trending career opportunities particularly those that offer foundational and transferable skills such as IT and Engineering.
Highlighting the range of occupations that any given training can lead to is important. For example you can study Engineering but don’t have to become an Engineer.
Incentives are also needed to attract more women into less traditional career pathways that may be linked to higher paying industries.
At the same time, mentoring and showcasing female example programs that assist with career planning would be particularly beneficial to women studying in traditional fields to assist them in seeing what educational steps may be needed to improve wage outcomes. Government, education bodies and business need to continue developing supportive measures that ensure the pool of women obtaining higher educational qualifications are moving through to the labour market and are also encouraged to return to work after career breaks to have children.
Employer programs that also encourage women to stay in touch and keep their skills up-to-date while they are on parental leave are also advantageous to those taking career breaks to care for loved ones. Roger Wilkins Deputy Director of the Melbourne Institute of Applied Economic & Social Research at the University of Melbourne said policies and awareness campaigns that promote men taking a greater role in raising the children, working flexibility and undertaking other household work, and which increase use of child care will probably help address out dated but persistent gender norms.
Financy Women’s Index Report: July 2019 – September 2019
15FWX© | Financy.com.au | proudly sponsored by OneVue, AMP Australia & AFA
TERTIARY EDUCATION
-7%
12%
7%
15%
19%
14%
-2%
24%
29%
22%
57%
38%
-5%
6%
11%
29%
14%
17%
14%
22%
36%
40%
71%
39%
-20% -10% 0% 10% 20% 30% 40% 50% 60% 70% 80%
AgricultureEnvironmentalandRelatedStudies
EducaAon
CreaAveArts
ArchitectureandBuilding
ManagementandCommerce
SocietyandCulture
Non-Awardcourse
NaturalandPhysicalSciences
Health
EngineeringandRelatedTechnologies
InformaAonTechnology
MixedFieldPrograms
Averagefiveyeargrowthincourseenrolments
Female Male
CHART 5. Average five-year growth in course enrolments
Source: Dept of Education, Financy 2017 data reported 2018.
Source: Education.gov.au Ucube, Financy, 2017 data reported 2018.
680 701730
761 780807
839
541 557583
612 630 650 673
0
100
200
300
400
500
600
700
800
900
2011 2012 2013 2014 2015 2016 2017
Female Male
CHART 4. Tertiary enrolments by gender, number and percentage
Tertiary enrolments 000’s
Financy Women’s Index Report: July 2019 – September 2019
16FWX© | Financy.com.au | proudly sponsored by OneVue, AMP Australia & AFA
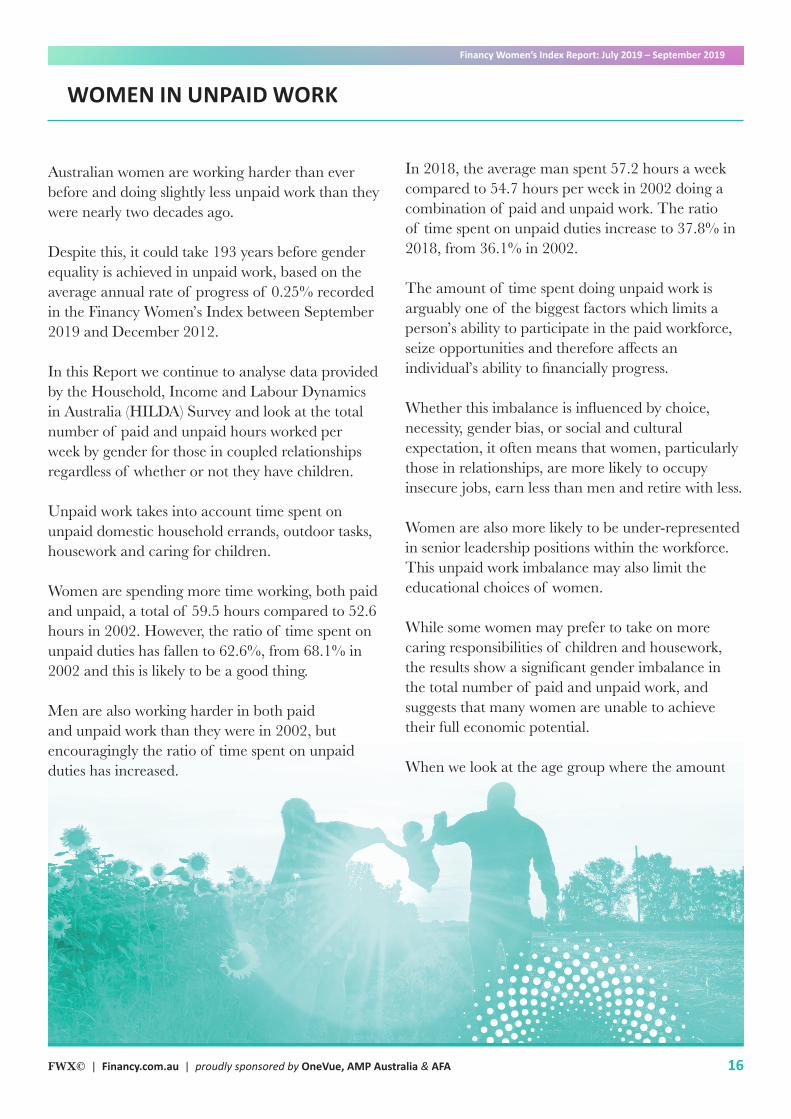
Australian women are working harder than ever before and doing slightly less unpaid work than they were nearly two decades ago.
Despite this, it could take 193 years before gender equality is achieved in unpaid work, based on the average annual rate of progress of 0.25% recorded in the Financy Women’s Index between September 2019 and December 2012.
In this Report we continue to analyse data provided by the Household, Income and Labour Dynamics in Australia (HILDA) Survey and look at the total number of paid and unpaid hours worked per week by gender for those in coupled relationships regardless of whether or not they have children.
Unpaid work takes into account time spent on unpaid domestic household errands, outdoor tasks, housework and caring for children.
Women are spending more time working, both paid and unpaid, a total of 59.5 hours compared to 52.6 hours in 2002. However, the ratio of time spent on unpaid duties has fallen to 62.6%, from 68.1% in 2002 and this is likely to be a good thing.
Men are also working harder in both paid and unpaid work than they were in 2002, but encouragingly the ratio of time spent on unpaid duties has increased.
WOMEN IN UNPAID WORK
In 2018, the average man spent 57.2 hours a week compared to 54.7 hours per week in 2002 doing a combination of paid and unpaid work. The ratio of time spent on unpaid duties increase to 37.8% in 2018, from 36.1% in 2002.
The amount of time spent doing unpaid work is arguably one of the biggest factors which limits a person’s ability to participate in the paid workforce, seize opportunities and therefore affects an individual’s ability to financially progress.
Whether this imbalance is influenced by choice, necessity, gender bias, or social and cultural expectation, it often means that women, particularly those in relationships, are more likely to occupy insecure jobs, earn less than men and retire with less.
Women are also more likely to be under-represented in senior leadership positions within the workforce. This unpaid work imbalance may also limit the educational choices of women.
While some women may prefer to take on more caring responsibilities of children and housework, the results show a significant gender imbalance in the total number of paid and unpaid work, and suggests that many women are unable to achieve their full economic potential.
When we look at the age group where the amount
Financy Women’s Index Report: July 2019 – September 2019
17FWX© | Financy.com.au | proudly sponsored by OneVue, AMP Australia & AFA
of unpaid work is highest for both women and men, that being 35-44 years, we can see that women are doing 76.3 hours of total unpaid and paid work, of which 66.3% is unpaid.
For men in this age group, they are doing 73.4 hours per week in paid and unpaid work, of which 35.1% is unpaid.
This correlates with a rising fertility rate in Australia for women aged 35 years and over.
In the past 30 years, the fertility rate of women aged 35-39 has more than doubled in 2017, and for women aged 40-44 it has tripled. In contrast, teenage fertility nearly halved during this period.
The total fertility rate (TFR) of 1.74 babies per woman, according to the ABS currently stands at the lowest it has been since 2001.
This findings are in line with other research conducted on unpaid work. For instance, Victorian women are doing most of the state’s unpaid work, according to analysis by Deloitte Access Economics,
WOMEN IN UNPAID WORK
which revealed unpaid work was equivalent to 50% of Victoria’s Gross State Product (GSP) in the 2017-18 financial year.
Women on the whole are doing significantly more unpaid work than men across all age groups, irrespective of whether they have children or not, and despite the rise in both female participation in the workforce and the number of women working full-time.
Despite there being little change in the amount of unpaid work over the past decade, there is growing social awareness in favour of equality in unpaid work particularly in light of the rise of dual income families.
When we specifically look at unpaid work performed by gender, regardless of relationship status for those with children under the age of 18, who may or may not be living with them, the gap becomes most significant between the ages of 30 – 44, which captures the median age for women and men to start having children.
For women aged 30-34, regardless of whether or not
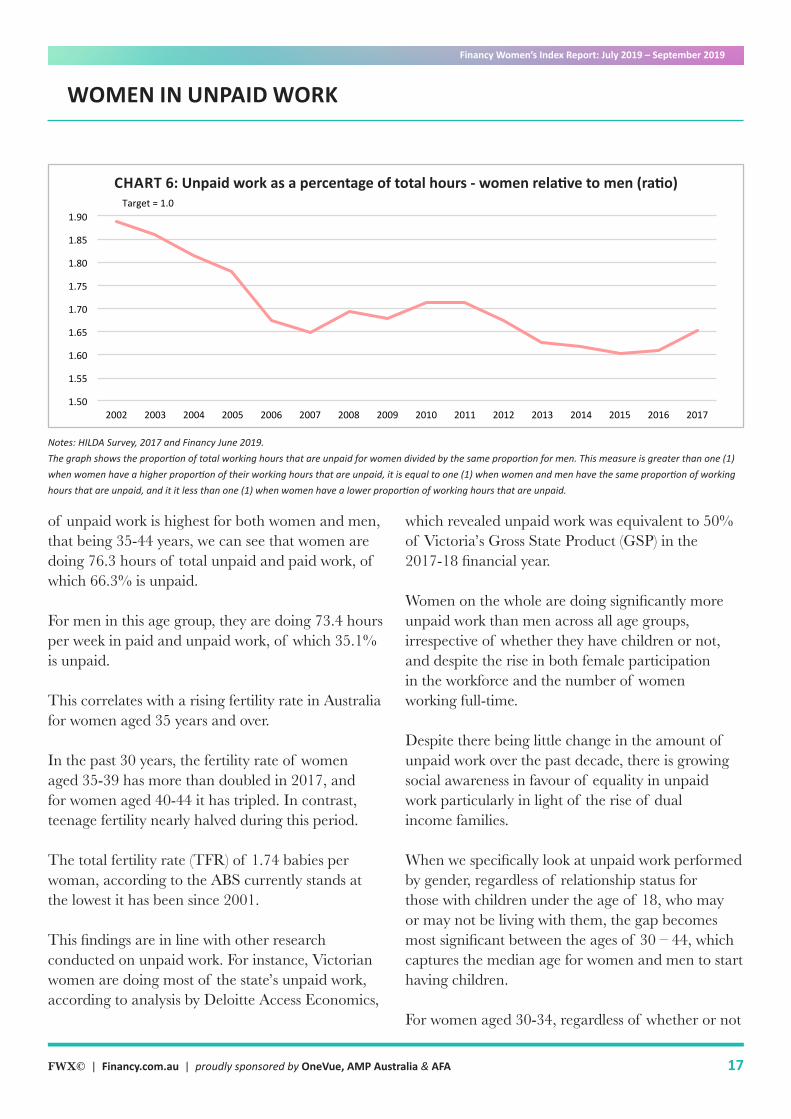
Notes: HILDA Survey, 2017 and Financy June 2019.The graph shows the proportion of total working hours that are unpaid for women divided by the same proportion for men. This measure is greater than one (1) when women have a higher proportion of their working hours that are unpaid, it is equal to one (1) when women and men have the same proportion of working hours that are unpaid, and it it less than one (1) when women have a lower proportion of working hours that are unpaid.
Over the past decade women’s unpaid work has hardly changed
1.50
1.55
1.60
1.65
1.70
1.75
1.80
1.85
1.90
1.95
2002 2003 2004 2005 2006 2007 2008 2009 2010 2011 2012 2013 2014 2015 2016 2017
Unpaidworkasapercentoftotalhours:women'sasaraBoofmen's
Target=1.0
CHART 6: Unpaid work as a percentage of total hours - women relative to men (ratio)
Financy Women’s Index Report: July 2019 – September 2019
18FWX© | Financy.com.au | proudly sponsored by OneVue, AMP Australia & AFA
WOMEN IN UNPAID WORK
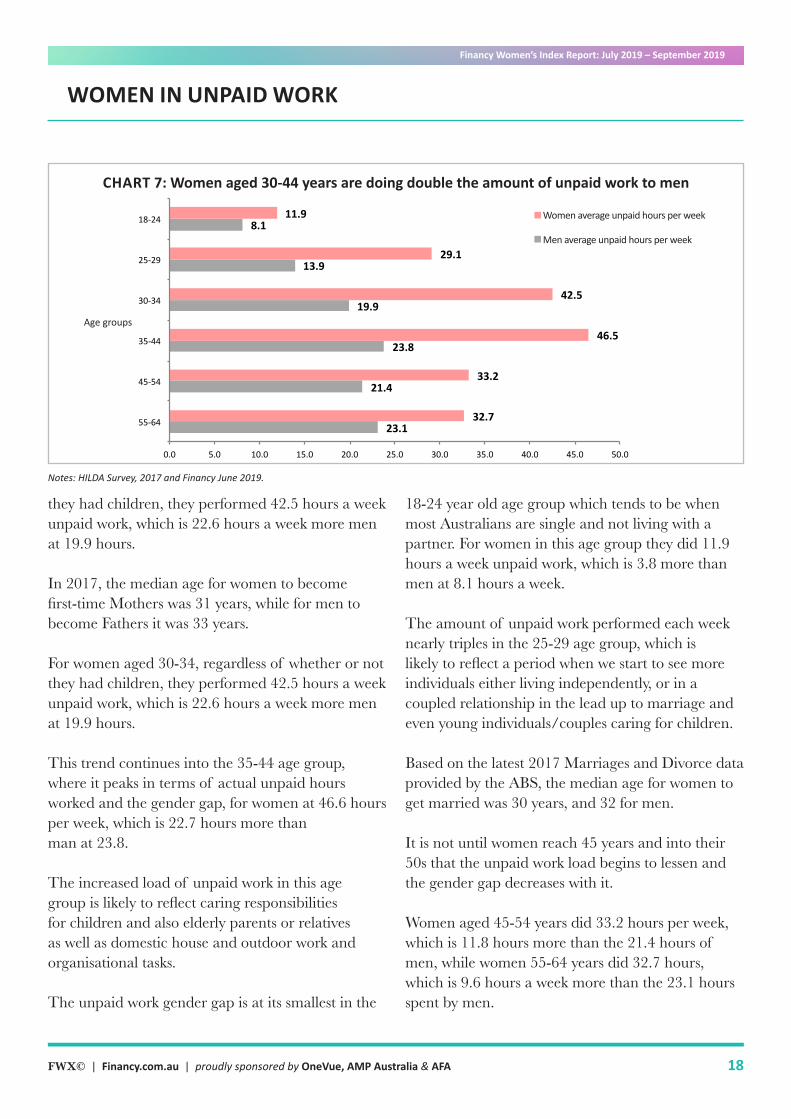
they had children, they performed 42.5 hours a week unpaid work, which is 22.6 hours a week more men at 19.9 hours.
In 2017, the median age for women to become first-time Mothers was 31 years, while for men to become Fathers it was 33 years.
For women aged 30-34, regardless of whether or not they had children, they performed 42.5 hours a week unpaid work, which is 22.6 hours a week more men at 19.9 hours.
This trend continues into the 35-44 age group, where it peaks in terms of actual unpaid hours worked and the gender gap, for women at 46.6 hours per week, which is 22.7 hours more than man at 23.8.
The increased load of unpaid work in this age group is likely to reflect caring responsibilities for children and also elderly parents or relatives as well as domestic house and outdoor work and organisational tasks.
The unpaid work gender gap is at its smallest in the
18-24 year old age group which tends to be when most Australians are single and not living with a partner. For women in this age group they did 11.9 hours a week unpaid work, which is 3.8 more than men at 8.1 hours a week.
The amount of unpaid work performed each week nearly triples in the 25-29 age group, which is likely to reflect a period when we start to see more individuals either living independently, or in a coupled relationship in the lead up to marriage and even young individuals/couples caring for children.
Based on the latest 2017 Marriages and Divorce data provided by the ABS, the median age for women to get married was 30 years, and 32 for men.
It is not until women reach 45 years and into their 50s that the unpaid work load begins to lessen and the gender gap decreases with it.
Women aged 45-54 years did 33.2 hours per week, which is 11.8 hours more than the 21.4 hours of men, while women 55-64 years did 32.7 hours, which is 9.6 hours a week more than the 23.1 hours spent by men.
Notes: HILDA Survey, 2017 and Financy June 2019.
23.1
21.4
23.8
19.9
13.9
8.1
32.7
33.2
46.5
42.5
29.1
11.9
0.0 5.0 10.0 15.0 20.0 25.0 30.0 35.0 40.0 45.0 50.0
55-64
45-54
35-44
30-34
25-29
18-24 Women
Men
Women average unpaid hours per week
Men average unpaid hours per week
Age groups
CHART 7: Women aged 30-44 years are doing double the amount of unpaid work to men
Financy Women’s Index Report: July 2019 – September 2019
19FWX© | Financy.com.au | proudly sponsored by OneVue, AMP Australia & AFA
Suggested actions to improve the progress of women in unpaid work:
The obvious correlation between unpaid work and employment is one of the major factors holding back the economic progress of women.
The actions that can be taken include a national social awareness response of the need to “share the load” on unpaid work so that gender stereotypes on unpaid work can be corrected and business, individuals and families are better educated on the benefits of shared duties.
Governments ought to consider a social awareness and educational or media campaign that challenges gender stereotypes where they disadvantage and often indirectly discriminate against women.
It is important that such campaigns talk to children and adults as gender stereotypes often start from a young age. For instance, young girls are often taught to play nice and be complacent, whereas boys are often encouraged to play rough and be tough.
Such campaigns would ideally remove the idea of “women’s work” as being traditionally in the home and soft, and “men’s business” as being outdoors and tough, as displayed by television commercials such as Victoria Bitter. Ideally we need to be more inclusive of both genders to help normalise unpaid work in the home, workforce and in schools.
The media and entertainment industry also play a role in reframing gender roles in work and at home. TV shows such as ‘Workin Moms’, ‘The Let Down’ and ‘House Husbands’ play a role in breaking down the traditional work and home roles of women and men.
Employers can play an important role in enabling greater sharing of unpaid work through more progressive parental leave and flexible work policies and practices.
For example, leading practice organisations are providing between 8-26 weeks of paid parental leave, plus superannuation on their employer funded schemes.
This is often paid in addition to the government scheme; is available under any circumstances where there is a new baby (adoption, same-sex couple, surrogacy); there is no requirement to repay any portion if they do not return to work; leave is equally available to women and men; removes the terms primary and secondary carer; and there is flexibility in how this can be taken must be provided (e.g. part-time for part of the paid duration, taken over three years).
WOMEN IN UNPAID WORK
Financy Women’s Index Report: July 2019 – September 2019
20FWX© | Financy.com.au | proudly sponsored by OneVue, AMP Australia & AFA
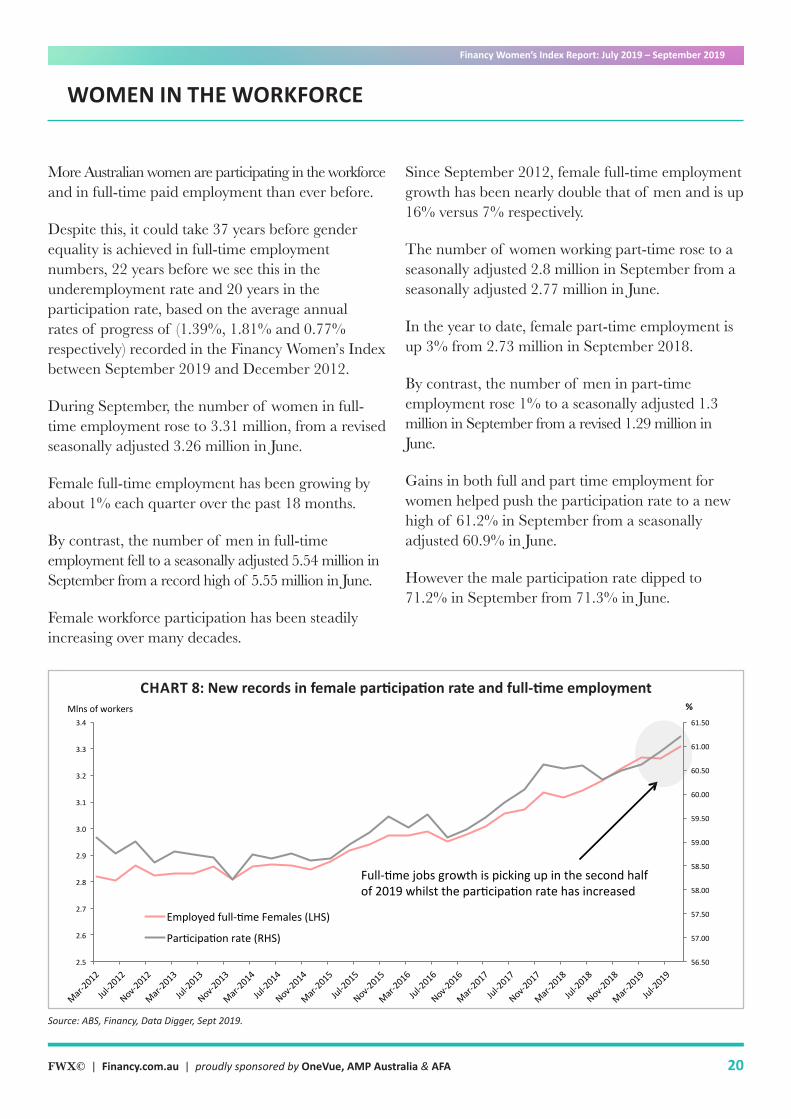
More Australian women are participating in the workforce and in full-time paid employment than ever before.
Despite this, it could take 37 years before gender equality is achieved in full-time employment numbers, 22 years before we see this in the underemployment rate and 20 years in the participation rate, based on the average annual rates of progress of (1.39%, 1.81% and 0.77% respectively) recorded in the Financy Women’s Index between September 2019 and December 2012.
During September, the number of women in full-time employment rose to 3.31 million, from a revised seasonally adjusted 3.26 million in June.
Female full-time employment has been growing by about 1% each quarter over the past 18 months.
By contrast, the number of men in full-time employment fell to a seasonally adjusted 5.54 million in September from a record high of 5.55 million in June.
Female workforce participation has been steadily increasing over many decades.
WOMEN IN THE WORKFORCE
Since September 2012, female full-time employment growth has been nearly double that of men and is up 16% versus 7% respectively.
The number of women working part-time rose to a seasonally adjusted 2.8 million in September from a seasonally adjusted 2.77 million in June.
In the year to date, female part-time employment is up 3% from 2.73 million in September 2018.
By contrast, the number of men in part-time employment rose 1% to a seasonally adjusted 1.3 million in September from a revised 1.29 million in June.
Gains in both full and part time employment for women helped push the participation rate to a new high of 61.2% in September from a seasonally adjusted 60.9% in June.
However the male participation rate dipped to 71.2% in September from 71.3% in June.
Source: ABS, Financy, Data Digger, Sept 2019.
56.50
57.00
57.50
58.00
58.50
59.00
59.50
60.00
60.50
61.00
61.50
2.5
2.6
2.7
2.8
2.9
3.0
3.1
3.2
3.3
3.4
Mar-2012
Jul-2012
Nov-2012
Mar-2013
Jul-2013
Nov-2013
Mar-2014
Jul-2014
Nov-2014
Mar-2015
Jul-2015
Nov-2015
Mar-2016
Jul-2016
Nov-2016
Mar-2017
Jul-2017
Nov-2017
Mar-2018
Jul-2018
Nov-2018
Mar-2019
Jul-2019
%Mlnsofworkers
Newrecordsinfemalepar2cipa2onrateandfull-2meemployment
Employedfull-BmeFemales(LHS)
ParBcipaBonrate(RHS)
Full-Bmejobsgrowthispickingupinthesecondhalfof2019whilsttheparBcipaBonratehasincreased
CHART 8: New records in female participation rate and full-time employment
Financy Women’s Index Report: July 2019 – September 2019
21FWX© | Financy.com.au | proudly sponsored by OneVue, AMP Australia & AFA
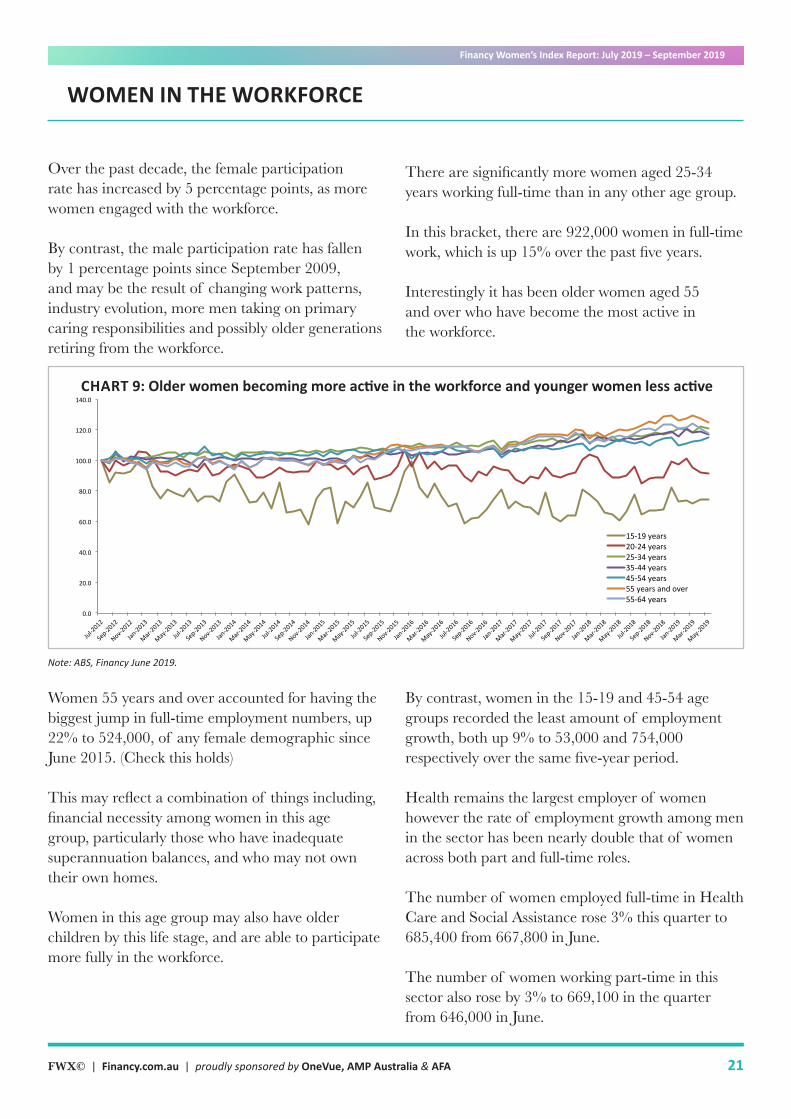
Over the past decade, the female participation rate has increased by 5 percentage points, as more women engaged with the workforce.
By contrast, the male participation rate has fallen by 1 percentage points since September 2009, and may be the result of changing work patterns, industry evolution, more men taking on primary caring responsibilities and possibly older generations retiring from the workforce.
WOMEN IN THE WORKFORCE
There are significantly more women aged 25-34 years working full-time than in any other age group.
In this bracket, there are 922,000 women in full-time work, which is up 15% over the past five years.
Interestingly it has been older women aged 55 and over who have become the most active in the workforce.
Note: ABS, Financy June 2019.
0.0
20.0
40.0
60.0
80.0
100.0
120.0
140.0
Jul-2012
Sep-2012
Nov-2012
Jan-2013
Mar-2013
May-2013
Jul-2013
Sep-2013
Nov-2013
Jan-2014
Mar-2014
May-2014
Jul-2014
Sep-2014
Nov-2014
Jan-2015
Mar-2015
May-2015
Jul-2015
Sep-2015
Nov-2015
Jan-2016
Mar-2016
May-2016
Jul-2016
Sep-2016
Nov-2016
Jan-2017
Mar-2017
May-2017
Jul-2017
Sep-2017
Nov-2017
Jan-2018
Mar-2018
May-2018
Jul-2018
Sep-2018
Nov-2018
Jan-2019
Mar-2019
May-2019
15-19years20-24years25-34years35-44years45-54years55yearsandover55-64years
CHART 9: Older women becoming more active in the workforce and younger women less active
Women 55 years and over accounted for having the biggest jump in full-time employment numbers, up 22% to 524,000, of any female demographic since June 2015. (Check this holds)
This may reflect a combination of things including, financial necessity among women in this age group, particularly those who have inadequate superannuation balances, and who may not own their own homes.
Women in this age group may also have older children by this life stage, and are able to participate more fully in the workforce.
By contrast, women in the 15-19 and 45-54 age groups recorded the least amount of employment growth, both up 9% to 53,000 and 754,000 respectively over the same five-year period.
Health remains the largest employer of women however the rate of employment growth among men in the sector has been nearly double that of women across both part and full-time roles.
The number of women employed full-time in Health Care and Social Assistance rose 3% this quarter to 685,400 from 667,800 in June.
The number of women working part-time in this sector also rose by 3% to 669,100 in the quarter from 646,000 in June.
Financy Women’s Index Report: July 2019 – September 2019
22FWX© | Financy.com.au | proudly sponsored by OneVue, AMP Australia & AFA
WOMEN IN THE WORKFORCE
Note: ABS, Financy June 2019.
0.0
20.0
40.0
60.0
80.0
100.0
120.0
140.0
Jan-2012
Apr-2012
Jul-2012
Oct-2012
Jan-2013
Apr-2013
Jul-2013
Oct-2013
Jan-2014
Apr-2014
Jul-2014
Oct-2014
Jan-2015
Apr-2015
Jul-2015
Oct-2015
Jan-2016
Apr-2016
Jul-2016
Oct-2016
Jan-2017
Apr-2017
Jul-2017
Oct-2017
Jan-2018
Apr-2018
Jul-2018
Oct-2018
Jan-2019
Apr-2019
>Employedfull-Ame;>Females;
>Employedpart-Ame;>Females;
>Employedfull-Ame;>Males;
>Employedpart-Ame;>Males;
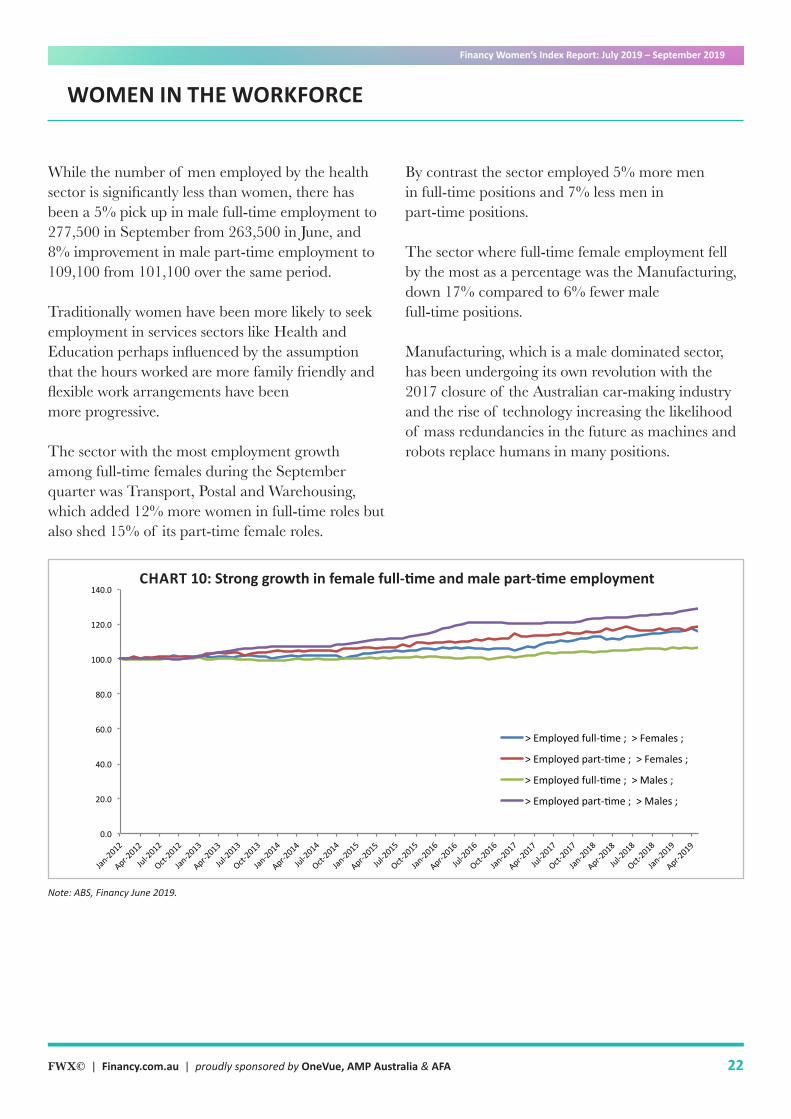
CHART 10: Strong growth in female full-time and male part-time employment
While the number of men employed by the health sector is significantly less than women, there has been a 5% pick up in male full-time employment to 277,500 in September from 263,500 in June, and 8% improvement in male part-time employment to 109,100 from 101,100 over the same period.
Traditionally women have been more likely to seek employment in services sectors like Health and Education perhaps influenced by the assumption that the hours worked are more family friendly and flexible work arrangements have been more progressive.
The sector with the most employment growth among full-time females during the September quarter was Transport, Postal and Warehousing, which added 12% more women in full-time roles but also shed 15% of its part-time female roles.
By contrast the sector employed 5% more men in full-time positions and 7% less men in part-time positions.
The sector where full-time female employment fell by the most as a percentage was the Manufacturing, down 17% compared to 6% fewer male full-time positions.
Manufacturing, which is a male dominated sector, has been undergoing its own revolution with the 2017 closure of the Australian car-making industry and the rise of technology increasing the likelihood of mass redundancies in the future as machines and robots replace humans in many positions.
Financy Women’s Index Report: July 2019 – September 2019
23FWX© | Financy.com.au | proudly sponsored by OneVue, AMP Australia & AFA
The overall trend towards greater participation is likely to reflect changing workforce and family dynamics; such as an increased tendency for women to work into Motherhood, utilize childcare arrangements as well as a move towards more flexible work arrangements.
The data also shows that as more women find employment, the level of female underemployment and underutilization is on the decline.
For men, as less participate in the workforce, so too do we see an increase in the level of male underemployment and underultisation.
The underemployment rate for women aged 15-64 years fell to 10.4% in September, from 10.5% in June, while for men it rose to 6.9% from 6.8% over the same period.
WOMEN IN THE WORKFORCE
The underutilisation rate for women aged 15-64 years fell to 15.7% in September from a revised 15.8% in June. The rate has been decreasing in recent years and stood at 16.2% in September 2018.
The underutilisation rate for men aged 15-64 years old rose to 12.4% in September from a revised 12.2% in June. The rate has been steadily increasing and stood at 11.7% in September 2018.
This underutilisation rate reflects the number of people who are unemployed or underemployed and who want to work more hours.
We would expect the female underutilization rate to be higher than the male given that there are more women working part-time who are likely to want additional hours.
Achieving gender equality in the workforce could take up to 40 years.
Financy Women’s Index Report: July 2019 – September 2019
24FWX© | Financy.com.au | proudly sponsored by OneVue, AMP Australia & AFA
Suggested actions to improve the progress of female employment growth:
Action should continue to be taken at the organisational, industry and government level to encourage and support women’s participation in the workforce, and in senior levels of employment.
Employers can set targets on the number of women employed across businesses, and at senior leadership levels; and develop specific strategies to achieve these targets.
Government should also consider further reforms to current childcare subsidies and tax relief to also address the fact that many families don’t see it as being financially viable for some women (or lower earning partners) to return to work given the cost of childcare.
Heidi Sundin, Director, The Agenda Agency says ‘organisations need to take a strategic approach to gender equality. She notes that workplaces need to ensure that there is a culture and support in place to enable women to sustainably participate in the workplace, particularly in senior leadership roles -otherwise women may not be set up for success.
Such strategies also need to ensure that men are included in and benefit from gender equality strategies by having greater access to parental leave, flexible work arrangements and wellbeing initiatives.
Key areas of focus for organisations are around ensuring policies and strategies are in place to support gender equality in recruitment, learning and development, promotion, pay and performance evaluation.
Organisations can put in place specific initiatives to grow their female talent pipeline (as well as men), to support women leaders in the business with more part-time or job share senior leadership roles.
The availability and normalisation of flexible work practices is also essential to enabling gender equality.
In addition, continued support is needed by employers to enable women and men to play active roles in parenting and other caring roles.
Employers who want to attract and retain more women could also offer the payment of superannuation while on paid and unpaid parental leave; and could also provide well thought out return to work programs.
It is also essential for real change that leaders of organisations are genuine advocates of gender equality and hold people accountable for ensuring the workplace is diverse and inclusive.
WOMEN IN THE WORKFORCE
Financy Women’s Index Report: July 2019 – September 2019
25FWX© | Financy.com.au | proudly sponsored by OneVue, AMP Australia & AFA
GENDER PAY GAP
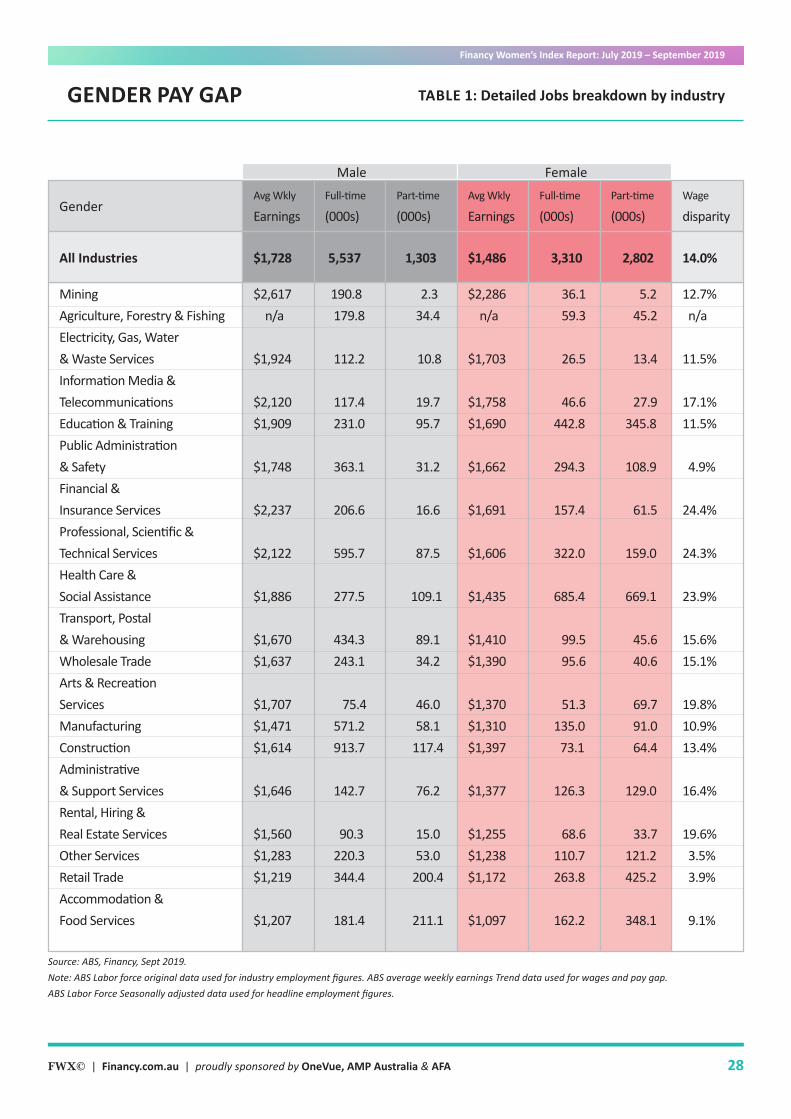
Australia’s gender pay gap has fallen to a fresh low of 14.02%, helped by increased workforce participation among women.
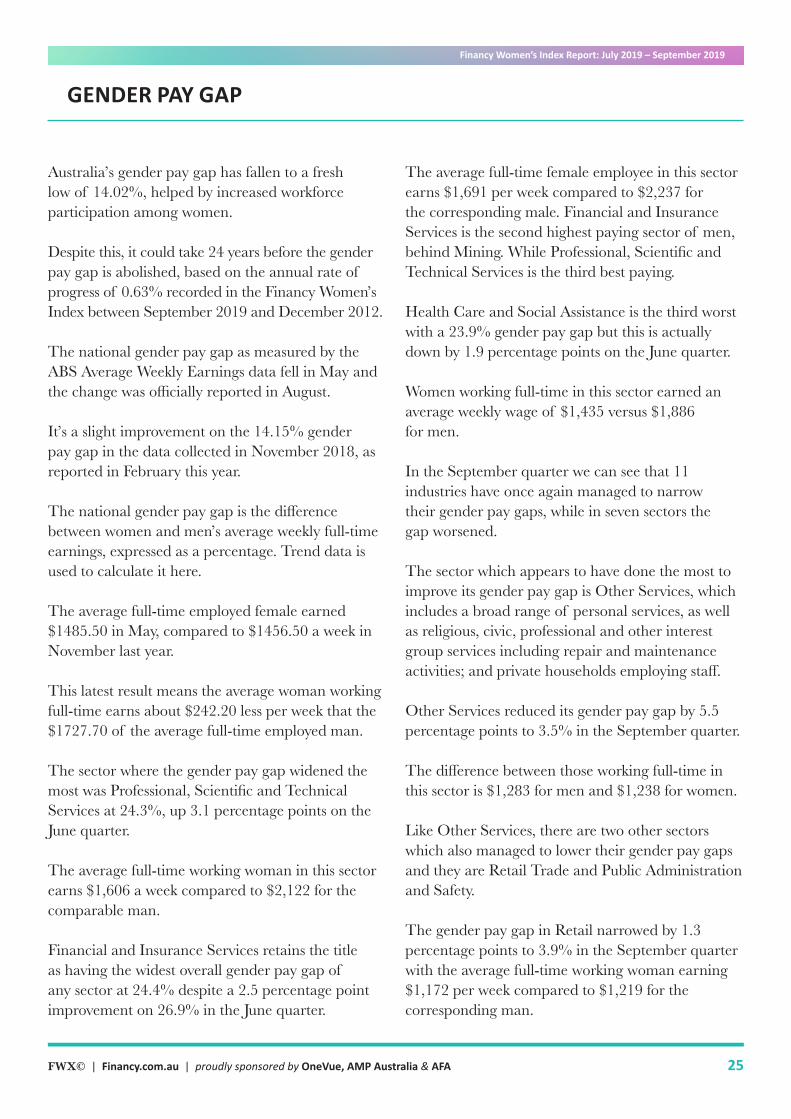
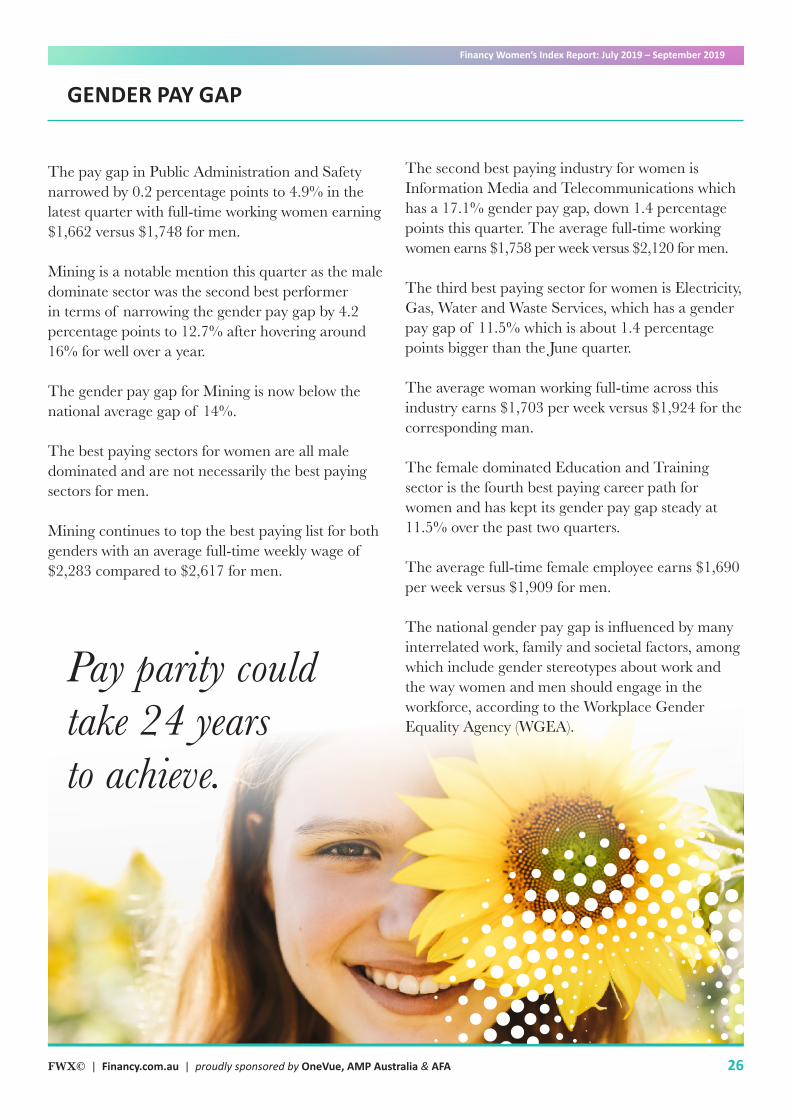
Despite this, it could take 24 years before the gender pay gap is abolished, based on the annual rate of progress of 0.63% recorded in the Financy Women’s Index between September 2019 and December 2012.
The national gender pay gap as measured by the ABS Average Weekly Earnings data fell in May and the change was officially reported in August.
It’s a slight improvement on the 14.15% gender pay gap in the data collected in November 2018, as reported in February this year.
The national gender pay gap is the difference between women and men’s average weekly full-time earnings, expressed as a percentage. Trend data is used to calculate it here.
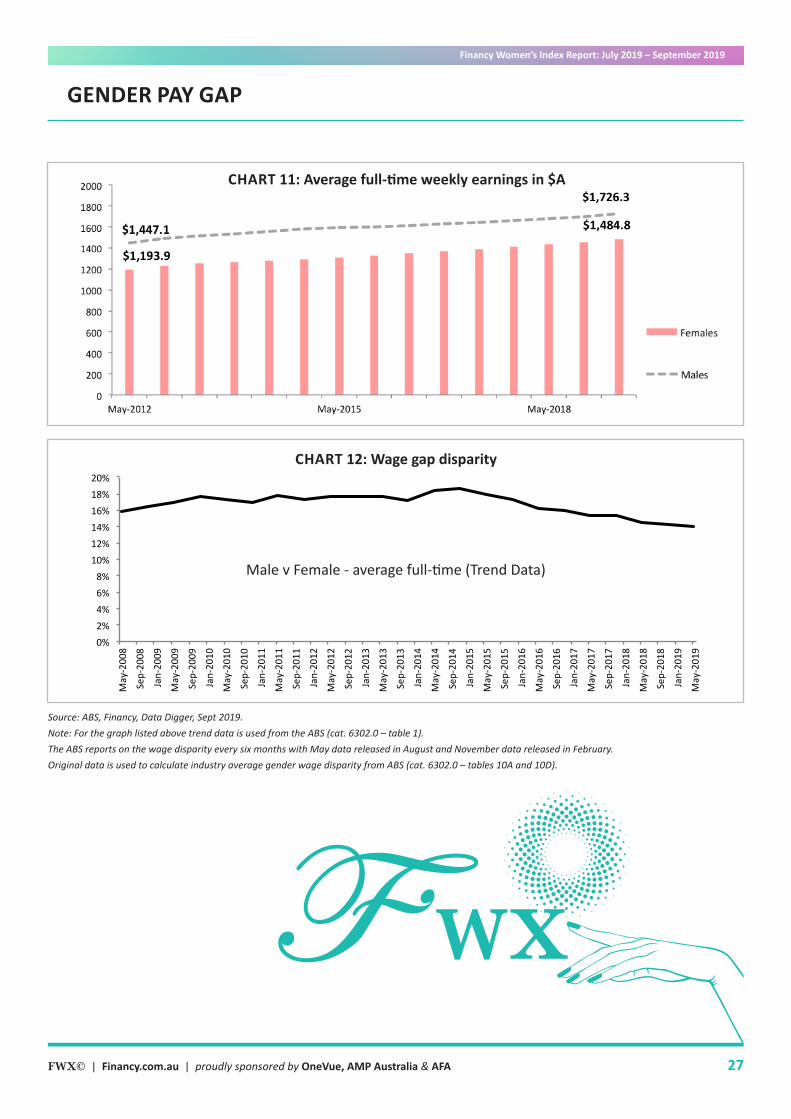
The average full-time employed female earned $1485.50 in May, compared to $1456.50 a week in November last year.
This latest result means the average woman working full-time earns about $242.20 less per week that the $1727.70 of the average full-time employed man.
The sector where the gender pay gap widened the most was Professional, Scientific and Technical Services at 24.3%, up 3.1 percentage points on the June quarter.
The average full-time working woman in this sector earns $1,606 a week compared to $2,122 for the comparable man.
Financial and Insurance Services retains the title as having the widest overall gender pay gap of any sector at 24.4% despite a 2.5 percentage point improvement on 26.9% in the June quarter.
The average full-time female employee in this sector earns $1,691 per week compared to $2,237 for the corresponding male. Financial and Insurance Services is the second highest paying sector of men, behind Mining. While Professional, Scientific and Technical Services is the third best paying.
Health Care and Social Assistance is the third worst with a 23.9% gender pay gap but this is actually down by 1.9 percentage points on the June quarter.
Women working full-time in this sector earned an average weekly wage of $1,435 versus $1,886 for men.
In the September quarter we can see that 11 industries have once again managed to narrow their gender pay gaps, while in seven sectors the gap worsened.
The sector which appears to have done the most to improve its gender pay gap is Other Services, which includes a broad range of personal services, as well as religious, civic, professional and other interest group services including repair and maintenance activities; and private households employing staff.
Other Services reduced its gender pay gap by 5.5 percentage points to 3.5% in the September quarter.
The difference between those working full-time in this sector is $1,283 for men and $1,238 for women.
Like Other Services, there are two other sectors which also managed to lower their gender pay gaps and they are Retail Trade and Public Administration and Safety.
The gender pay gap in Retail narrowed by 1.3 percentage points to 3.9% in the September quarter with the average full-time working woman earning $1,172 per week compared to $1,219 for the corresponding man.
Financy Women’s Index Report: July 2019 – September 2019
26FWX© | Financy.com.au | proudly sponsored by OneVue, AMP Australia & AFA
GENDER PAY GAP
The pay gap in Public Administration and Safety narrowed by 0.2 percentage points to 4.9% in the latest quarter with full-time working women earning $1,662 versus $1,748 for men.
Mining is a notable mention this quarter as the male dominate sector was the second best performer in terms of narrowing the gender pay gap by 4.2 percentage points to 12.7% after hovering around 16% for well over a year.
The gender pay gap for Mining is now below the national average gap of 14%.
The best paying sectors for women are all male dominated and are not necessarily the best paying sectors for men.
Mining continues to top the best paying list for both genders with an average full-time weekly wage of $2,283 compared to $2,617 for men.
The second best paying industry for women is Information Media and Telecommunications which has a 17.1% gender pay gap, down 1.4 percentage points this quarter. The average full-time working women earns $1,758 per week versus $2,120 for men.
The third best paying sector for women is Electricity, Gas, Water and Waste Services, which has a gender pay gap of 11.5% which is about 1.4 percentage points bigger than the June quarter.
The average woman working full-time across this industry earns $1,703 per week versus $1,924 for the corresponding man. The female dominated Education and Training sector is the fourth best paying career path for women and has kept its gender pay gap steady at 11.5% over the past two quarters.
The average full-time female employee earns $1,690 per week versus $1,909 for men.
The national gender pay gap is influenced by many interrelated work, family and societal factors, among which include gender stereotypes about work and the way women and men should engage in the workforce, according to the Workplace Gender Equality Agency (WGEA).
Pay parity could take 24 years to achieve.
Financy Women’s Index Report: July 2019 – September 2019
27FWX© | Financy.com.au | proudly sponsored by OneVue, AMP Australia & AFA
GENDER PAY GAP
CHART 11: Average full-time weekly earnings in $A
Source: ABS, Financy, Data Digger, Sept 2019.Note: For the graph listed above trend data is used from the ABS (cat. 6302.0 – table 1). The ABS reports on the wage disparity every six months with May data released in August and November data released in February. Original data is used to calculate industry average gender wage disparity from ABS (cat. 6302.0 – tables 10A and 10D).
0%2%4%6%8%10%12%14%16%18%20%
May-200
8
Sep-2008
Jan-20
09
May-200
9
Sep-2009
Jan-20
10
May-201
0
Sep-2010
Jan-20
11
May-201
1
Sep-2011
Jan-20
12
May-201
2
Sep-2012
Jan-20
13
May-201
3
Sep-2013
Jan-20
14
May-201
4
Sep-2014
Jan-20
15
May-201
5
Sep-2015
Jan-20
16
May-201
6
Sep-2016
Jan-20
17
May-201
7
Sep-2017
Jan-20
18
May-201
8
Sep-2018
Jan-20
19
May-201
9
Male v Female - average full-time (Trend Data)
CHART 12: Wage gap disparity
Financy Women’s Index Report: July 2019 – September 2019
28FWX© | Financy.com.au | proudly sponsored by OneVue, AMP Australia & AFA
Source: ABS, Financy, Sept 2019.Note: ABS Labor force original data used for industry employment figures. ABS average weekly earnings Trend data used for wages and pay gap. ABS Labor Force Seasonally adjusted data used for headline employment figures.
GENDER PAY GAP TABLE 1: Detailed Jobs breakdown by industry
MiningAgriculture, Forestry & FishingElectricity, Gas, Water & Waste ServicesInformation Media & TelecommunicationsEducation & TrainingPublic Administration & SafetyFinancial & Insurance ServicesProfessional, Scientific & Technical ServicesHealth Care & Social AssistanceTransport, Postal & WarehousingWholesale TradeArts & Recreation ServicesManufacturingConstructionAdministrative & Support ServicesRental, Hiring & Real Estate ServicesOther ServicesRetail TradeAccommodation & Food Services
$2,617 n/a
$1,924 $2,120 $1,909
$1,748 $2,237 $2,122 $1,886
$1,670 $1,637
$1,707 $1,471 $1,614
$1,646
$1,560 $1,283 $1,219
$1,207
190.8 179.8
112.2
117.4 231.0
363.1
206.6
595.7
277.5
434.3 243.1
75.4 571.2 913.7
142.7
90.3 220.3 344.4
181.4
2.3 34.4
10.8
19.7 95.7
31.2
16.6
87.5
109.1
89.1 34.2
46.0 58.1
117.4
76.2
15.0 53.0
200.4
211.1
12.7% n/a
11.5%
17.1%11.5%
4.9%
24.4%
24.3%
23.9%
15.6%15.1%
19.8%10.9%13.4%
16.4%
19.6% 3.5% 3.9%
9.1%
Gender
All Industries
MaleAvg Wkly
Earnings
$1,728
Full-time
(000s)
5,537
Part-time
(000s)
1,303
$2,286 n/a
$1,703 $1,758 $1,690
$1,662 $1,691 $1,606 $1,435 $1,410 $1,390 $1,370 $1,310 $1,397 $1,377 $1,255 $1,238 $1,172
$1,097
36.1 59.3
26.5
46.6442.8
294.3
157.4
322.0
685.4
99.5 95.6
51.3135.0 73.1
126.3
68.6110.7263.8
162.2
5.2 45.2
13.4
27.9345.8
108.9
61.5
159.0
669.1
45.6 40.6
69.7 91.0 64.4
129.0
33.7121.2425.2
348.1
FemaleAvg Wkly
Earnings
$1,486
Full-time
(000s)
3,310
Part-time
(000s)
2,802
Wage
disparity
14.0%
Financy Women’s Index Report: July 2019 – September 2019
29FWX© | Financy.com.au | proudly sponsored by OneVue, AMP Australia & AFA
Suggested actions to improve the progress of the gender pay gap:
To improve the national gender pay gap, some of the key measures required are to support an increase in the number of women in more senior management and leadership roles across Australian sectors, not just boards, particularly where women dominate sectors such as in Health and Education.
To address organisational wide and like-for-like gender pay gaps, leading practice set out in the Workplace Gender Equality Agency (WGEA) Employer of Choice citation guide include:
• Establish a remuneration policy and strategy that contains specific gender pay equity objectives.• Undertake a gender pay gap analysis of the workforce on a like-for-like and organisation-wide basis.• Where gaps are identified set targets and take other actions to reduce the like-for-like and organisation-wide gender pay gaps.• Take action on gender pay gaps identified, such as immediately correcting like-for-like gaps; establishing an annual budget for correcting gender pay gaps; undertaking a job evaluation process to identify remuneration bias; ensuring hiring managers and recruitment (internal and external) teams are trained on pay equity and the controls in place to reduce and eliminate gender pay gaps; and reducing and eliminating bias from the performance management system. • Women and men on primary carer’s leave must be included in your organisation’s annual reviews of salaries and annual bonus payments.• Your organisation must analyse and compare the results of performance reviews by gender.
In addition, greater transparency and reporting around pay rates for like-for-like roles would also help encourage the closing of gender pay gaps.
Other proactive actions employers can take include normalising flexible working arrangements in their workplace, introducing shared care parental leave policies and paying superannuation on parental leave. All of these actions will help to remove barriers to women’s full participation in the workforce and contribute to reducing gender pay gaps and the overall gap in women’s lifetime earnings.
While we believe that organisations should put in place systems and process to address gender pay gaps, individuals can play a role in raising these issues. Key actions that individual can take include:
• Checking that your employer has a remuneration policy that supports gender pay equity and conducts a gender pay gap analysis by checking their annual WGEA report, where relevant.• Selecting to work for an employer who is a WGEA pay equity ambassador or WGEA Employer of Choice citation holder. This won’t always be possible due to company size, but it may even serve the basis of a healthy discussion with an employer on values and thoughts on pay equity.• Raise questions about the policies and practises that your employer has about gender pay equity. • When applying for roles spend time researching the salary range for your role so you have specific data points. • Do not feel compelled to answer the question ‘what was your last salary’ and rather ask for transparency from the organisation on their salaries for roles.
GENDER PAY GAP
Financy Women’s Index Report: July 2019 – September 2019
30FWX© | Financy.com.au | proudly sponsored by OneVue, AMP Australia & AFA
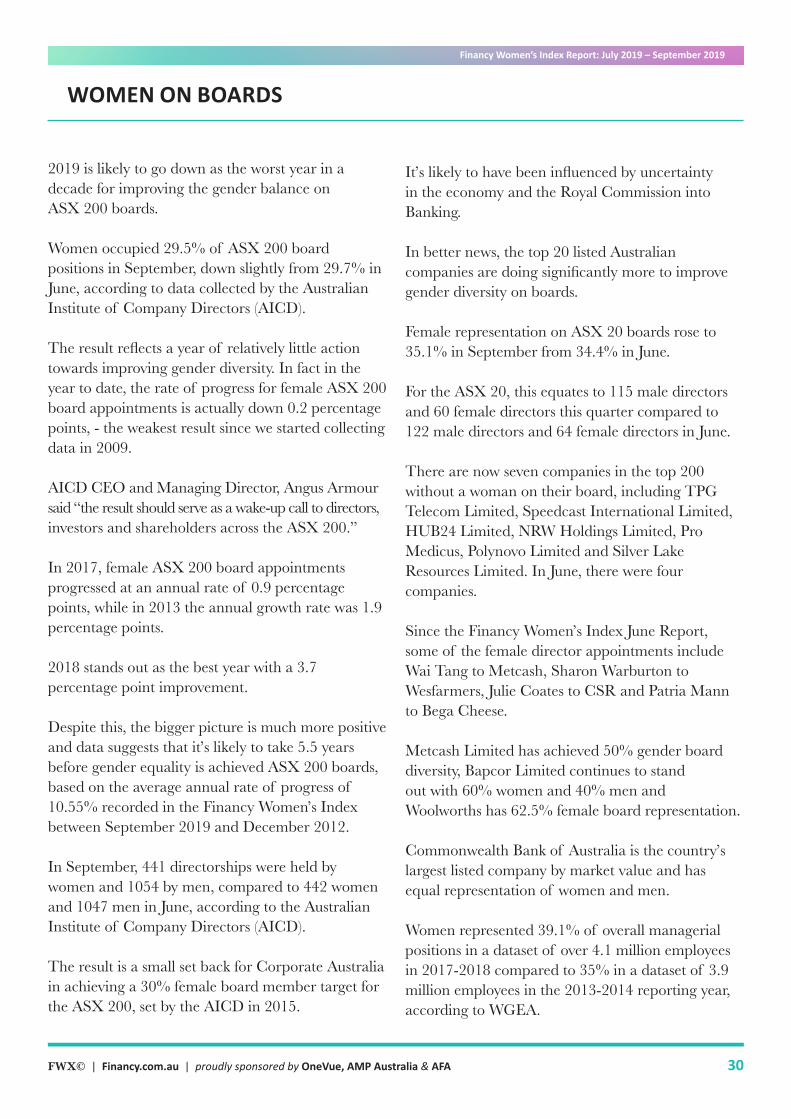
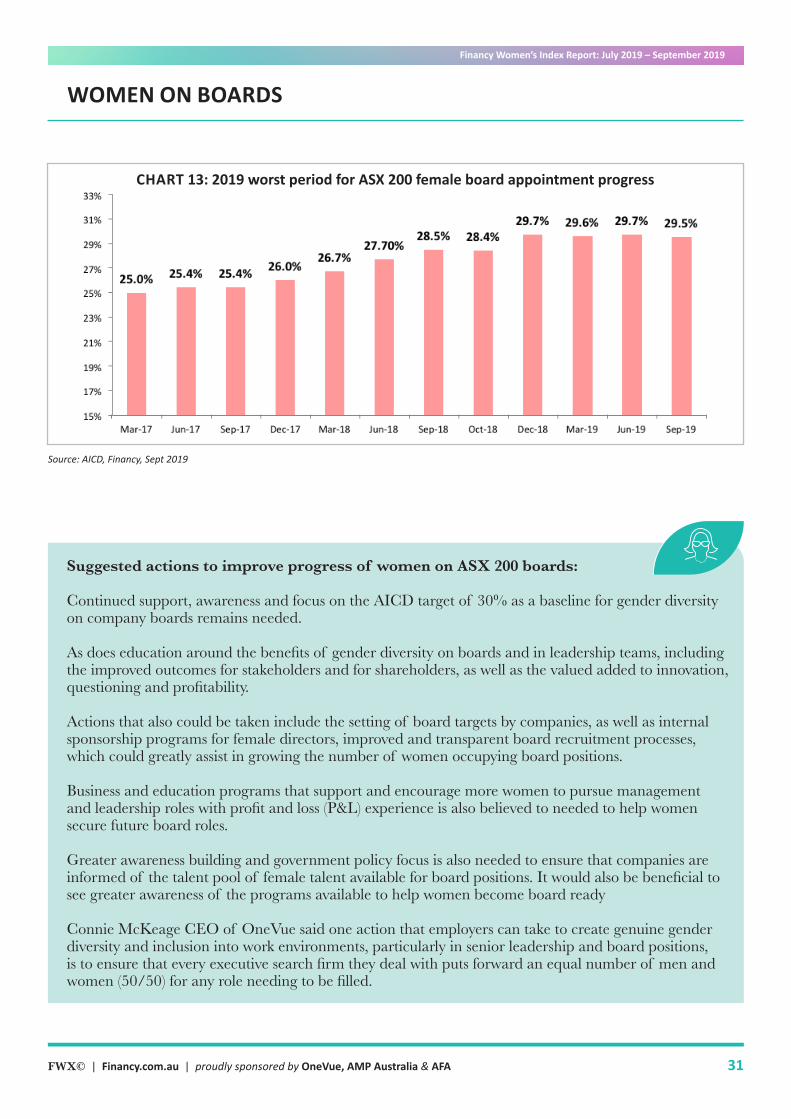
2019 is likely to go down as the worst year in a decade for improving the gender balance on ASX 200 boards.
Women occupied 29.5% of ASX 200 board positions in September, down slightly from 29.7% in June, according to data collected by the Australian Institute of Company Directors (AICD).
The result reflects a year of relatively little action towards improving gender diversity. In fact in the year to date, the rate of progress for female ASX 200 board appointments is actually down 0.2 percentage points, - the weakest result since we started collecting data in 2009.
AICD CEO and Managing Director, Angus Armour said “the result should serve as a wake-up call to directors, investors and shareholders across the ASX 200.”
In 2017, female ASX 200 board appointments progressed at an annual rate of 0.9 percentage points, while in 2013 the annual growth rate was 1.9 percentage points.
2018 stands out as the best year with a 3.7 percentage point improvement.
Despite this, the bigger picture is much more positive and data suggests that it’s likely to take 5.5 years before gender equality is achieved ASX 200 boards, based on the average annual rate of progress of 10.55% recorded in the Financy Women’s Index between September 2019 and December 2012.
In September, 441 directorships were held by women and 1054 by men, compared to 442 women and 1047 men in June, according to the Australian Institute of Company Directors (AICD). The result is a small set back for Corporate Australia in achieving a 30% female board member target for the ASX 200, set by the AICD in 2015.
WOMEN ON BOARDS
It’s likely to have been influenced by uncertainty in the economy and the Royal Commission into Banking.
In better news, the top 20 listed Australian companies are doing significantly more to improve gender diversity on boards.
Female representation on ASX 20 boards rose to 35.1% in September from 34.4% in June.
For the ASX 20, this equates to 115 male directors and 60 female directors this quarter compared to 122 male directors and 64 female directors in June.
There are now seven companies in the top 200 without a woman on their board, including TPG Telecom Limited, Speedcast International Limited, HUB24 Limited, NRW Holdings Limited, Pro Medicus, Polynovo Limited and Silver Lake Resources Limited. In June, there were four companies.
Since the Financy Women’s Index June Report, some of the female director appointments include Wai Tang to Metcash, Sharon Warburton to Wesfarmers, Julie Coates to CSR and Patria Mann to Bega Cheese.
Metcash Limited has achieved 50% gender board diversity, Bapcor Limited continues to stand out with 60% women and 40% men and Woolworths has 62.5% female board representation.
Commonwealth Bank of Australia is the country’s largest listed company by market value and has equal representation of women and men.
Women represented 39.1% of overall managerial positions in a dataset of over 4.1 million employees in 2017-2018 compared to 35% in a dataset of 3.9 million employees in the 2013-2014 reporting year, according to WGEA.
Financy Women’s Index Report: July 2019 – September 2019
31FWX© | Financy.com.au | proudly sponsored by OneVue, AMP Australia & AFA
Suggested actions to improve progress of women on ASX 200 boards: Continued support, awareness and focus on the AICD target of 30% as a baseline for gender diversity on company boards remains needed.
As does education around the benefits of gender diversity on boards and in leadership teams, including the improved outcomes for stakeholders and for shareholders, as well as the valued added to innovation, questioning and profitability.
Actions that also could be taken include the setting of board targets by companies, as well as internal sponsorship programs for female directors, improved and transparent board recruitment processes, which could greatly assist in growing the number of women occupying board positions.
Business and education programs that support and encourage more women to pursue management and leadership roles with profit and loss (P&L) experience is also believed to needed to help women secure future board roles.
Greater awareness building and government policy focus is also needed to ensure that companies are informed of the talent pool of female talent available for board positions. It would also be beneficial to see greater awareness of the programs available to help women become board ready
Connie McKeage CEO of OneVue said one action that employers can take to create genuine gender diversity and inclusion into work environments, particularly in senior leadership and board positions, is to ensure that every executive search firm they deal with puts forward an equal number of men and women (50/50) for any role needing to be filled.
WOMEN ON BOARDS
Source: AICD, Financy, Sept 2019
CHART 13: 2019 worst period for ASX 200 female board appointment progress
Financy Women’s Index Report: July 2019 – September 2019
32FWX© | Financy.com.au | proudly sponsored by OneVue, AMP Australia & AFA
The gender gap in superannuation has fallen to a record low and has more than halved across most age groups since 2004.
This latest result means that it may only take 11 years before gender equality is achieved in average superannuation balances, based on the average annual rate of progress of 3.06% recorded in the Financy Women’s Index between September 2019 and December 2012.
Superannuation account data released for the 2017-18 financial year by the Australian Bureau of Statistics (ABS) shows that the gender gap on average balances has narrowed to 28%, from 34% in 2015–16 financial year and from 50% in the 2003-04 financial year.
The average superannuation balance for those aged 15 and over now stands at $121,300 for women, which is 28% less than the $168,500 of men.
By contrast in the 2015-16 financial year, the average superannuation balance for those aged 15 and over was $105,400 for women and $158,700 for men. These figures have been adjusted for Consumer Price Inflation (CPI) and are in 2017-18 dollars.
Women aged 55–64 years have seen the most significant improvement in the gender gap, which currently stands at 26% compared to 49% in the 2003-04 financial year.
The average superannuation balance for those aged 55-64 years, who are approaching retirement age, otherwise known as preservation age was $245,100 for women and $332,700 for men.
In the 2017-18 financial year, the gender gap is at its smallest when a woman is starting out in the workforce. The gap is now at 3% for people aged 15-24 years compared to 21% in the 2003-04 financial year.
SUPERANNUATION GAP
The average superannuation balance of women in this age group is $6,100 and $6,300 for men.
The gender gap significantly widens as women approach the age group of 35–44 years - a period when they are most likely to have children. Women in this age group are retiring with about 31% less than men on average, but this is much less than the 49% gap in the 2003-04 financial year.
For the 45-54 age group the gender gap in balances is 34% today compared to 54% in the 2003-04 financial year. The average superannuation for women is $129,100 compared to $196,400 for men.
The ABS data looks at mean balances and includes self-managed super funds but not those with nil balances.
While the superannuation gender gap is closing, largely thanks to increased workforce participation and sustained compulsory contributions, women still retire with less than men due largely to time spent in unpaid work and out of the full-time workforce caring for children. Women also earn less than men on average.
What has arguably helped improve the superannuation gender gap has also been greater awareness raising of the adequacy of retirement savings and the strategies that can be used to take advantage of contributions limits.
Ross Clare Director of Research at the Association of Superannuation Funds of Australia (ASFA) notes that a number of measures particularly assist women, such as the Low Income Superannuation Tax Offset. As well as lower contribution caps and the Division 293 higher rate of tax on contributions made by upper income earners, which have tended to reduce the scope for mostly men to accumulate very high account balances
Financy Women’s Index Report: July 2019 – September 2019
33FWX© | Financy.com.au | proudly sponsored by OneVue, AMP Australia & AFA
Analysis by the SMSF Association of the latest Australian Taxation Office data found that women made the biggest contributions to self managed super funds (SMSFs) during the 2016-17 financial year as many made use of tax efficient contributions limits. According to ASFA, one in three women and one in four men, across all ages, have no superannuation account. Around 25% of women and 13% of men are retiring with no superannuation at all. ASFA estimates that the lifetime superannuation gender gap for those 15 years and over has narrowed to from 24% to 22% over the last two years with an average balance for men of $146,420 and for women of $114,350.
SUPERANNUATION GAP
ASFA also notes in its latest report that the median balance for those nearing retirement and aged between 60-64 years is $122,848 for women and $154,453 for men (the median balance is where 50% of the group have a higher balance and 50% have a lower balance).
These figures are significantly less than the $545,000 that ASFA says is needed to achieve a comfortable retirement.
The improvement in the retirement savings of women is also likely to have been influenced by an increasing number of organisations starting to offer improved superannuation benefits for women and those on paid and unpaid parental leave.
Such measures are likely to be effective in helping to retain women in the workforce and supporting their transition back to work after children.
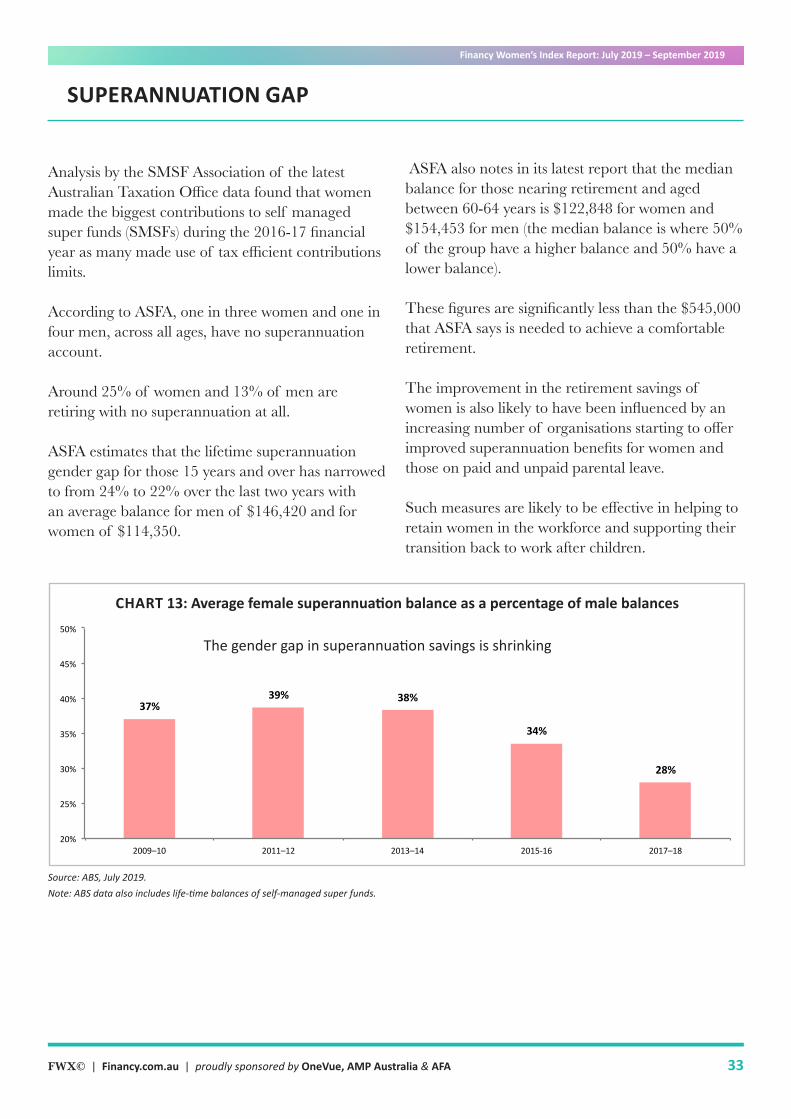
37%39% 38%
34%
28%
20%
25%
30%
35%
40%
45%
50%
2009–10 2011–12 2013–14 2015-16 2017–18
Thesuperannua2onsavingsgapfacingtheaveragewoman
Source: ABS, July 2019.Note: ABS data also includes life-time balances of self-managed super funds.
CHART 13: Average female superannuation balance as a percentage of male balances
The gender gap in superannuation savings is shrinking
Financy Women’s Index Report: July 2019 – September 2019
34FWX© | Financy.com.au | proudly sponsored by OneVue, AMP Australia & AFA
Suggested actions to improve the gender gap in superannuation:
Measures to improve wage disparity along with government requirements/incentives for all employers to pay superannuation on paid parental leave, as well as introducing measures to encourage more women, and primary carers to more easily make catch up payments when back at work after children.
Greater awareness is needed of the various strategies, financial product solutions and technologies that can be used to help women top up and play catch up on superannuation.
One of the strategies involves taking advantage of any unused concessional super contributions which can be accumulated over five years, provided the individual’s total super balance is less than $500,000. While the annual limit on concessional contributions is $25,000, individuals who can afford it can make use of up to five years of previously unused contributions.
Women in relationships may also be able to make use of the extended ‘spouse contribution tax offset’. The tax offset allows the higher earning partner in a relationship to make tax reduced super contributions on behalf of their lower earning partner, as long as the lower earner has an income below $40,000. The full tax offset applies up to an income of $37,000, an increase from the previous $10,800.
Women in retirement who need to boost their super may also benefit from the ‘downsizing into superannuation’ rule. This makes it possible under certain conditions for over 65s to top up their super by up to $300,000 by using the proceeds from the sale of their home.
SUPERANNUATION GAP
“Gender gap in super could close over the next decade.”
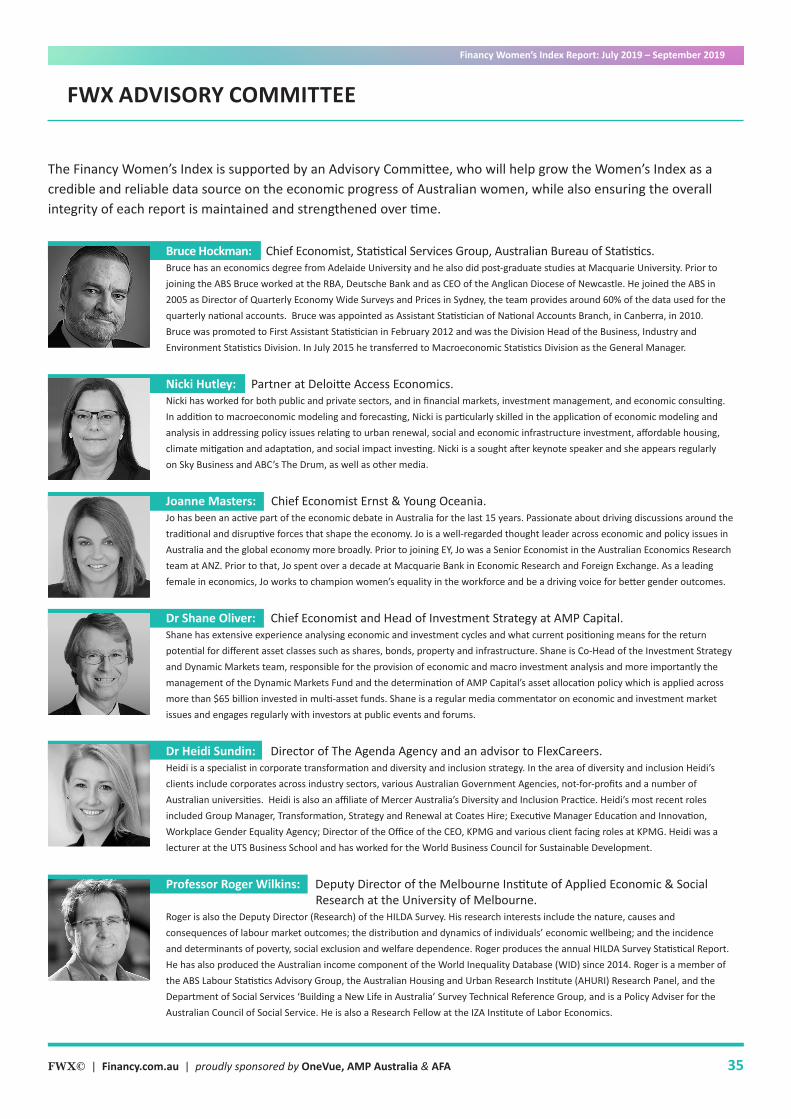
Financy Women’s Index Report: July 2019 – September 2019
35FWX© | Financy.com.au | proudly sponsored by OneVue, AMP Australia & AFA
Bruce Hockman: Chief Economist, Statistical Services Group, Australian Bureau of Statistics.Bruce has an economics degree from Adelaide University and he also did post-graduate studies at Macquarie University. Prior to joining the ABS Bruce worked at the RBA, Deutsche Bank and as CEO of the Anglican Diocese of Newcastle. He joined the ABS in 2005 as Director of Quarterly Economy Wide Surveys and Prices in Sydney, the team provides around 60% of the data used for the quarterly national accounts. Bruce was appointed as Assistant Statistician of National Accounts Branch, in Canberra, in 2010.Bruce was promoted to First Assistant Statistician in February 2012 and was the Division Head of the Business, Industry and Environment Statistics Division. In July 2015 he transferred to Macroeconomic Statistics Division as the General Manager.
Nicki Hutley: Partner at Deloitte Access Economics. Nicki has worked for both public and private sectors, and in financial markets, investment management, and economic consulting. In addition to macroeconomic modeling and forecasting, Nicki is particularly skilled in the application of economic modeling and analysis in addressing policy issues relating to urban renewal, social and economic infrastructure investment, affordable housing, climate mitigation and adaptation, and social impact investing. Nicki is a sought after keynote speaker and she appears regularly on Sky Business and ABC’s The Drum, as well as other media.
Joanne Masters: Chief Economist Ernst & Young Oceania. Jo has been an active part of the economic debate in Australia for the last 15 years. Passionate about driving discussions around the traditional and disruptive forces that shape the economy. Jo is a well-regarded thought leader across economic and policy issues in Australia and the global economy more broadly. Prior to joining EY, Jo was a Senior Economist in the Australian Economics Research team at ANZ. Prior to that, Jo spent over a decade at Macquarie Bank in Economic Research and Foreign Exchange. As a leading female in economics, Jo works to champion women’s equality in the workforce and be a driving voice for better gender outcomes.
Dr Shane Oliver: Chief Economist and Head of Investment Strategy at AMP Capital.Shane has extensive experience analysing economic and investment cycles and what current positioning means for the return potential for different asset classes such as shares, bonds, property and infrastructure. Shane is Co-Head of the Investment Strategy and Dynamic Markets team, responsible for the provision of economic and macro investment analysis and more importantly the management of the Dynamic Markets Fund and the determination of AMP Capital’s asset allocation policy which is applied across more than $65 billion invested in multi-asset funds. Shane is a regular media commentator on economic and investment market issues and engages regularly with investors at public events and forums.
Dr Heidi Sundin: Director of The Agenda Agency and an advisor to FlexCareers. Heidi is a specialist in corporate transformation and diversity and inclusion strategy. In the area of diversity and inclusion Heidi’s clients include corporates across industry sectors, various Australian Government Agencies, not-for-profits and a number of Australian universities. Heidi is also an affiliate of Mercer Australia’s Diversity and Inclusion Practice. Heidi’s most recent roles included Group Manager, Transformation, Strategy and Renewal at Coates Hire; Executive Manager Education and Innovation, Workplace Gender Equality Agency; Director of the Office of the CEO, KPMG and various client facing roles at KPMG. Heidi was a lecturer at the UTS Business School and has worked for the World Business Council for Sustainable Development.
Professor Roger Wilkins: Deputy Director of the Melbourne Institute of Applied Economic & Social Research at the University of Melbourne. Roger is also the Deputy Director (Research) of the HILDA Survey. His research interests include the nature, causes and consequences of labour market outcomes; the distribution and dynamics of individuals’ economic wellbeing; and the incidence and determinants of poverty, social exclusion and welfare dependence. Roger produces the annual HILDA Survey Statistical Report. He has also produced the Australian income component of the World Inequality Database (WID) since 2014. Roger is a member of the ABS Labour Statistics Advisory Group, the Australian Housing and Urban Research Institute (AHURI) Research Panel, and the Department of Social Services ‘Building a New Life in Australia’ Survey Technical Reference Group, and is a Policy Adviser for the Australian Council of Social Service. He is also a Research Fellow at the IZA Institute of Labor Economics.
The Financy Women’s Index is supported by an Advisory Committee, who will help grow the Women’s Index as a credible and reliable data source on the economic progress of Australian women, while also ensuring the overall integrity of each report is maintained and strengthened over time.
FWX ADVISORY COMMITTEE
Financy Women’s Index Report: July 2019 – September 2019
36FWX© | Financy.com.au | proudly sponsored by OneVue, AMP Australia & AFA
Gender Pay GapChart 11 & 12 - Average weekly earnings charts are based on table 1 of the Australian Bureau of Statistics series 6302.0 citing table one and using trend data. Tables 10c and 10f of the same series have been used to extrapolate data for earnings by industry. The report comes out twice a year in February and August.
Table 1 - The detailed jobs by industry table is an aggregation of data used in the ABS detailed quarterly labour force report series, 6291.0.55.001, 6291.0.55.003, 6202.0 ABS Labour Force data monthly and the aforementioned average weekly earnings data. Original data is used in respect to the industry breakdown and trend data is used for average wages as well as the wage disparity. Agriculture, Forestry and Fishing is not available given the seasonal and casualised nature of work across this sector of the economy.
Women On BoardsChart 13 - The percentage of women on ASX200 boards is based on board diversity data that is published monthly by the Australian Institute of Company Directors (AICD). Analysis of ASX20 is provided by Financy. Previously analysis was undertaken by Datadigger.com.au to aggregate data over female representation on Australia’s top 20 ASX listed companies. This data has now been revised to match that contained in the AICD’s reports dating back to 2012.
Superanuation GapChart 14 - Superannuation with reference to the average lifetime super balance by gender looks at the total mean for age groups that span 15 to 70 years plus. The data source is the ABS 6523.0 - Household Income and Wealth, Australia, 2017-18, data cube 12 superannuation by persons. The data available comes out once every two years. Data from the Association of Superannuation Funds of Australia (ASFA) and the SMSF Association have been cited here.
The Financy Women’s Index, which is supported by data and research company Data Digger and the FWX Advisory panel as well as the Australian Bureau of Statistics, is designed to provide a credible and up-to-date quarterly measure of the economic progress of Australian women.
The Index focuses on eight key areas aimed at reflecting a woman’s working life cycle. These include unpaid work, tertiary education, full-time work, underemployment, labour force participation, wage disparity, board representation of Australia’s largest companies and superannuation balances of women compared to men.
The Index result is revised quarterly to reflect any changes in official statistics and developmental amendments aimed at improving the depth of research into economic equality and the financial progress of women.
Executive Summary Chart 1, 2 and 3 - The headline quarterly and annual Financy Women’s Index is the average of eight key indicators that have been converted to respective indexed series so as to track measurements of performance over a five year period. These indicators are not weighted. Seasonally adjusted data is used where it is available. The Financy Women’s Index (FWX) economic progress targets for each of the eight key indicators are based to zero average wage disparity and zero gap in superannuation savings, the male and female participation rates being equal, female full-time employment being equal to male full-time employment, and therefore equal unpaid workloads, 50% gender diversity on ASX 200 boards and steady tertiary education numbers given that women already outnumber men on enrolments. We caution that the FWX Progress Targets and time frames are a tentative guide on and will be revised over time with progress rates and new information.
Women In Unpaid WorkChart 4 and 5 – Unpaid work figures have been provided by 2018 Household, Income and Labour Dynamics in Australia (HILDA) Survey. Chapter 5 - The division of paid and unpaid work among couples - contains some of the data featured in this Report where it relates to gender and hours worked. Unpublished HILDA Survey data in relation to age groups has also been analysed for this Report. The HILDA Survey comes out once a year.
Tertiary EducationChart 6 & 7- Tertiary studying trends are the product of analysis conducted by Data Digger and Financy using the Department of Education Ucube service. Enrolment growth and percentages are calculated citing various percentage changes. The annual data is updated once a year. Tertiary Education Attendee figures are derived from ABS Labour Force data category 6202.0 Table 15. Graduate salaries data provided by the Australian Government Department of Education funded organization, Quality Indicators for Learning and Teaching (QILT), and contained in the 2018 and 2019 (Longitudinal) Graduate Outcomes Survey (GOS). ABS Gender Indicators Report November 2018 has been cited here.
Women In The WorkforceChart 8, 9 & 10 - Labour Force participation data, age demographic data by gender and part-time to full-time job numbers by gender are based on seasonally adjusted data contained in the monthly data set 6202.0 - Labour Force, Australia, Jun 2019.
METHODOLOGY
Financy Women’s Index Report: July 2019 – September 2019
37FWX© | Financy.com.au | proudly sponsored by OneVue, AMP Australia & AFA
Financy and DataDigger give no representation, make no warranty, nor take any responsibility as to the accuracy or completeness of any information contained herein, or by third parties resources used in producing this report, and will not be liable in contract, tort, for negligence or otherwise for any loss damage arising from reliance on any such information.
The Financy and DataDigger Women’s Index presents the findings of analysis of annual reports issued by companies listed on the Australian Stock Exchange (ASX) together with the professional analysis and insights of Financy and DataDigger.
These analysis and insights do not necessarily coincide with those of Financy and DataDigger.
The information presented in this report has been carefully reviewed by members of the Economic Advisory Committee and the Australian Bureau of Statistics but any issues with the data remains the responsibility of Financy.
Any comments on the Women’s Index by members of the Committee are their own and are not a reflection of the companies that they work for.
Any suggested actions raised in this Report to help the economic progress of women have not been provided by and do not necessarily reflect the views of the members of the Committee or the Australian Bureau of Statistics.
The Financy’s Women’s Index is authored by Bianca Hartge-Hazelman, who is also the publisher of women’s money website Financy®
Bianca is a journalist specialising in women’s money matters. She holds a Communications Degree, Master’s Degree in Journalism and Graduate Diploma in Applied Finance.
The Index was launched in 2017 with the help of data specialist and Dan Petrie of Data Digger
ABOUT THE WOMEN’S INDEX DISCLAIMER
Data Digger®
is a business that specialises in all things Australian economic data and chart building.
For information on the data contained in the report contact:
Financy Women’s IndexFounder & Author: Bianca Hartge-HazelmanMobile: 0403 656 399Email: [email protected]
This report is copyright 2019. Apart from any fair dealing for the purposes of study, research, criticism or review, as permitted under the Copyright Act, no part may be reproduced without written permission.
Prepared by
Proudly sponsored by