
September 2018 | Week 37 · 2 2017 2018 10th - 14th September 2018 apesize – Momentum for apes...
11
1 14 Sep ±∆ ±% BDI 1,366 q -124 -8.3% BCI 1,900 q -511 -21.2% BPI 1,523 q -5 -0.3% BSI 1,134 u 0 0.0% BHSI 588 p 20 3.5% W-O-W change It was 10 years ago this past Friday, when the world encountered the most severe financial crisis since the Great Depression. A crisis that affected the whole business world and led shipping markets into a tail spin recession unlike any seen in decades. In the summer of 2008, the BDI had reached its highest point in its history, peaking at 11,793 points. The booming market conditions noted since the latter half of 2003 had boosted market confidence to new highs, while many were proclaiming a new market reality was taking shape. This optimism, which as usual occurs at the top of any mar- ket cycle, had as a result a spending spree that was unmatched, as a consequence leading to the biggest orderbook pile up in history being held by shipbuilders. The orderbook had reached 3,700 vessels just before the collapse of Lehman Brothers in September 2008. The harsh impact of the crisis was swift and unpleasant for the dry bulk sector, though despite all this, the orderbook number fell by only 7% in 2009. The orderbook remained above 3,000 vessels up until the last quarter of 2011 thanks to renewed interest for new orders post the financial crash. With the end of the com- modity super-cycle in 2011 we began to see a drop in the orderbook of 15% per year on average, reaching 863 at August 2018. As a result of all this, the fleet grew vastly in the years following the collapse, with the YoY% fleet growth figures being 8% and 9% respectively for 2010 and 2011, while in the last 10 years it has increased by 62% in terms of vessel numbers. After 2011, fleet growth started to drop gradually, reach- ing 2% in 2017. Demolitions volumes increased in this time period helping alleviate the market from some of these excesses, though even with these removals it took a while before a balance could be reached. Meanwhile, global trade took a serious hit just after the 2008 crash, with total volume falling by around 14% in 2009, according to WTO. Consequently, this huge gap between supply and demand sent rates plum- meting. Capes so the worst of this, going from exuberant rates of around $200,000pd at its peak, down to lower than $10,000 per day in the last quarter of the same year. Unlike previous financial and economic downturns, the recovery this time around was fairly swift, yet the ground work had been laid down for the gradually retreat of the double figure growth rates in trade. Today, with the orderbook to fleet ratio is at around 12%, with market fundamentals turning positive and with a considerably improved global trade growth noted over the past 2 years, the question is what will happen if all this starts to build up to over exu- berance amongst shipowners. The truth is that another aspect of this crisis is still play- ing a key role here. More specifically, the ship financing market has not completely revived yet. Traditional ship financing houses are still limiting their involvement in the market. Over the past couple of years we have seen limited fresh lending, as well re- duced credit lines and even withdrawals from previously agreed commitments. Alter- native financing is only just coming into the spotlight, with Chinese leasing being the latest flavor of the month. All these have helped keep the orderbook at low levels, a fact that has facilitated to bring about some breathing space in the market. All in all, as shipping finance starts to become more accessible and finds new ways to reinvent itself and with market fundamentals continuing to improve, it is matter of time before we see if George Santayana’s quote, “Those who cannot remember the past are condemned to repeat it”, will be confirmed once more. Yiannis Vamvakas Research Analyst 10 th - 14 th September 2018 | Week 37 Dry Bulk Freight Market Secondhand Market Newbuilding Market Demolion Market Economic Indicators Tanker Freight Market 14 Sep ±∆ ±% BDTI 765 q -20 -2.5% BCTI 513 q -19 -3.6% W-O-W change Avg Price Index (main 5 regions) 14 Sep ±∆ ±% Dry 329 u 0 0.0% Wet 344 u 0 0.0% W-O-W change Aggregate Price Index 14 Sep ±∆ ±% Bulkers 97 u 0 0.0% Cont 94 u 0 0.0% Tankers 99 p 0 0.4% Gas 91 u 0 0.0% M-O-M change 14 Sep ±∆ ±% Gold $ 1,198 q -8 -0.6% Oil WTI $ 68 p 2 2.7% Oil Brent $ 77 p 6 8.4% Iron Ore 70 p 1 1.2% Coal 100 p 2 2.1% M-O-M change Aggregate Price Index 14 Sep ±∆ ±% Capesize 66 u 0 0.0% Panamax 61 u 0 0.0% Supramax 66 u 0 0.0% Handysize 71 p 0 0.7% M-O-M change VLCC 84 p 1 1.3% Suezmax 74 p 1 1.8% Aframax 85 p 0 0.6% MR 104 q -1 -1.0%
Transcript of September 2018 | Week 37 · 2 2017 2018 10th - 14th September 2018 apesize – Momentum for apes...

1
14 Sep ±∆ ±%BDI 1,366 q -124 -8.3%
BCI 1,900 q -511 -21.2%
BPI 1,523 q -5 -0.3%
BSI 1,134 u 0 0.0%
BHSI 588 p 20 3.5%
W-O-W change
It was 10 years ago this past Friday, when the world encountered the most severe
financial crisis since the Great Depression. A crisis that affected the whole business
world and led shipping markets into a tail spin recession unlike any seen in decades.
In the summer of 2008, the BDI had reached its highest point in its history, peaking at
11,793 points. The booming market conditions noted since the latter half of 2003 had
boosted market confidence to new highs, while many were proclaiming a new market
reality was taking shape. This optimism, which as usual occurs at the top of any mar-
ket cycle, had as a result a spending spree that was unmatched, as a consequence
leading to the biggest orderbook pile up in history being held by shipbuilders. The
orderbook had reached 3,700 vessels just before the collapse of Lehman Brothers in
September 2008. The harsh impact of the crisis was swift and unpleasant for the dry
bulk sector, though despite all this, the orderbook number fell by only 7% in 2009.
The orderbook remained above 3,000 vessels up until the last quarter of 2011 thanks
to renewed interest for new orders post the financial crash. With the end of the com-
modity super-cycle in 2011 we began to see a drop in the orderbook of 15% per year
on average, reaching 863 at August 2018. As a result of all this, the fleet grew vastly
in the years following the collapse, with the YoY% fleet growth figures being 8% and
9% respectively for 2010 and 2011, while in the last 10 years it has increased by 62%
in terms of vessel numbers. After 2011, fleet growth started to drop gradually, reach-
ing 2% in 2017. Demolitions volumes increased in this time period helping alleviate
the market from some of these excesses, though even with these removals it took a
while before a balance could be reached. Meanwhile, global trade took a serious hit
just after the 2008 crash, with total volume falling by around 14% in 2009, according
to WTO. Consequently, this huge gap between supply and demand sent rates plum-
meting. Capes so the worst of this, going from exuberant rates of around $200,000pd
at its peak, down to lower than $10,000 per day in the last quarter of the same year.
Unlike previous financial and economic downturns, the recovery this time around was
fairly swift, yet the ground work had been laid down for the gradually retreat of the
double figure growth rates in trade.
Today, with the orderbook to fleet ratio is at around 12%, with market fundamentals
turning positive and with a considerably improved global trade growth noted over the
past 2 years, the question is what will happen if all this starts to build up to over exu-
berance amongst shipowners. The truth is that another aspect of this crisis is still play-
ing a key role here. More specifically, the ship financing market has not completely
revived yet. Traditional ship financing houses are still limiting their involvement in the
market. Over the past couple of years we have seen limited fresh lending, as well re-
duced credit lines and even withdrawals from previously agreed commitments. Alter-
native financing is only just coming into the spotlight, with Chinese leasing being the
latest flavor of the month. All these have helped keep the orderbook at low levels, a
fact that has facilitated to bring about some breathing space in the market.
All in all, as shipping finance starts to become more accessible and finds new ways to
reinvent itself and with market fundamentals continuing to improve, it is matter of
time before we see if George Santayana’s quote, “Those who cannot remember the
past are condemned to repeat it”, will be confirmed once more.
Yiannis Vamvakas
Research Analyst
10th - 14th September 2018 | Week 37
Dry Bulk Freight Market
Secondhand Market
Newbuilding Market
Demolition Market
Economic Indicators
Tanker Freight Market
14 Sep ±∆ ±%BDTI 765 q -20 -2.5%
BCTI 513 q -19 -3.6%
W-O-W change
Avg Price Index (main 5 regions)
14 Sep ±∆ ±%Dry 329 u 0 0.0%
Wet 344 u 0 0.0%
W-O-W change
Aggregate Price Index
14 Sep ±∆ ±%Bulkers 97 u 0 0.0%
Cont 94 u 0 0.0%
Tankers 99 p 0 0.4%
Gas 91 u 0 0.0%
M-O-M change
14 Sep ±∆ ±%Gold $ 1,198 q -8 -0.6%
Oil WTI $ 68 p 2 2.7%
Oil Brent $ 77 p 6 8.4%
Iron Ore 70 p 1 1.2%
Coal 100 p 2 2.1%
M-O-M change
Aggregate Price Index
14 Sep ±∆ ±%Capesize 66 u 0 0.0%
Panamax 61 u 0 0.0%
Supramax 66 u 0 0.0%
Handysize 71 p 0 0.7%
M-O-M change
VLCC 84 p 1 1.3%
Suezmax 74 p 1 1.8%
Aframax 85 p 0 0.6%
MR 104 q -1 -1.0%
2
2017 2018
10th - 14th September 2018
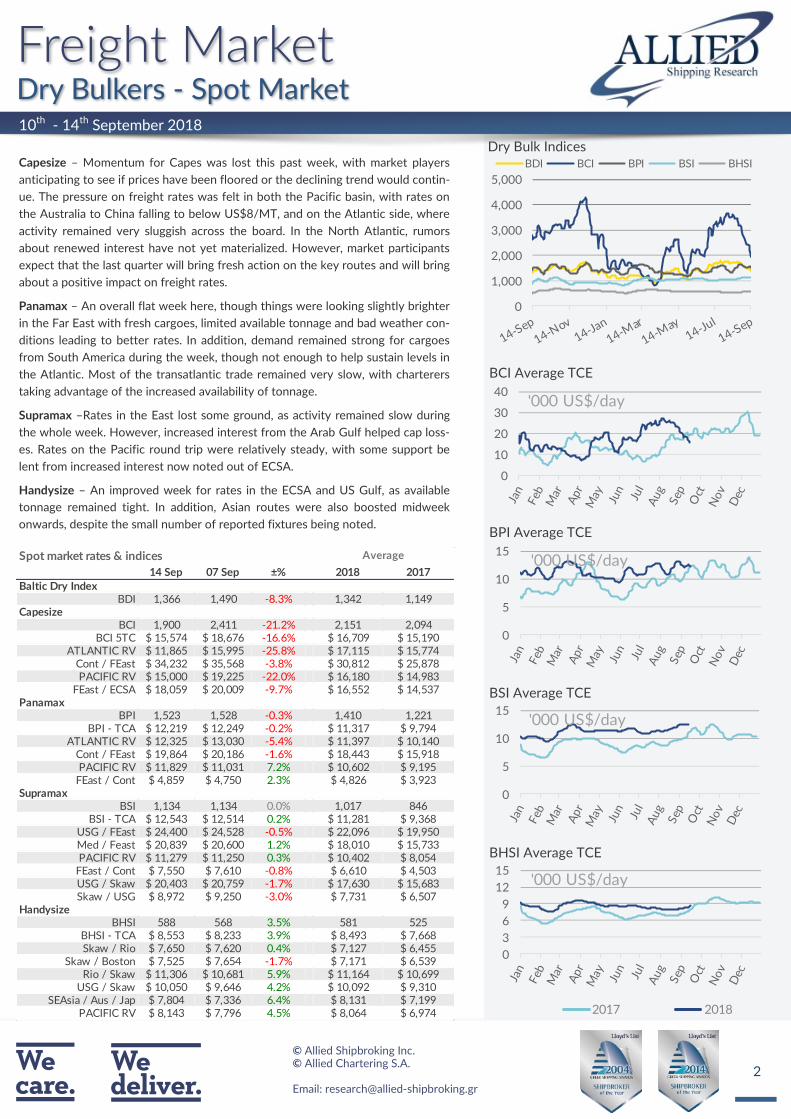
Capesize – Momentum for Capes was lost this past week, with market players
anticipating to see if prices have been floored or the declining trend would contin-
ue. The pressure on freight rates was felt in both the Pacific basin, with rates on
the Australia to China falling to below US$8/MT, and on the Atlantic side, where
activity remained very sluggish across the board. In the North Atlantic, rumors
about renewed interest have not yet materialized. However, market participants
expect that the last quarter will bring fresh action on the key routes and will bring
about a positive impact on freight rates.
Panamax – An overall flat week here, though things were looking slightly brighter
in the Far East with fresh cargoes, limited available tonnage and bad weather con-
ditions leading to better rates. In addition, demand remained strong for cargoes
from South America during the week, though not enough to help sustain levels in
the Atlantic. Most of the transatlantic trade remained very slow, with charterers
taking advantage of the increased availability of tonnage.
Supramax –Rates in the East lost some ground, as activity remained slow during
the whole week. However, increased interest from the Arab Gulf helped cap loss-
es. Rates on the Pacific round trip were relatively steady, with some support be
lent from increased interest now noted out of ECSA.
Handysize – An improved week for rates in the ECSA and US Gulf, as available
tonnage remained tight. In addition, Asian routes were also boosted midweek
onwards, despite the small number of reported fixtures being noted.
0
10
20
30
40'000 US$/day
14 Sep 07 Sep ±% 2018 2017
Baltic Dry IndexBDI 1,366 1,490 -8.3% 1,342 1,149
CapesizeBCI 1,900 2,411 -21.2% 2,151 2,094
BCI 5TC $ 15,574 $ 18,676 -16.6% $ 16,709 $ 15,190ATLANTIC RV $ 11,865 $ 15,995 -25.8% $ 17,115 $ 15,774
Cont / FEast $ 34,232 $ 35,568 -3.8% $ 30,812 $ 25,878PACIFIC RV $ 15,000 $ 19,225 -22.0% $ 16,180 $ 14,983
FEast / ECSA $ 18,059 $ 20,009 -9.7% $ 16,552 $ 14,537Panamax
BPI 1,523 1,528 -0.3% 1,410 1,221BPI - TCA $ 12,219 $ 12,249 -0.2% $ 11,317 $ 9,794
ATLANTIC RV $ 12,325 $ 13,030 -5.4% $ 11,397 $ 10,140Cont / FEast $ 19,864 $ 20,186 -1.6% $ 18,443 $ 15,918PACIFIC RV $ 11,829 $ 11,031 7.2% $ 10,602 $ 9,195
FEast / Cont $ 4,859 $ 4,750 2.3% $ 4,826 $ 3,923Supramax
BSI 1,134 1,134 0.0% 1,017 846BSI - TCA $ 12,543 $ 12,514 0.2% $ 11,281 $ 9,368
USG / FEast $ 24,400 $ 24,528 -0.5% $ 22,096 $ 19,950Med / Feast $ 20,839 $ 20,600 1.2% $ 18,010 $ 15,733PACIFIC RV $ 11,279 $ 11,250 0.3% $ 10,402 $ 8,054
FEast / Cont $ 7,550 $ 7,610 -0.8% $ 6,610 $ 4,503USG / Skaw $ 20,403 $ 20,759 -1.7% $ 17,630 $ 15,683Skaw / USG $ 8,972 $ 9,250 -3.0% $ 7,731 $ 6,507
HandysizeBHSI 588 568 3.5% 581 525
BHSI - TCA $ 8,553 $ 8,233 3.9% $ 8,493 $ 7,668Skaw / Rio $ 7,650 $ 7,620 0.4% $ 7,127 $ 6,455
Skaw / Boston $ 7,525 $ 7,654 -1.7% $ 7,171 $ 6,539Rio / Skaw $ 11,306 $ 10,681 5.9% $ 11,164 $ 10,699
USG / Skaw $ 10,050 $ 9,646 4.2% $ 10,092 $ 9,310SEAsia / Aus / Jap $ 7,804 $ 7,336 6.4% $ 8,131 $ 7,199
PACIFIC RV $ 8,143 $ 7,796 4.5% $ 8,064 $ 6,974
Spot market rates & indices Average
0
1,000
2,000
3,000
4,000
5,000
BDI BCI BPI BSI BHSI
0
5
10
15'000 US$/day
0
5
10
15'000 US$/day
0
3
6
9
12
15'000 US$/day
3
2017 2018
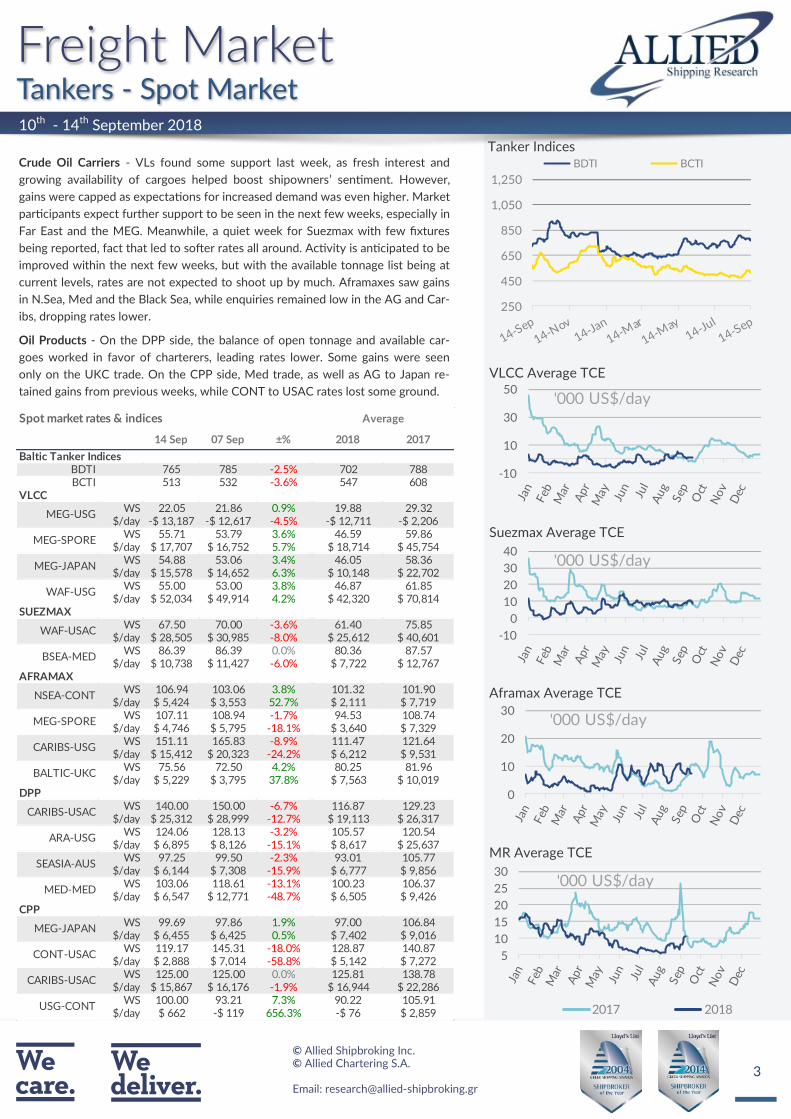
Crude Oil Carriers - VLs found some support last week, as fresh interest and
growing availability of cargoes helped boost shipowners’ sentiment. However,
gains were capped as expectations for increased demand was even higher. Market
participants expect further support to be seen in the next few weeks, especially in
Far East and the MEG. Meanwhile, a quiet week for Suezmax with few fixtures
being reported, fact that led to softer rates all around. Activity is anticipated to be
improved within the next few weeks, but with the available tonnage list being at
current levels, rates are not expected to shoot up by much. Aframaxes saw gains
in N.Sea, Med and the Black Sea, while enquiries remained low in the AG and Car-
ibs, dropping rates lower.
Oil Products - On the DPP side, the balance of open tonnage and available car-
goes worked in favor of charterers, leading rates lower. Some gains were seen
only on the UKC trade. On the CPP side, Med trade, as well as AG to Japan re-
tained gains from previous weeks, while CONT to USAC rates lost some ground.
10th - 14th September 2018
14 Sep 07 Sep ±% 2018 2017
Baltic Tanker IndicesBDTI 765 785 -2.5% 702 788BCTI 513 532 -3.6% 547 608
VLCCWS 22.05 21.86 0.9% 19.88 29.32
$/day -$ 13,187 -$ 12,617 -4.5% -$ 12,711 -$ 2,206WS 55.71 53.79 3.6% 46.59 59.86
$/day $ 17,707 $ 16,752 5.7% $ 18,714 $ 45,754WS 54.88 53.06 3.4% 46.05 58.36
$/day $ 15,578 $ 14,652 6.3% $ 10,148 $ 22,702WS 55.00 53.00 3.8% 46.87 61.85
$/day $ 52,034 $ 49,914 4.2% $ 42,320 $ 70,814SUEZMAX
WS 67.50 70.00 -3.6% 61.40 75.85$/day $ 28,505 $ 30,985 -8.0% $ 25,612 $ 40,601
WS 86.39 86.39 0.0% 80.36 87.57$/day $ 10,738 $ 11,427 -6.0% $ 7,722 $ 12,767
AFRAMAXWS 106.94 103.06 3.8% 101.32 101.90
$/day $ 5,424 $ 3,553 52.7% $ 2,111 $ 7,719WS 107.11 108.94 -1.7% 94.53 108.74
$/day $ 4,746 $ 5,795 -18.1% $ 3,640 $ 7,329WS 151.11 165.83 -8.9% 111.47 121.64
$/day $ 15,412 $ 20,323 -24.2% $ 6,212 $ 9,531WS 75.56 72.50 4.2% 80.25 81.96
$/day $ 5,229 $ 3,795 37.8% $ 7,563 $ 10,019DPP
WS 140.00 150.00 -6.7% 116.87 129.23$/day $ 25,312 $ 28,999 -12.7% $ 19,113 $ 26,317
WS 124.06 128.13 -3.2% 105.57 120.54$/day $ 6,895 $ 8,126 -15.1% $ 8,617 $ 25,637
WS 97.25 99.50 -2.3% 93.01 105.77$/day $ 6,144 $ 7,308 -15.9% $ 6,777 $ 9,856
WS 103.06 118.61 -13.1% 100.23 106.37$/day $ 6,547 $ 12,771 -48.7% $ 6,505 $ 9,426
CPPWS 99.69 97.86 1.9% 97.00 106.84
$/day $ 6,455 $ 6,425 0.5% $ 7,402 $ 9,016WS 119.17 145.31 -18.0% 128.87 140.87
$/day $ 2,888 $ 7,014 -58.8% $ 5,142 $ 7,272WS 125.00 125.00 0.0% 125.81 138.78
$/day $ 15,867 $ 16,176 -1.9% $ 16,944 $ 22,286WS 100.00 93.21 7.3% 90.22 105.91
$/day $ 662 -$ 119 656.3% -$ 76 $ 2,859
BALTIC-UKC
ARA-USG
Spot market rates & indices Average
MED-MED
CONT-USAC
USG-CONT
MEG-USG
MEG-SPORE
WAF-USG
BSEA-MED
MEG-SPORE
MEG-JAPAN
WAF-USAC
NSEA-CONT
CARIBS-USG
CARIBS-USAC
SEASIA-AUS
MEG-JAPAN
CARIBS-USAC
250
450
650
850
1,050
1,250
BDTI BCTI
-10
10
30
50'000 US$/day
-10
0
10
20
30
40'000 US$/day
0
10
20
30'000 US$/day
5
10
15
20
25
30'000 US$/day

4
last 5 years
14 Sep 10 Aug ±% Min Avg Max
VLCC
$ 22,500 $ 19,000 18.4% $ 18,000 $ 30,725 $ 57,750
$ 25,750 $ 24,000 7.3% $ 22,000 $ 30,967 $ 45,000
Suezmax
$ 17,000 $ 16,000 6.3% $ 15,250 $ 23,199 $ 42,500
$ 19,500 $ 19,500 0.0% $ 17,000 $ 24,371 $ 35,000
Aframax
$ 14,250 $ 14,250 0.0% $ 13,000 $ 18,406 $ 30,000
$ 17,000 $ 17,000 0.0% $ 14,750 $ 19,018 $ 27,000
MR
$ 12,500 $ 12,500 0.0% $ 12,000 $ 14,815 $ 21,000
$ 14,250 $ 14,250 0.0% $ 14,000 $ 15,146 $ 18,250
12 months
36 months
Tanker period market TC rates
12 months
36 months
12 months
36 months
12 months
36 months
last 5 years
14 Sep 10 Aug ±% Min Avg Max
Capesize
$ 21,250 $ 22,250 -4.5% $ 6,200 $ 15,024 $ 31,450
$ 21,000 $ 20,500 2.4% $ 6,950 $ 15,182 $ 25,200
Panamax
$ 13,750 $ 13,000 5.8% $ 4,950 $ 9,978 $ 15,450
$ 12,750 $ 12,250 4.1% $ 6,200 $ 10,348 $ 15,325
Supramax
$ 13,500 $ 13,250 1.9% $ 4,450 $ 9,635 $ 13,950
$ 12,250 $ 12,000 2.1% $ 6,200 $ 9,677 $ 13,700
Handysize
$ 10,750 $ 10,750 0.0% $ 4,450 $ 7,990 $ 11,200
$ 9,250 $ 9,250 0.0% $ 5,450 $ 8,187 $ 10,450
36 months
12 months
36 months
36 months
12 months
36 months
12 months
12 months
Dry Bulk period market TC rates
10th - 14th September 2018
Latest indicative Dry Bulk Period Fixtures
Latest indicative Tanker Period Fixtures
7
9
11
13
15
17
19
21
23
5
7
9
11
13
15
56789
101112131415
4
5
6
7
8
9
10
11
12
17
19
21
23
25
27
29
15
16
16
17
17
18
18
19
12
13
13
14
14
15
15
16
11
12
13
14
15M/T ''OLYMPIC LADY'', 300000 dwt, built 2017, $29,000, for 1 year
trading, to AISSOT
M/T ''MONTREAL SPIRIT'', 150000 dwt, built 2006, $17,000, for 1+1 year
trading, to PHILLIPS 66
M/T ''CHRYSALIS'', 116000 dwt, built 2010, $13,750, for 1 year trading, to
MAERSK
M/T ''GEORGIA M'', 75000 dwt, built 2007, $13,000, for 1+1 year trading,
to EMIRATES NATIONAL OIL CO.
M/T ''NANCY P'', 50000 dwt, built 2015, $14,500, for 1+1 year trading, to
SHELL
M/V ''KMAX EMPEROR'', 91807 dwt, built 2011, dely PG 15/20 Sep,
$14,000, for 3/5 months, to Victory Shipping
M/V ''DARYA MOTI'', 80545 dwt, built 2010, dely Boryeong 18/19 Sep ,
$13,800, for 2/4 months, to Daiichi
M/V ''ALPHA CONFIDENCE'', 176320 dwt, built 2011, dely Bayuquan
19/21 Sep , $21,250, for about 2 years, to Cofco
M/V ''KAVO PALOMA'', 75698 dwt, built 2007, dely Guangzhou prompt,
$12,850, for 5/8 months trading, to Chart Not Rep
M/V ''BEKS CEYDA'', 63592 dwt, built 2015, dely Fujairah prompt, $14000,
for 3/5 months, to Jaldhi

5
Reported Transactions
Despite the recent signs of clampdown during the summer period,
the past couple of weeks has shown a more aggressive attitude once
again emerging in the market. With the bulker sector taking the lead
and tankers following closely, the overall market has been set on a
bullish mode in terms of activity noted. The rather “surprising” fact is
that we are seeing a fair volume of new contracting coming from the
wet side, given that the prolonged slump in the freight market has
weakened appetite for investing towards this direction. While, at the
same time, the secondhand market is seemingly over spilling with a
bargain hunting attitude, witnessing a fair interest for fresh projects,
is clearly an indication of a positive outlook, as well as the strong
dedication that current offered price levels are highly competitive
right now. Notwithstanding this, given the volatile nature of the
shipping industry as a whole, these competitive prices are not a driv-
er on their own, especially given that things could turn sour relatively
quickly if new ordering overshoots what the market can sustain.
10th - 14th September 2018
10
20
30
40
50
Capesize Panamax Supramax Handysize
US$ million
30405060708090
100VLCC Suezmax Aframax LR1 MR
US$ million
Indicative Dry NB Prices (US$ million) last 5 years
14 Sep 10 Aug ±% Min Avg Max
Dry Bulkers
Capesize (180,000dwt) 49.0 49.0 0.0% 41.8 48.1 58.0
Kamsarmax (82,000dwt) 33.0 33.0 0.0% 24.3 27.4 33.0
Panamax (77,000dwt) 32.0 32.0 0.0% 23.8 26.6 32.0
Ultramax (64,000dwt) 31.0 31.0 0.0% 22.3 25.2 31.0
Handysize (37,000dwt) 26.0 26.0 0.0% 19.5 21.7 26.0
Container
Post Panamax (9,000teu) 82.5 82.5 0.0% 76.5 84.5 91.0
Panamax (5,200teu) 48.5 48.5 0.0% 48.0 52.7 58.5
Sub Panamax (2,500teu) 27.0 27.0 0.0% 26.0 29.4 33.0
Feeder (1,700teu) 21.5 21.5 0.0% 21.5 23.7 27.0
Indicative Wet NB Prices (US$ million) last 5 years
14 Sep 10 Aug ±% Min Avg Max
Tankers
VLCC (300,000dwt) 90.0 90.0 0.0% 80.0 90.4 101.0
Suezmax (160,000dwt) 60.0 60.0 0.0% 53.0 59.4 66.0
Aframax (115,000dwt) 50.0 50.0 0.0% 43.0 49.2 55.0
LR1 (75,000dwt) 47.8 47.5 0.5% 40.5 44.0 47.8
MR (56,000dwt) 36.0 35.5 1.4% 32.5 34.9 37.3
Gas
LNG 160k cbm 184.0 184.0 0.0% 184.0 195.1 200.0
LPG LGC 80k cbm 70.0 70.0 0.0% 70.0 73.7 80.0
LPG MGC 55k cbm 62.0 62.0 0.0% 62.0 64.6 68.5
LPG SGC 25k cbm 40.0 40.0 0.0% 40.0 42.4 45.5
Type Units Shipbuilder Price Buyer Delivery Comments
BULKER 2 240,000 dwt IMABARI SB, Japan N/A MITSUI AND CO, Japan 2020
BULKER 2 82,000 dwt TIANJIN XINGANG, China $ 28.0m CSIC Leasing, China 2020 Tier III
BULKER 1 81,000 dwtTAIZHOU KOUAN
SHIPBUILDING CO, China$ 28.0m UNDISCLOSED, 2020
BULKER 1 38,000 dwt IMABARI SB, Japan $ 24.5m UNDISCLOSED, Turkey 2020 Tier II
TANKER 2 114,000 dwtZVEZDA SHIPBUILDING,
RussiaN/A SOVCOMFLOT, Russia 2020
LNG Powered, Ice Class
1A/1B. Under 20 years
charter to Rosneft
TANKER 2 5,350 dwt ASPO, Russia N/A Caspian Energy, Kazakhstan 2019-2020
CONT 8 + 4 2,800 teu JMU, Japan N/APacific Ship Management,
Turkey2020
CONT 1 1,140 teu JIANGDONG SHIPYARD, China N/A Shanghai Changjiang, China 2020
Size
6
Indicative Dry Bulk Values (US$ million)
14 Sep 10 Aug ±% Min Avg Max
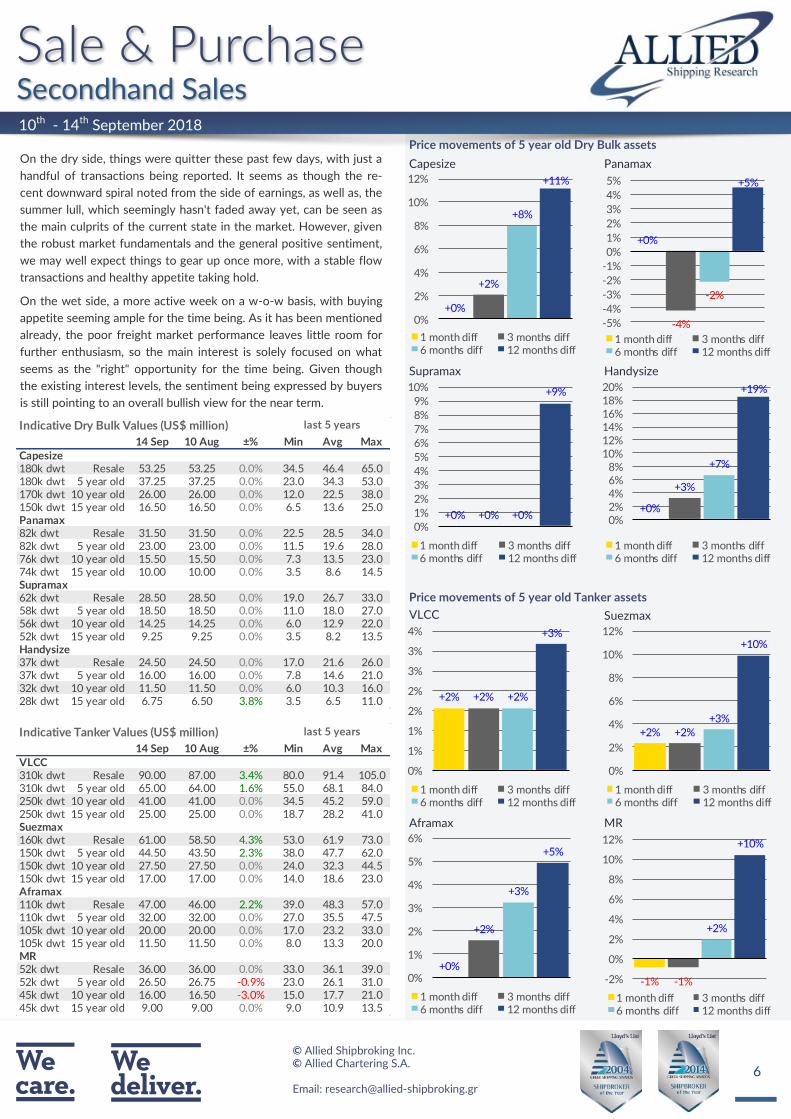
Capesize180k dwt Resale 53.25 53.25 0.0% 34.5 46.4 65.0180k dwt 5 year old 37.25 37.25 0.0% 23.0 34.3 53.0170k dwt 10 year old 26.00 26.00 0.0% 12.0 22.5 38.0150k dwt 15 year old 16.50 16.50 0.0% 6.5 13.6 25.0Panamax82k dwt Resale 31.50 31.50 0.0% 22.5 28.5 34.082k dwt 5 year old 23.00 23.00 0.0% 11.5 19.6 28.076k dwt 10 year old 15.50 15.50 0.0% 7.3 13.5 23.074k dwt 15 year old 10.00 10.00 0.0% 3.5 8.6 14.5Supramax62k dwt Resale 28.50 28.50 0.0% 19.0 26.7 33.058k dwt 5 year old 18.50 18.50 0.0% 11.0 18.0 27.056k dwt 10 year old 14.25 14.25 0.0% 6.0 12.9 22.052k dwt 15 year old 9.25 9.25 0.0% 3.5 8.2 13.5Handysize37k dwt Resale 24.50 24.50 0.0% 17.0 21.6 26.037k dwt 5 year old 16.00 16.00 0.0% 7.8 14.6 21.032k dwt 10 year old 11.50 11.50 0.0% 6.0 10.3 16.028k dwt 15 year old 6.75 6.50 3.8% 3.5 6.5 11.0
last 5 years
10th - 14th September 2018
On the dry side, things were quitter these past few days, with just a
handful of transactions being reported. It seems as though the re-
cent downward spiral noted from the side of earnings, as well as, the
summer lull, which seemingly hasn't faded away yet, can be seen as
the main culprits of the current state in the market. However, given
the robust market fundamentals and the general positive sentiment,
we may well expect things to gear up once more, with a stable flow
transactions and healthy appetite taking hold.
On the wet side, a more active week on a w-o-w basis, with buying
appetite seeming ample for the time being. As it has been mentioned
already, the poor freight market performance leaves little room for
further enthusiasm, so the main interest is solely focused on what
seems as the "right" opportunity for the time being. Given though
the existing interest levels, the sentiment being expressed by buyers
is still pointing to an overall bullish view for the near term.
+0%
+2%
+8%
+11%
0%
2%
4%
6%
8%
10%
12%
1 month diff 3 months diff6 months diff 12 months diff
+0%
-4%
-2%
+5%
-5%
-4%
-3%
-2%
-1%
0%
1%
2%
3%
4%
5%
1 month diff 3 months diff6 months diff 12 months diff
+0% +0% +0%
+9%
0%
1%
2%
3%
4%
5%
6%
7%
8%
9%
10%
1 month diff 3 months diff6 months diff 12 months diff
+0%
+3%
+7%
+19%
0%2%4%6%8%
10%12%14%16%18%20%
1 month diff 3 months diff6 months diff 12 months diff
+2% +2% +2%
+3%
0%
1%
1%
2%
2%
3%
3%
4%
1 month diff 3 months diff6 months diff 12 months diff
+2% +2%
+3%
+10%
0%
2%
4%
6%
8%
10%
12%
1 month diff 3 months diff6 months diff 12 months diff
+0%
+2%
+3%
+5%
0%
1%
2%
3%
4%
5%
6%
1 month diff 3 months diff6 months diff 12 months diff
-1% -1%
+2%
+10%
-2%
0%
2%
4%
6%
8%
10%
12%
1 month diff 3 months diff6 months diff 12 months diff
Indicative Tanker Values (US$ million)
14 Sep 10 Aug ±% Min Avg Max
VLCC310k dwt Resale 90.00 87.00 3.4% 80.0 91.4 105.0310k dwt 5 year old 65.00 64.00 1.6% 55.0 68.1 84.0250k dwt 10 year old 41.00 41.00 0.0% 34.5 45.2 59.0250k dwt 15 year old 25.00 25.00 0.0% 18.7 28.2 41.0Suezmax160k dwt Resale 61.00 58.50 4.3% 53.0 61.9 73.0150k dwt 5 year old 44.50 43.50 2.3% 38.0 47.7 62.0150k dwt 10 year old 27.50 27.50 0.0% 24.0 32.3 44.5150k dwt 15 year old 17.00 17.00 0.0% 14.0 18.6 23.0Aframax110k dwt Resale 47.00 46.00 2.2% 39.0 48.3 57.0110k dwt 5 year old 32.00 32.00 0.0% 27.0 35.5 47.5105k dwt 10 year old 20.00 20.00 0.0% 17.0 23.2 33.0105k dwt 15 year old 11.50 11.50 0.0% 8.0 13.3 20.0MR52k dwt Resale 36.00 36.00 0.0% 33.0 36.1 39.052k dwt 5 year old 26.50 26.75 -0.9% 23.0 26.1 31.045k dwt 10 year old 16.00 16.50 -3.0% 15.0 17.7 21.045k dwt 15 year old 9.00 9.00 0.0% 9.0 10.9 13.5
last 5 years
7
10th - 14th September 2018
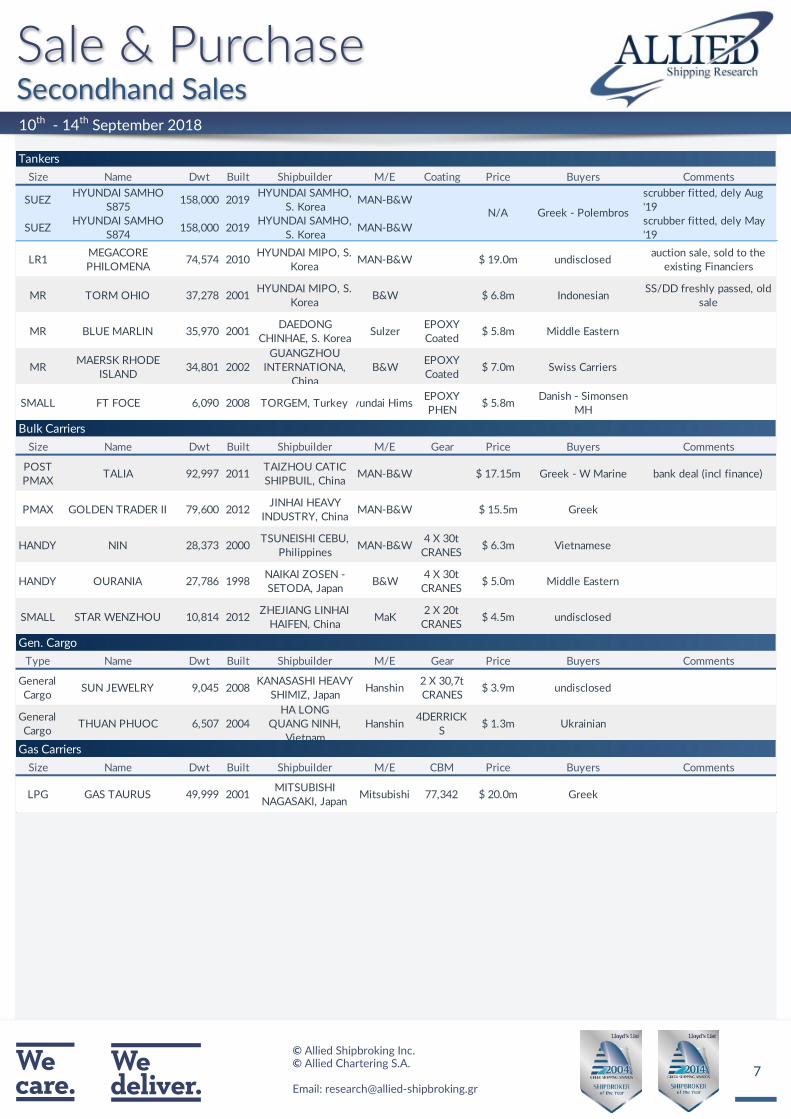
Size Name Dwt Built Shipbuilder M/E Coating Price Buyers Comments
SUEZHYUNDAI SAMHO
S875158,000 2019
HYUNDAI SAMHO,
S. KoreaMAN-B&W
scrubber fitted, dely Aug
'19
SUEZHYUNDAI SAMHO
S874158,000 2019
HYUNDAI SAMHO,
S. KoreaMAN-B&W
scrubber fitted, dely May
'19
LR1MEGACORE
PHILOMENA74,574 2010
HYUNDAI MIPO, S.
KoreaMAN-B&W $ 19.0m undisclosed
auction sale, sold to the
existing Financiers
MR TORM OHIO 37,278 2001 HYUNDAI MIPO, S.
KoreaB&W $ 6.8m Indonesian
SS/DD freshly passed, old
sale
MR BLUE MARLIN 35,970 2001 DAEDONG
CHINHAE, S. KoreaSulzer
EPOXY
Coated$ 5.8m Middle Eastern
MRMAERSK RHODE
ISLAND34,801 2002
GUANGZHOU
INTERNATIONA,
China
B&WEPOXY
Coated$ 7.0m Swiss Carriers
SMALL FT FOCE 6,090 2008 TORGEM, TurkeyHyundai HimsenEPOXY
PHEN$ 5.8m
Danish - Simonsen
MH
Size Name Dwt Built Shipbuilder M/E Gear Price Buyers Comments
POST
PMAXTALIA 92,997 2011
TAIZHOU CATIC
SHIPBUIL, ChinaMAN-B&W $ 17.15m Greek - W Marine bank deal (incl finance)
PMAX GOLDEN TRADER II 79,600 2012 JINHAI HEAVY
INDUSTRY, ChinaMAN-B&W $ 15.5m Greek
HANDY NIN 28,373 2000 TSUNEISHI CEBU,
PhilippinesMAN-B&W
4 X 30t
CRANES$ 6.3m Vietnamese
HANDY OURANIA 27,786 1998 NAIKAI ZOSEN -
SETODA, JapanB&W
4 X 30t
CRANES$ 5.0m Middle Eastern
SMALL STAR WENZHOU 10,814 2012 ZHEJIANG LINHAI
HAIFEN, ChinaMaK
2 X 20t
CRANES$ 4.5m undisclosed
Type Name Dwt Built Shipbuilder M/E Gear Price Buyers Comments
General
CargoSUN JEWELRY 9,045 2008
KANASASHI HEAVY
SHIMIZ, JapanHanshin
2 X 30,7t
CRANES$ 3.9m undisclosed
General
CargoTHUAN PHUOC 6,507 2004
HA LONG
QUANG NINH,
Vietnam
Hanshin4DERRICK
S$ 1.3m Ukrainian
Size Name Dwt Built Shipbuilder M/E CBM Price Buyers Comments
LPG GAS TAURUS 49,999 2001 MITSUBISHI
NAGASAKI, JapanMitsubishi 77,342 $ 20.0m Greek
Tankers
Bulk Carriers
Gen. Cargo
Gas Carriers
Greek - PolembrosN/A
8
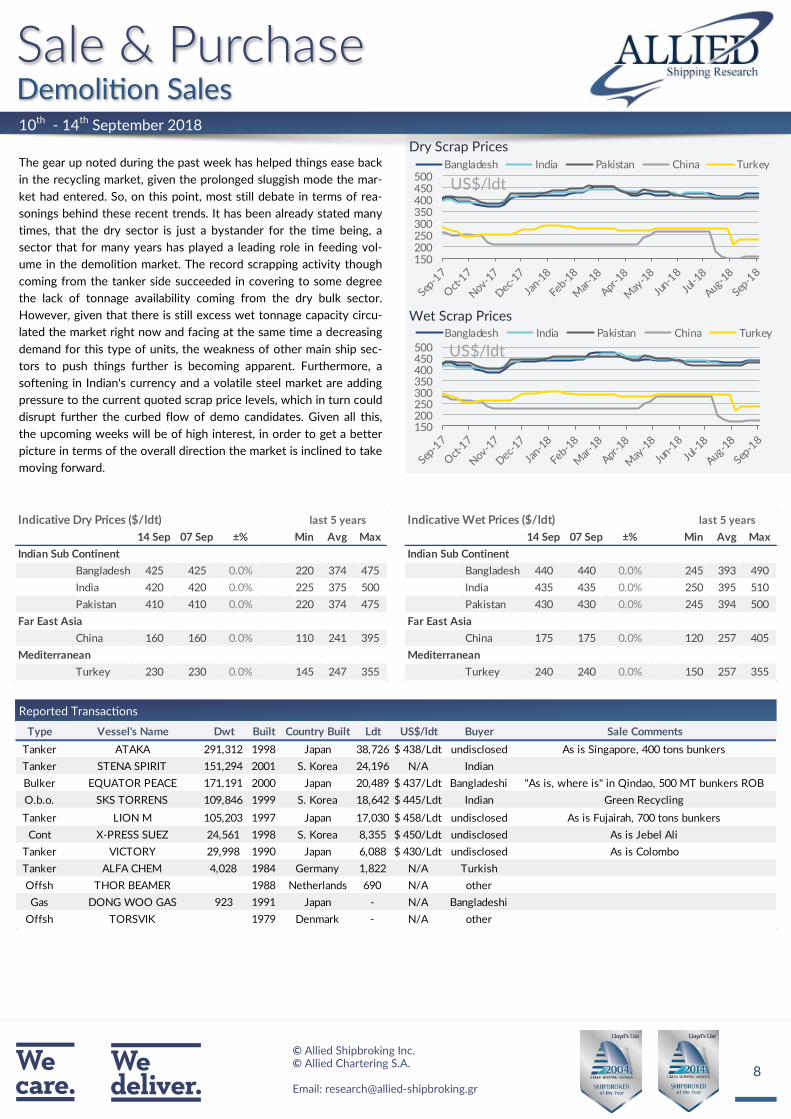
The gear up noted during the past week has helped things ease back
in the recycling market, given the prolonged sluggish mode the mar-
ket had entered. So, on this point, most still debate in terms of rea-
sonings behind these recent trends. It has been already stated many
times, that the dry sector is just a bystander for the time being, a
sector that for many years has played a leading role in feeding vol-
ume in the demolition market. The record scrapping activity though
coming from the tanker side succeeded in covering to some degree
the lack of tonnage availability coming from the dry bulk sector.
However, given that there is still excess wet tonnage capacity circu-
lated the market right now and facing at the same time a decreasing
demand for this type of units, the weakness of other main ship sec-
tors to push things further is becoming apparent. Furthermore, a
softening in Indian's currency and a volatile steel market are adding
pressure to the current quoted scrap price levels, which in turn could
disrupt further the curbed flow of demo candidates. Given all this,
the upcoming weeks will be of high interest, in order to get a better
picture in terms of the overall direction the market is inclined to take
moving forward.
10th - 14th September 2018
Reported Transactions
150200250300350400450500
Bangladesh India Pakistan China Turkey
US$/ldt
150200250300350400450500
Bangladesh India Pakistan China Turkey
US$/ldt
Indicative Wet Prices ($/ldt) last 5 years
14 Sep 07 Sep ±% Min Avg Max
Indian Sub Continent
Bangladesh 440 440 0.0% 245 393 490
India 435 435 0.0% 250 395 510
Pakistan 430 430 0.0% 245 394 500
Far East Asia
China 175 175 0.0% 120 257 405
Mediterranean
Turkey 240 240 0.0% 150 257 355
Indicative Dry Prices ($/ldt) last 5 years
14 Sep 07 Sep ±% Min Avg Max
Indian Sub Continent
Bangladesh 425 425 0.0% 220 374 475
India 420 420 0.0% 225 375 500
Pakistan 410 410 0.0% 220 374 475
Far East Asia
China 160 160 0.0% 110 241 395
Mediterranean
Turkey 230 230 0.0% 145 247 355
Type Vessel's Name Dwt Built Country Built Ldt US$/ldt Buyer Sale Comments
Tanker ATAKA 291,312 1998 Japan 38,726 $ 438/Ldt undisclosed As is Singapore, 400 tons bunkers
Tanker STENA SPIRIT 151,294 2001 S. Korea 24,196 N/A Indian
Bulker EQUATOR PEACE 171,191 2000 Japan 20,489 $ 437/Ldt Bangladeshi "As is, where is" in Qindao, 500 MT bunkers ROB
O.b.o. SKS TORRENS 109,846 1999 S. Korea 18,642 $ 445/Ldt Indian Green Recycling
Tanker LION M 105,203 1997 Japan 17,030 $ 458/Ldt undisclosed As is Fujairah, 700 tons bunkers
Cont X-PRESS SUEZ 24,561 1998 S. Korea 8,355 $ 450/Ldt undisclosed As is Jebel Ali
Tanker VICTORY 29,998 1990 Japan 6,088 $ 430/Ldt undisclosed As is Colombo
Tanker ALFA CHEM 4,028 1984 Germany 1,822 N/A Turkish
Offsh THOR BEAMER 1988 Netherlands 690 N/A other
Gas DONG WOO GAS 923 1991 Japan - N/A Bangladeshi
Offsh TORSVIK 1979 Denmark - N/A other
9
25
35
45
55
65
75
85
10th - 14th September 2018
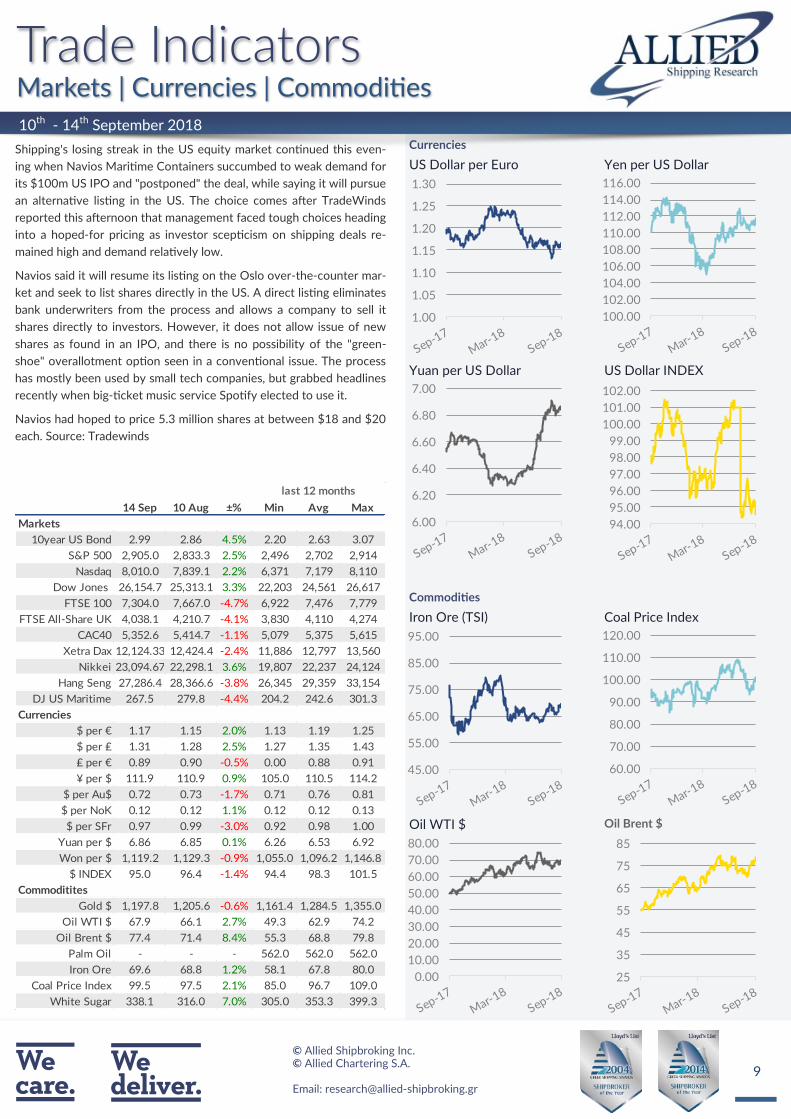
US Dollar per Euro Yen per US Dollar
Iron Ore (TSI) Coal Price Index
Yuan per US Dollar US Dollar INDEX
Oil WTI $ Oil Brent $
Shipping's losing streak in the US equity market continued this even-
ing when Navios Maritime Containers succumbed to weak demand for
its $100m US IPO and "postponed" the deal, while saying it will pursue
an alternative listing in the US. The choice comes after TradeWinds
reported this afternoon that management faced tough choices heading
into a hoped-for pricing as investor scepticism on shipping deals re-
mained high and demand relatively low.
Navios said it will resume its listing on the Oslo over-the-counter mar-
ket and seek to list shares directly in the US. A direct listing eliminates
bank underwriters from the process and allows a company to sell it
shares directly to investors. However, it does not allow issue of new
shares as found in an IPO, and there is no possibility of the "green-
shoe" overallotment option seen in a conventional issue. The process
has mostly been used by small tech companies, but grabbed headlines
recently when big-ticket music service Spotify elected to use it.
Navios had hoped to price 5.3 million shares at between $18 and $20
each. Source: Tradewinds
1.00
1.05
1.10
1.15
1.20
1.25
1.30
100.00
102.00
104.00
106.00
108.00
110.00
112.00
114.00
116.00
6.00
6.20
6.40
6.60
6.80
7.00
94.00
95.00
96.00
97.00
98.00
99.00
100.00
101.00
102.00
45.00
55.00
65.00
75.00
85.00
95.00
60.00
70.00
80.00
90.00
100.00
110.00
120.00
0.00
10.00
20.00
30.00
40.00
50.00
60.00
70.00
80.00
14 Sep 10 Aug ±% Min Avg Max
Markets
10year US Bond 2.99 2.86 4.5% 2.20 2.63 3.07
S&P 500 2,905.0 2,833.3 2.5% 2,496 2,702 2,914
Nasdaq 8,010.0 7,839.1 2.2% 6,371 7,179 8,110
Dow Jones 26,154.7 25,313.1 3.3% 22,203 24,561 26,617
FTSE 100 7,304.0 7,667.0 -4.7% 6,922 7,476 7,779
FTSE All-Share UK 4,038.1 4,210.7 -4.1% 3,830 4,110 4,274
CAC40 5,352.6 5,414.7 -1.1% 5,079 5,375 5,615
Xetra Dax 12,124.33 12,424.4 -2.4% 11,886 12,797 13,560
Nikkei 23,094.67 22,298.1 3.6% 19,807 22,237 24,124
Hang Seng 27,286.4 28,366.6 -3.8% 26,345 29,359 33,154
DJ US Maritime 267.5 279.8 -4.4% 204.2 242.6 301.3
Currencies
$ per € 1.17 1.15 2.0% 1.13 1.19 1.25
$ per ₤ 1.31 1.28 2.5% 1.27 1.35 1.43
₤ per € 0.89 0.90 -0.5% 0.00 0.88 0.91
¥ per $ 111.9 110.9 0.9% 105.0 110.5 114.2
$ per Au$ 0.72 0.73 -1.7% 0.71 0.76 0.81
$ per NoK 0.12 0.12 1.1% 0.12 0.12 0.13
$ per SFr 0.97 0.99 -3.0% 0.92 0.98 1.00
Yuan per $ 6.86 6.85 0.1% 6.26 6.53 6.92
Won per $ 1,119.2 1,129.3 -0.9% 1,055.0 1,096.2 1,146.8
$ INDEX 95.0 96.4 -1.4% 94.4 98.3 101.5
Commoditites
Gold $ 1,197.8 1,205.6 -0.6% 1,161.4 1,284.5 1,355.0
Oil WTI $ 67.9 66.1 2.7% 49.3 62.9 74.2
Oil Brent $ 77.4 71.4 8.4% 55.3 68.8 79.8
Palm Oil - - - 562.0 562.0 562.0
Iron Ore 69.6 68.8 1.2% 58.1 67.8 80.0
Coal Price Index 99.5 97.5 2.1% 85.0 96.7 109.0
White Sugar 338.1 316.0 7.0% 305.0 353.3 399.3
last 12 months

10
AERAKIS GEORGEMOBILE: +30 6946 04 57 37
BOLIS ILIASMOBILE: +30 6937 02 65 00
DASKALAKIS GEORGEMOBILE: +30 6932 24 80 07
DRAKOGIANNOPOULOS STAVROSMOBILE: +30 6932 20 15 65
DRAKOGIANNOPOULOS SAKISMOBILE: +30 6944 88 58 08
FRANGOS HARRISMOBILE: +30 6936 57 67 00
HADJINASSIOS CHRISTOSMOBILE: +30 6972 14 17 80
KLONIZAKIS JOHNMOBILE: +30 6948 50 55 81
KOSTOYANNIS JOHNMOBILE: +30 6932 43 39 99
MANOLAS NIKOLASMOBILE: +30 6940 63 22 56
MOISSOGLOU THEODOROSMOBILE: +30 6932 45 52 41
PAPAIOANNOU ANTONISMOBILE: +30 6936 54 80 22
PAPOUIS THASSOSMOBILE: +30 6944 29 49 89
PRACHALIAS ARGIRISMOBILE: +30 6947 62 82 62
SKOURTIS GEORGEMOBILE: +30 6936 93 62 12
STASSINAKIS JOHNMOBILE: +30 6972 60 92 09
TSALPATOUROS COSTISMOBILE: +30 6932 20 15 63
VARVAROS PLUTONMOBILE: +30 6937 25 15 15
Maritime Research & ValuationsCHASAPIS THOMAS
MOBILE: +30 6947 82 91 72LAZARIDIS GEORGE
MOBILE: +30 6946 95 69 40VAMVAKAS YIANNIS
MOBILE: +30 6942 94 71 87
Sale & Purchase
ALLIED SHIPBROKING INC. 48, Aigialeias Street, 4th Floor, Maroussi 151 25, Greece Tel: +30 210 45 24 500 Fax: +30 210 45 25 017/ 019 E-mail: [email protected]
ALLIED CHARTERING S.A. 48, Aigialeias Street, 4th Floor, Maroussi 151 25, Greece Tel : +30 210 42 88 100 Fax: +30 210 45 24 201
E-mail: [email protected]
E-mail: [email protected]
10th - 14th September 2018 | Week 37
ALEXOPOULOS PANOS MOBILE: +30 6944 34 66 15
ARGYRI MARINAMOBILE: +30 6983 11 32 98
DAOULAS SPYROS MOBILE: +30 6932 27 88 40
FLOURIS DIMITRISMOBILE: +30 6937 81 32 39
KAILAS VAGGELISMOBILE: +30 6942 48 05 69
KANELLOS DIMITRIS MOBILE: +30 6945 07 47 85
KAPPA ANGELIKI MOBILE: +30 6975 85 60 84
KARAMANIS COSTASMOBILE: +30 6941 54 14 65
PATELIS DIMITRIS MOBILE: +30 6944 04 43 61
THEODOTOS ARISTOFANIS MOBILE: +30 6951 79 82 89
TSALPATOUROU ANASTASIAMOBILE: +30 6951 79 82 91
TSALPATOUROU MARGARITA MOBILE: +30 6934 74 22 16
Tanker CharteringFLOURIS JOHN
MOBILE: +30 6955 80 15 03 FOUROULI STELLA
MOBILE: +30 6947 35 68 48PAPANTONOPOULOS NICOLAS
MOBILE: +30 6945 23 21 88TSEPIS KONSTANTINOS
MOBILE: +30 6951 79 82 91
Dry Cargo Chartering

11
Disclaimer
The information contained within this report has been provided by Allied Shipbroking Inc. and Allied Chartering S.A. for general information
purposes.
All the information is compiled through Allied Shipbroking Inc. and Allied Chartering S.A. databases, as well as from other market sources. De-
spite having taken reasonable care in the gathering, filtering and auditing of this information and believing that the information is accurate and
correct, it may still contain errors, as a lot of the views regarding market levels are partially derived from estimates and/or subject judgments
while the reported transaction activity is gathered from several sources and rumors, some of which are sometimes hard to validate in full their
accuracy and truthfulness. As such we advise that the information be taken cautiously, while advising that this information does not obviate the
need to also make further enquiries and seek further information in order to obtain a more accurate outlook. As we make no warranties of any
kind, both expressed or implied, as to the completeness, accuracy, reliability or completeness of the information herein, Allied Shipbroking Inc.
and its connected persons shall not be held liable to any loss or damage of any kind, including direct, indirect and/or consequential damages
caused by negligence of any kind on our part.
Any choice to rely on this information provided is strictly at the recipient’s own risk.
This report and its information is confidential and solely for the internal use of its recipients, while any re-production or re-distribution of the
report and its material is strictly prohibited without prior permission from Allied Shipbroking Inc.
If you wish to subscribe to this or any other report we produce, please contact us directly.
Appendix
Aggregate Price Index quoted on the first page for both Newbuilding and Secondhand relates to the current average prices levels compared to
where they stood at 1st January 2010 (i.e. index 100 = 01/01/2010)
Demolition market average price index refers to the combination of the average prices currently offered in the Indian Sub-Continent, Far East
and Mediterranean.
Period rates currently relate to Capesize of 180,000dwt, Panamax of 76,000dwt, Supramax of 56,000dwt and Handysize of 33,000dwt on the
Dry Bulk side and VLCC of 250,000dwt, Suezmax of 150,000dwt, Aframax of 115,000dwt and MR of 52,000dwt on the Tankers side respec-
tively.
In terms of Secondhand Asset Prices their levels are quoted based on following description:
All vessels built to European specifications by top Japanese shipbuilders, with dwt size based on the below table.
10th - 14th September 2018 | Week 37
Resale 5 year old 10 year old 15 year old
Capesize 180,000dwt 180,000dwt 170,000dwt 150,000dwt
Panamax 82,000dwt 82,000dwt 76,000dwt 74,000dwt
Supramax 62,000dwt 58,000dwt 56,000dwt 52,000dwt
Handysize 37,000dwt 32,000dwt 32,000dwt 28,000dwt
VLCC 310,000dwt 310,000dwt 250,000dwt 250,000dwt
Suezmax 160,000dwt 150,000dwt 150,000dwt 150,000dwt
Aframax 110,000dwt 110,000dwt 105,000dwt 95,000dwt
MR 52,000dwt 45,000dwt 45,000dwt 45,000dwt


![2018] MAGIC WEEK- 08](https://static.fdocuments.us/doc/165x107/626e753a5ff994249c7270b6/2018-magic-week-08.jpg)


