September 2017 - Servelec Group · September 2017. Servelec Group Overview Servelec HSC Comprising:...
20
H1 17 Results Presentation Alan Stubbs, Chief Executive Officer Mike Cane, Chief Financial Officer September 2017
Transcript of September 2017 - Servelec Group · September 2017. Servelec Group Overview Servelec HSC Comprising:...

H1 17 Results PresentationAlan Stubbs, Chief Executive Officer
Mike Cane, Chief Financial Officer
September 2017

Servelec Group Overview
Servelec HSC
Comprising:
Healthcare, Synergy, Corelogic, Abacus
Software Systems, Support & Hosting
• Mental, Community & Child Health
• Acute Healthcare
• Social Care
• Children’s Services
• Finance
306 employees
Servelec Automation
Hardware, Software & Control Systems
Servelec Controls:
• Oil & Gas
• Power & Infrastructure
Servelec Technologies:
• Utilities
• Broadcast
• Rail
257 employees
Servelec Group
56 employees
619 total employeesat H1 17
Servelec is a UK-headquartered technology Group,with significant intellectual property, providingsoftware, hardware and services to the healthcare,social care and education, oil and gas, energy andutilities sectors.
1
% of Group Revenue % of Group Profit
Servelec HSC 56% 59%
Servelec Controls 18% 11%
Servelec Technologies 26% 30%

Servelec Group at H1 17
Return to growth - Underlying operating profit up 44%
Cash conversion returns to normal levels
Servelec HSC main driver for return to growth due to strong performance in Healthcare and Children’s Services
Servelec Automation delivering strong result in Servelec Controls Oil & Gas but market challenges persist for Servelec Technologies
Reduction in anticipated growth for the full year
2

30,006
28,377
31,513
H1 2015
H1 2016
H1 2017
Revenue (£'000)
6,261
4,506
6,504
H1 2015
H1 2016
H1 2017
Underlying Operating Profit* ** (£'000)
44,095
37,437
34,746
H1 2015
H1 2016
H1 2017
Order Entry (£'000)
76,551
73,184
77,404
H1 2015
H1 2016
H1 2017
Order Bank (£'000)
168%
39%
96%
H1 2015
H1 2016
H1 2017
Cash Conversion
Results Summary
• Return to growth
• Group revenue up 11%
• Organic revenue up 2%
• Organic operating profit growth of 20%
• Adjusted EPS up 45%
• Cash conversion at 96%
• Order bank increased £4.2m
• Increased interim dividend 2.00p (H1 2016: 1.65p)
96%
£31.5m
*Underlying operating profit excludes share basedpayments, non-recurring items and amortisation fromacquired intangibles
3
£34.7m
£6.5m
£77.4m

Servelec HSC
Performance and Market Opportunities

Servelec HSC
• Healthcare and Synergy performing well but Corelogic flat
• Profit growth a combination of acquisitions and the business improvements made in 2016
• Slight increase in recurring revenue at 66% compared to 64% in FY16
• Invested in sales team and account management
• Closed our Indian development centre in Q3
• Positive on converting opportunities particularly mobile apps and portals
£'000s H1 2017 H1 2016 % Change
Segment Revenue 17,503 14,951 17%
Cost of Sales (8,999) (8,490) 6%
Adjusted Gross Profit 8,504 6,461 32%
Gross Margin % 49% 43%
Overheads (2,496) (2,290) 9%
Underlying Operating Profit 6,008 4,171 43%
Net margin % 34% 29%
4
14%

5 Servelec HSC: H1 17 Update Across our Markets
Non-Acute Acute Social Care Education
NHS Local Government
• University Hospitals Birmingham live with Oceano – Reference site
• Royal Cornwall Hospitals in delivery phase – to go live in early 2018
• Encouraging bidding activity
• Delivering steady performance
• Market opportunities growing
• Focusing on account management of installed base
• Investing in portal and mobile product extensions
• Active market
• Sales behind expectations
• Revitalising go-to-market strategy
• Action taken to strengthen team
• Account management of installed base
• Portal product extensions
• Synergy continues to perform well
• Contributor to growth
• Continues to outperform competitors (CACI & Capita)
• Market testing every five years
• High win rate
Oceano: £500m Flow: £70m PICS £50m
£50m
Cumulative value of potential new contracts coming to market in next five years:
Increasing links between our products as markets converge
£100m £50m

Servelec HSC: Mobile Apps6Product Enhancements through Mobile Apps
• Signed two deals to secure best of breed mobile product extensions
• Role-based apps to deliver product enhancements in line with customer demand and market trends towards staff mobilisation
• First app = RiO District Nursing app
• Clinical testing complete to ensure robust product
• Competitive landscape
• Total Mobile, EMIS, ACS
• Currently in Healthcare, moving into Social Care & Technologies
Market Opportunity
• ‘Every nurse an e-nurse’ – endorsement of apps from NHS Digital
• Anticipated market share increase YoY over next three years
• Swift rate of adoption anticipated
Business Model
• Minimal cost of development
• Pay per User per Month recurring revenue model
• Revenue share with third party developers
• High margins
Outlook / Next Steps
• Launch date – available now

Servelec HSC: Portals for channel shift in Social Care Care
7
Market Opportunity
• Finestra already in Social Care market place
• Upgrading existing customers and account management sell to Mosaic installed base
Citizens & Professionals Portal
• Empowering the customer’s clients
Market place
• Citizens purchase care services online
Reverse auction
• Providers bid for services required
Extranet
• Providers manage invoicing online
Saving customers money, improving their efficiencies, empowering end users
End to end solution of portal technology
Business Model
• Nil cost uplift for new product development
• Finestra development by third party, CHIPS & Extranet in-house IP
• Recurring licence revenue model
Outlook / Next Steps
• Launch date – available now

Servelec Automation
Performance and Market Opportunities

Servelec Controls
• Oil & Gas segment delivering stronger than anticipated performance
• Power & Infrastructure under pressure due to hiatus in nuclear market
• Consolidated business under one Managing Director
• Common engineering team across specialist routes to market
• Turkey CHP Plant– decision to be taken at year-end
£'000s H1 2017 H1 2016 % Change
Segment Revenue 5,721 5,397 6%
Cost of Sales (4,081) (3,988) 2%
Adjusted Gross Profit 1,640 1,409 16%
Gross Margin % 29% 26%
Overheads (1,095) (1,002) 9%
Underlying Operating Profit 545 407 34%
Net margin % 10% 8%
8Many points now covered on next slide so need to refine
H1 17 Performance
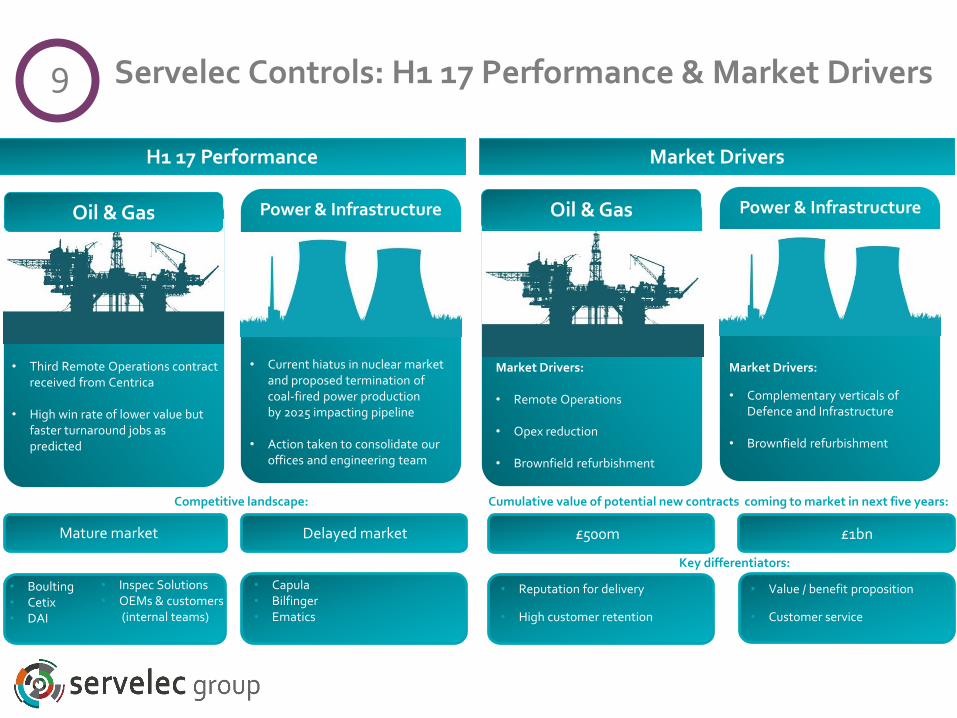
Oil & Gas
Market Drivers
Servelec Controls: H1 17 Performance & Market Drivers
Mature market Delayed market
• Capula• Bilfinger• Ematics
£500m £1bn
• Boulting• Cetix• DAI
Cumulative value of potential new contracts coming to market in next five years:
Key differentiators:
• Reputation for delivery
• High customer retention
• Value / benefit proposition
• Customer service
Competitive landscape:
• Inspec Solutions• OEMs & customers
(internal teams)
9
• Third Remote Operations contract received from Centrica
• High win rate of lower value but faster turnaround jobs as predicted
• Current hiatus in nuclear market and proposed termination of coal-fired power production by 2025 impacting pipeline
• Action taken to consolidate our offices and engineering team
Power & Infrastructure Oil & Gas
Market Drivers:
• Remote Operations
• Opex reduction
• Brownfield refurbishment
Market Drivers:
• Complementary verticals of Defence and Infrastructure
• Brownfield refurbishment
Power & Infrastructure

Servelec Technologies
• Revenue broadly flat with small increase in profit
• Strong margins maintained
• Reduced order entry due to deferment of AMP6 orders for SCADA / Telemetry projects and RTUs
• Overhead increase predominantly due to currency changes post EU Referendum result
£'000s H1 2017 H1 2016 % Change
Segment Revenue 8,289 8,029 3%
Cost of Sales (3,914) (4,172) (6)%
Adjusted Gross Profit 4,375 3,857 13%
Gross Margin % 53% 48%
Overheads (3,023) (2,586) 17%
Underlying Operating Profit 1,352 1,271 6%
Net margin % 16% 16%
10
£10.9m

The only UK-based end-to-end data acquisition,control and optimisation product suite
Software
Servelec Technologies: H1 17 Performance & Market Opportunities
Key differentiator:
• Uptick in growth
• UK water companies are investing in opex reduction and control and monitoring
• Expanding customer base
• Entry into new markets(UK & Global)
11
H1 17 Performance Market Opportunity
£5bn*
UK RTU sales in AMP6 are still behind expectations
• Awarded Severn Trent Water Framework
Global RTU sales steady
• Changing underperforming partners, improving our approach.
• Sales gaining traction in focus regions
RTUs Software
SCADA / Telemetry:• Reduction in large projects in
remainder of 2017• Focusing on account
management
Business Optimisation:• Expanding customer base• UK water companies investing
and continued success through global supply chain
UK:• Disruption from ‘Open Water’
continuing for longer than anticipated
• Weak Sterling affecting water company budgets due to rising water treatment costs
• Orders expected to start to build from 2018
Global:• Focusing on optimising channel
partner network in China, Middle East and USA.
RTUs
Cumulative value of potential new contracts coming to market in next five years*:
UK:£34m (RTUs)
£30m(loggers)
Global:£5bn
Optimisation£70m (UK)
Creating the market globally
SCOPE:£80m (UK)
£1bn (Global)
* Based on Management review of available market

Group Financial Slides, Strategy & Outlook

Income Statement
H1 2017 H1 2016H1 2016
Adjusted*
£'000 £'000 £’000
Group Revenue 31,513 28,377
Gross Profit 14,519 11,727
46% 41%
Underlying Operating Profit 6,504 4,505 4,755
21% 16% 17%
Non-recurring items - (943) Share based payments (285) (346)
EBITA 6,219 3,216
Amortisation (1,778) (1,388)
Operating Profit from Continuing Operations 4,441 1,828
Net Finance (Expense)/Income (158) (97)
Profit Before Tax 4,284 1,731
Tax (825) (346)
19% 20%
Profit After Tax from continuing operations 3,459 1,385
Diluted EPS 4.8p 1.9p
Adjusted EPS 7.1p 4.9p
• Return to growth in revenue, profit and gross margins in H1
• Underlying operating profit growth is 37% (organic: 12%) compared to adjusted 2016*
• Amortisation has increased following acquisitions in 2016
• Net finance expense includes debt used to fund the acquisition of Synergy in April 2016
* Includes an allocation of the full year Research and Development Credit (RDEC) which related to the full year but was booked in H2 2016
12

Group Cash Flow
H1 2017 H1 2016£'000 £'000
EBITDA (inc. non recurring items) 7,159 4,140 Working Capital Movements (297) (2,562) Movement in provisions 7 6Operating Cash Flow 6,869 1,584 Cash conversion 96% 38%Net Interest paid (93) (79)Tax Paid (919) (752)
Net Operating Cash Flow 5,857 753 Capex (inc Intangibles) (355) (873)Acquisition of Subsidiaries - (20,879)
5,502 (21,000)
Movement in Loans - 15,113
Dividends Paid (2,790) (2,429)Other 848 574
Net Cash Movement (3,560) (7,742) Opening Cash 5,555 9,896Closing Cash 9,115 2,154
13
H1 2017 H1 2016
£'000 £'000
Fixed Assets & Intangibles 70,955 74,678
Inventories 1,743 1,682
Receivables 31,528 27,247
Cash 9,115 2,154
42,386 31,083
Payables (23,061) (22,385)
Short term loans (15,113) (15,113)
Corporation Tax (443) -
Provisions (208) (195)
Deferred Tax (2,963) (3,831)
(41,788) (41,524)
Net Assets 71,553 64,237
Group Balance Sheet
• Cash conversion back to expected levels at 96%
• Synergy cash collections are H1 weighted so still targeting 80% cash conversion for the full year
• Loan relates to acquisition of Synergy in H1 2016
• Strong balance sheet
• No R&D capitalised YTD
• Reduction in net debt to £6.0m from £9.6m at FY 2016

Drive organic growth
Continue to enhance our product capability
Develop our distribution channels to market
Acquire where beneficial to the business
Group Strategy and Performance in 2017
• Continued focus on customer satisfaction• Improving sales and broadening customer base and markets• Streamlining operations and reallocating resources
• Developing a truly mobile offering• Enhancement of portal technology to capitalise on channel shift• Continued enhancement of business optimisation products
• Broaden the product set being actively sold through distribution channels• Build new relationships with proactive channel partners
• Continue to pursue bolt-on acquisitions that enhance solutions capability to focus on businesses with strong intellectual property and recurring revenues
14

Outlook
• Servelec Group is in a robust financial position with a strong balance sheet.
• Cash generation on track to return to normalised level with net debt balance expected to reduce further by the year-end.
• Servelec HSC is underpinned by steady revenue streams from Healthcare and Education. Improving pipeline in Corelogic but remains Q4 weighted due to timing of licenses.
• Within Servelec Automation, we see a building pipeline of opportunities for Controls, particularly within Oil & Gas, but customer deferments in other areas will temporarily slow growth prospects.
• The Board remains positive about the longer term prospects for the Group.
15