
September 2015 May 2015 2017 - The Money Managers Motilal Oswal PMS ? Motilal Oswal Group possess...
31
May 2015 September 2015 May 2017
Transcript of September 2015 May 2015 2017 - The Money Managers Motilal Oswal PMS ? Motilal Oswal Group possess...

May 2015 September 2015 May 2017
Strategy Details
Contents
The India Opportunity
Why Motilal Oswal PMS ?

CPI inflation has dropped below 6%
Falling Interest rates
Increasing Financial inclusion
Government fiscal and current account deficits
under control
Sharp fall in Commodity prices
Expected revamping of the tax system with
introduction of GST
Strong reform action including passage of Coal, Mines and Insurance bills, improving ease of doing business, labor market reforms and greater co-operation between state and central governments
India : Fast growing emerging economy
5.1
6.9 7.4
2012-13 2013-14 2014-15
GDP at market prices (in % growth)
Source: Economic Survey 2014-15

Discretionary spend will rise from 52% in 2005 to 70% in 2025
Rising discretionary spending
Source: Motilal Oswal Securities Ltd (Data as on 31/03/2015)

• Automobiles & auto components, • Pharmaceutical, • Textiles, • Gems & Jewellery, • Defence • IT hardware and • Solar power
Dedicated Freight corridors have been envisaged as "Global Manufacturing and Trading Hubs“ with creation of new Industrial Cities Labour reforms carried out by states like Rajasthan are expected to be adapted by several states which will pave the way for rapid growth in labour intensive manufacturing sector. Focus on manufacturing sector would help in creating employment besides helping curb the current account deficit.
Make in India
India can become a global manufacturing hub in sectors like:

Planning commission (NITI Aayog) pegged infra
investment requirement at one trillion dollar over
twelfth five year plan
The government announced plans for $137 billion
capex in rail network over the next five years
Target of 30kms of roads construction every day by
FY17
Development of inland waterways
Speedy environmental and forest clearances
Debottlenecking of several large projects which got
stalled in last few years.
Concerted push to complete large infra projects like
Dedicated Freight corridor.
Public Sector Contribution
Private Sector Contribution
INR 33,700 billion
INR 31,300 billion
Trillion Dollar infrastructure Requirement
INR 65,000 billion (2012-2017)
Budgetary support INR 16,143 billion
Internal Generation INR 6,869 billion
Borrowing INR 10,693 billion
Internal Generation INR 9,630 billion
Borrowing INR 21,670 billion
One trillion $ infra opportunity
Source: Economic Survey 2014-15

Markets return as much as growth in earnings
Sensex YoY Sensex
EPS YoY Sensex YoY Sensex
EPS YoY
Mar-95 3261 181 Mar-07 13072 16% 720 33%
Mar-96 3367 3% 250 38% Mar-08 15644 20% 833 16%
Mar-97 3361 0% 266 6% Mar-09 9709 -38% 820 -2%
Mar-98 3893 16% 291 9% Mar-10 17528 81% 834 2%
Mar-99 3740 -4% 278 -4% Mar-11 19445 11% 1024 23%
Mar-00 5001 34% 280 1% Mar-12 17404 -10% 1120 9%
Mar-01 3604 -28% 216 -23% Mar-13 18836 8% 1180 5%
Mar-02 3469 -4% 236 9% Mar-14 22386 19% 1329 13%
Mar-03 3049 -12% 272 15% Mar-15 27957 25% 1354 2%
Mar-04 5591 83% 361 33% Mar 16 25341 -9% 1330 -2%
Mar-05 6493 16% 446 24% StdDev 32% 14%
Mar-06 11280 74% 540 21% CAGR 10% 10%
Source: Motilal Oswal Securities, MOAMC Internal Analysis | Data as on 31st March 2016
22-years CAGR of Sensex at 10% is exactly the same as 22-years Sensex EPS CAGR!
Past performance may or may not be sustained in future and should not be used as a basis for comparison with other investments.

Food for thought
This volatility in share prices results in emotional response of greed in rising markets and fear in falling markets. Mostly these responses are way more exaggerated on upside as well as downside.
Over long periods of time equities do deliver in line with corporate earnings; but it’s a known fact that the volatility in share prices is way higher than volatility of earnings themselves.
When evaluated in hindsight after the data plays out; one usually rues that responses were disproportionate to changes in corporate earnings.

Why Motilal Oswal PMS ?
Motilal Oswal Group possess legacy in equities for over 3 decade.
Motilal Oswal AMC is chaired by Mr. Raamdeo Agrawal, one of the most honored and trusted name in the investing world.
One of the pioneers of PMS business with over 14 years of PMS track record.
Trusted by over 24,000 HNI investors and with over Rs. 10,940 Crs of AUM as on 30th April 2017.
Presence across the length and breadth of India and also overseas.
Basic Traits of our Investing Style
We invest in companies with operating leverage than financial leverage. We do not believe in “timing the market”, rather we believe in “spending time
in market”. We do not over diversify. The businesses we invest, must have growth potential with economic moat. We practise long-term Buy and Hold investing style.

Our investment philosophy – ‘Buy Right : Sit Tight’
At Motilal Oswal Asset Management Company (MOAMC), our investment philosophy is centered on 'Buy Right: Sit Tight‘ principle.
Buy Right Sit Tight
‘Q’uality denotes quality of the business and management
‘G’rowth denotes growth in earnings and sustained RoE
‘L’ongevity denotes longevity of the competitive advantage or economic moat of the business
‘P’rice denotes our approach of buying a good business for a fair price rather than buying a fair business for a good price
Buy and Hold: We are strictly buy and hold investors and believe that picking the right business needs skill and holding onto these businesses to enable our investors to benefit from the entire growth cycle needs even more skill.
Focus: Our portfolios are high conviction portfolios with 20 to 25 stocks being our ideal number. We believe in adequate diversification but over-diversification results in diluting returns for our investors and adding market risk
QGLP

Why ‘Buy Right : Sit Tight’ is significant?
Long term multiplication of wealth is obtained only by holding on to the winners and deserting the losers.
Real wealth is created by riding out bulk of the growth curve of quality companies and not by trading in and out in response to buy, sell and hold recommendations.
This philosophy enables investor and manager alike to keep focus on the businesses they are holding rather than get distracted by movements in share prices.
An approach of buying high quality stocks and holding them for a long term wealth creation motive, results in drastic reduction of costs for the end investor.
While BUY RIGHT is largely the role of the portfolio manager, SIT TIGHT calls for involvement from the portfolio manager as well as investor. This brings in greater accountability from the manager and at the same time calls for better involvement and understanding from investor resulting in better education for the latter.

Inve
stm
ent
Val
ue
Please Note: The Above strategy returns are of a Model Client as on 30th Apr 2017. Returns of individual clients may differ depending on time of entry in the strategy. Past performance may or may not be sustained in future and should not be used as a basis for comparison with other investments. Strategy returns shown above are post fees & expenses.
Strategy Inception Date: 24/03/2003.
Inve
stm
ent
Val
ue
Strategy Inception Date: 11/12/2007
Performance of other Schemes
21.31X
8.47X
-10
40
90
140
190
240
Mar
-03
Jun
-03
Sep
-03
De
c-0
3M
ar-0
4Ju
n-0
4Se
p-0
4D
ec-
04
Mar
-05
Jun
-05
Sep
-05
De
c-0
5M
ar-0
6Ju
n-0
6Se
p-0
6D
ec-
06
Mar
-07
Jun
-07
Sep
-07
De
c-0
7M
ar-0
8Ju
n-0
8Se
p-0
8D
ec-
08
Mar
-09
Jun
-09
Sep
-09
De
c-0
9M
ar-1
0Ju
n-1
0Se
p-1
0D
ec-
10
Mar
-11
Jun
-11
Sep
-11
De
c-1
1M
ar-1
2Ju
n-1
2Se
p-1
2D
ec-
12
Mar
-13
Jun
-13
Sep
-13
De
c-1
3M
ar-1
4Ju
n-1
4Se
p-1
4D
ec-
14
Mar
-15
Jun
-15
Sep
-15
De
c-1
5M
ar-1
6Ju
n-1
6Se
p-1
6D
ec-
16
Mar
-17
Value Strategy
Nifty 50 Index 23.52X
9.20X
0
5
10
15
20
25
30
35
40
45
50
De
c-0
7
Mar
-08
Jun
-08
Sep
-08
De
c-0
8
Mar
-09
Jun
-09
Sep
-09
De
c-0
9
Mar
-10
Jun
-10
Sep
-10
De
c-1
0
Mar
-11
Jun
-11
Sep
-11
De
c-1
1
Mar
-12
Jun
-12
Sep
-12
De
c-1
2
Mar
-13
Jun
-13
Sep
-13
De
c-1
3
Mar
-14
Jun
-14
Sep
-14
De
c-1
4
Mar
-15
Jun
-15
Sep
-15
De
c-1
5
Mar
-16
Jun
-16
Sep
-16
De
c-1
6
Mar
-17
NTDOP Strategy
Nifty Free Float Midcap 100 Index 5.15X
2.14X

Why Multicap Portfolio?
Source: Mid to Mega - 20th Wealth Creation Study by Raamdeo Agrawal
Mid and Small cap… balancing the odds…

Source: Focused Investing – 21st Wealth Creation Study by Raamdeo Agrawal
During 2011-16, 67 companies crossed over from Mini to Mid category, generating an average return CAGR of 39%, v/s 5% for the Sensex.
During 2011-16, 26 companies
crossed over from Mid to Mega. The Mid-to-Mega portfolio delivered average return CAGR of 31% over 2011-16 v/s 5% for Sensex.
Mid and Small cap… balancing the odds…
Why Multicap Portfolio?

India Opportunity Portfolio Strategy (IOPS)
• Strategy Objective
• Focus Themes For the Next five Years
• Strategy Construct
• Portfolio Holding
• Performance Snapshot

Strategy objective
The Strategy aims to generate long term capital appreciation by creating a focused portfolio of high growth stocks having the potential to grow more than the nominal GDP for next 5-7 years across and which are available at reasonable market prices. Focus is on identifying well run companies that are existing/potential leaders in their field of operations.

Focus Themes for IOP
Making India a manufacturing hub
• Auto and auto components • Pharma Outsourcing • Engineering Products
Increasing discretionary consumer spending • Consumer durables • Consumer Staples • Building Products • Kitchenware • Housing Finance
Increasing public investments on infrastructure • Cement • Railway • Ports • Metro
Make In India Third trillion Dollar
Consumption Opportunities Revival In Capex cycle
These are illustrative in nature and can change from time to time based on the outlook of the portfolio manager.

No. of Stocks - 15 - 20 stocks for a portfolio
Scrip Allocation - Not more than 10% in a single stock when at the time of initiation
Sector Allocation Limit - 35% in a sector
Strategy Aim - It aims to deliver superior returns by participating in India Investment and consumption Growth Story
Strategy Focus - Focus is on identifying well run companies that are existing/potential leaders in the field of operations.
Risk-Return matrix & strategy construct
Investment Horizon - Long Term (3 Years +) For Whom - Investors who like to invest with a Long-term wealth creation view.
Strategy construct
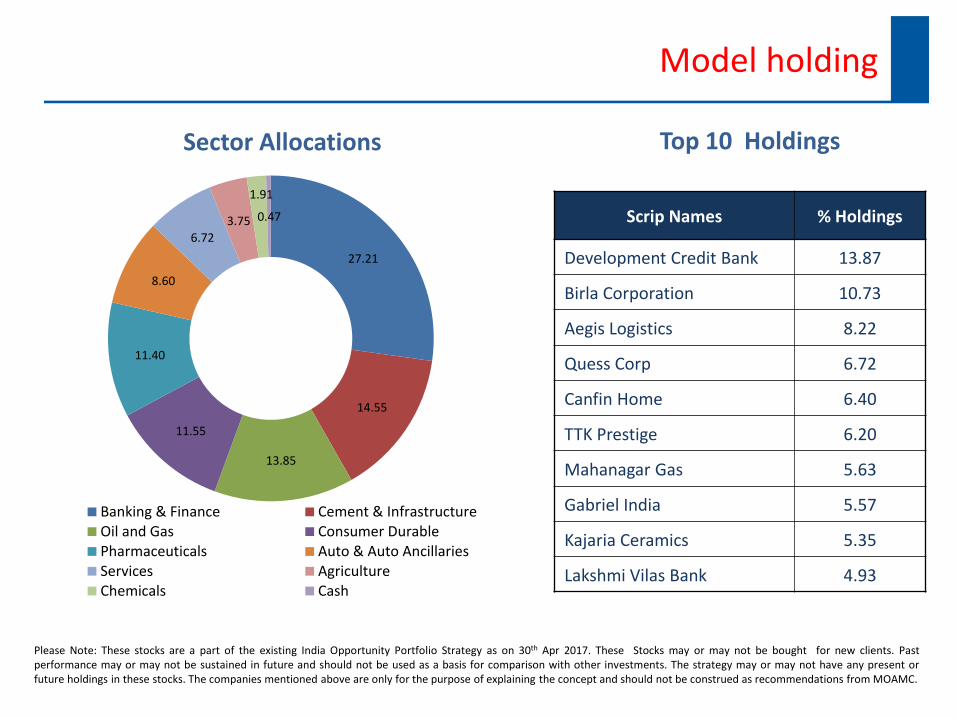
Top 10 Holdings Sector Allocations
Please Note: These stocks are a part of the existing India Opportunity Portfolio Strategy as on 30th Apr 2017. These Stocks may or may not be bought for new clients. Past performance may or may not be sustained in future and should not be used as a basis for comparison with other investments. The strategy may or may not have any present or future holdings in these stocks. The companies mentioned above are only for the purpose of explaining the concept and should not be construed as recommendations from MOAMC.
Model holding
Scrip Names % Holdings
Development Credit Bank 13.87
Birla Corporation 10.73
Aegis Logistics 8.22
Quess Corp 6.72
Canfin Home 6.40
TTK Prestige 6.20
Mahanagar Gas 5.63
Gabriel India 5.57
Kajaria Ceramics 5.35
Lakshmi Vilas Bank 4.93
27.21
14.55
13.85
11.55
11.40
8.60
6.72
3.75
1.91
0.47
Banking & Finance Cement & InfrastructureOil and Gas Consumer DurablePharmaceuticals Auto & Auto AncillariesServices AgricultureChemicals Cash

Performance snapshot
*Strategy Inception Date: 11/2/2010. Please Note: The Above strategy returns are of a Model Client as on 30th Apr 2017. Returns of individual clients may differ depending on time of entry in the Strategy. Past performance may or may not be sustained in future and should not be used as a basis for comparison with other investments. Returns below 1 year are absolute and above 1 year are annualized. Strategy returns shown above are post fees & expenses.
Since Inception India Opportunity Portfolio Strategy has delivered 18.37% returns vs. Nifty Free Float Midcap 100 Index returns of 13.53% delivering an alpha of 4.84%
65.8
27.7
34.0
27.7
22.6
18.4
37.1
19.4
27.2
23.3
19.3
13.5
1 year 2 Year 3 Years 4 years 5 years Since Inception
India Opportunity Portfolio Strategy Nifty Free Float Midcap 100
% R
etu
rns

Performance since inception
Strategy Inception Date: 11/2/2010 Please Note: The Above strategy returns are of a Model Client as on 30th Apr 2017. Returns of individual clients may differ depending on time of entry in the Strategy. Past performance may or may not be sustained in future and should not be used as a basis for comparison with other investments. Returns below 1 year are absolute and above 1 year are annualized. Strategy returns shown above are post fees &expenses.
The chart below illustrates Rs. 1 crore invested in India Opportunity Portfolio Strategy in February 2010 is worth Rs. 3.37 cr as on 30th Apr 2017. For the same period Rs. 1 crore invested in Nifty Free Float Midcap 100 Index is now worth Rs. 2.50 cr.
Inve
stm
ent
Val
ue
5
10
15
20
25
30
35
40
Feb
-10
May
-10
Au
g-1
0
No
v-1
0
Feb
-11
May
-11
Au
g-1
1
No
v-1
1
Feb
-12
May
-12
Au
g-1
2
No
v-1
2
Feb
-13
May
-13
Au
g-1
3
No
v-1
3
Feb
-14
May
-14
Au
g-1
4
No
v-1
4
Feb
-15
May
-15
Au
g-1
5
No
v-1
5
Feb
-16
May
-16
Au
g-1
6
No
v-1
6
Feb
-17
India Opportunity Portfolio StrategyNifty Free Float Midcap 100
3.37X
2.50X

Rolling Returns Performance
The data shows rolling returns of the IOP Strategy over various time frames. It is worth noting that on 1 year rolling basis, the returns are in a very wide range. The best return made by the Strategy is 70% and the worst return is -27%. As we increase the time horizon, the outcomes narrow significantly from the average. For instance, if we consider the 5 year time frame, historically the best return (CAGR) is 22%, least return is 7% and average return is 14%. It may also be noteworthy that the negative returns above 3 years rolling periods are zero
Please Note: The Above strategy returns are of a Model Client as on 31st Mar 2017. Returns of individual clients may differ depending on time of entry in the strategy. Past performance may or may not be sustained in future and should not be used as a basis for comparison with other investments. Strategy returns shown above are post fees & expenses. Returns above 1 year are annualized.

Risk analysis
The India Opportunity Portfolio Strategy has outperformed the benchmark with a lower level of volatility and has managed to deliver strong returns while offering defensive characteristics, reducing losses during periods of market downturn but participating in the upside.
The data and analysis provided herein do not constitute investment advice and are provided only for informational purposes. It should not be construed as an offer or the solicitation of an offer, to buy or sell securities. Past performance may or may not be sustained in future.
Source : Motilal Oswal AMC, Data as on 31/03/2017, returns annualized using model strategy *Nifty Free Float Midcap 100
5 Years Data Portfolio Benchmark*
Beta 0.85 1.00
R2 79.59 100.00
Up Capture Ratio 98.20 100.00
Down Capture Ratio 76.94 100.00
Sharpe Ratio 0.69 0.51
Standard Deviation 17.62 18.31

Dishman Pharmaceuticals & Chemicals (Dishman Pharma) is primarily into Contract Research And Manufacturing Services (CRAMS) business. It is an integrated CRAMS provider present along the entire value chain from building blocks like research to commercialization & launch of drug through manufacturing support to client.
In the CRAMS segment, Dishman Pharma is currently working on a pipeline of 13 molecules which are in late Phase III and another 20 molecules which are in late Phase-II or early Phase-III. Of these, 7 molecules are in the Oncology space and the Management expects to commercialize at least 2 of them in next 18-24 months.
Dishman Pharma has no major planned capex for the next two years. Hence the incremental cash flows would be used to retire debt; this coupled with improving asset returns (from 1.1x to 1.6x), will lead to RoCE/ RoEs expanding by 350 bps over FY17-20E and further improve the balance sheet.
CRAMS business accounts for 72% of sales and is expected to boost profitability driven by higher supplies from India.
The given stock is a part of portfolio of a model client of India Opportunity Portfolio Strategy as on 30th Apr 2017. The stock forming part of the existing portfolio under India Opportunity Portfolio Strategy may or may not be bought for new client. Past performance may or may not be sustained in future and should not be used as a basis for comparison with other investments. Name of the PMS Strategy does not in any manner indicate its future prospects and returns. The Company mentioned above is only for the purpose of explaining the concept and should not be construed as recommendations from MOAMC. Bloomberg/MOAMC. Data as on 31st October 2016
Key Holdings – Dishman Pharma
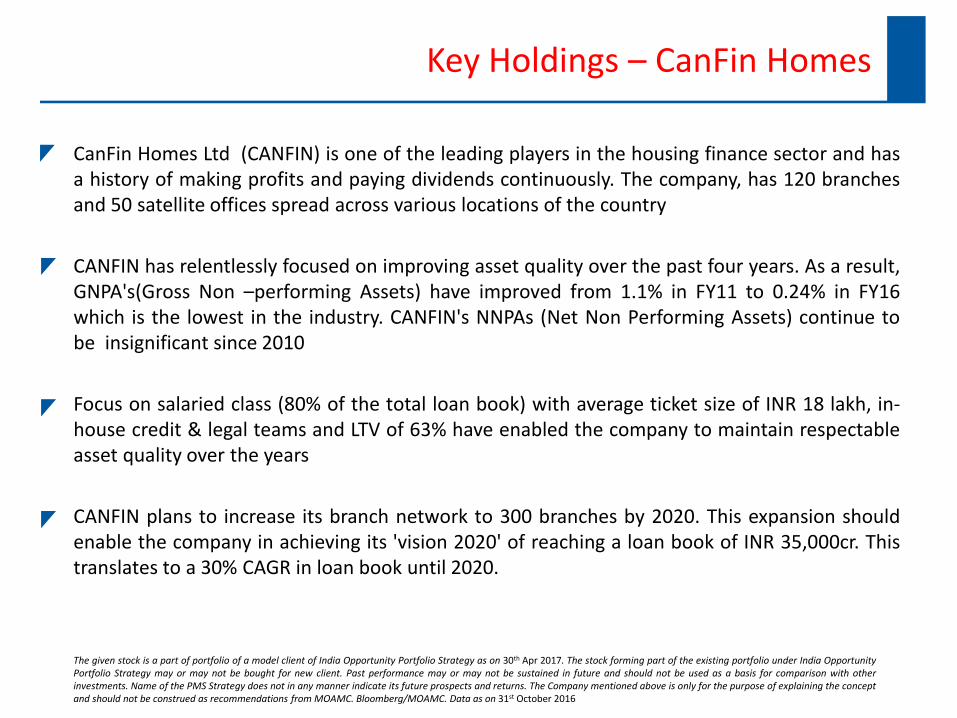
CanFin Homes Ltd (CANFIN) is one of the leading players in the housing finance sector and has a history of making profits and paying dividends continuously. The company, has 120 branches and 50 satellite offices spread across various locations of the country
CANFIN has relentlessly focused on improving asset quality over the past four years. As a result, GNPA's(Gross Non –performing Assets) have improved from 1.1% in FY11 to 0.24% in FY16 which is the lowest in the industry. CANFIN's NNPAs (Net Non Performing Assets) continue to be insignificant since 2010
Focus on salaried class (80% of the total loan book) with average ticket size of INR 18 lakh, in-house credit & legal teams and LTV of 63% have enabled the company to maintain respectable asset quality over the years
CANFIN plans to increase its branch network to 300 branches by 2020. This expansion should enable the company in achieving its 'vision 2020' of reaching a loan book of INR 35,000cr. This translates to a 30% CAGR in loan book until 2020.
Key Holdings – CanFin Homes
The given stock is a part of portfolio of a model client of India Opportunity Portfolio Strategy as on 30th Apr 2017. The stock forming part of the existing portfolio under India Opportunity Portfolio Strategy may or may not be bought for new client. Past performance may or may not be sustained in future and should not be used as a basis for comparison with other investments. Name of the PMS Strategy does not in any manner indicate its future prospects and returns. The Company mentioned above is only for the purpose of explaining the concept and should not be construed as recommendations from MOAMC. Bloomberg/MOAMC. Data as on 31st October 2016

Quess is one of the leading provider of flexi-staffing with a strong leadership team led by Ajit Isaac (MD and CEO) and ultimately owned by the Fairfax Group. Quess has a strong pan-India offline presence through 43 offices across 24 cities which enables it tap candidates on a continuous basis.
850+ full time vertical focussed specialized recruiters with deep domain expertise enables recruitments for clients across industries and jurisdictions in a timely manner. They have 1,300+ clients across various business segments, of which 17+ being Fortune Global 500 clients.
Even with flexi-staffing industry expected to grow at 20% CAGR over next 5 years, the penetration of flexi-staff to formal labour force will increase marginally from 2% to 3%. Companies are finding it easier to outsource non-core / support staff to third-party payrolls –Policy measures like GST (enables service tax credit to clients), can ensure level playing field for organized players in the flexi-staffing industry, driving shift from to organized players.
Quess Corp has a demonstrated track record of hyper-growth (12x sales and 51x PAT growth over last 5 years) along with superior RoCE and RoEs
Key Holdings – Quess Corp
The given stock is a part of portfolio of a model client of India Opportunity Portfolio Strategy as on 30th Apr 2017. The stock forming part of the existing portfolio under India Opportunity Portfolio Strategy may or may not be bought for new client. Past performance may or may not be sustained in future and should not be used as a basis for comparison with other investments. Name of the PMS Strategy does not in any manner indicate its future prospects and returns. The Company mentioned above is only for the purpose of explaining the concept and should not be construed as recommendations from MOAMC. Bloomberg/MOAMC. Data as on 31st October 2016
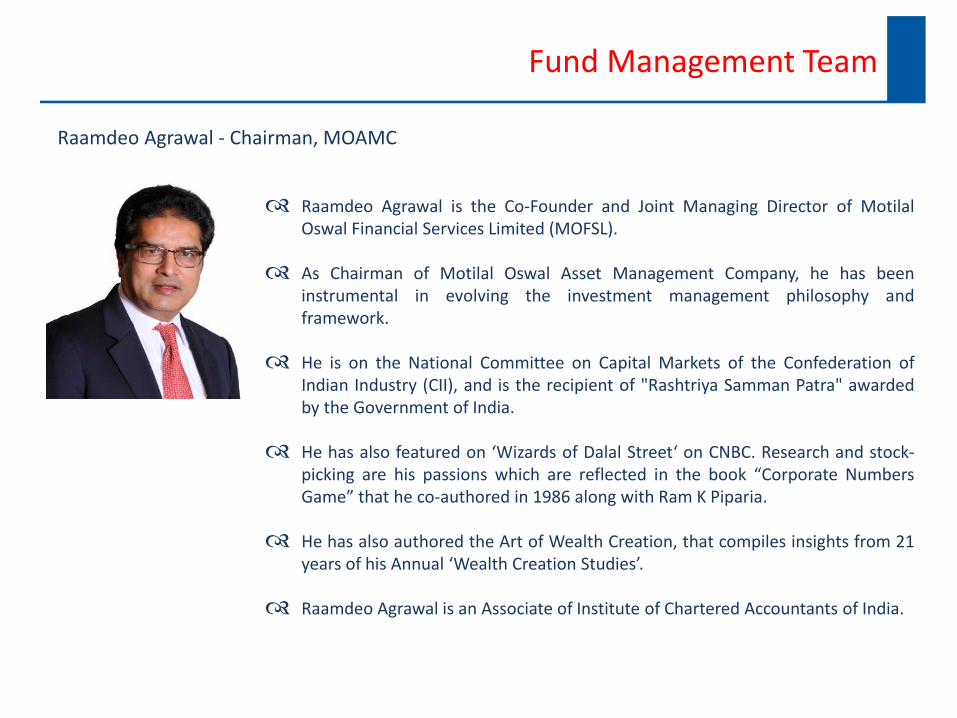
Raamdeo Agrawal - Chairman, MOAMC
Raamdeo Agrawal is the Co-Founder and Joint Managing Director of Motilal Oswal Financial Services Limited (MOFSL).
As Chairman of Motilal Oswal Asset Management Company, he has been instrumental in evolving the investment management philosophy and framework.
He is on the National Committee on Capital Markets of the Confederation of Indian Industry (CII), and is the recipient of "Rashtriya Samman Patra" awarded by the Government of India.
He has also featured on ‘Wizards of Dalal Street‘ on CNBC. Research and stock-picking are his passions which are reflected in the book “Corporate Numbers Game” that he co-authored in 1986 along with Ram K Piparia.
He has also authored the Art of Wealth Creation, that compiles insights from 21 years of his Annual ‘Wealth Creation Studies’.
Raamdeo Agrawal is an Associate of Institute of Chartered Accountants of India.
Fund Management Team

Manish Sonthalia – Head Equity PMS and Alternatives, MOAMC (Fund Manager)
Mr. Manish Sonthalia heads the Equity Portfolio Management Services at Motilal Oswal Asset Management Company Ltd. He also, serves as the Chief Investment Officer and the Director of the Motilal Oswal India Fund.
He has over 22 years of experience across equity fund management and research covering Indian markets and has been with Motilal Oswal for over 11 years.
He holds a Bachelor Degree in Commerce (Hons), ICWAI, CS, MBA-Finance, FCA
He has authored a paper ‘A Rising Consumer Class’ on Indian markets, published by the Global World Economic Forum in year 2010.
He is frequently interviewed by leading Media channels in India as well as globally. He has contributed various articles on Finance and Capital Markets in various Journals.
Fund Management Team

Ms. Mythili Balakrishnan has been appointed as the Co-Fund Manager for IOP PMS
Mythili has over 13 years of experience across buy side (8 years) and sell side (5 years).
She has previously been associated with Avezo Advisers, Motilal Oswal Group, Nalanda Capital-Singapore, JP Morgan & GE Capital.
Mythili is a Post Graduate from IIM Ahmedabad and awarded CFA Charter from CFA Institute.
She has joined MOAMC at the position of Vice President with effect from February 27, 2017.
Mythili Balakrishnan – Vice President, MOAMC (Co-Fund Manager)
Fund Management Team

Strategy structure
Mode of payment By Fund Transfer/Cheque and/or Stock Transfer
Investment Horizon Long Term (3 Years +)
Benchmark Nifty Free Float Midcap 100
Account Activation Next business day of Clearance of funds
Portfolio Valuation Closing NSE market prices of the previous day
Operations - Investments managed on individual basis - Third party Custodian for funds and securities
Reporting - Monthly Performance Statement - Transaction, Holding & Corporate Action Reports - Annual CA certified statement of the Account
Servicing - Dedicated Relationship Manager - Web access for portfolio tracking

Disclaimer
Disclaimer: This presentation has been prepared and issued on the basis of internal data, publicly available information and other sources believed to be reliable. The information contained in this document is for general purposes only and not a complete disclosure of every material fact and terms and conditions. The information / data herein alone is not sufficient and shouldn’t be used for the development or implementation of an investment strategy. It should not be construed as investment advice to any party. All opinions, figures, charts/graphs, estimates and data included in this presentation are as on date and are subject to change without notice. While utmost care has been exercised while preparing this document, Motilal Oswal Asset Management Company Limited does not warrant the completeness or accuracy of the information and disclaims all liabilities, losses and damages arising out of the use of this information. The statements contained herein may include statements of future expectations and other forward-looking statements that are based on our current views and assumptions and involve known and unknown risks and uncertainties that could cause actual results, performance or events to differ materially from those expressed or implied in such statements. Readers shall be fully responsible /liable for any decision taken on the basis of this presentation. No part of this document may be duplicated in whole or in part in any form and/or redistributed without prior written consent of the Motilal Oswal Asset Management Company Limited. Readers should before investing in the Scheme make their own investigation and seek appropriate professional advice. • Investments in Securities are subject to market and other risks and there is no assurance or guarantee that the objectives of any of the strategies of the Portfolio Management Services will be achieved. • Clients under Portfolio Management Services are not being offered any guaranteed/assured returns. • Past performance of the Portfolio Manager does not indicate the future performance of any of the strategies. • The name of the Strategies do not in any manner indicate their prospects or return. • The investments may not be suited to all categories of investors. • The material is based upon information that we consider reliable, but we do not represent that it is accurate or complete, and it should not be relied upon as such. • Neither Motilal Oswal Asset Management Company Ltd. (MOAMC), nor any person connected with it, accepts any liability arising from the use of this material. The recipient of this material should rely on their investigations and take their own professional advice. • Opinions, if any, expressed are our opinions as of the date of appearing on this material only. While we endeavor to update on a reasonable basis the information discussed in this material, there may be regulatory, compliance, or other reasons that prevent us from doing so. • The Portfolio Manager is not responsible for any loss or shortfall resulting from the operation of the strategy. • Recipient shall understand that the aforementioned statements cannot disclose all the risks and characteristics. The recipient is requested to take into consideration all the risk factors including their financial condition, suitability to risk return, etc. and take professional advice before investing. As with any investment in securities, the Value of the portfolio under management may go up or down depending on the various factors and forces affecting the capital market. Disclosure Document shall be obtained and read carefully before executing the PMS agreement. • Prospective investors and others are cautioned that any forward - looking statements are not predictions and may be subject to change without notice. • For tax consequences, each investor is advised to consult his / her own professional tax advisor. • This document is not for public distribution and has been furnished solely for information and must not be reproduced or redistributed to any other person. Persons into whose possession this document may come are required to observe these restrictions. No part of this material may be duplicated in any form and/or redistributed without ’MOAMCs prior written consent. • Distribution Restrictions – This material should not be circulated in countries where restrictions exist on soliciting business from potential clients residing in such countries. Recipients of this material should inform themselves about and observe any such restrictions. Recipients shall be solely liable for any liability incurred by them in this regard and will indemnify MOAMC for any liability it may incur in this respect.
Custodian: IL&FS Securities Services Ltd | Auditor: M/s Morzaria & Associates | Depository: Central Depositary Services Ltd Portfolio Manager: Motilal Oswal Asset Management Company Ltd. (MOAMC) | SEBI Registration No. : INP 000000670