September 2012 - Agricultural Research Council Outlook Reports/Economic Outlook Repo… · ABSA...
19
1 ECONOMIC OUTLOOK REPORT XII Prepared by the Economic Services Unit: Technology Transfer Division September 2012
Transcript of September 2012 - Agricultural Research Council Outlook Reports/Economic Outlook Repo… · ABSA...

1
ECONOMIC OUTLOOK REPORT XII
Prepared by the Economic Services Unit: Technology Transfer Division
September 2012

2
Table of Contents
1. EXECUTIVE SUMMARY ......................................................................................................... 3
2. FOREWORD AND ACKNOWLEDGEMENTS ............................................................................. 5
3. MACRO-ECONOMIC INDICATORS .......................................................................................... 6
Global macroeconomic status .............................................................................................................. 6
South African macroeconomic status ................................................................................................... 6
Global Agricultural outlook .................................................................................................................. 6
SA Agribusiness ................................................................................................................................... 7
SADC REGION ...................................................................................................................................... 7
4. FIELD CROP PRODUCTS ......................................................................................................... 8
Maize .................................................................................................................................................. 8
Wheat ................................................................................................................................................. 8
Sorghum ............................................................................................................................................. 9
Barley ................................................................................................................................................. 9
Canola ................................................................................................................................................ 9
Cotton .............................................................................................................................................. 10
Sunflower ......................................................................................................................................... 10
Soya beans ........................................................................................................................................ 10
Groundnuts ....................................................................................................................................... 11
Dry beans .......................................................................................................................................... 11
5. HORTICULTURE OUTLOOK .................................................................................................. 12
Grapes .............................................................................................................................................. 12
Apples & Pears .................................................................................................................................. 13
Vegetables ........................................................................................................................................ 14
6. ANIMAL PRODUCTION ....................................................................................................... 15
Poultry .............................................................................................................................................. 15
Beef .................................................................................................................................................. 15
Pork .................................................................................................................................................. 16
Dairy Products ................................................................................................................................... 17
Wool ................................................................................................................................................. 17
Mohair .............................................................................................................................................. 18
7 CONCLUSIONS .................................................................................................................... 19

3
1. EXECUTIVE SUMMARY
Global macroeconomics
The global economic outlook remains uncertain, with downside risks being posed by the Eurozone debt
crisis and the US “fiscal cliff”. The IMF continues to project a gradual recovery, but global growth will likely
be weaker than anticipated. After leading the global economy in the current recovery, major emerging
markets are now slowing. Key economies like China, Brazil and India have weakened further, impacted by
dull global demand. Low-income countries in sub-Saharan Africa have been growing strongly, but also face
commodity price increases.
Global agricultural perspective
The extreme drought in the US caused soybean, maize and wheat prices to jump as harvest expectations are
cut back significantly. The global wheat production forecast is lowered by 6.7 and 6.0 million tons,
respectively, which is about 4% lower than in the record production year 2011/12. Globally, beef production
is projected to increase on average 1.8% per annum with developing countries accounting for 58%, by 2021.
South African macroeconomics
The weak global environment continues to pose a risk to the domestic economy. Despite the gloomy
forecast the Reserve Banks’ repo rate was kept at 5%. The CPI is projected to average 5.3% in Q 4 of 2012
and average 5.2% in 2013 and 5.0% in 2014. GDP growth is projected at 2.6% in 2012 and 3.4% in 2013.
South African Agricultural sector perspective
The Agbiz/IDC Agribusiness Confidence Index reports a slowdown in recovery in agribusiness confidence.
The index reached a level of 59.64 in the second quarter of 2012, 7% lower than the preceding quarter and
5% lower than last year at the same time. However, resilient global prices encouraged production in South
Africa for the 2012/13 season, taking advantage of opportunities offered by export markets.
Field crop outlook
The BMI anticipates global maize prices to continue trading sideways around current levels in the short
term. The average price for maize is expected to stay at USc600/bushel in 2012. The production of wheat is
projected to be 1 762 million tons, which is 0.12% less than the previous seasons’ crop of 1 764 million tons.
The expected yield for wheat is 3.45t/ha. Sorghum output is expected to remain unchanged at 137 150 tons
with an expected yield of 2.82t/ha. The area planted for barley is 44 100 ha, with an expected yield of
3.54t/ha. The 2011/12 cotton crop is 31% smaller than that of the previous season mainly due to lower
cotton prices and better prices for competing summer crops. The expected production forecast for the
canola is 12. 47% more than the previous seasons’ canola crop of 58 800 tons. The production of sunflower
seed is estimated to remain unchanged at 527 110 tons. The production forecast for dry beans is 47 695
tons, with an expected yield of 2.91 t/ha.
Horticultural outlook
Total cash expenditure for wine grapes shows a 9% increase from 2010, to R22 443/ha for the 2011
production year. The total area for table grapes is projected to shrink to less than 22 000 ha in 2014, where
after it is expected to increase steadily to reach 22 436 ha in 2021. Europe remains South Africa’s most

4
prominent export destination, accounting for just less than 80% of SA fresh grape exports. Over the next
decade, the domestic market for table grape is projected to remain lucrative with nominal price growth
averaging per annum. The area planted to apple trees is projected to continue its upward trend, increasing
by 470 hectares in 2012. The Domestic Market for pears remains small; below 70 000 tons. The price of
pears sold locally is estimated to increase by 7% in 2012, supported by low supply and relatively high prices
for processing pears. Until 2020 prices of deciduous fruits are expected to increase in nominal terms.
Although, the quantity of vegetables sold in both domestic and export markets have remained relatively
constant, the value of the domestic market increased significantly between 2006 and 2011.
Livestock production
Over the next decade, the increase in the demand for beef is expected to average an annual growth rate of
3%. South Africa is expected to remain a net importer of both poultry products and pork. The per capita
consumption of chicken meat is forecast to exceed 45 kg by 2020. The forecast for poultry production
envisages strong growth of 21.8% and 48% in the five years to 2016 and over the next decade to 2020
respectively. BMI forecast beef production rising by 25.4% in the five years to 2015/16 while BFAP projects
beef consumption to grow by 23 % over the next decade. Pork consumption is expected to decline slightly in
2012 in response to decreasing beef prices, before gradually increasing over the next decade to 2020.
Following a marginal decrease in 2011, the producer price of milk is expected to increase in 2012 on the
back of increased feed costs and greater demand for milk products as consumers’ disposable income
increase.
SADC Food Security Outlook
Favourable food security conditions are expected to prevail throughout the region from July to September
2012. Main harvests have increased the availability of staple foods at the household level and in local
markets. Increased costs associated with transportation, agricultural inputs and rising inflation levels in the
region may result in irregular price increases in some countries as the lean season approaches in
October/November.

5
2. FOREWORD AND ACKNOWLEDGEMENTS
The Economic Services Unit presents this 12thEconomic Outlook to the ARC as a planning resource. The
document analyses global and domestic trends in economic and agricultural markets and policy, as well as
potential impacts on sector performance. Apart from a macroeconomic perspective, it deals with
agricultural production, consumption, and price trends. A range of projections are provided, based on
assumptions about a set of economic, technological, environmental, political, institutional and social
factors. International and local publications form the basis of the Outlook. Projections developed by the
OECD, IMF, Global Insight, FAPRI and the World Agricultural Outlook are used. Projections should be
interpreted as possible scenarios. The following sources are acknowledged:
Agricultural Business Chamber Media Release, August 2012
ABSA Weekly market analysis, 21 September 2012
Bureau for Food and Agricultural Policy (BFAP) 2012 Outlook
Business Monitor International Report, Q4, 2012
Cape Mohair Wool (CMW) Mohair & Wool Market 25 September 2012 reports
Cotton SA, Cotton Market Report (9/3/3/1), September, 2012
Crop Estimates Committee August report, 2012
Famine Early Warning Systems Network (FEWS-Net), August 2012
International Monetary Fund (IMF): World Economic outlook, September 2012
FNB Agri-Weekly, 14 September, 2012
http://www.woolnews.net/news/forecast-supply-and-demand-2012-13-and-beyond/
http://www.reuters.com/article/2012/04/05/us-food-fao-idUSBRE8331CU20120405
http://www.fao.org/worldfoodsituation/wfs-home/csdb/en/
International Monetary Fund (IMF): World Economic outlook. April 2012
MERC/NAMC. Cost of grape production and profitability: top performers in difficult times. March 2012.
NAMC &DAFF -International Trade probe, No. 39, May 2012
OECD-FAO – Agricultural Outlook, 2010-2019 and Economic Outlook May 2012
SA Economic Profile 2011 (http://www.globserver.co./en/south-africa/economy)
SARB Monitory Policy Committee report, 21 September 2012
www.imf.org/external/country/zaf/index.htm

6
3. MACRO-ECONOMIC INDICATORS
Global macroeconomic status
The global economic outlook remains uncertain, with downside risks posed by the Eurozone sovereign debt
crisis and the US “fiscal cliff”. Global inflation remains benign but supply shocks emanating from dry
conditions in the US and Eastern Europe as well as elevated international oil prices poses an upward risk.
Key global central banks have expanded their quantitative easing programmes but the risk to global
financial markets remains high, with the exit of the Eurozone by Greece remaining a possibility. The IMF
continues to project a gradual recovery, but global growth will likely be a bit weaker than anticipated.
Emerging market economies in Asia and elsewhere, after leading the global economy in the recovery, are
now slowing. Key emerging economies like China, Brazil and India have also weakened further, impacted by
dull global demand. Low-income countries in sub-Saharan Africa have been growing strongly, but also face
commodity price increases.
South African macroeconomic status
Local supply disruptions, particularly in the mining sector, are impacting negatively on domestic activity. The
production side of the economy has weakened in recent months. Mining output fell in July, while the Kagiso
PMI pointed towards weak conditions in the manufacturing sector. The weak global environment continues
to pose a risk to the domestic economy. Despite the gloomy forecast SARB kept the banks’ repo rate on 5%.
The CPI is projected to average 5.3% in the fourth quarter of 2012 and average 5.2% in 2013 and 5.0% in
2014. The Bank’s core inflation measure, which excludes food, petrol and electricity prices, is projected to
peak at 4.9% in the fourth quarter of 2012 and average 4.6% per annum in the following two years. The
Bank’s GDP growth forecasts have been revised slightly downwards. GDP growth is currently projected at
2.6% (previously 2.7%) in 2012 and 3.4% (previously 3.8%) in 2013. Inflation expectations have remained
anchored around the upper limit of the inflation target band. Despite the large current account deficit, that
widened to 6.4% of GDP in the second quarter, and the unfavourable events in the mining sector, the Rand
declined by only 5.0% against its trade-weighted basket, 2.4% against the US dollar and 7.5% against the
euro. The rand was supported by steady foreign capital inflows, albeit of a short-term nature. Net foreign
purchases of local bonds amounted to R12.1 billion since July with net foreign portfolio inflows reaching
R74.5 billion year to date.
Global Agricultural outlook
The extreme drought in the US caused soybean, maize and wheat prices to jump higher as harvest
expectations were cut back significantly. With most of the largest exporters on the world market receiving
either too little or too much rain, sugar prices also started to appreciate. Production is declining in the most
important producing countries due to these unfavourable weather conditions as well as crop diseases. The
US Department of Agriculture (USDA) and the International Grains Council (IGC) lowered their forecasts for
global production, consumption and supplies for 2012/13. The global wheat production forecast was
lowered by 6.7 and 6.0 million tons, respectively, which is about 4% lower than in the record production
year 2011/12. Global wheat consumption is reduced by 4.6 million tons, resulting in world ending stocks for
2012/13 projected ± 10% lower than in the past three crop years. According to the OECD–FAO Agricultural
Outlook 2012–2021 report, globally the demand for beef is rapidly growing in developing economies,
driving up nominal beef prices. Beef production is projected to increase on average 1.8% per annum over
the next 10 years, with developing countries accounting for an increasing share of 58%, by 2021.

7
SA Agribusiness
The Agbiz / IDC Agribusiness Confidence Index reached a level of 59.64 in the second quarter of 2012; 7%
lower than the preceding quarter and 5% lower than the same quarter of last year. The biggest drivers for
this decrease was a decrease in turnover (-12%), compared to quarter 1; a reflection of the downward
adjustment in summer crop projections. As some areas experienced highly erratic rain fall in the second
quarter, agribusinesses became less optimistic. Still, resilient global prices encouraged production in South
Africa for the 2012/13 season mainly to take advantage of opportunities offered by export markets. Sugar
production forecast for 2012/13 are expecting rising prices, encouraging plantings in the medium term.
However, inefficiencies in the processing industry remain a concern over the coming years. The domestic
sugar price is expected to rise from 96 US cents in 2011 to 106 US cents/kg in 2015.Trade Indicators -
Historical Data & Forecasts, 2009-20
Table: 1: Sub-indices changes of the Agbiz/IDC Agribusiness Confidence Index - Quarter 2 of 2012:
Sub-indices Quarter to Quarter change Year-on-Year change
Turnover -12% Decrease 0% Unchanged
Net operating income -7% Small decrease 14% Increase
Market share of the business -2% Very small decrease 9% Small increase
Employment -2% Very small decrease 32% Increase
Capital investment -6% Small decrease 7% Small increase
Volume exports -13% Decrease 5% Small increase
Economic growth in South Africa 38% Increase -23% Decrease
General agricultural conditions -27% Decrease -43% Decrease
Debtor provision for bad debt 11% Increase 14% Increase
Financing costs 8% Small increase 8% Small increase
Overall index -7% Small decrease -5% Small decrease
SADC REGION
The July FEW-NET report indicates that favourable food security conditions are expected to prevail
throughout the SADC region from July to September 2012. Main harvests have increased the availability of
staple foods at the household level and in local markets. As food prices continue to drop in line with
seasonal patterns, food access has improved for most market dependent households. However, increased
costs associated with transportation, agricultural inputs and rising inflation levels in the region may result in
irregular price increases in some countries as the lean season approaches in October/November. Parts of
the region that experienced crop production shocks are currently facing food insecurity conditions. Severity
ranges from crisis in parts of southern Malawi, to stress in other parts of southern Malawi, and central and
southern Mozambique. Other affected areas include parts of southern Zimbabwe, Lesotho, and Angola.

8
4. FIELD CROP PRODUCTS
Maize
Given reports of reduced yield estimates from the South African Crop Estimates Committee (CEC) and
considering the drought in the US, the BMI revised its forecast for maize production in South Africa;
production is projected to grow by 1.6% year-on-year to 11.1 million tons in 2011/12. Local maize
production is expected to increase in 2012/13, due to improvement in plantings against elevated global
prices and higher than usual producer deliveries. The area estimate for maize production is 2 699 million ha
whilst the expected yield is 4.15 t/ha. Forecasts by the CEC for white maize is 6 506 million tons, which is
143 500 tons more than the 6 362 million tons of the previous forecast. The forecast yield for white maize
improved to 3.98 t/ha. The production forecast for yellow maize is 4 830 million tons with a yield of 4.54
t/ha. The BMI anticipates that South African maize exports to Sub-Saharan African countries will decrease
which will lead to a production deficit of 110 000 tons in the region and especially in countries like
Botswana, Lesotho and Mozambique.
Figure 4.1: South African maize production and consumption, 2011 – 2016 (BMI, 2012).
Following high maize prices earlier in the year, maize prices eased since March 2012 and are now following
world maize prices. Expectations of a strong recovery in the 2011/12 harvest have caused prices to retreat.
The BMI further anticipates global maize prices to going continue trading sideways around current levels in
the short term. The average price for maize is expected to stay at USc600/bushel in 2012.
Wheat
The United States Department of Agriculture (USDA) has confirmed that the effective import duty for wheat
shall be raised to US$215 per metric tonne, at current wheat prices. This is expected to improve the
profitability of wheat production in South Africa. The BMI reports that such developments have also helped
counteract the recent decline in local wheat production by enticing wheat producers to increase plantings.
Against this backdrop, the CEC anticipates the production of wheat to be 1 762 million tons; 0.12% less than
the previous seasons’ crop of 1 764 million tons. The expected yield is 3.45 t/ha. Improved yields result from
continued advances in wheat varieties. The Western Cape Province continued to lead in local wheat
production, with an expected production output of 734 400 tons in 2012, which is 24 400 tons higher than
the previous season. The Free State Province is second at 391 000 tons and at number three is the Northern
Cape Province with a production output of 273 000 tons. The area estimate for wheat is 551 200 ha, which
is 4 500 ha more than that of the previous forecast of 546 700 ha.
0
5000
10000
15000
2011 2012f 2013f 2014f 2015f 2016f
Mai
ze (
'00
0 t
on
s)
Years (f = forecast)
Maize Production
Maize Consumption

9
Figure 4.2: South African Wheat production and consumption, 2011 – 2012 (BMI, 2012).
Sorghum
The CEC predicts that sorghum output shall remain unchanged at 137 150 tons with an expected yield of
2.82 t/ha. The area estimate for sorghum is 48 550 ha.
Figure 4.3: SA Sorghum Summer crop estimate (CEC, 2012).
Barley
The CEC forecast for barley is 300 662 tons, which is 24 tons more than the previous season’s crop of 300
638 tons. The CEC estimates that 44 100 ha is planted with barley, with an expected yield of 3.54t/ha.
Figure 4.4: SA Barley crop estimate 2008 – 2012 (BMI, 2012).
Canola
The expected production forecast for canola is 66 135 tons; 12.47% or 7 335 tons more than the previous
seasons’ crop of 58 800 tons. The area estimate for canola is 44 100 ha, with an expected yield of 1.50 t /ha.
0
1000
2000
3000
4000
2008 2009 2010 2011 2012f
Wh
eat
('0
00
to
ns)
Year (f = forecast)
Wheat Production Wheat Consumption
0 20 40 60 80 100 120 140 160 180
Final Crop (Tonnes)
Output Forecast(tonnes)
Area Planted (ha)
Sorghum ('000 tons)
Sorghum Production (2011)
Sorghum Production (2012)
0
100
200
300
400
2008 2009 2010 2011 2012f
Bar
ley
('0
00
to
ns)
Barley Production barley Consumption

10
Cotton
The International Cotton Advisory Committee (ICAC) expects cotton production in China and India to fall by
7% and 13% respectively. The USA will experience an increase of ± 13% following last year’s drought. This
means that world cotton production will be 7% lower than last season’s forecast, at 25.2 million tons. Rising
prices will cause farmers to reduce cotton areas in favour of grains and oilseeds, especially in Brazil. Cotton
demand will continue to be very weak owing mainly to government interference in the market and weak
global economic growth. Because of a decrease in cotton consumption in China, the ICAC expects an excess
supply of ± 2 million tons, resulting in a global rise in stocks of ± 14% to approximately 16 million tons.
According to Cotton South Africa’s 8th estimate for the 2011/12 production year, a total crop of 62 518 lint
bales was produced; roughly 58 518 lint bales from the RSA and the rest from Swaziland. The 2011/12 crop
is 31% smaller than the previous season mainly due to lower cotton prices and better prices for competing
summer crops such as maize.
Figure 4.5: RSA Cotton Lint Consumption (Cotton SA, 2012).
Sunflower
The CEC expects the production of sunflower seed to remain unchanged from the previous forecast of
527 110 tons. The area estimate for sunflower seed is 453 350 ha, with an expected yield of 1.16t/ha.
Figure 4.6: Sunflower area planted and final production forecast for 2012 (CEC, 2012).
Soya beans
The anticipated output for soya-beans is 646 950 tons and is 8 750 tons less than the previous forecast. The
area estimate for soya beans will remain unchanged at 472 000 ha with an expected yield of 1.37t/ha.
RSA COTTON LINT CONSUMPTION
pvverbr
Jan Feb Mrt Apr Mei Jun Jul Aug Sep Okt Nov Des0
5
10
15
20THOUSAND BALES (200kg)
2012 2011 2010 2009
0 200 400 600 800 1000
Area (ha)
Output Forecast (tonnes)
Final Crop (tonnes)
'000 tonnes
Sunflower Seed Production(2011)
Sunflower Seed Production(2012)

11
Figure 4.7: Soya beans area planted and final production forecast for 2012 (CEC, 2012).
Groundnuts
Compared to the previous forecast, the expected groundnut crop shall remain unchanged at 60 290 tons.
The area estimate for groundnuts is 45 450 ha, whereas the expected yield is 1.37 t/ha.
Figure 4.8: Groundnuts area planted and final production forecast for 2012 (CEC, 2012).
Dry beans
The CEC predicts that the production of dry beans is going to stay unchanged as in the previous forecast.
The production forecast for dry beans is 47 695 tons, with an expected yield of 2.91 t/ha. The estimated
area for dry beans is 39 750 ha.
Figure 4.9: Dry beans area planted and final production forecast for 2012 (CEC, 2012).
0 200 400 600 800
Area (ha)
Output Forecast (tonnes)
Final Crop (tonnes)
' 000 tonnes
Soya-beans production (2012)
Soya-beans production (2011)
0 10 20 30 40 50 60 70
Area (ha)
Output Forecast (tonnes)
Final Crop (tonnes)
'000 tonnes
Groundnuts Production (2011)
Groundnuts Production (2012)
34 36 38 40 42 44 46 48 50
Area (ha)
Output Forecast (tonnes)
Final Crop (tonnes)
'000 tonnes
Dry beans Production (2011)
Dry beans Production (2012)

12
5. HORTICULTURE OUTLOOK
Escalating production and replacement costs for orchards of major fruit commodities (pears, peach,
nectarines as well as grapes remain a major concern. Since 2010, the industry average total production cost
has increased by ± 7% to R30 582 per hectare in 2011. Cash expenditure (direct cost; labour, mechanisation,
fixed improvements and general expenses) increased by 9% from 2010, to R22 443/ha for the 2011
production year. The increase is mostly due to a slightly bigger crop, high increases in the cost of electricity,
water tax, reparations and maintenance of tractors, vehicles and implements, as well as fuel prices, all
increasing by double digits since 2010. Other cost components increased less in line with inflation. However,
the composition of expenditure has remained largely unchanged, with labour still representing the biggest
component-41% for the 2011 production year. Mechanisation, direct cost, general expenses and fixed
improvements represent 21%, 18%, 18% and 2% respectively of cash expenditure. Although small
differences occur from year to year, the trend has nevertheless been for all components relative to each
other to become increasingly expensive.
Figure 5.1: Percentage composition of annual cash expenditure-industry average, NAMC (MERC 2011)
Grapes
Dried grapes and table grapes production declined leading to a 16% drop in export volumes to Europe.
Between 2004 and 2011 the overall production cost of wines increased by 7%, cash expenditure in terms of
operational costs increased by 9%, labour by 41%. The age composition of vineyards has deteriorated since
2004. More than 13% of the surface planted to vines is older than 20 years and only 11% of the vines in an
NAMC sample study are 3 years and younger. The deterioration in the age composition has been clearly
noticeable since 2004-a clear indication that producers are defaulting on capital maintenance in an attempt
to survive financially. This will impact on future production.
Following the record season of 2009/10, the total table and dried grape crop declined from almost 546 000
tons to below 446 000 tons in 200/11. This is the third smallest crop in the past ten years and can be
attributed to a decline in area planted, as well as lower yields caused by adverse weather conditions. Total
area planted to table and dried grapes decreased from 23 172 ha in 2010 to 22 309 ha in 2011. The total
0%5%
10%15%20%25%30%35%40%45%50%
2004 2005 2006 2007 2008 2009 2010 2011
Direct cost
Labour
Mechanisation
Fixedimprovements

13
area is projected to shrink to less than 22 000 ha in 2014, where after it is expected to increase steadily to
reach 22 436 ha in 2021.
The smaller crop of 2010/11 led to a 12% decline in fresh grape exports, with supply to the European
market down by 16%. Europe remains South Africa’s most prominent export destination, accounting for just
less than 80% of SA fresh grape exports. Lower supply levels resulted in a 13% increase in the average
export price, from R13 662/ ton in the 2009/10 season to R15 467/ ton in 2010/11. In response to the surge
in prices the previous season and due to a relatively large crop this season, exports reached a record peak of
245 780 tons (or 55 million cartons) in the 2011/12 season, i.e. a 22% increase from 201 500 tons in
2010/11. The domestic market remains strong as prices increased on average by 10% in 2010/11 despite
the 10% increase in volume traded. Supply to the local market is estimated slightly higher in 2011/12
compared to the previous season with price increases of roughly 6% to 8.4%.
Apples & Pears
The area planted to bearing apple trees (i.e. trees four years and older) is projected to continue its upward
trend, increasing by 470 hectares in 2012. Assuming average yields, total apple production is projected at
790 830 tons in 2012, up 3% from the previous year. The upward trend in bearing acreage is projected to
continue until 2021, up 1 141 hectares. Production is projected to follow a similar increasing trend with
total crop forecast at 830 000 tons in 2021.
The average price for fresh apples exported in 2011 increased by 6% year-on-year, despite total southern
hemisphere exports peaking at 1 762 010 tons, the second largest supply from the southern hemisphere to
date. The price increase can be attributed to the previous year, but also the continued shift in South Africa’s
export destination. The share of South African apples exported to Europe declined from over 60% in 2006 to
41% in 2011. A key growth area is Africa with exports to the continent increasing by 102% over the past four
years. In 2011, 24% of total South African apple exports were destined for the African market. Export prices
are projected to jump on average by 16% in 2012, from R6 434/ton to R7 456/ton, as a number of factors
come into play. Until 2020 prices of deciduous fruits are expected to increase in nominal terms.
Figure 5.2: Trends in export prices of apples and pears in nominal terms, BFAP 2012
The domestic market for apples exceeded expectations in 2011, with a price increase of 18% despite a 4%
increase in volume traded. These price increases are projected to soften over the next few years. BFAP
0
2000
4000
6000
8000
10000
12000
14000
2000 2005 2010 2015 2020 2025
R/t
on
SA apple export price (nominal) SA pear export price (nominal)

14
simulated the local market price at R5 323/ton for 2012, up 5% from 2011. Prices are projected to remain
under pressure in real terms up to 2014 as increasing supply is coupled with slow economic growth. From
2015 onwards stabilising supply levels and economic growth rates around 4% are projected to provide some
stimulus to prices leading to real price gains in the order of 2%. The domestic market for pears remains
small, below 70 000 tons. The price of pears sold locally is estimated to increase by 7% in 2012, supported
by low supply and relatively high prices for processing pears.
Vegetables
The trends and figures reported are based on the FNB weekly report of 14 September 2012.
Tomatoes
Tomato prices increased sharply due to decreased supplies on markets. Prices increased by a whopping
36.7% w/w and 16.0% y/y, closing the week at R4.804 per ton.
Potatoes
Potato prices increased marginally due to limited supplies on markets. Prices were up 1.6% w/w but still
19.8% lower y/y, closing the week at R2 629/ton. Volumes traded were down by 6.5% w/w but still 29.2%
higher y/y, closing the week at 13.936 tons.
Onions
Onion prices increased sharply due to limited supplies on markets. Prices reached R2 218/ton, up 10.0%
w/w and 22.0% y/y. Volumes traded were down 24.9% w/w but still 9.3% higher y/y, closing the week at 5
019 tons.
Carrots
Carrot prices posted marginal gains due to decreased supplies and limited uptake on markets. Prices were
up 1.3% w/w but till 17.5% lower y/y, closing the week at R2 516/ton. Volumes traded reached 1 518 tons,
down 12.2% w/w but still 13.0% higher y/y. Prices are however expected to improve somewhat in the short
term on improved demand.
Cabbages
Cabbage prices continued to drift lower on the back of higher volumes and softer demand on markets.
Weekly cabbage prices fell by 4.1% w/w but still 3.4% higher y/y, closing the week at R1 441/ton. Volumes
traded reached 1 395 tons, down 0.8% w/w but still 2.0% higher y/y. Prices are expected trend sideways on
moderation in demand in the short term
15
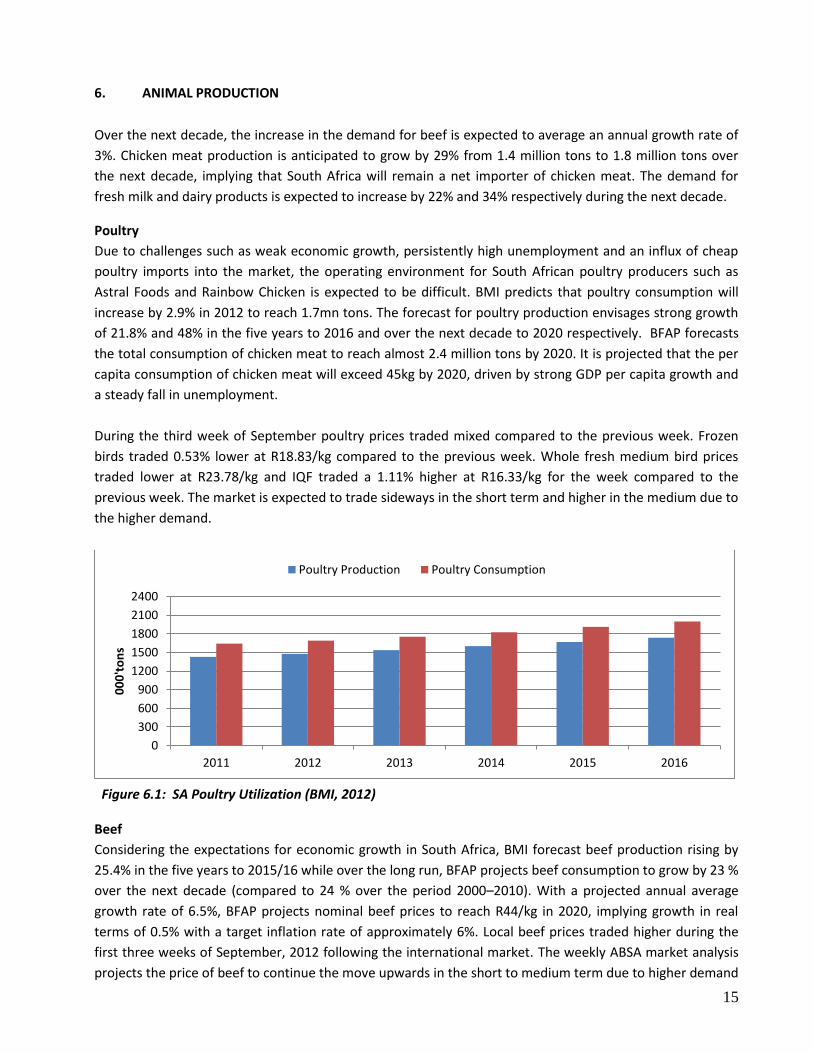
6. ANIMAL PRODUCTION
Over the next decade, the increase in the demand for beef is expected to average an annual growth rate of
3%. Chicken meat production is anticipated to grow by 29% from 1.4 million tons to 1.8 million tons over
the next decade, implying that South Africa will remain a net importer of chicken meat. The demand for
fresh milk and dairy products is expected to increase by 22% and 34% respectively during the next decade.
Poultry
Due to challenges such as weak economic growth, persistently high unemployment and an influx of cheap
poultry imports into the market, the operating environment for South African poultry producers such as
Astral Foods and Rainbow Chicken is expected to be difficult. BMI predicts that poultry consumption will
increase by 2.9% in 2012 to reach 1.7mn tons. The forecast for poultry production envisages strong growth
of 21.8% and 48% in the five years to 2016 and over the next decade to 2020 respectively. BFAP forecasts
the total consumption of chicken meat to reach almost 2.4 million tons by 2020. It is projected that the per
capita consumption of chicken meat will exceed 45kg by 2020, driven by strong GDP per capita growth and
a steady fall in unemployment.
During the third week of September poultry prices traded mixed compared to the previous week. Frozen
birds traded 0.53% lower at R18.83/kg compared to the previous week. Whole fresh medium bird prices
traded lower at R23.78/kg and IQF traded a 1.11% higher at R16.33/kg for the week compared to the
previous week. The market is expected to trade sideways in the short term and higher in the medium due to
the higher demand.
Figure 6.1: SA Poultry Utilization (BMI, 2012)
Beef
Considering the expectations for economic growth in South Africa, BMI forecast beef production rising by
25.4% in the five years to 2015/16 while over the long run, BFAP projects beef consumption to grow by 23 %
over the next decade (compared to 24 % over the period 2000–2010). With a projected annual average
growth rate of 6.5%, BFAP projects nominal beef prices to reach R44/kg in 2020, implying growth in real
terms of 0.5% with a target inflation rate of approximately 6%. Local beef prices traded higher during the
first three weeks of September, 2012 following the international market. The weekly ABSA market analysis
projects the price of beef to continue the move upwards in the short to medium term due to higher demand
0
300
600
900
1200
1500
1800
2100
2400
2011 2012 2013 2014 2015 2016
00
0't
on
s
Poultry Production Poultry Consumption

16
in the market place and possible shortages in the C-class. Weaner prices are forecast to move sideways in
the short term with an upward movement in the medium term due to higher demand.
Figure 6.2: South Africa Beef & Veal Utilization (BMI, 2012)
Pork
Consumption is expected to decline slightly in 2012 in response to decreasing beef prices, before gradually
increasing over the next decade to 2020. However, South Africa is expected to remain a net importer of
pork. BFAP projects pork imports to increase to ± 35 000 tons by 2020. In the medium term to 2016, BMI
forecasts pork production to increase by 20.2% over the next five years to 2016 while pork consumption will
grow by 5.2% in 2012 and by 29.3% in the five years to 2016.
During the third week of September 2012, local pork prices traded higher compared to the first two weeks
of the month. According to ABSA the demand for pork is steady with varying demand for weekly
slaughtering. The prices are expected to move sideways in the short term with an upward movement in the
medium term due to possible shortages in the industry.
Figure 6.3: Pork Production & consumption (BMI, 2012)
830
840
850
860
870
880
890
900
2011 2012 2013 2014 2015 2016
00
0't
on
s
Beef & Veal Production Beef & Veal Consumption
0
50
100
150
200
250
2011 2012 2013 2014 2015 2016
00
0,t
on
s
Pork production Pork consumption

17
Dairy Products
Despite volatility in prices, the industry is constantly expanding due to the growing demand for dairy
products. Over the past decade, the industry grew by 25%, with total consumption of dairy products
increasing from 2.1 million tons in 2001 to 2.68 million tons in 2011. With the milk/feed price ratio declining
significantly in 2011 and 2012 as a result of increased feed prices, production remained virtually unchanged
in 2011, before an expected increase of only 1% in 2012 following improved demand for dairy products.
Following a marginal decrease in 2011, the producer price of milk is expected to increase in 2012 on the
back of increased feed costs and greater demand for milk products as consumers’ disposable income
increase. The price is expected to grow at an average rate of 7.8% per year over the next decade, resulting
in an average price increase of ± 1.8% per year in real terms.
The price of butter and whole milk powder is expected to increase at an average of 5.9% and 6.2% per year
respectively, resulting in prices remaining relatively constant in real terms. Since the average economic
growth rate over the baseline period is projected to be lower than the past decade, the growth in the
demand for dairy products is expected to slow down to an annual average increase of 3.3% per year,
compared to 5% over the past decade. Consumption of fresh milk is expected to increase at an annual
average of 2.2% per annum over the next decade, compared to 2.5% per annum over the past decade.
Wool
Since 2002, South Africa experienced a consistent decline in wool production until a slight increase in 2009.
There was a 5.4% decline in wool production in South Africa in 2010 as compared to 2009. There was a
slight decline in average auction prices of wool in 2009 at approximately R28 000 per ton. In 2010 year,
auction prices of wool attained a peak at approximately R35 000 per ton. Between 2006 and 2007 years,
gross value of wool production increased and a peak was attained in 2010 at a gross value of R1.4 million.
The lowest levels of gross value of wool production were attained in 2001 at approximately R600 000. An
increase of 13.2% in gross value of wool production in South Africa compared to 2009 was recorded.
Figure 6.4: Price Movement for good quality wool per micron: (CMW, 2012)
0
2000
4000
6000
8000
10000
12000
25
-Ap
r
09
-May
23
-May
06
-Ju
n
15
-Au
g
29
-Au
g
06
-Se
p
12
-Se
p
19
-Se
p
19 MICRON 21 MICRON ZAR Price
18
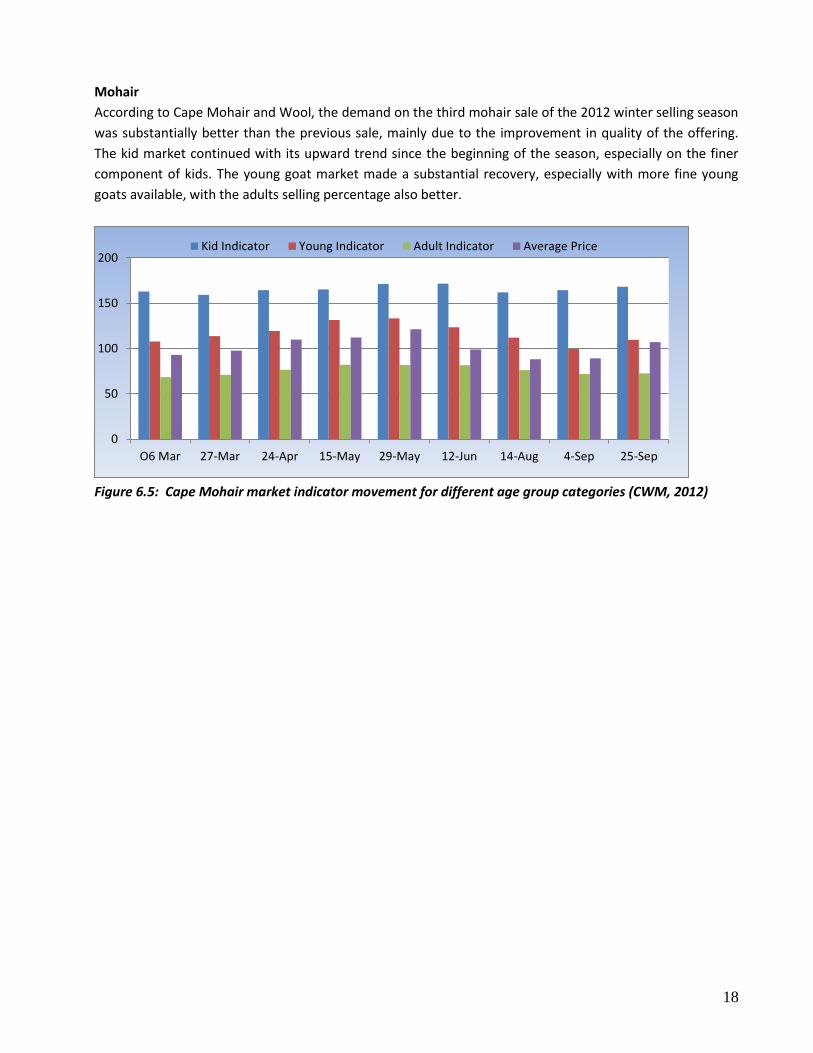
Mohair
According to Cape Mohair and Wool, the demand on the third mohair sale of the 2012 winter selling season
was substantially better than the previous sale, mainly due to the improvement in quality of the offering.
The kid market continued with its upward trend since the beginning of the season, especially on the finer
component of kids. The young goat market made a substantial recovery, especially with more fine young
goats available, with the adults selling percentage also better.
Figure 6.5: Cape Mohair market indicator movement for different age group categories (CWM, 2012)
0
50
100
150
200
O6 Mar 27-Mar 24-Apr 15-May 29-May 12-Jun 14-Aug 4-Sep 25-Sep
Kid Indicator Young Indicator Adult Indicator Average Price

19
7 CONCLUSIONS
Whilst the global outlook is characterised by heightened uncertainty, weak growth and declining consumer
confidence, the sub-Saharan economy is projected to increase at 5% in 2012 benefiting from production
boosts in a number of African countries. By 2050 the world population will reach 9 billion, with the demand
for food including meat and meat products to increase by at least 70%.
However, food security remains a challenge, also in Africa, despite recent growth. More research,
development and technology transfer is needed to improve the profitability for resource poor farmers to
participate in well-defined commercial markets. The ARC has a role in defining and conducting research that
address the challenges of specifically resource poor and commercial farmers on the continent, research that
impact on job creation and rural development.
The prospects for agribusiness are improving globally and locally. An increasing role for biofuels is projected
in the long-term, which together with food security concerns will make agricultural R&D a priority. The ARC
should play a role in enhancing productivity, growth and competitiveness across a spectrum of value chains.
Import volumes continue to raise alongside declining export volumes. Recession in Europe and economic
slowdown in Asia would worsen the situation as demands from those regions for other countries’ exports
would be slow. South Africa would be affected as both countries are her major export markets. South Africa
has the largest and most efficient agricultural sector in Sub-Saharan Africa by far. The country is expected to
contribute to feeding the rest of the continent. This expectation relates to the advanced technology
developed by South African Research Institutions and applied across the country. The Agricultural Research
Council with its extensive research know-how has a key role to play in the agricultural research
development thrust of the continent.
Despite a constant increase in South African meat production, quantities produced are still below demand
and particularly beef, pork and poultry are imported, indicating a local growth potential for production.
With nearly 80% of South Africa’s agricultural land almost solely suitable for extensive livestock production,
and significant untapped communal reserves, there is extensive scope for improved meat production. A
particularly undeveloped area is the 86% of smallholder farmers that have cattle. If the ARC can expand its
research and development focus on these farmers to produce quality livestock with better feed efficiency
and growth, it would address poverty, rural development, food security and commercial output. South
Africa is also a net importer of pork with significant opportunities for new prospective producers to enter
this market. The ARC could play a leading role in capacitating these producers.