
September 2009 Quarterly Research ReportSEPTEMBER 2009 QUARTERLY RESEARCH REPORT Eric J Petroff CFA...
33
SEPTEMBER 2009 QUARTERLY RESEARCH REPORT SEATTLE LOS ANGELES Eric J Petroff CFA SEATTLE 999 Third Avenue Suite 4200 Seattle, Washington 98104 206.622.3700 telephone 206.622.0548 facsimile LOS ANGELES 2321 Rosecrans Avenue Suite 2250 El Segundo, California 90245 310.297.1777 telephone 310.297.0878 facsimile Eric J. Petroff, CFA Director of Research [email protected]
Transcript of September 2009 Quarterly Research ReportSEPTEMBER 2009 QUARTERLY RESEARCH REPORT Eric J Petroff CFA...
SEPTEMBER 2009 QUARTERLY RESEARCH REPORT
SEATTLE LOS ANGELESEric J Petroff CFA SEATTLE999 Third AvenueSuite 4200Seattle, Washington 98104206.622.3700 telephone206.622.0548 facsimile
LOS ANGELES2321 Rosecrans AvenueSuite 2250El Segundo, California 90245310.297.1777 telephone310.297.0878 facsimile
Eric J. Petroff, CFADirector of [email protected]
Table of Contents
I. Goal of this Report & Wurts’ Philosophy on Strategic Asset Allocation: Pages 3-4
II. Major Asset Class Returns & Review of Recent Strategic Initiatives: Pages 5-6
III. Key Macroeconomic Factors & Update on Societal Leverage: Pages 7-8
IV. Analysis of CBO Forecast & Fiscal Implications: Pages 9-12
V Effects of Debt & Taxes on Future GDP Growth: Pages 13-14V. Effects of Debt & Taxes on Future GDP Growth: Pages 13 14
VI. Velocity of Money: Page 15
VII. Effects of Economic Volatility on Key Risk Factors: Page 16
VIII. Scenario Analysis & Strategic Portfolio Implications: Page 17
IX. Summary of Macroeconomic Analysis: Page 18
X. Fundamental & Technical Analysis of Major Asset Classes: Pages 19-25
XI. Topical Issues (Active Managers, Real Estate, & Gold): Pages 26-28
XII. Concluding Thoughts: Page 29
2
XIII. Appendix: Pages 30-33

Report Overview
Goal of the Quarterly Research Report
The whole point of providing advice for a living is to give good advice. We believe good advice is rationally deduced, thoughtfullyconsidered, and grounded in scientific process. This means we must avoid focusing on the short term which always plays outrandomly and unpredictably, and instead look forward over the long term where we can achieve a reasonable degree ofcertainty. We must create a balance between action and inaction in order to offer truly useful advice.
We believe a top down view of economic and capital markets conditions is the appropriate starting point for institutionalinvestors managing either long term or perpetual pools of assets. Thereafter appropriate courses of action can be formulated tocapitalize on long term trends and implemented through investment managers.p g p g g
History tells us aggregate risk exposures are the primary drivers of returns, and therefore should warrant the bulk of planningefforts. This is the goal of this report, to educate our clientele and help make the best policy decisions possible for their uniquereturn needs.
3

Report Overview
Wurts & Associates’ Philosophy on Strategic Asset Allocation
We believe the most important service a consultant can provide its clientele is guidance in structuring an asset allocation policythat not only incorporates unique return needs, but is reflective of prevailing macroeconomic and capital markets conditions. Inour estimation, static portfolio structure is an ineffective means of managing risk and achieving goal returns. So we believedynamic portfolios are necessary. The challenge is judiciously responding to changes in capital markets while avoiding fruitlessmarket timing activities.
We believe market timing can be defined as any action designed to capitalize on short term movements in capital markets, or animplicit attempt to anticipate changes in investor sentiment. This of course is not a systematically achievable goal.p p p g y y g
Instead we believe a straightforward approach of marginally shifting away from expensive assets and into cheap ones offers ameans to systematically outperform a static approach to asset allocation. We do not see this as market timing, but view it assimply taking a rational long term approach to investing. This philosophy could be perceived as contrarian in nature asopportunities are invariably created when investors flee certain asset classes, and vice versa. However, this is merely acoincidence that results from our process, which is far more thoughtful.p , g
When formulating our views and recommendations, we strive to be objective and scientific, focusing on equity valuations, fixedincome yields, credit spreads, inflationary expectations, government policies, and overall macroeconomic conditions in relationto historic norms and averages. We believe this approach not only serves to maximize expected returns through the acquisition ofattractively priced assets, but also minimizes downside potential by avoiding lofty valuations that inevitably correct.
Because capital markets conditions are ever changing, our opinions will be ever changing as well, meaning the market dictatesthe pace of change in asset allocation policy, not an arbitrary timeframe.
4

Major Asset Class Returns
19 5
22.4
Barclays Credit
Barclays High Yield
Major Asset Class Returns Over the Last Year - Sept 2009
9 7
11.7
DJ Wilshire REIT
MSCI Emerging
Major Asset Class Returns Over the Last 10 Years - Sept 2009
8.1
10.6
19.4
19.5
Barclays Agency
Barclays Aggregate
MSCI Emerging
Barclays Credit
6.3
6.5
8.1
9.7
DJ UBS Commodity
Barclays Credit
Russell 2000 Value
DJ Wilshire REIT
(1.9)
(1.3)
3.8
6.3
Russell 1000 Growth
HFR FOF
MSCI EAFE
Barclays Treasury
6.2
6.2
6.3
6.3
Barclays Agency
Barclays Treasury
Barclays High Yield
Barclays Aggregate
(10 6)
(9.6)
(6.9)
(6.3)
R ll 1000 V l
Russell 2000
S&P 500
Russell 2000 Growth
3.0
4.9
5.2
ll l
MSCI EAFE
Russell 2000
HFR FOF
(29.4)
(23.7)
(12.6)
(10.6)
DJ Wilshire REIT
DJ UBS Commodity
Russell 2000 Value
Russell 1000 Value
(2.6)
(0.2)
1.1
2.6
Russell 1000 Growth
S&P 500
Russell 2000 Growth
Russell 1000 Value
-40 -20 0 20 40 -10 -5 0 5 10 15
5
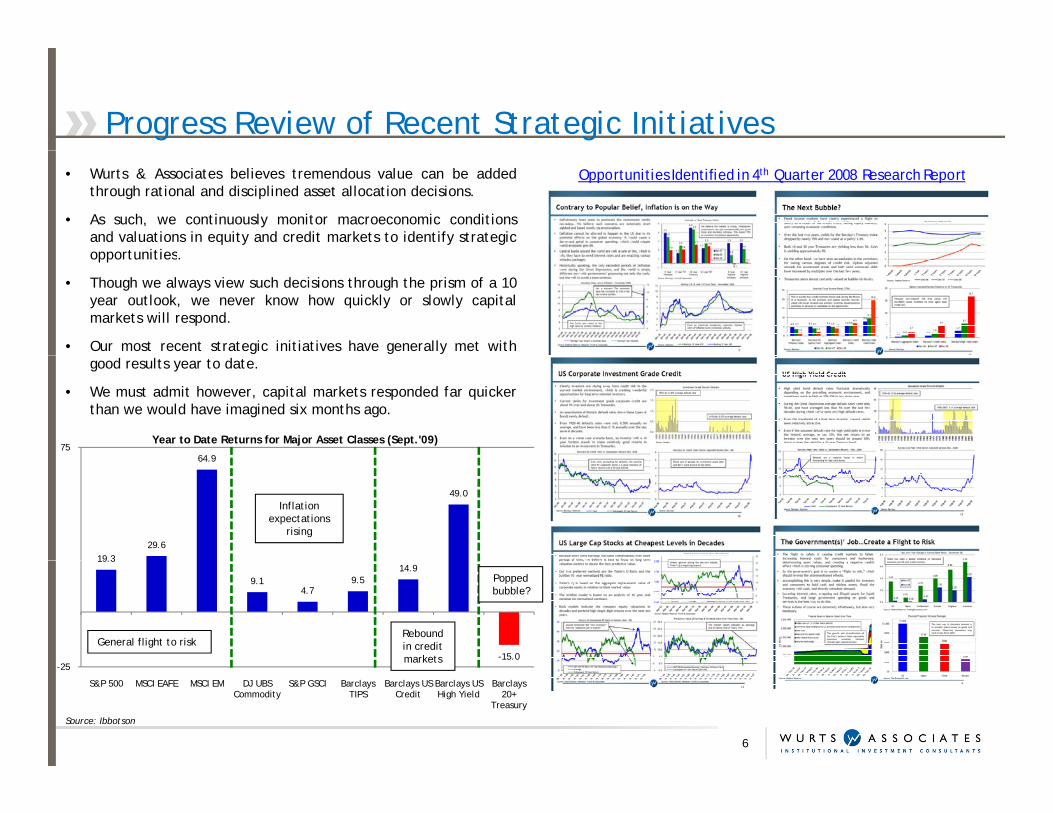
Progress Review of Recent Strategic Initiatives• Wurts & Associates believes tremendous value can be added
through rational and disciplined asset allocation decisions.
• As such, we continuously monitor macroeconomic conditionsand valuations in equity and credit markets to identify strategicopportunities
Opportunities Identified in 4th Quarter 2008 Research Report
opportunities.
• Though we always view such decisions through the prism of a 10year outlook, we never know how quickly or slowly capitalmarkets will respond.
• Our most recent strategic initiatives have generally met with
64 975
Year to Date Returns for Major Asset Classes (Sept.'09)
good results year to date.
• We must admit however, capital markets responded far quickerthan we would have imagined six months ago.
19.329.6
64.9
49.0Inflation
expectations rising
19.3
9.14.7
9.514.9
-15.02
General flight to riskRebound in credit markets
Popped bubble?
-25
S&P 500 MSCI EAFE MSCI EM DJ UBS Commodity
S&P GSCI Barclays TIPS
Barclays US Credit
Barclays US High Yield
Barclays 20+
Treasury
Source: Ibbotson
6

Setting the Stage for an Economic Rebound (and inflation)
• As noted in last quarter’s report, it appeared as if we werereaching the lower bounds of economic activity. Since thenFed Chairman Bernanke announced his belief we had reachedan inflection point in this recession, and that it may havealready ended but has yet to show up in GDP data.
2 7 2 5
10
20 Growth Rates of Key Macroeconomic Factors (Jun. '09)
Last 1 Year
Last 20 Years
• We know there is tremendous political attention being paid toreinvigorating the economy, not to mention trillions instimulus of one form or another. Moreover, it is only naturalfor economic activity to revert to the mean over time and weknow the economy cannot “go to zero.” -11.3
-3.7 -3.8
-1.2
1.4 2.7 2.5 2.8
-10
0
Note the sharp drop off in aggregate supply, well in excess ofdemand. This in itself sets us up for inflation, particularly if
12Rolling 1 Year Average Real GDP Growth Rates (Jun.'09)15
Seasonally Adjusted Unemployment Rate (Sept.'09)
• Therefore, a resumption of economic growth does not reallyseem to be in question. However, the questions of the paceof growth and resulting inflation are of primary concern. Source: Federal Reserve, BLS, BEA, Wurts & Associates
-20
Aggregate Supply Aggregate Demand Real GDP CPI
p , p ydemand returns without a commensurate increase in supply; i.e.,not enough supply of goods and services means higher prices.
610
Aggregate supply and unemployment go hand in hand, which is why we’veseen such a sharp drop in unemployment as businesses take capacity offline.Wage pressure will be inevitable as firms attempt to meet renewed demand.
This is the worst pace of GDP growth we’ve seen in more thanhalf a century. It is just not reasonable to expect a continuationof this trend. People will not tolerate it, and would likelywelcome inflation as opposed to the alternative.
0
Rolling 1 Year Average GDP Growth Rate Average
5
Unemployment Rate Average-6
Rolling 1 Year Average GDP Growth Rate Average0
Unemployment Rate Average
7
Source: BLS, Wurts & Associates Source: BEA, Wurts & Associates
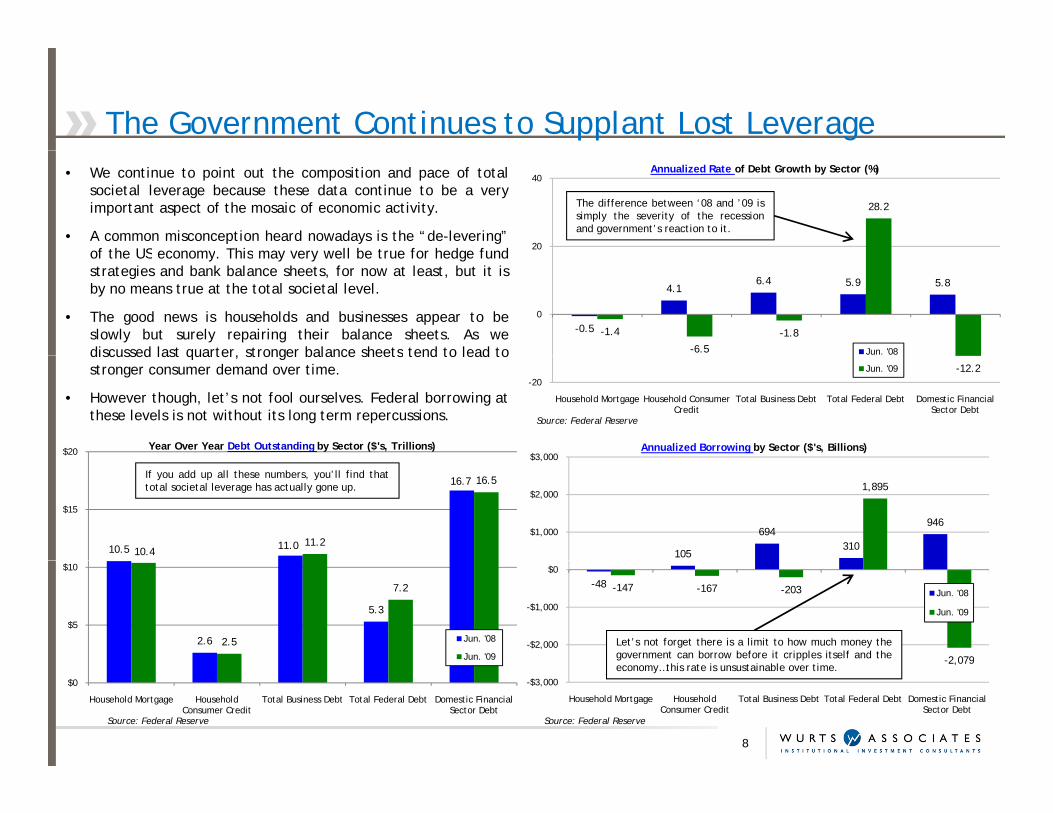
The Government Continues to Supplant Lost Leverage• We continue to point out the composition and pace of total
societal leverage because these data continue to be a veryimportant aspect of the mosaic of economic activity.
• A common misconception heard nowadays is the “de-levering”of the US economy This may very well be true for hedge fund
28.2
20
40Annualized Rate of Debt Growth by Sector (%)
The difference between ‘08 and ’09 issimply the severity of the recessionand government’s reaction to it.
of the US economy. This may very well be true for hedge fundstrategies and bank balance sheets, for now at least, but it isby no means true at the total societal level.
• The good news is households and businesses appear to beslowly but surely repairing their balance sheets. As wediscussed last quarter, stronger balance sheets tend to lead to
-0.5
4.16.4 5.9 5.8
-1.4
-6.5-1.8
0
Jun. '08
Source: Federal Reserve
discussed last quarter, stronger balance sheets tend to lead tostronger consumer demand over time.
• However though, let’s not fool ourselves. Federal borrowing atthese levels is not without its long term repercussions.
-12.2-20
Household Mortgage Household Consumer Credit
Total Business Debt Total Federal Debt Domestic Financial Sector Debt
Jun. '09
$3 000Annualized Borrowing by Sector ($'s, Billions)$20 Year Over Year Debt Outstanding by Sector ($'s, Trillions)
105
694310
946
1,895
$1,000
$2,000
$3,000
10.5 11.0
16.7
10.411.2
16.5
$15
If you add up all these numbers, you’ll find thattotal societal leverage has actually gone up.
-48 -147 -167 -203
-2,079-$2,000
-$1,000
$0
Jun. '08
Jun. '09
2.6
5.3
2.5
7.2
$5
$10
Jun. '08
Jun. '09
Let’s not forget there is a limit to how much money thegovernment can borrow before it cripples itself and the
8
Source: Federal ReserveSource: Federal Reserve
2,079
-$3,000
Household Mortgage Household Consumer Credit
Total Business Debt Total Federal Debt Domestic Financial Sector Debt
$0
Household Mortgage Household Consumer Credit
Total Business Debt Total Federal Debt Domestic Financial Sector Debt
economy…this rate is unsustainable over time.
Though Pleasant to Ponder, the CBO’s Forecast is Unrealistic
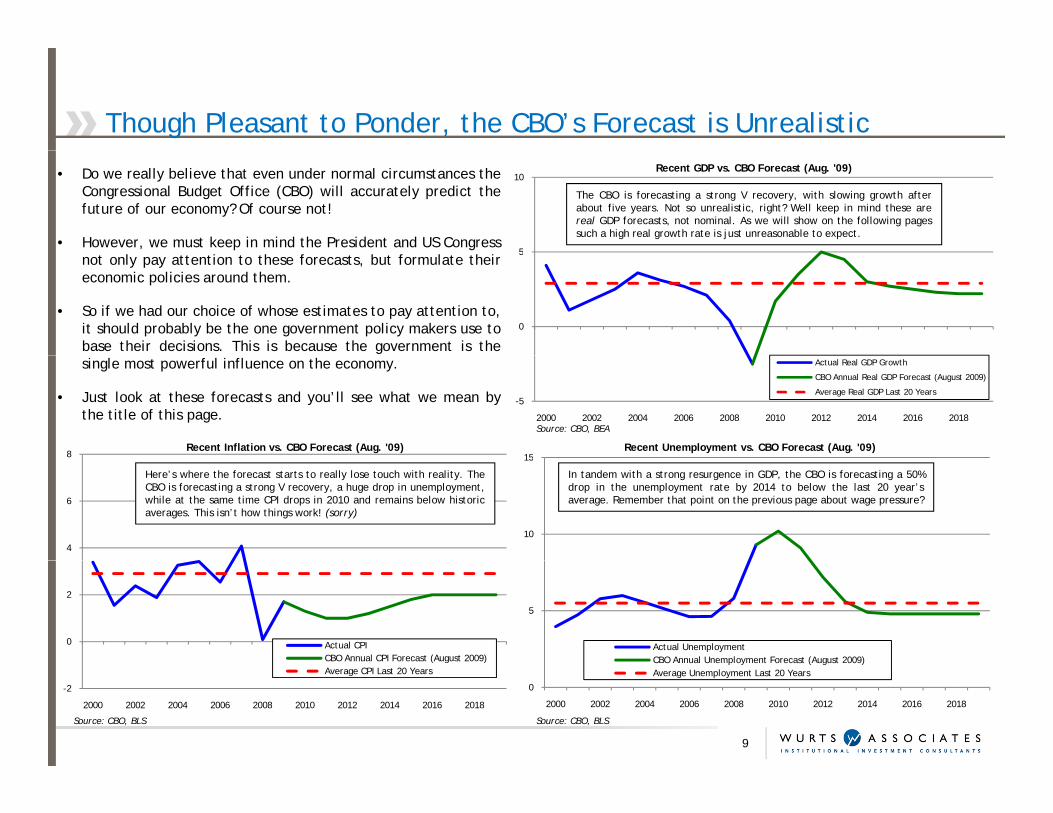
• Do we really believe that even under normal circumstances theCongressional Budget Office (CBO) will accurately predict thefuture of our economy? Of course not!
• However, we must keep in mind the President and US Congress5
10Recent GDP vs. CBO Forecast (Aug. '09)
The CBO is forecasting a strong V recovery, with slowing growth afterabout five years. Not so unrealistic, right? Well keep in mind these arereal GDP forecasts, not nominal. As we will show on the following pagessuch a high real growth rate is just unreasonable to expect.
not only pay attention to these forecasts, but formulate theireconomic policies around them.
• So if we had our choice of whose estimates to pay attention to,it should probably be the one government policy makers use tobase their decisions. This is because the government is the
0
5
single most powerful influence on the economy.
• Just look at these forecasts and you’ll see what we mean bythe title of this page.
Source: CBO, BEA
-5
2000 2002 2004 2006 2008 2010 2012 2014 2016 2018
Actual Real GDP Growth
CBO Annual Real GDP Forecast (August 2009)
Average Real GDP Last 20 Years
15Recent Unemployment vs. CBO Forecast (Aug. '09)
8Recent Inflation vs. CBO Forecast (Aug. '09)
10
15
4
6
In tandem with a strong resurgence in GDP, the CBO is forecasting a 50%drop in the unemployment rate by 2014 to below the last 20 year’saverage. Remember that point on the previous page about wage pressure?
Here’s where the forecast starts to really lose touch with reality. TheCBO is forecasting a strong V recovery, a huge drop in unemployment,while at the same time CPI drops in 2010 and remains below historicaverages. This isn’t how things work! (sorry)
5
Actual UnemploymentCBO Annual Unemployment Forecast (August 2009)
0
2
Actual CPICBO Annual CPI Forecast (August 2009)
9
Source: CBO, BLS Source: CBO, BLS
0
2000 2002 2004 2006 2008 2010 2012 2014 2016 2018
C O ual U e ploy e t o ecast ( ugust 009)Average Unemployment Last 20 Years
-2
2000 2002 2004 2006 2008 2010 2012 2014 2016 2018
( )Average CPI Last 20 Years

The Amount of Government Stimulus is Just Staggering
831
750
1,000 Increase in Monetary Base vs. Estimated Bank Losses (Aug.’09)• A resumption of economic growth seems inevitable when you
consider how much money has been thrown at this problem.
• We have huge growth in the monetary base, the Federal Reserveis printing money to suppress mortgage and Treasury rates, andgovernment spending is slated to go up substantially
The monetary base has only increased by about8 times the amount of expected bank lossesover the next few years. The governmentcannot allow banks to continue sitting on this
100
250
500
$ Bi
llion
s
Annual Increase in Monetary Base
FDIC Insured Institution Estimated Losses
government spending is slated to go up substantially.
• This is yet another instance where investors need to sit back,set aside short term concerns, and think about how this muchstimulus will play out over time. And the answer is throughserious inflationary pressures.
cannot allow banks to continue sitting on thiscapital and will likely “encourage” them to bemore reasonable with consumers than they arenow. Just wait and see.
10 20 18 10
100
-
2007 2008 Aug-09 Total Est. Losses by 2013
• The only way inflation could be averted is through an almostperfectly executed scaling back of stimulus across all spectrumsof the government. What do you think the chances are of thathappening? Source: Federal Reserve, FDIC
27CBO Fiscal Stimulus Projections (Aug. '09)
2.5 Size of Federal Reserve Balance Sheet (Sept.’09)
23
25
1.5
2.0
17
19
21
0.5
1.0
ions
The Federal Reserve has printed about 1 ½ trillion dollars in the last yearto suppress interest rates and bail out banks. The mortgage and Treasurypurchase programs have already been pushed back from their original date.The risk to the housing market is too great to do otherwise anytime soon.
Uh…only about a 25% increase in governmentspending as a percent of GDP.
10
Source: Federal Reserve Source: CBO
15
2000 2002 2004 2006 2008 2010 2012 2014 2016 2018
Historic Total Federal Spending as % of GDP Projected Federal Spending as % of GDP-
$'s,
Tri
ll
Serious Thought Should be Given to the Side Effects of Stimulus
95 7%97.6% 97.9%
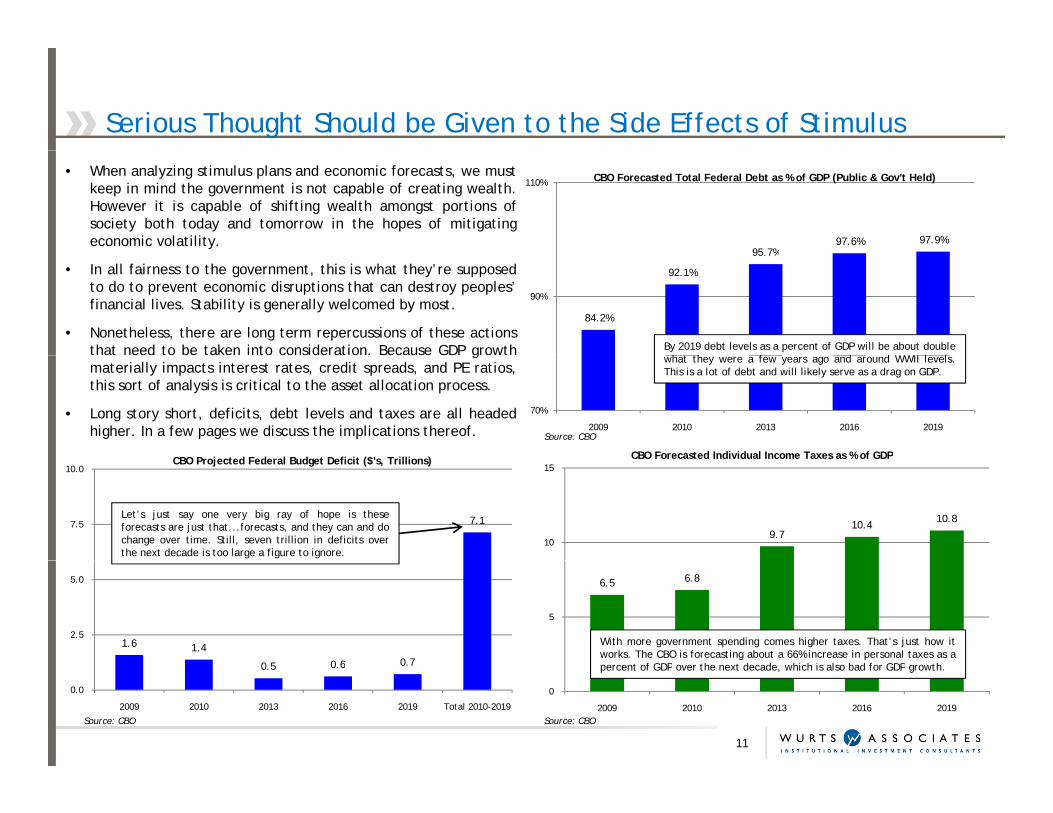
110% CBO Forecasted Total Federal Debt as % of GDP (Public & Gov't Held)• When analyzing stimulus plans and economic forecasts, we mustkeep in mind the government is not capable of creating wealth.However it is capable of shifting wealth amongst portions ofsociety both today and tomorrow in the hopes of mitigatingeconomic volatility.
84.2%
92.1%
95.7%
90%
• In all fairness to the government, this is what they’re supposedto do to prevent economic disruptions that can destroy peoples’financial lives. Stability is generally welcomed by most.
• Nonetheless, there are long term repercussions of these actionsthat need to be taken into consideration. Because GDP growth By 2019 debt levels as a percent of GDP will be about double
h t th f d d WWII l l
70%
2009 2010 2013 2016 2019
gmaterially impacts interest rates, credit spreads, and PE ratios,this sort of analysis is critical to the asset allocation process.
• Long story short, deficits, debt levels and taxes are all headedhigher. In a few pages we discuss the implications thereof. Source: CBO
CBO Forecasted Individual Income Taxes as % of GDPCBO P j t d F d l B d t D fi it ($' T illi )
what they were a few years ago and around WWII levels.This is a lot of debt and will likely serve as a drag on GDP.
9.710.4 10.8
10
15CBO Forecasted Individual Income Taxes as % of GDP
7.17.5
10.0CBO Projected Federal Budget Deficit ($'s, Trillions)
Let’s just say one very big ray of hope is theseforecasts are just that...forecasts, and they can and dochange over time. Still, seven trillion in deficits overthe next decade is too large a figure to ignore.
6.5 6.8
5
1.6 1.4
0 5 0 6 0 7
2.5
5.0
With more government spending comes higher taxes. That’s just how itworks. The CBO is forecasting about a 66% increase in personal taxes as a
f GDP h d d hi h i l b d f GDP h
11
Source: CBO Source: CBO
0
2009 2010 2013 2016 2019
0.5 0.6 0.7
0.0
2009 2010 2013 2016 2019 Total 2010-2019
percent of GDP over the next decade, which is also bad for GDP growth.
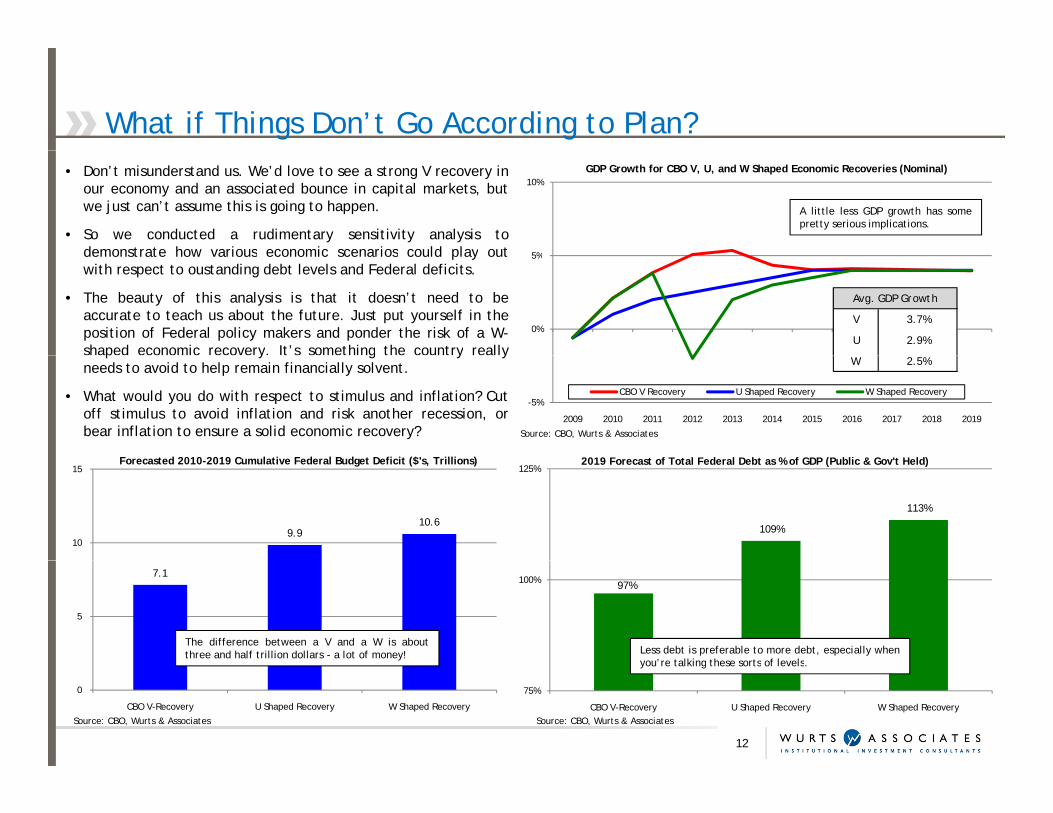
What if Things Don’t Go According to Plan?• Don’t misunderstand us. We’d love to see a strong V recovery in
our economy and an associated bounce in capital markets, butwe just can’t assume this is going to happen.
• So we conducted a rudimentary sensitivity analysis todemonstrate how various economic scenarios could play out 5%
10%GDP Growth for CBO V, U, and W Shaped Economic Recoveries (Nominal)
A little less GDP growth has somepretty serious implications.
demonstrate how various economic scenarios could play outwith respect to oustanding debt levels and Federal deficits.
• The beauty of this analysis is that it doesn’t need to beaccurate to teach us about the future. Just put yourself in theposition of Federal policy makers and ponder the risk of a W-shaped economic recovery. It’s something the country really
0%
5%
V 3.7%
U 2.9%
Avg. GDP Growth
p y g y yneeds to avoid to help remain financially solvent.
• What would you do with respect to stimulus and inflation? Cutoff stimulus to avoid inflation and risk another recession, orbear inflation to ensure a solid economic recovery? Source: CBO, Wurts & Associates
-5%
2009 2010 2011 2012 2013 2014 2015 2016 2017 2018 2019
CBO V Recovery U Shaped Recovery W Shaped Recovery
2019 F t f T t l F d l D bt % f GDP (P bli & G 't H ld)F t d 2010 2019 C l ti F d l B d t D fi it ($' T illi )
W 2.5%
109%
113%
125%2019 Forecast of Total Federal Debt as % of GDP (Public & Gov't Held)
9.910.6
10
15Forecasted 2010-2019 Cumulative Federal Budget Deficit ($'s, Trillions)
97%100%7.1
5
Less debt is preferable to more debt, especially whenyou’re talking these sorts of levels
The difference between a V and a W is aboutthree and half trillion dollars - a lot of money!
12
Source: CBO, Wurts & AssociatesSource: CBO, Wurts & Associates
75%
CBO V-Recovery U Shaped Recovery W Shaped Recovery
0
CBO V-Recovery U Shaped Recovery W Shaped Recovery
you re talking these sorts of levels.
Taxes & GDP - Not a Political Commentary, An Economic Reality
36
38
3
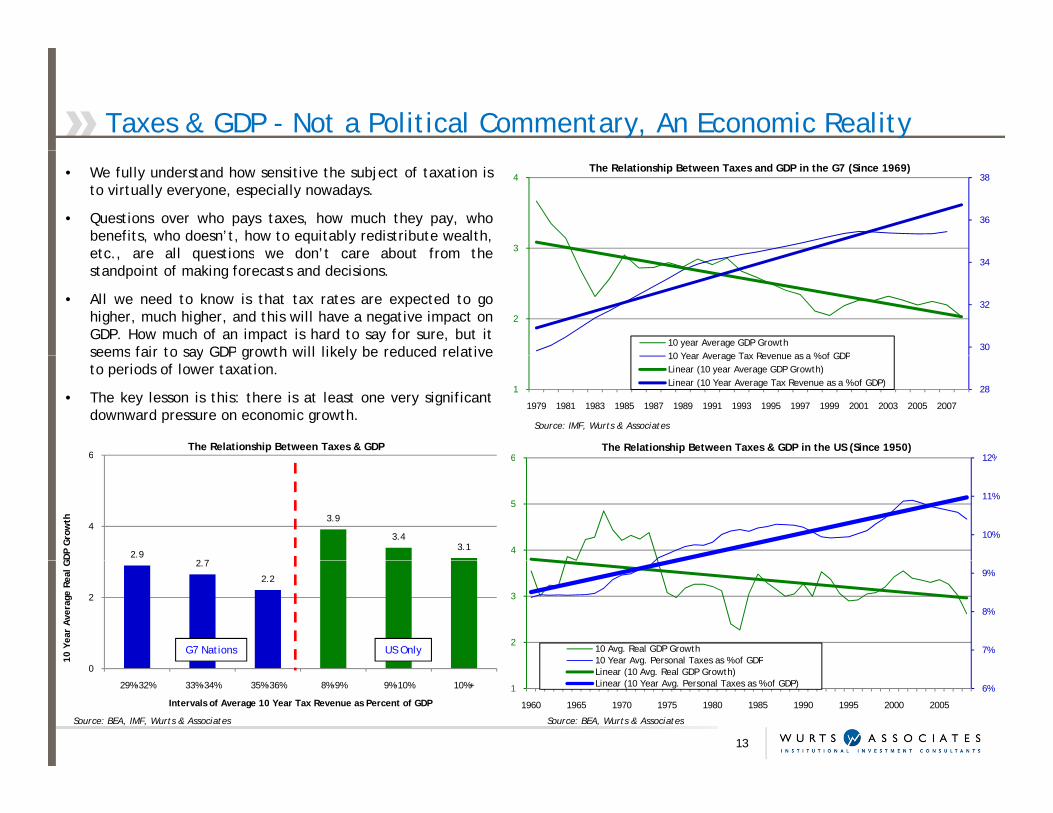
4The Relationship Between Taxes and GDP in the G7 (Since 1969)• We fully understand how sensitive the subject of taxation is
to virtually everyone, especially nowadays.
• Questions over who pays taxes, how much they pay, whobenefits, who doesn’t, how to equitably redistribute wealth,etc are all questions we don’t care about from the
30
32
34
2
10 year Average GDP Growth10 Year Average Tax Revenue as a % of GDP
etc., are all questions we don t care about from thestandpoint of making forecasts and decisions.
• All we need to know is that tax rates are expected to gohigher, much higher, and this will have a negative impact onGDP. How much of an impact is hard to say for sure, but itseems fair to say GDP growth will likely be reduced relative
281
1979 1981 1983 1985 1987 1989 1991 1993 1995 1997 1999 2001 2003 2005 2007
10 Year Average Tax Revenue as a % of GDPLinear (10 year Average GDP Growth)Linear (10 Year Average Tax Revenue as a % of GDP)
12%6The Relationship Between Taxes & GDP in the US (Since 1950)
seems fair to say GDP growth will likely be reduced relativeto periods of lower taxation.
• The key lesson is this: there is at least one very significantdownward pressure on economic growth.
Source: IMF, Wurts & Associates
6The Relationship Between Taxes & GDP
10%
11%
12%
4
5
6
2.92 7
3.9
3.43.1
4
6
GD
P G
row
th
7%
8%
9%
2
3
10 Avg. Real GDP Growth10 Year Avg. Personal Taxes as % of GDP
2.7
2.2
2
10 Y
ear
Ave
rage
Rea
l G
G7 Nations US Only
6%1
1960 1965 1970 1975 1980 1985 1990 1995 2000 2005
10 Year Avg. Personal Taxes as % of GDPLinear (10 Avg. Real GDP Growth)Linear (10 Year Avg. Personal Taxes as % of GDP)
13
Source: BEA, IMF, Wurts & Associates Source: BEA, Wurts & Associates
0
29%-32% 33%-34% 35%-36% 8%-9% 9%-10% 10%+
Intervals of Average 10 Year Tax Revenue as Percent of GDP
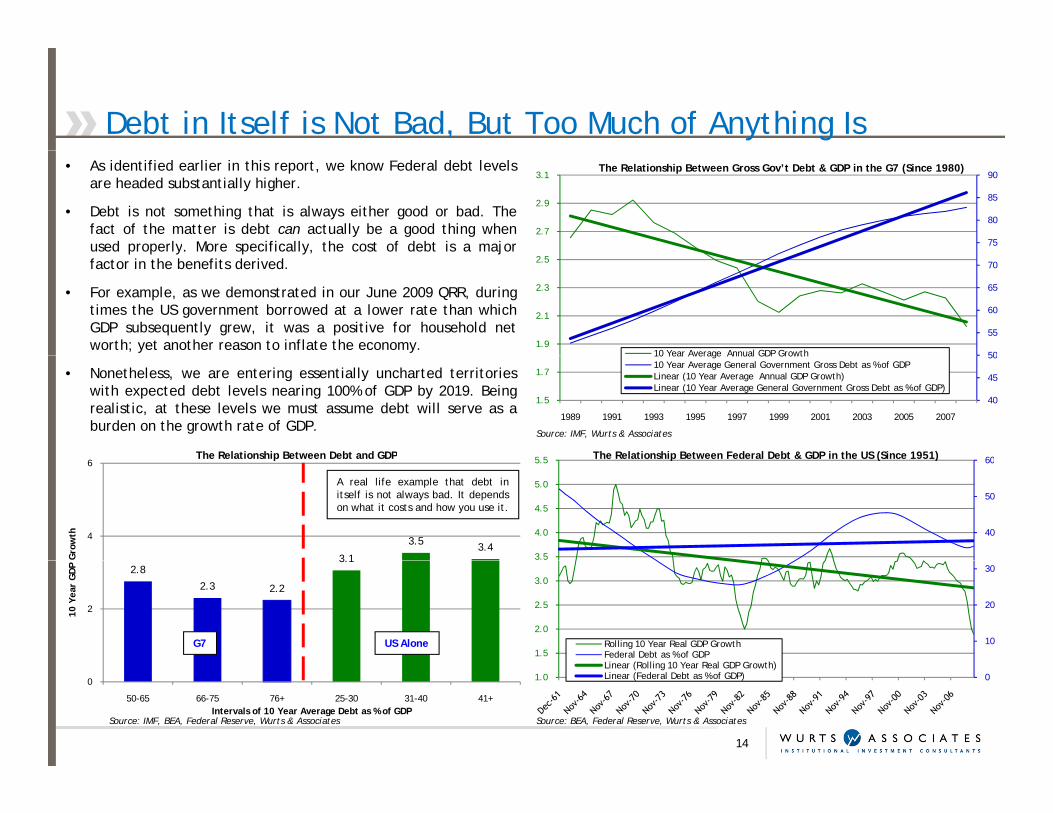
Debt in Itself is Not Bad, But Too Much of Anything Is• As identified earlier in this report, we know Federal debt levels
are headed substantially higher.
• Debt is not something that is always either good or bad. Thefact of the matter is debt can actually be a good thing whenused properly. More specifically, the cost of debt is a major 75
80
85
90
2.7
2.9
3.1The Relationship Between Gross Gov’t Debt & GDP in the G7 (Since 1980)
p p y p y, jfactor in the benefits derived.
• For example, as we demonstrated in our June 2009 QRR, duringtimes the US government borrowed at a lower rate than whichGDP subsequently grew, it was a positive for household networth; yet another reason to inflate the economy.
50
55
60
65
70
1.9
2.1
2.3
2.5
10 Year Average Annual GDP Growth
The Relationship Between Debt and GDP
• Nonetheless, we are entering essentially uncharted territorieswith expected debt levels nearing 100% of GDP by 2019. Beingrealistic, at these levels we must assume debt will serve as aburden on the growth rate of GDP.
Source: IMF, Wurts & Associates
40
45
50
1.5
1.7
1989 1991 1993 1995 1997 1999 2001 2003 2005 2007
10 Year Average Annual GDP Growth10 Year Average General Government Gross Debt as % of GDPLinear (10 Year Average Annual GDP Growth)Linear (10 Year Average General Government Gross Debt as % of GDP)
605 5 The Relationship Between Federal Debt & GDP in the US (Since 1951)
3.1
3.5 3.44
6
Gro
wth
The Relationship Between Debt and GDP
40
50
60
3.5
4.0
4.5
5.0
5.5 The Relationship Between Federal Debt & GDP in the US (Since 1951)
A real life example that debt initself is not always bad. It dependson what it costs and how you use it.
2.8
2.3 2.2
3.1
210 Y
ear
GD
P
G7 US Alone 10
20
30
1.5
2.0
2.5
3.0
Rolling 10 Year Real GDP GrowthFederal Debt as % of GDPLi (R lli g 10 Y R l GDP G th)
0
50-65 66-75 76+ 25-30 31-40 41+Intervals of 10 Year Average Debt as % of GDP
14
Source: IMF, BEA, Federal Reserve, Wurts & Associates Source: BEA, Federal Reserve, Wurts & Associates
01.0Linear (Rolling 10 Year Real GDP Growth)Linear (Federal Debt as % of GDP)

Yet Another Reason to Expect Higher Inflation• One of the primary arguments used by the “anti-inflation”
hawks nowadays is the velocity of money has fallen and thatto make the inflation argument we must predict and provewhat will make it go higher…huh?
• Our response to this argument is what could possibly make10
15
15
20 Growth in Monetary Base vs. Inflation
It’s a fact that money supply and inflation go hand in hand, and as it stands nowinflation should go higher, not lower over the next decade. Is it realistic toexpect the Fed to side step inflation by perfectly timing reductions in moneysupply as velocity increases? It’s not impossible. It’s just not likely.
• Our response to this argument is what could possibly makethe velocity of money stay so low forever? What couldpossibly lead us to believe this fundamentally pervasiveaspect of economic behavior would simply change overnight?
• We are not about to entertain the concept of a sudden newparadigm in the velocity of money Though we believe it will
5
5
10
Rolling 10 Year Growth in Monetary Base
Source: Federal Reserve, BLS, Wurts & Associates
paradigm in the velocity of money. Though we believe it willrevert to historic norms and understand the Fed can alwaysreduce money supply to head off inflation, the question ishow successfully they can do this, and whether they’ll err onthe side of inflation or recession when doing so.
30 Simple Velocity of Money Over Time (Nominal GDP/Monetary Base)
00
Rolling 10 Year Growth in Monetary BaseRolling 10 Year CPI
50Estimates of GDP Levels vs. Velocity of Money
20
25
23 526.9
50
P (B
B's)
Would someone please explain to us the business model by whichbanks make money by not making loans? Sure banks have clampeddown on lending recently, but that cannot and will not last forever.
The crux of our concern – What if the velocity of money reboundsfaster than the Fed can pull money supply out of the system?Well the answer is some serious inflationary pressure.
10
15
Simple Velocity of Money (GDP/Monetary Base)
Average Velocity of Money
16.820.2
23.5
14.2
25
Nom
inal
GD
P
15
5Average Velocity of Money
0
10 12 14 16 Current GDPAssumed Velocity of Money
Source: Federal Reserve, BEA, Wurts & AssociatesSource: Federal Reserve, BEA, Wurts & Associates

Growth is Only One Side of the Equation…Volatility is the Other
0.5
0.6
0.7
6
8
10The Relationship Between GDP Volatility & Federal Debt• As mentioned earlier, one of the most important roles of the
government is to foster economic stability and preventfinancial disruptions to protect the average citizen.
• Most notably this is done by the Federal Reserve via interestrates and money supply. However, it also can be done
Think back to the unpleasantness of the ‘70’s, and the political desire to createa more stable economy. It generally worked. Let’s not forget though, that withleverage comes risk when things get out of control; no free lunch here.
0.2
0.3
0.4
2
4
6
R lli g 5 Y A li d St d d D i ti f GDP
y pp y ,through government deficit spending (or the use of leverage).
• With deficit spending (leverage) going higher, we canreasonably argue this may result in lower economic volatilitythrough greater government influence.
• This is good for key drivers of returns such as credit spreads0.10
Rolling 5 Year Annualized Standard Deviation of GDPRolling 5 Year Federal Debt as % of GDP
• This is good for key drivers of returns such as credit spreadsand PE ratios. But let’s not forget about the susceptibility ofthe economy to “fat tails” when more leverage is involved…acomplication in risk budgeting to be sure.
Source: BEA, Federal Reserve, Wurts & Associates
860The Relationship Between GDP Volatility & Shiller PE Ratios
5.08The Relationship Between GDP Volatility & Credit Spreads
4
5
6
7
40
3.0
4.0
4
6
It’s not a stretch to conclude investors prefer more stable,reliable economic conditions, and will pay a premium forsuch environments…perhaps too much sometimes.
A less volatile economy makes it easy forbusinesses to plan cash flows, therebymaking debt payments more reliable.
1
2
3
4
20
1.0
2.0
2
4
R lli 5 Y A li d S d d D i i f GDP
16
Source: BEA, Shiller Wurts & AssociatesSource: BEA, Moody’s Wurts & Associates
00Shiller PE Ratio Rolling 5 Year Annualized Standard Deviation of GDP
0.00Rolling 5 Year Annualized Standard Deviation of GDPBaa Credit Spread to LT Treasuries
General Implications on Strategy Through Scenario Analysis
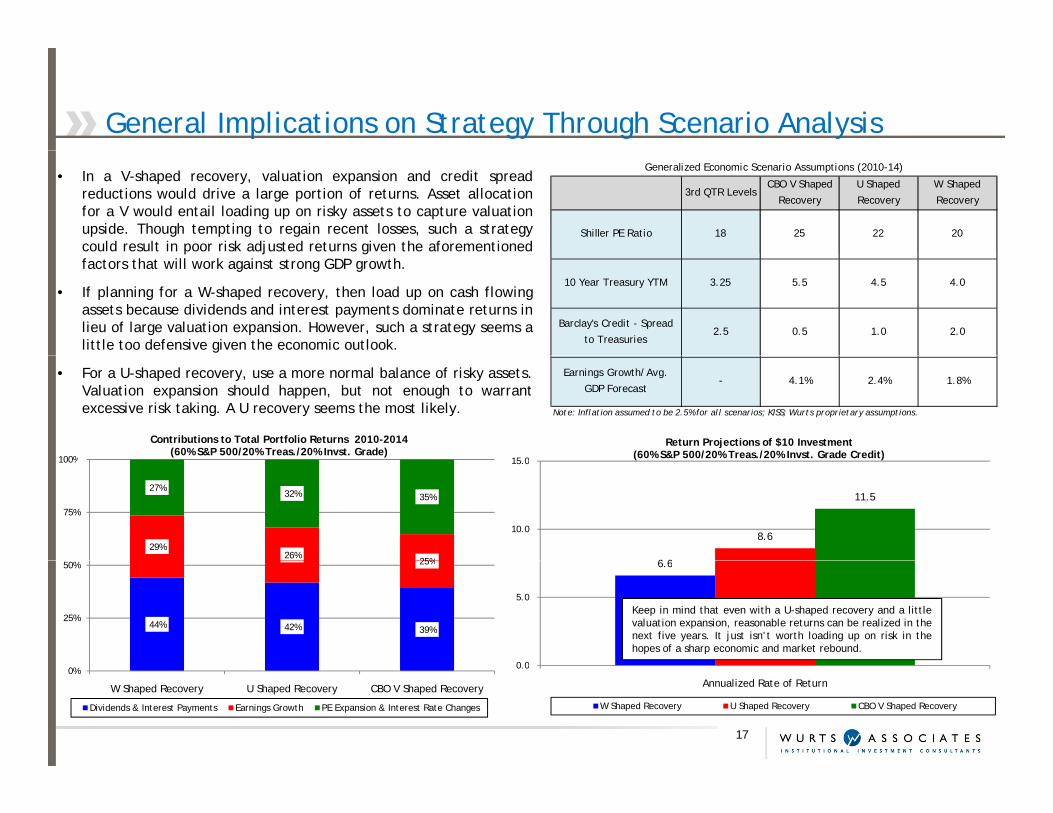
• In a V-shaped recovery, valuation expansion and credit spreadreductions would drive a large portion of returns. Asset allocationfor a V would entail loading up on risky assets to capture valuationupside. Though tempting to regain recent losses, such a strategycould result in poor risk adjusted returns given the aforementioned
3rd QTR LevelsCBO V Shaped
Recovery
U Shaped
Recovery
W Shaped
Recovery
Shiller PE Ratio 18 25 22 20
Generalized Economic Scenario Assumptions (2010-14)
p j gfactors that will work against strong GDP growth.
• If planning for a W-shaped recovery, then load up on cash flowingassets because dividends and interest payments dominate returns inlieu of large valuation expansion. However, such a strategy seems alittle too defensive given the economic outlook.
10 Year Treasury YTM 3.25 5.5 4.5 4.0
Barclay's Credit - Spread
to Treasuries2.5 0.5 1.0 2.0
15 0
Return Projections of $10 Investment (60% S&P 500/20% Treas./20% Invst. Grade Credit)
• For a U-shaped recovery, use a more normal balance of risky assets.Valuation expansion should happen, but not enough to warrantexcessive risk taking. A U recovery seems the most likely.
Earnings Growth/Avg.
GDP Forecast- 4.1% 2.4% 1.8%
Note: Inflation assumed to be 2.5% for all scenarios; KISS; Wurts proprietary assumptions.
100%
Contributions to Total Portfolio Returns 2010-2014(60% S&P 500/20% Treas./20% Invst. Grade)
6 6
8.6
11.5
10.0
15.0(60% S&P 500/20% Treas./20% Invst. Grade Credit)
29%26%
25%
27%32% 35%
75%
100%
6.6
0 0
5.0Keep in mind that even with a U-shaped recovery and a littlevaluation expansion, reasonable returns can be realized in thenext five years. It just isn’t worth loading up on risk in thehopes of a sharp economic and market rebound.
44% 42% 39%
25%
25%
50%
0.0
Annualized Rate of Return
W Shaped Recovery U Shaped Recovery CBO V Shaped Recovery
17
0%
W Shaped Recovery U Shaped Recovery CBO V Shaped Recovery
Dividends & Interest Payments Earnings Growth PE Expansion & Interest Rate Changes

Summary of Macroeconomic ConsiderationsThe Shape of Things to Come
• Seemingly, the economy is reaching its lower bounds of activity. Most would agree a rebound of some form or another isforthcoming. The question is how robust or sustained the recovery will be. The Fed has a delicate balancing act on its hands.
• It is unlikely the CBO’s forecast for a strong V recovery alongside historically low inflation will occur. High debt and tax burdens willmore than likely pull real GDP growth below their expectations. Massive increases in money supply, expansion of the Fed’s balancesheet, and a resurgence in the velocity of money all point to the threat of higher inflation.
• Of course it is possible to see the CBO’s expected recovery take place. However, this would require virtually perfect market timingskills across the entire spectrum of the Federal government to scale back monetary and fiscal policy in sync with increasing GDPgrowth. It is just not realistic to expect such a feat from the government…would be nice though.
• What is more likely is a steady recovery that will eventually begin to produce higher than expected inflation. At such a point the Fedwill be forced to choose between raising rates and risking another recession, or continuing stimulus to sustain a recovery whilerisking higher inflation. What would you do as a policy maker? Err on the side of recession, or inflation?
• The societal cost of a W shaped recovery is likely too much to bear, making the aforementioned choice even easier to make.Coincidentally, inflation will erode the real value of US debt and improve the societal balance sheet. This would be bad for thosey, pwho lent us the money, but inflation risk is part of lending so you can’t feel too sorry for them if this happens.
Implications to Investors
• Planning for a strong V recovery is just not a realistic course of action. Loading up on market risk and/or embracing leverage throughalternatives will likely result in disappointing risk adjusted returns. Don’t forget levered investments need low credit spreads andeasy access to capital and you’re not going to see such an environment without robust and stable economic growtheasy access to capital, and you re not going to see such an environment without robust and stable economic growth.
• A U recovery alongside higher than expected inflation is the most likely outcome. This means a more moderate (normal) allocation torisk, but most importantly exposure to assets that will benefit from inflation. Keep in mind inflation represents a risk to someinvestors (i.e., endowments and foundations) and an opportunity to others (i.e., pension funds with a capped COLA).
• Though undesirable and less likely, a W shaped recovery is possible and would imply a defensive posture. To plan for such an
18
outcome, shy away from risky assets that will not see large valuation expansion and instead focus on those that provide reliable cashflow. The main risk with this strategy is opportunity cost should we see a U-shaped recovery and associated inflation.
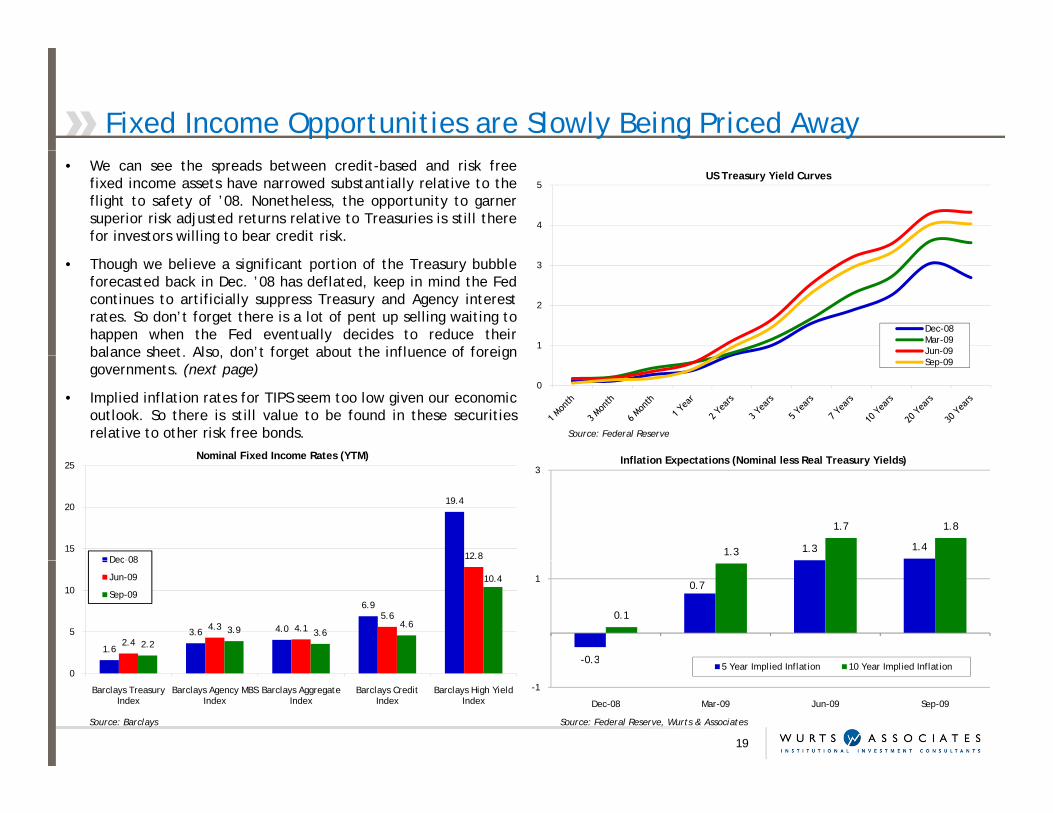
Fixed Income Opportunities are Slowly Being Priced Away • We can see the spreads between credit-based and risk free
fixed income assets have narrowed substantially relative to theflight to safety of ’08. Nonetheless, the opportunity to garnersuperior risk adjusted returns relative to Treasuries is still therefor investors willing to bear credit risk.
4
5US Treasury Yield Curves
• Though we believe a significant portion of the Treasury bubbleforecasted back in Dec. ’08 has deflated, keep in mind the Fedcontinues to artificially suppress Treasury and Agency interestrates. So don’t forget there is a lot of pent up selling waiting tohappen when the Fed eventually decides to reduce theirbalance sheet. Also, don’t forget about the influence of foreign 1
2
3
Dec-08Mar-09Jun-09
Source: Federal Reserve
balance sheet. Also, don t forget about the influence of foreigngovernments. (next page)
• Implied inflation rates for TIPS seem too low given our economicoutlook. So there is still value to be found in these securitiesrelative to other risk free bonds.
0
Sep-09
I fl ti E t ti (N i l l R l T Yi ld )Nominal Fixed Income Rates (YTM)
1.3 1.41.3
1.7 1.8
3Inflation Expectations (Nominal less Real Treasury Yields)
19.4
12.815
20
25Nominal Fixed Income Rates (YTM)
Dec-08
-0.3
0.7
0.1
1
5 Y I li d I fl i 10 Y I li d I fl i
1.6
3.6 4.0
6.9
2.4
4.3 4.15.6
2.2
3.9 3.64.6
10.4
5
10
Dec 08
Jun-09
Sep-09
19
Source: Federal Reserve, Wurts & AssociatesSource: Barclays
0.3
-1
Dec-08 Mar-09 Jun-09 Sep-09
5 Year Implied Inflation 10 Year Implied Inflation0
Barclays Treasury Index
Barclays Agency MBS Index
Barclays Aggregate Index
Barclays Credit Index
Barclays High Yield Index

They’re Nobody’s Fool
45%
50%Percent of Treasury Debt Held by Foreign Official Entities (June '09)• Recently foreign “official” investors (central banks) have been
demanding the US government issue more TIPS instead ofnominal US Treasury bonds, presumably over inflationary fears.
• Additionally, we can also see that foreign investors havedramatically scaled back their holdings of Treasury Notes in
30%
35%
40%dramatically scaled back their holdings of Treasury Notes infavor of Treasury Bills which will do a much better job ofprotecting their assets against losses should inflation occur.
• In addition to inflationary concerns, we must also assume theseinvestors are well aware of the manipulation of the Treasurymarkets by the Fed. Ignoring such actions would be unwise. We should probably keep track of what’s happening with
h lf f i l d b d h i l i
100%Comparison of Foreign Official Holdings of US Debt Over Time 100%
Percent of Foreign Official US Treasury Holdings in T-Notes
25%
Mar-00 Mar-01 Mar-02 Mar-03 Mar-04 Mar-05 Mar-06 Mar-07 Mar-08 Mar-09
y g g
• Foreign investors hold around half of our debt and couldpotentially wield significant influence over our economy, whichis why we are paying attention to these statistics.
Source: US Treasury, Federal Reserve, Wurts & Associates
half of our national debt due to the potential impact oninterest rates and therefore the economy.
88%
79%75%
70%
80%
90%
90%
Relative to just about a year ago, foreign central banks have reduced theirholdings of Treasury Notes by about 13%...talk about market timing! Do youreally think they’d do this without good reason? Doubtful.
46%48% 47%
40%
50%
60%80%
30%
2007 2008 Jun-09
% of Foreign Holdings in T Notes
Percent of Treasury Debt Held by Foreigners70%
% of Foreign Holdings in T Notes
20
Source: US Treasury, Wurts & AssociatesSource: US Treasury, Ibbotson, Wurts & Associates
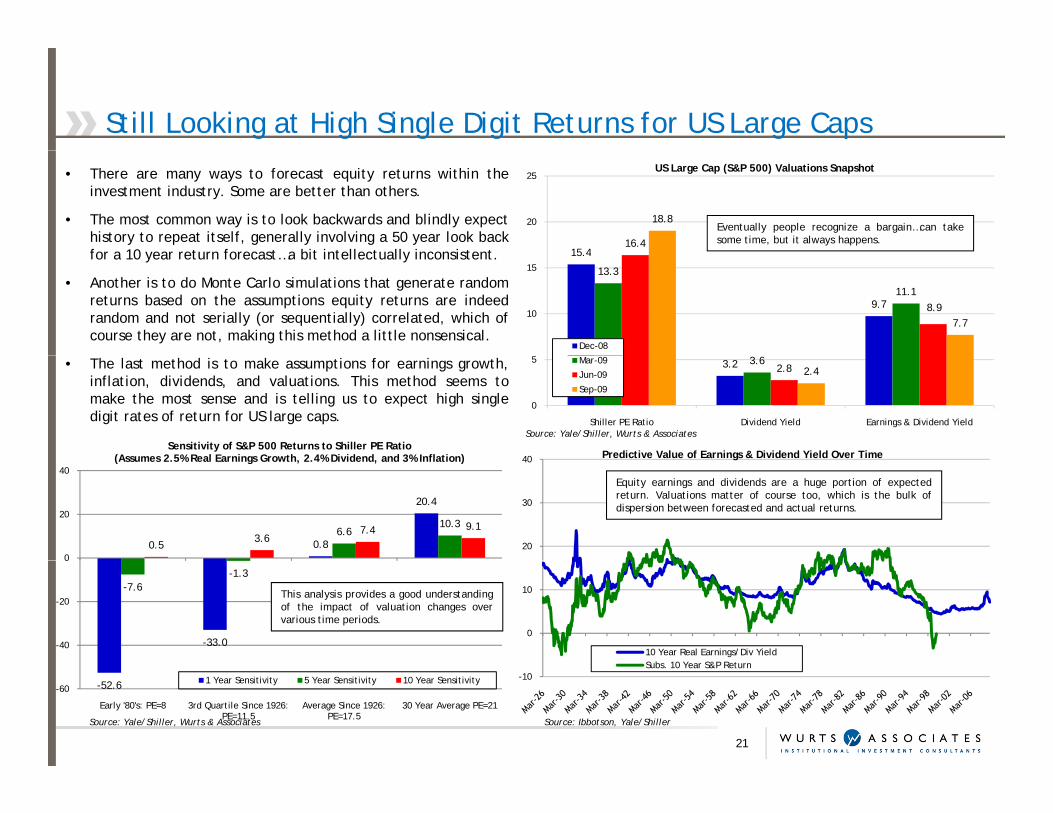
Still Looking at High Single Digit Returns for US Large Caps
• There are many ways to forecast equity returns within theinvestment industry. Some are better than others.
• The most common way is to look backwards and blindly expecthistory to repeat itself, generally involving a 50 year look backfor a 10 year return forecast a bit intellectually inconsistent 15 4
16.4
18.820
25US Large Cap (S&P 500) Valuations Snapshot
Eventually people recognize a bargain…can takesome time, but it always happens.
for a 10 year return forecast…a bit intellectually inconsistent.
• Another is to do Monte Carlo simulations that generate randomreturns based on the assumptions equity returns are indeedrandom and not serially (or sequentially) correlated, which ofcourse they are not, making this method a little nonsensical.
15.4
9.7
13.3
11.18.9
7.710
15
Dec-08
Source: Yale/Shiller, Wurts & Associates
• The last method is to make assumptions for earnings growth,inflation, dividends, and valuations. This method seems tomake the most sense and is telling us to expect high singledigit rates of return for US large caps.
40 Predictive Value of Earnings & Dividend Yield Over TimeSensitivity of S&P 500 Returns to Shiller PE Ratio
(Assumes 2 5% Real Earnings Growth 2 4% Dividend and 3% Inflation)
3.2 3.62.8 2.4
0
5
Shiller PE Ratio Dividend Yield Earnings & Dividend Yield
Mar-09
Jun-09
Sep-09
20
30
40 ed ct ve Value o a gs & v de d eld Ove e
0.8
20.4
6.610.3
0.53.6
7.4 9.1
0
20
40(Assumes 2.5% Real Earnings Growth, 2.4% Dividend, and 3% Inflation)
Equity earnings and dividends are a huge portion of expectedreturn. Valuations matter of course too, which is the bulk ofdispersion between forecasted and actual returns.
0
10
10 Year Real Earnings/Div YieldS b 10 Y S&P R t
-33.0
-7.6-1.3
-40
-20
0
This analysis provides a good understandingof the impact of valuation changes overvarious time periods.
21
Source: Yale/Shiller, Wurts & Associates Source: Ibbotson, Yale/Shiller
-10Subs. 10 Year S&P Return
-52.6-60
Early '80's: PE=8 3rd Quartile Since 1926: PE=11.5
Average Since 1926: PE=17.5
30 Year Average PE=21
1 Year Sensitivity 5 Year Sensitivity 10 Year Sensitivity
How About Technical Analysis on an Institutional Time Horizon?
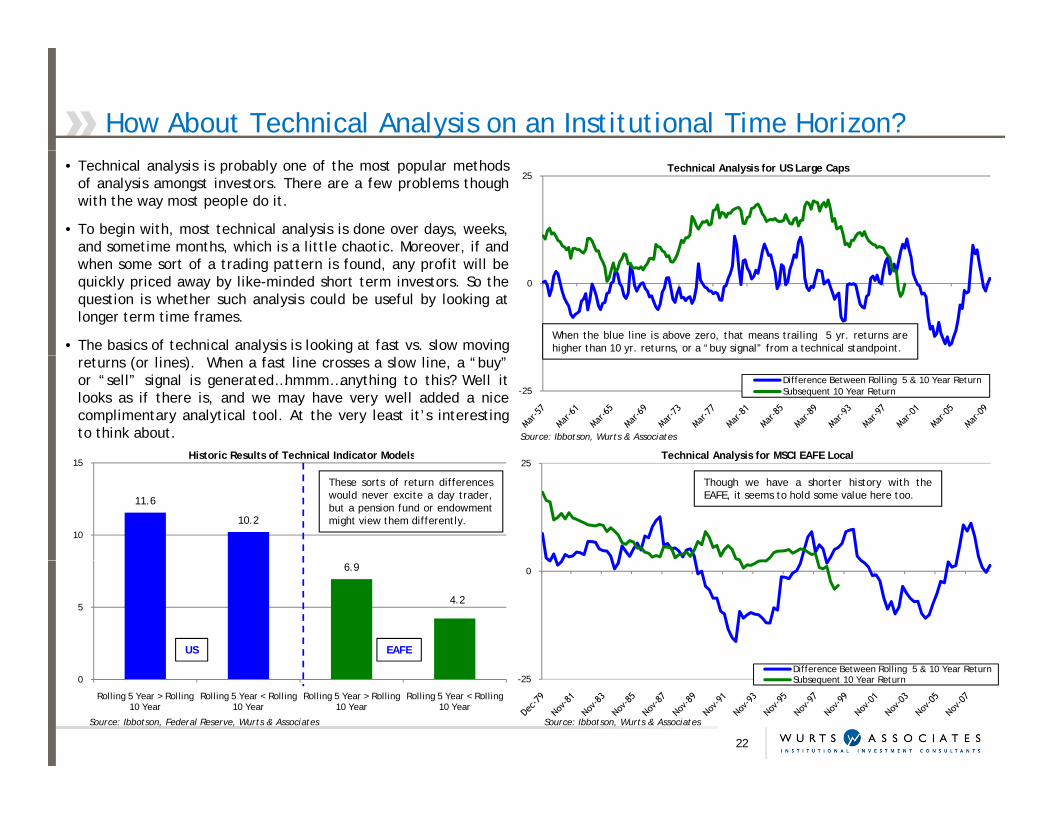
25Technical Analysis for US Large Caps• Technical analysis is probably one of the most popular methods
of analysis amongst investors. There are a few problems thoughwith the way most people do it.
• To begin with, most technical analysis is done over days, weeks,and sometime months, which is a little chaotic. Moreover, if and
0
, ,when some sort of a trading pattern is found, any profit will bequickly priced away by like-minded short term investors. So thequestion is whether such analysis could be useful by looking atlonger term time frames.
• The basics of technical analysis is looking at fast vs. slow movingWhen the blue line is above zero, that means trailing 5 yr. returns arehigher than 10 yr. returns, or a “buy signal” from a technical standpoint.
-25Difference Between Rolling 5 & 10 Year ReturnSubsequent 10 Year Return
Technical Analysis for MSCI EAFE Local
Source: Ibbotson, Wurts & Associates
returns (or lines). When a fast line crosses a slow line, a “buy”or “sell” signal is generated…hmmm…anything to this? Well itlooks as if there is, and we may have very well added a nicecomplimentary analytical tool. At the very least it’s interestingto think about.
Historic Results of Technical Indicator Models25
Technical Analysis for MSCI EAFE Local
11.6
10.210
15Historic Results of Technical Indicator Models
Though we have a shorter history with theEAFE, it seems to hold some value here too.
These sorts of return differenceswould never excite a day trader,but a pension fund or endowmentmight view them differently.
06.9
4.25
US EAFE
-25Difference Between Rolling 5 & 10 Year ReturnSubsequent 10 Year Return
22
Source: Ibbotson, Federal Reserve, Wurts & Associates Source: Ibbotson, Wurts & Associates
0
Rolling 5 Year > Rolling 10 Year
Rolling 5 Year < Rolling 10 Year
Rolling 5 Year > Rolling 10 Year
Rolling 5 Year < Rolling 10 Year
Global Markets at a Glance
6.6
6
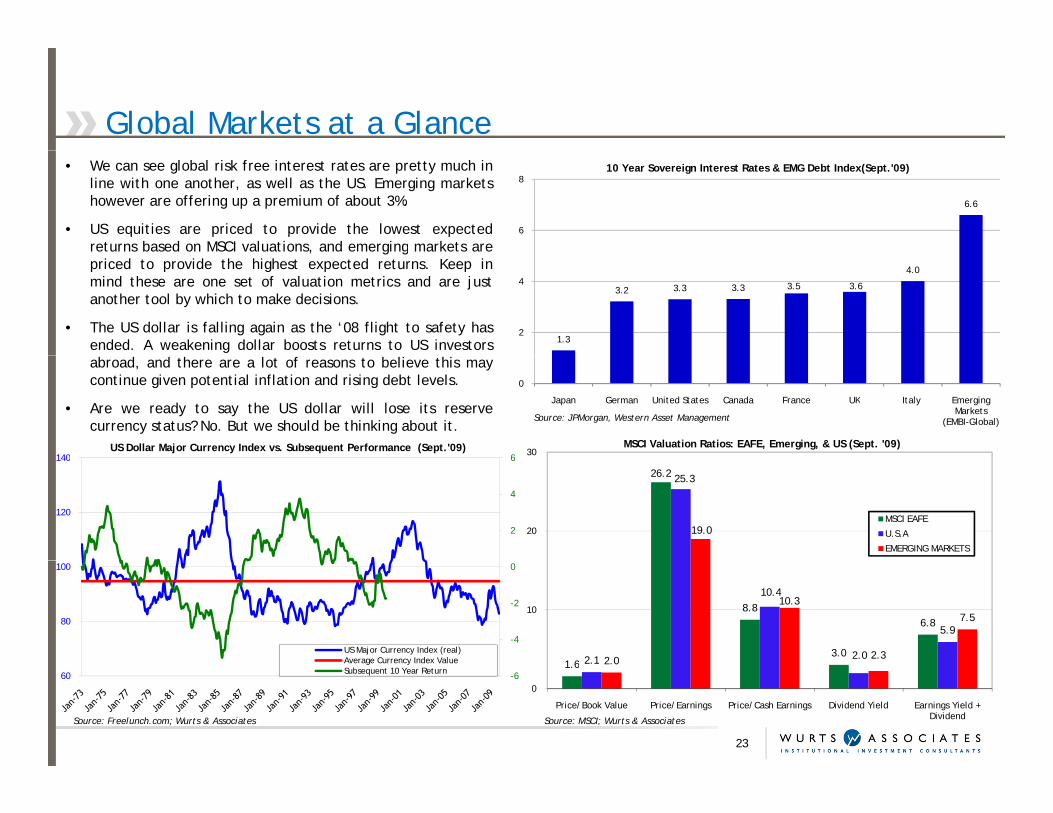
810 Year Sovereign Interest Rates & EMG Debt Index(Sept.'09)• We can see global risk free interest rates are pretty much in
line with one another, as well as the US. Emerging marketshowever are offering up a premium of about 3%.
• US equities are priced to provide the lowest expectedreturns based on MSCI valuations, and emerging markets are
1.3
3.2 3.3 3.3 3.5 3.6
4.0
2
4
, g gpriced to provide the highest expected returns. Keep inmind these are one set of valuation metrics and are justanother tool by which to make decisions.
• The US dollar is falling again as the ‘08 flight to safety hasended. A weakening dollar boosts returns to US investors
0
Japan German United States Canada France UK Italy Emerging Markets
(EMBI-Global)Source: JPMorgan, Western Asset Management
abroad, and there are a lot of reasons to believe this maycontinue given potential inflation and rising debt levels.
• Are we ready to say the US dollar will lose its reservecurrency status? No. But we should be thinking about it.
6140US Dollar Major Currency Index vs. Subsequent Performance (Sept.'09) 30
MSCI Valuation Ratios: EAFE, Emerging, & US (Sept. '09)
2
4
6
120
140
26.2 25.3
19.020MSCI EAFE
U.S.A
EMERGING MARKETS
-4
-2
0
80
100
US Major Currency Index (real)Average Currency Index Value 1 6
8.8
3.0
6.8
2.1
10.4
2.0
5.9
2.0
10.3
2.3
7.510
23
Source: Freelunch.com; Wurts & Associates Source: MSCI; Wurts & Associates
-660
Average Currency Index ValueSubsequent 10 Year Return
1.6 2.1 2.0
0
Price/Book Value Price/Earnings Price/Cash Earnings Dividend Yield Earnings Yield + Dividend
Style Tilts: US Large Value vs. Growth
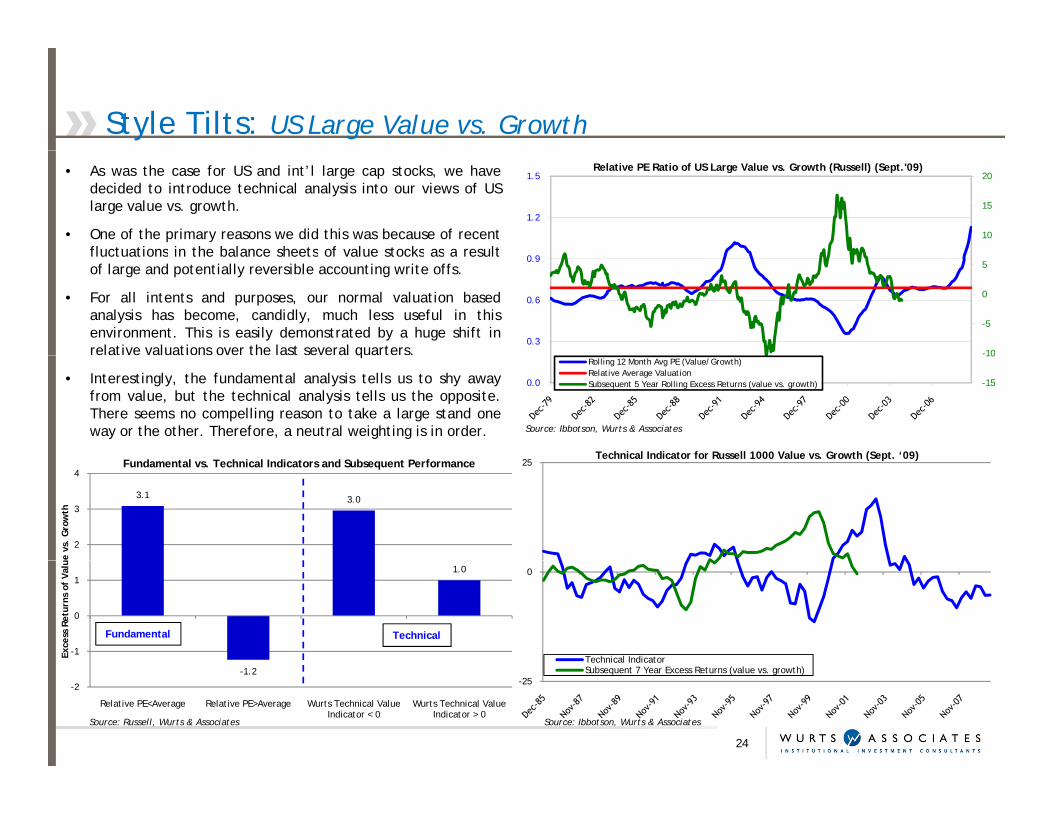
• As was the case for US and int’l large cap stocks, we havedecided to introduce technical analysis into our views of USlarge value vs. growth.
• One of the primary reasons we did this was because of recentfluctuations in the balance sheets of value stocks as a result
10
15
20
1.2
1.5Relative PE Ratio of US Large Value vs. Growth (Russell) (Sept.'09)
fluctuations in the balance sheets of value stocks as a resultof large and potentially reversible accounting write offs.
• For all intents and purposes, our normal valuation basedanalysis has become, candidly, much less useful in thisenvironment. This is easily demonstrated by a huge shift inrelative valuations over the last several quarters. -10
-5
0
5
0.3
0.6
0.9
Source: Ibbotson, Wurts & Associates
q
• Interestingly, the fundamental analysis tells us to shy awayfrom value, but the technical analysis tells us the opposite.There seems no compelling reason to take a large stand oneway or the other. Therefore, a neutral weighting is in order.
-15
10
0.0
Rolling 12 Month Avg PE (Value/Growth)Relative Average ValuationSubsequent 5 Year Rolling Excess Returns (value vs. growth)
Technical Indicator for Russell 1000 Value vs. Growth (Sept. ‘09)
3.1 3.0
2
3
4
e vs
. G
row
th
Fundamental vs. Technical Indicators and Subsequent Performance 25Technical Indicator for Russell 1000 Value vs. Growth (Sept. 09)
1.0
-1
0
1
Exce
ss R
etur
ns o
f Va
lu
Fundamental Technical
0
Technical Indicator-1.2
-2
Relative PE<Average Relative PE>Average Wurts Technical Value Indicator < 0
Wurts Technical Value Indicator > 0
24
Source: Russell, Wurts & Associates Source: Ibbotson, Wurts & Associates
-25Subsequent 7 Year Excess Returns (value vs. growth)
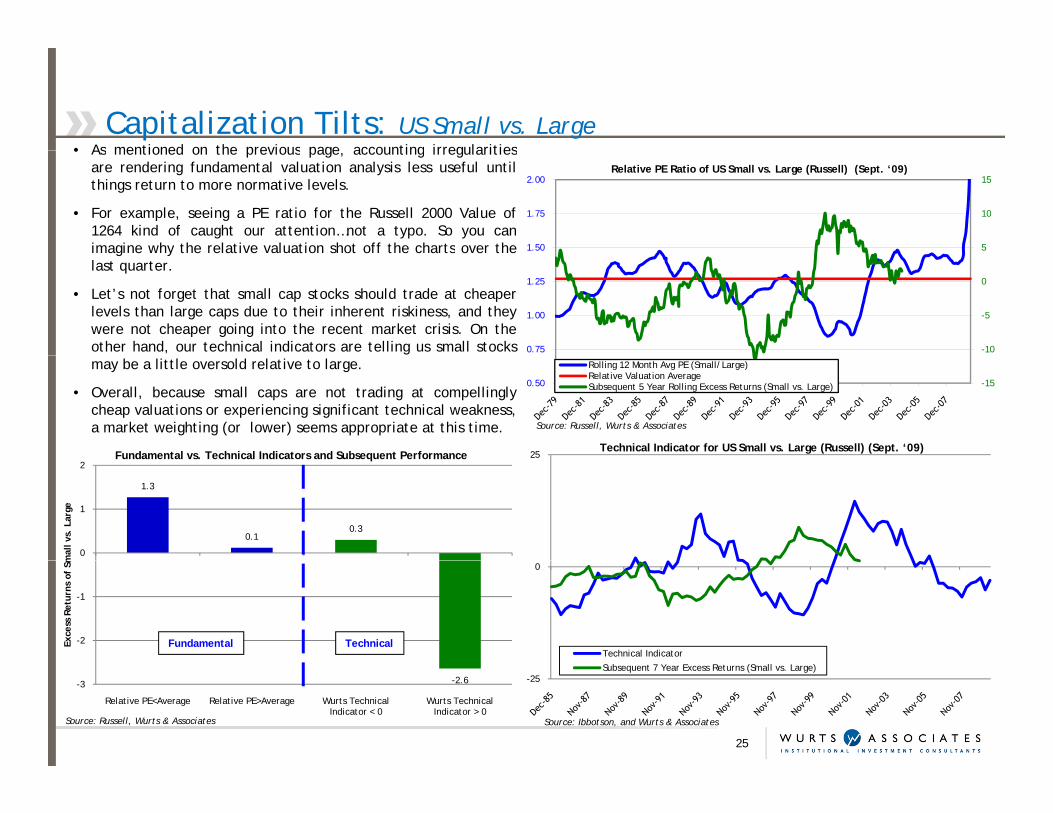
Capitalization Tilts: US Small vs. Large• As mentioned on the previous page accounting irregularities• As mentioned on the previous page, accounting irregularities
are rendering fundamental valuation analysis less useful untilthings return to more normative levels.
• For example, seeing a PE ratio for the Russell 2000 Value of1264 kind of caught our attention…not a typo. So you canimagine why the relative valuation shot off the charts over the 5
10
15
1.50
1.75
2.00Relative PE Ratio of US Small vs. Large (Russell) (Sept. ‘09)
imagine why the relative valuation shot off the charts over thelast quarter.
• Let’s not forget that small cap stocks should trade at cheaperlevels than large caps due to their inherent riskiness, and theywere not cheaper going into the recent market crisis. On theother hand, our technical indicators are telling us small stocks -10
-5
0
0.75
1.00
1.25
25Technical Indicator for US Small vs. Large (Russell) (Sept. ‘09)
Source: Russell, Wurts & Associates
may be a little oversold relative to large.
• Overall, because small caps are not trading at compellinglycheap valuations or experiencing significant technical weakness,a market weighting (or lower) seems appropriate at this time.
-150.50
Rolling 12 Month Avg PE (Small/Large)Relative Valuation AverageSubsequent 5 Year Rolling Excess Returns (Small vs. Large)
Fundamental vs. Technical Indicators and Subsequent Performance
1.3
0.10.3
0
1
2
mal
l vs.
Lar
ge
Fundamental vs. Technical Indicators and Subsequent Performance
0
Technical Indicator-2
-1
Exce
ss R
etur
ns o
f Sm
Fundamental Technical
-25Subsequent 7 Year Excess Returns (Small vs. Large)
25
Source: Ibbotson, and Wurts & AssociatesSource: Russell, Wurts & Associates
-2.6-3
Relative PE<Average Relative PE>Average Wurts Technical Indicator < 0
Wurts Technical Indicator > 0
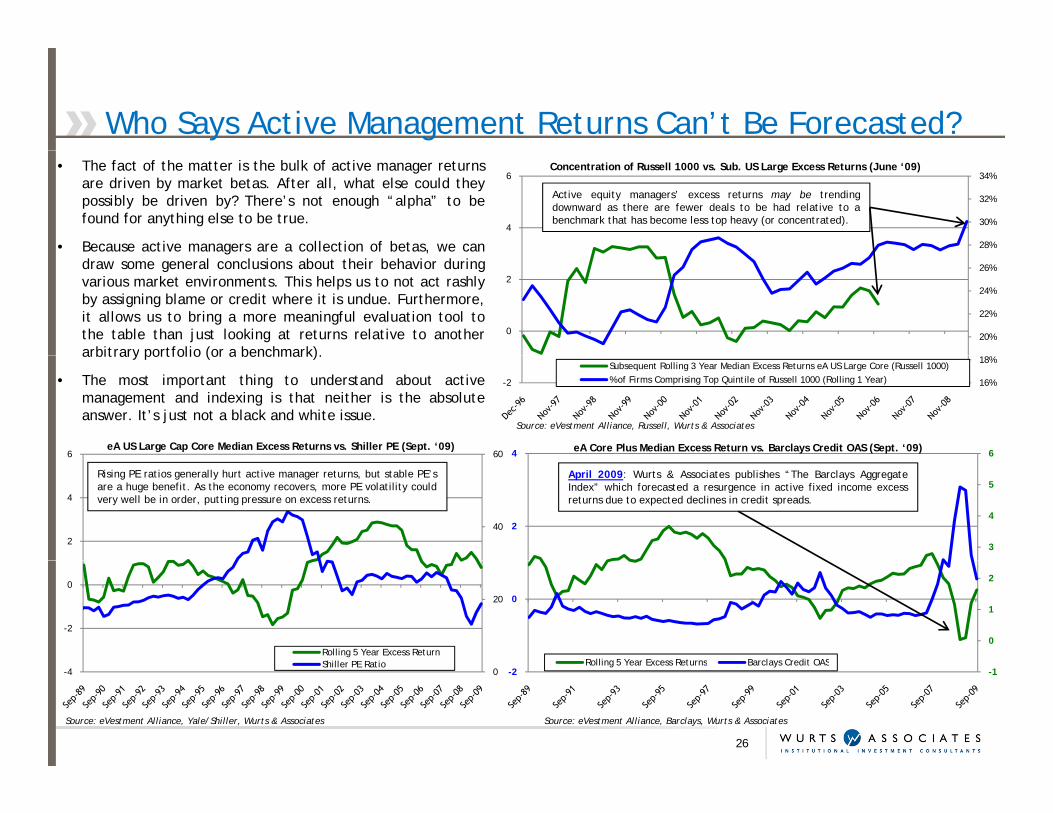
Who Says Active Management Returns Can’t Be Forecasted?• The fact of the matter is the bulk of active manager returns
are driven by market betas. After all, what else could theypossibly be driven by? There’s not enough “alpha” to befound for anything else to be true.
• Because active managers are a collection of betas, we can 28%
30%
32%
34%
4
6Concentration of Russell 1000 vs. Sub. US Large Excess Returns (June ‘09)
Active equity managers’ excess returns may be trendingdownward as there are fewer deals to be had relative to abenchmark that has become less top heavy (or concentrated).
g ,draw some general conclusions about their behavior duringvarious market environments. This helps us to not act rashlyby assigning blame or credit where it is undue. Furthermore,it allows us to bring a more meaningful evaluation tool tothe table than just looking at returns relative to anotherarbitrary portfolio (or a benchmark).
20%
22%
24%
26%
0
2
arbitrary portfolio (or a benchmark).
• The most important thing to understand about activemanagement and indexing is that neither is the absoluteanswer. It’s just not a black and white issue.
16%
18%
-2
Subsequent Rolling 3 Year Median Excess Returns eA US Large Core (Russell 1000)% of Firms Comprising Top Quintile of Russell 1000 (Rolling 1 Year)
64 eA Core Plus Median Excess Return vs. Barclays Credit OAS (Sept. ‘09)606
eA US Large Cap Core Median Excess Returns vs. Shiller PE (Sept. ‘09)
Source: eVestment Alliance, Russell, Wurts & Associates
3
4
5
240
2
4
April 2009: Wurts & Associates publishes “The Barclays AggregateIndex” which forecasted a resurgence in active fixed income excessreturns due to expected declines in credit spreads.
Rising PE ratios generally hurt active manager returns, but stable PE’sare a huge benefit. As the economy recovers, more PE volatility couldvery well be in order, putting pressure on excess returns.
0
1
2
0
Rolling 5 Year Excess Returns Barclays Credit OAS
20
-2
0
Rolling 5 Year Excess ReturnShiller PE Ratio
26
-1-2Rolling 5 Year Excess Returns Barclays Credit OAS
0-4Shiller PE Ratio
Source: eVestment Alliance, Barclays, Wurts & AssociatesSource: eVestment Alliance, Yale/Shiller, Wurts & Associates
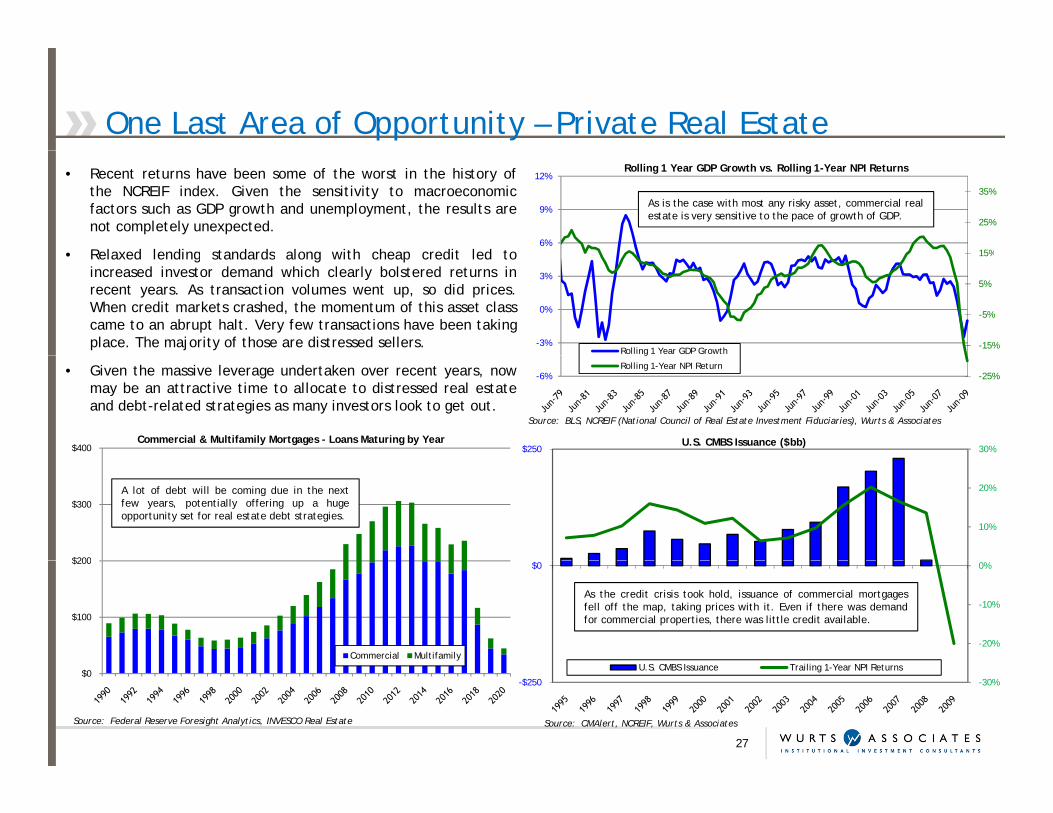
One Last Area of Opportunity – Private Real Estate• Recent returns have been some of the worst in the history of
the NCREIF index. Given the sensitivity to macroeconomicfactors such as GDP growth and unemployment, the results arenot completely unexpected.
• Relaxed lending standards along with cheap credit led to 15%
25%
35%
6%
9%
12%Rolling 1 Year GDP Growth vs. Rolling 1-Year NPI Returns
As is the case with most any risky asset, commercial realestate is very sensitive to the pace of growth of GDP.
• Relaxed lending standards along with cheap credit led toincreased investor demand which clearly bolstered returns inrecent years. As transaction volumes went up, so did prices.When credit markets crashed, the momentum of this asset classcame to an abrupt halt. Very few transactions have been takingplace. The majority of those are distressed sellers. -15%
-5%
5%
15%
-3%
0%
3%
Rolling 1 Year GDP Growth
$400Commercial & Multifamily Mortgages - Loans Maturing by Year
• Given the massive leverage undertaken over recent years, nowmay be an attractive time to allocate to distressed real estateand debt-related strategies as many investors look to get out.
30%$250U.S. CMBS Issuance ($bb)
-25%-6%
g
Rolling 1-Year NPI Return
Source: BLS, NCREIF (National Council of Real Estate Investment Fiduciaries), Wurts & Associates
$200
$300A lot of debt will be coming due in the nextfew years, potentially offering up a hugeopportunity set for real estate debt strategies.
10%
20%
$100
$200
Commercial Multifamily-20%
-10%
0%$0
As the credit crisis took hold, issuance of commercial mortgagesfell off the map, taking prices with it. Even if there was demandfor commercial properties, there was little credit available.
$0
27
Source: Federal Reserve Foresight Analytics, INVESCO Real Estate Source: CMAlert, NCREIF, Wurts & Associates
-30%-$250
U.S. CMBS Issuance Trailing 1-Year NPI Returns
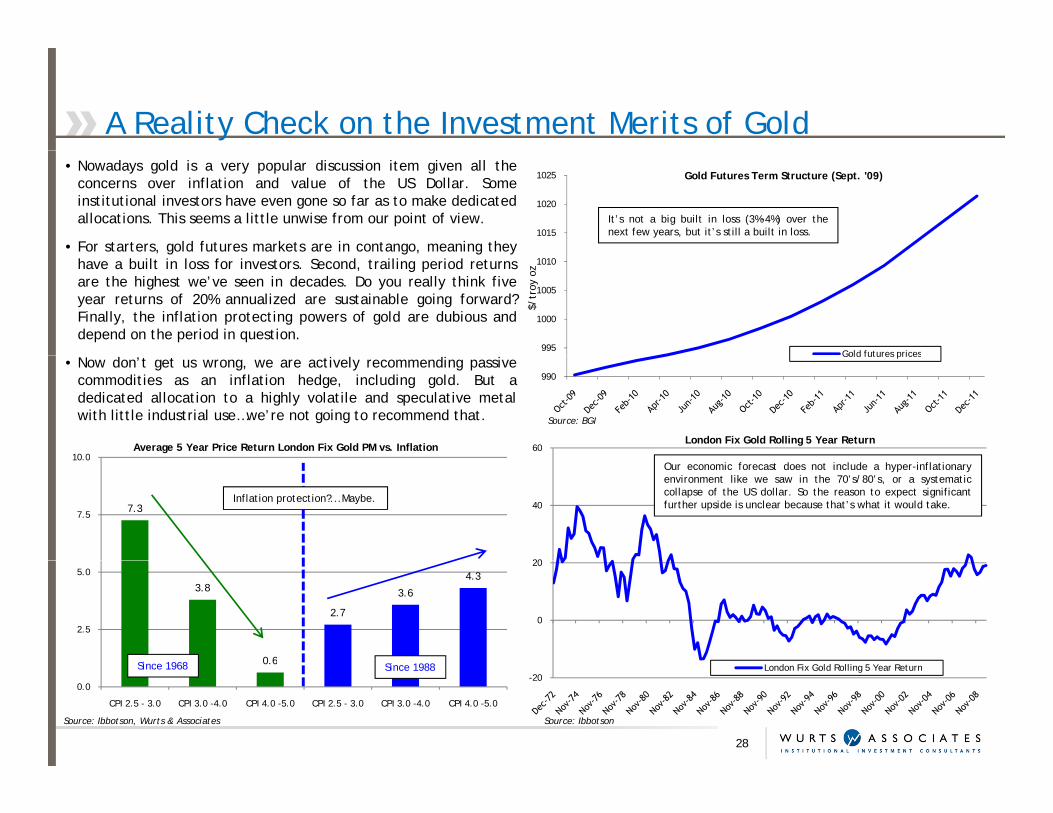
A Reality Check on the Investment Merits of Gold• Nowadays gold is a very popular discussion item given all the
concerns over inflation and value of the US Dollar. Someinstitutional investors have even gone so far as to make dedicatedallocations. This seems a little unwise from our point of view.
• For starters, gold futures markets are in contango, meaning they1015
1020
1025 Gold Futures Term Structure (Sept. '09)
It’s not a big built in loss (3%-4%) over thenext few years, but it’s still a built in loss.
, g g , g yhave a built in loss for investors. Second, trailing period returnsare the highest we’ve seen in decades. Do you really think fiveyear returns of 20% annualized are sustainable going forward?Finally, the inflation protecting powers of gold are dubious anddepend on the period in question.
995
1000
1005
1010
$/tr
oy o
z
Gold futures prices• Now don’t get us wrong, we are actively recommending passive
commodities as an inflation hedge, including gold. But adedicated allocation to a highly volatile and speculative metalwith little industrial use…we’re not going to recommend that.
10 0Average 5 Year Price Return London Fix Gold PM vs. Inflation
990
Gold futures prices
Source: BGI
60London Fix Gold Rolling 5 Year Return
7.37.5
10.0
20
40Inflation protection?...Maybe.
Our economic forecast does not include a hyper-inflationaryenvironment like we saw in the 70’s/80’s, or a systematiccollapse of the US dollar. So the reason to expect significantfurther upside is unclear because that’s what it would take.
3.8
0.6
2.7
3.6
4.3
2.5
5.0
Si 1968 S 988
0
20
28
Source: Ibbotson, Wurts & Associates
0.6
0.0
CPI 2.5 - 3.0 CPI 3.0 -4.0 CPI 4.0 -5.0 CPI 2.5 - 3.0 CPI 3.0 -4.0 CPI 4.0 -5.0
Source: Ibbotson
Since 1968 Since 1988-20
London Fix Gold Rolling 5 Year Return

Concluding ThoughtsMacroeconomics
• Forecasting macroeconomic conditions is not something that can be done with precision, and the complexity of doing so will have noimpact on the accuracy of the results. In our estimation, the most reliable means of looking forward is to put yourself in the shoes ofkey policy makers that have a direct and significant impact on the economy. This should be done on top of an academically basedunderstanding of macroeconomics. Because we know the economy drives every major portfolio risk factor, such analysis is essential.g y y j p , yNo asset allocation modeling system can overcome the effects of poorly derived risk and return estimates.
• Given available data, we believe a U-shaped recovery alongside higher than expected inflation is forthcoming. Of course our crystalball could be a little cloudy and we could be wrong, but the evidence just doesn’t support any other likely conclusion. And we surelycan’t bury our head in the sand or refuse to state an opinion. This stuff is just too important when setting portfolio policy and assetallocation targets. We can’t accurately predict the future of course, but that doesn’t mean we can’t get it directionally correct.
Fundamental & Technical Analysis
• Generally speaking, capital markets seem to have recovered from the flight to safety in ’08 as equity valuations are on the rise,credit spreads have narrowed, and risk free interest rates are higher. As we stated in our 4th quarter 2008 research report, theworld’s governments had no choice but to create a flight to risk, and did so with apparent success.
• Equities seem poised to provide high single digit rates of return. We do not see any compelling reason to adopt significant style orcapitalization tilts within domestic equities. Globally, we urge a more diversified equity allocation to capture reasonable valuationsin developed markets, higher growth potential in emerging markets, and an overarching hedge against potential dollar depreciation.
• We continue to believe nominal risk free fixed income remains poised to noticeably underperform credit opportunities. This marginhas narrowed substantially from our original recommendation earlier this year, but still remains attractive.
Tying It All Together
• We do not see a good chance of being rewarded for taking large amounts of risk in this environment. The GDP growth necessary tosee big valuation expansions, tight credit spreads, and an environment conducive to levered investments just doesn’t seem likely.What we do see is a steady recovery in major risk factors and a significant threat of inflation that should be acted upon.
Most importantly don’t be convinced to translate wishful thinking into investment strategy in the hopes of making up lost ground
29
• Most importantly, don’t be convinced to translate wishful thinking into investment strategy in the hopes of making up lost ground.We know such thoughts are being circulated amongst the institutional community. Make plans based on what you see in the worldaround you, not what you want to see, or what others would like you to see for their own purposes.

Appendix
30

Periodic Table of Returns – September 2009
1988 1989 1990 1991 1992 1993 1994 1995 1996 1997 1998 1999 2000 2001 2002 2003 2004 2005 2006 2007 20082009 (YTD)
Bes
t
29.5 35.9 17.5 51.2 29.1 32.9 8.1 38.3 23.1 35.2 38.7 43.1 22.8 14.0 10.3 48.5 22.3 18.9 26.9 15.8 5.2 29.6
28.6 25.2 8.9 41.7 13.8 26.3 6.4 37.2 21.6 31.8 20.3 33.2 12.3 8.4 6.7 46.0 20.7 14.0 23.5 11.8 1.8 29.1
23.2 20.2 7.9 41.2 12.3 23.8 4.2 31.0 21.4 30.5 16.2 27.3 11.6 7.3 1.7 38.6 16.5 7.5 22.2 11.6 -6.5 27.1
20.4 18.8 2.6 24.6 8.0 18.1 2.7 25.8 14.4 18.6 15.6 26.5 7.0 4.1 1.0 30.0 14.3 7.1 16.1 10.3 -20.7 16.4
11.7 14.5 2.3 21.7 7.8 13.4 -0.8 24.6 14.1 16.2 13.6 13.0 6.0 2.8 -8.6 29.7 13.1 7.1 13.4 7.9 -24.0 14.8
11.3 12.4 -0.3 16.0 7.4 11.5 -1.5 18.5 11.3 13.9 8.7 11.4 4.1 -2.7 -11.4 21.6 11.1 5.3 12.8 7.1 -28.9 9.8
9.6 10.8 -8.1 14.5 5.0 9.8 -2.0 11.6 10.3 12.9 5.1 7.3 1.9 -5.6 -15.5 11.6 6.9 4.7 10.4 7.0 -36.9 5.7
7.9 8.6 -17.4 12.5 3.6 3.1 -2.4 11.1 6.4 9.7 1.2 4.7 -14.0 -9.2 -15.7 9.0 6.3 4.1 9.1 4.7 -38.4 0.1
6.8 7.8 -21.8 5.8 -4.3 2.9 -2.9 7.5 5.3 5.3 -5.1 -0.8 -22.4 -20.4 -27.9 4.1 4.3 3.0 4.8 -0.2 -38.5 NA
Wor
st N/A N/A -23.2 -5.6 -11.9 1.4 -3.5 5.8 3.6 2.1 -6.5 -1.5 -22.4 -21.2 -30.3 1.1 1.2 2.4 4.3 -9.8 -43.1 NA
Large Cap Growth US Stocks (Russell 1000 Growth Index) International Stocks (MSCI EAFE Index)Large Cap Growth US Stocks (Russell 1000 Growth Index) International Stocks (MSCI EAFE Index)
Large Cap Value US Stocks (Russell 1000 Value Index) Domestic Fixed Income (Barclays Capital Aggregate Bond Index)
Small Cap Growth US Stocks (Russell 2000 Growth Index) Real Estate (NCREIF Property Index)
Small Cap Value US Stocks (Russell 2000 Value Index) Cash (Citigroup 3-Mo Treasury)
Hedge Fund of Funds (HFRI Fund of Funds Index) ICC Universe Median (Total Funds)
Data: Ibbotson Associates, As of 7/31/2009; Independent Consultants Cooperative.
31
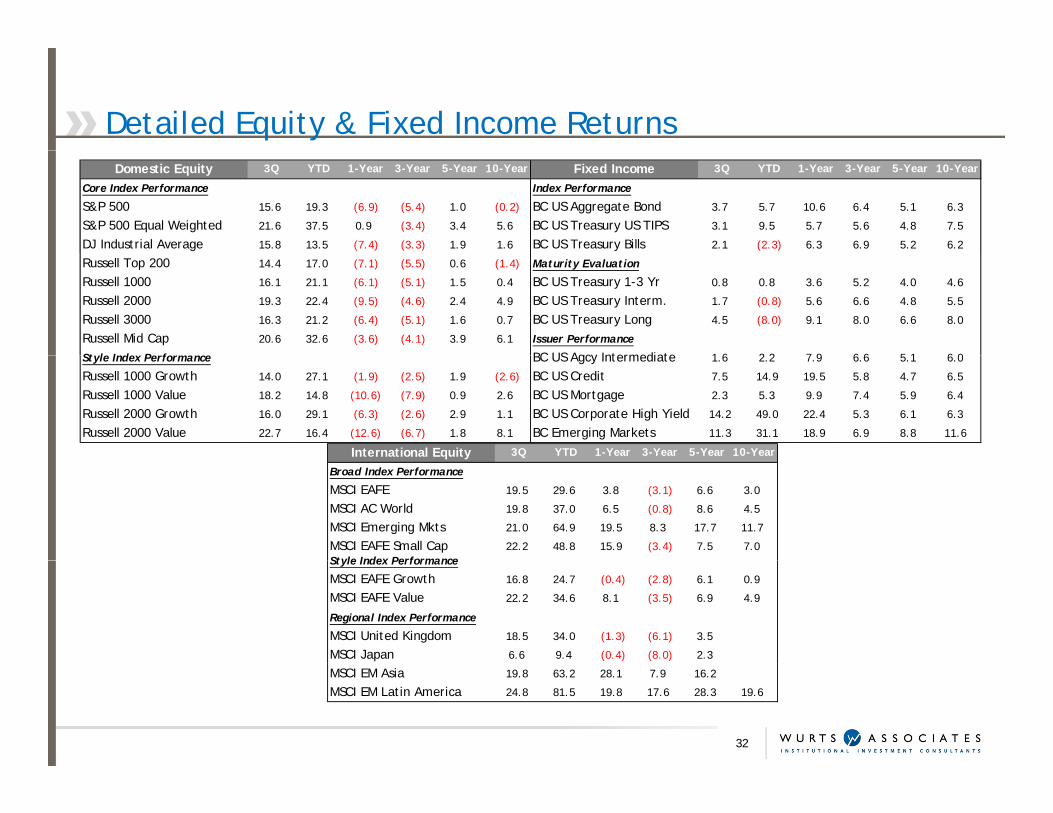
Detailed Equity & Fixed Income ReturnsDomestic Equity 3Q YTD 1-Year 3-Year 5-Year 10-Year Fixed Income 3Q YTD 1-Year 3-Year 5-Year 10-Year
Core Index Performance Index Performance
S&P 500 15.6 19.3 (6.9) (5.4) 1.0 (0.2) BC US Aggregate Bond 3.7 5.7 10.6 6.4 5.1 6.3
S&P 500 Equal Weighted 21.6 37.5 0.9 (3.4) 3.4 5.6 BC US Treasury US TIPS 3.1 9.5 5.7 5.6 4.8 7.5
DJ Industrial Average 15.8 13.5 (7.4) (3.3) 1.9 1.6 BC US Treasury Bills 2.1 (2.3) 6.3 6.9 5.2 6.2
Russell Top 200 14.4 17.0 (7.1) (5.5) 0.6 (1.4) Maturity Evaluation
Russell 1000 16.1 21.1 (6.1) (5.1) 1.5 0.4 BC US Treasury 1-3 Yr 0.8 0.8 3.6 5.2 4.0 4.6
Russell 2000 19.3 22.4 (9.5) (4.6) 2.4 4.9 BC US Treasury Interm. 1.7 (0.8) 5.6 6.6 4.8 5.5
Russell 3000 16.3 21.2 (6.4) (5.1) 1.6 0.7 BC US Treasury Long 4.5 (8.0) 9.1 8.0 6.6 8.0
Russell Mid Cap 20.6 32.6 (3.6) (4.1) 3.9 6.1 Issuer Performance
St l I d P f BC US Agcy Intermediate 1 6 2 2 7 9 6 6 5 1 6 0Style Index Performance BC US Agcy Intermediate 1.6 2.2 7.9 6.6 5.1 6.0
Russell 1000 Growth 14.0 27.1 (1.9) (2.5) 1.9 (2.6) BC US Credit 7.5 14.9 19.5 5.8 4.7 6.5
Russell 1000 Value 18.2 14.8 (10.6) (7.9) 0.9 2.6 BC US Mortgage 2.3 5.3 9.9 7.4 5.9 6.4
Russell 2000 Growth 16.0 29.1 (6.3) (2.6) 2.9 1.1 BC US Corporate High Yield 14.2 49.0 22.4 5.3 6.1 6.3
Russell 2000 Value 22.7 16.4 (12.6) (6.7) 1.8 8.1 BC Emerging Markets 11.3 31.1 18.9 6.9 8.8 11.6
International Equity 3Q YTD 1-Year 3-Year 5-Year 10-Yearq yBroad Index Performance
MSCI EAFE 19.5 29.6 3.8 (3.1) 6.6 3.0
MSCI AC World 19.8 37.0 6.5 (0.8) 8.6 4.5
MSCI Emerging Mkts 21.0 64.9 19.5 8.3 17.7 11.7
MSCI EAFE Small Cap 22.2 48.8 15.9 (3.4) 7.5 7.0Style Index PerformanceStyle Index Performance
MSCI EAFE Growth 16.8 24.7 (0.4) (2.8) 6.1 0.9
MSCI EAFE Value 22.2 34.6 8.1 (3.5) 6.9 4.9
Regional Index Performance
MSCI United Kingdom 18.5 34.0 (1.3) (6.1) 3.5
MSCI Japan 6.6 9.4 (0.4) (8.0) 2.3
MSCI EM Asia 19.8 63.2 28.1 7.9 16.2
MSCI EM Latin America 24.8 81.5 19.8 17.6 28.3 19.6
32
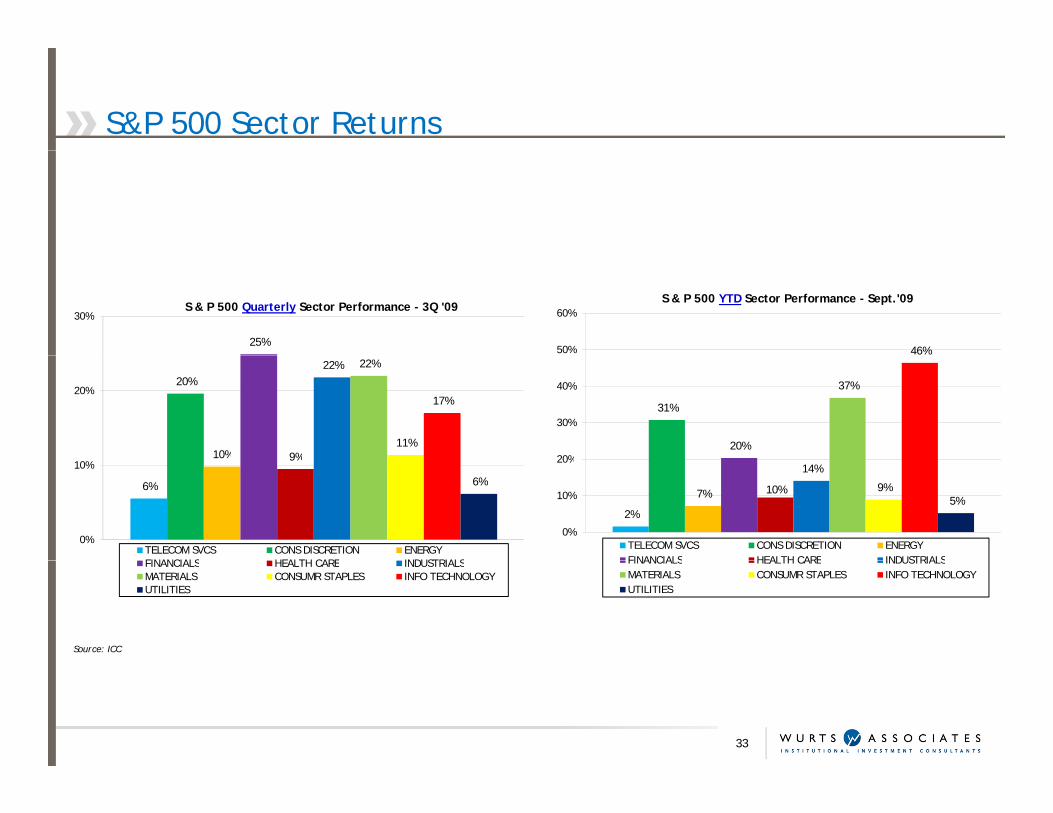
S&P 500 Sector Returns
25%
30%S & P 500 Quarterly Sector Performance - 3Q '09
46%50%
60%S & P 500 YTD Sector Performance - Sept.'09
20%
10% 9%
22% 22%
11%
17%20%
31%
20%
37%
20%
30%
40%
6%
10% 9%
6%
0%
10%
TELECOM SVCS CONS DISCRETION ENERGYFINANCIALS HEALTH CARE INDUSTRIALS
2%
7% 10%
14%
9%5%
0%
10%
20%
TELECOM SVCS CONS DISCRETION ENERGYFINANCIALS HEALTH CARE INDUSTRIALS
Source: ICC
FINANCIALS HEALTH CARE INDUSTRIALSMATERIALS CONSUMR STAPLES INFO TECHNOLOGYUTILITIES
FINANCIALS HEALTH CARE INDUSTRIALSMATERIALS CONSUMR STAPLES INFO TECHNOLOGYUTILITIES
33