September 2009 Julie Walsh Director, Office of Space Management Associate Director, Facilities...
33
September 2009 Julie Walsh Director, Office of Space Management Associate Director, Facilities Management and Planning Sucheta Kulkarni GIS Coordinator, Office of Space Management University of Michigan Medical School
-
Upload
joleen-evans -
Category
Documents
-
view
217 -
download
0
Transcript of September 2009 Julie Walsh Director, Office of Space Management Associate Director, Facilities...

September 2009
Julie WalshDirector, Office of Space Management
Associate Director, Facilities Management and Planning
Sucheta Kulkarni
GIS Coordinator, Office of Space Management
University of Michigan Medical School

September 2009 2
Medical School Space Management
Business driverso Space is expensive and scarceo Rising utility costso Accurate record of space needed for indirect cost
recovery audit
Stumbling blocks Ad hoc and anecdotal decision making
• Takes a lot of time• Perceived as unfair• Unclear expectations
September 2009 3

Centralized approach• Space Ownership - Institution• Ultimate Decision maker – Dean’s office• Decisions based on defined utilization criteria• Faculty committee for policy & peer review• Space Management and analysis by multiple entities• Data updated continuously
Total system
September 2009 4
Medical School Space Management

Management by metrics
• Defining metricso $ per square foot
• Setting benchmarkso Cover space costs
September 2009 5
Medical School Space Management

Medical School Space Reporting
September 2009 6
Space Productivity
M-SpaceM-DASH
This tool displays components of the space productivity metric ($/sqft)
Dashboard providing data on key indicators such as days cash on hand, NIH market share, and rate of research growth (awards)
Web applications

September 2009 7
Medical School Space Reporting
Strategic Space Planning
“Stacking Diagrams” provide another perspective for looking at space; useful for Departmental move planning.
8
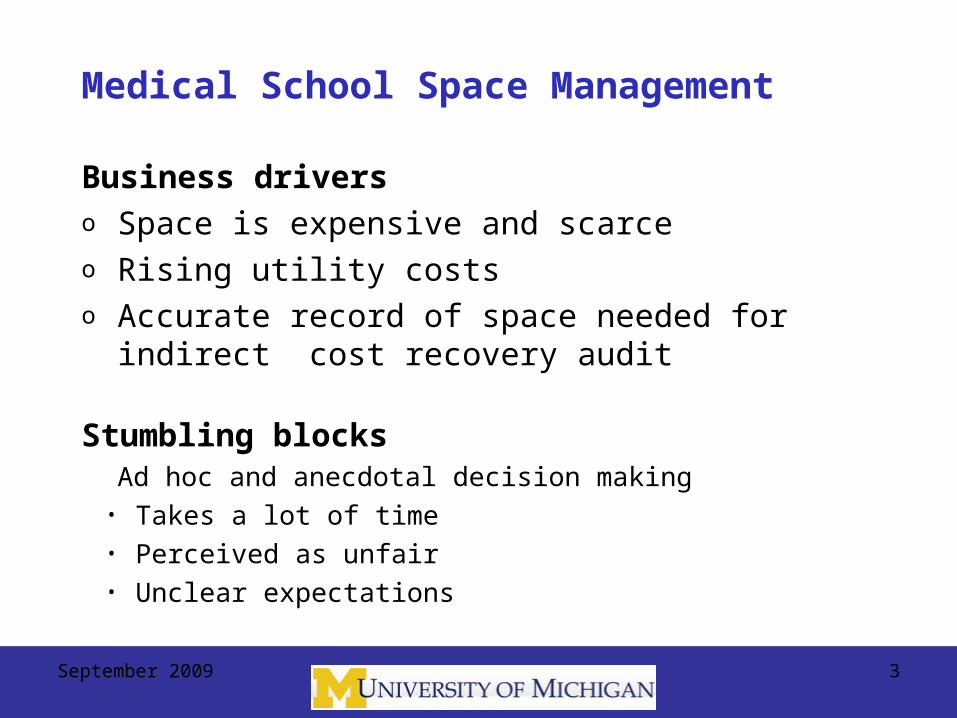
Space Utilization by Department
Fixed Assets Inventory
Space Utilization by Room Type
September 2009
Medical School Space Reporting
GIS Enabled Enhanced Space Analytics

9September 2009
Medical School Space Reporting
GIS Enabled Enhanced Space Analytics:
PI Productivity & Location
Average Productivity of Occupants

Medical School Space Reporting
Space Productivity Report
Demo M-Space
September 2009 10

Need for GIS based Analytics Capabilities
• Background:• Historically, space analysis done with manual process
utilizing data from disparate sources
• Challenges: • Resource intensive, time consuming, data inconsistency• Increasing need for analysis and decision support for facility
management• Analysis becoming multi-dimensional; needing both
geographical and business data
Leading to- Initiative to build capability for efficient facilities
planning & management Development of Geographical Information System (GIS)
based capability for geo-spatial analysis for space management
11September 2009

Facilities Management Process
Transformation with GIS
Before GIS After GIS
Info Hand Drawn
Manual Automated
September 2009 12
…….Reduced space requests turnaround time from days to minutes

13September 2009
GIS Enabled Enhanced Space Analytics:
Space Utilization using multi-dimensional attributes: Location of all autoclave rooms
Space Utilization across multiple floors and buildings

14September 2009
GIS Enabled Enhanced Space Analytics:
Building Occupancy By Department in 3-D
Building Occupancy By Space Usage in 3-D

Medical School GIS Project:
• Scope & Status:• Analysis capabilities: Single or multi-dimensional spatial
analyses using data attributes • Information update frequency: Monthly• Total users = 70• User makeup: Space managers, Department Administrators,
Assoc. Deans• Positive response for current capabilities • Strong demand for future business analysis capabilities from
user base
• Resources:• Cross functional team to setup the initial scope (Med School
Facilities, Finance, MSIS & AEC)• GIS Expert (part-time)
• Key Technology Components: ArcMap & ArcReader
15September 2009
“Live” Demo
GIS based Space Management Capabilities
September 2009 16

Future GIS Projects:
September 2009 17
Asset Mapping for Disaster Recovery
Capital / Renovation Project Location Tracking
HVAC Zone Mapping

Value to Medical School:
18September 2009
Lessons Learned• Approach space management as a “system”• Dedicate enough resources• Define metrics and set benchmarks• Strive for accurate & timely data• Make the rules clear and visible• Rules apply to everyone• User involvement increases buy-in• Create meaningful reports• Full support of the dean is critical
September 2009 19

20
Contacts:
Data Contact: Julie Walsh, Director
Technical Contact: Sucheta Kulkarni, GIS [email protected]
Office of Space Management: 734.647.2788University of Michigan Medical School
September 2009

September 2009 21


Space Productivity
23

GIS Data Monthly Update Process:

Microstation CAD
floorplans
M-Pathways Data
WarehouseSpace infoUsage info
UMMS Data Warehouse
Business infoFinancial info
ArcReader 9.3(Viewer only)
ArcGIS 9.3(GIS analysis)
Medical School GIS Project: Data Architecture

Medical School GIS Project: Technical Solution Details
Software:• ArcGIS 9.3 – to create, view, analyze geo-located business
information. • ArcReader 9.3 - a web-based light wt viewer used by majority
of end users (“general users”) to view and print geo-located business information
• Oracle – Ora9i - business information repository• BrioQuery Explorer 6.6.4 – data exchange between Oracle and
ArcGIS using M/S Excel format• Microstation XM – CAD software for floor plans
Hardware: • Server - Novel file server HP Proliant DL280 ; 1.4 GHZ Pentium
processor and 2-4 GB RAM ; holds GIS data • End user Desktops - Intel Core 2 Duo E6550 2.33 GHZ
processor with 4GB of RAM and an 80 GB of hard drive
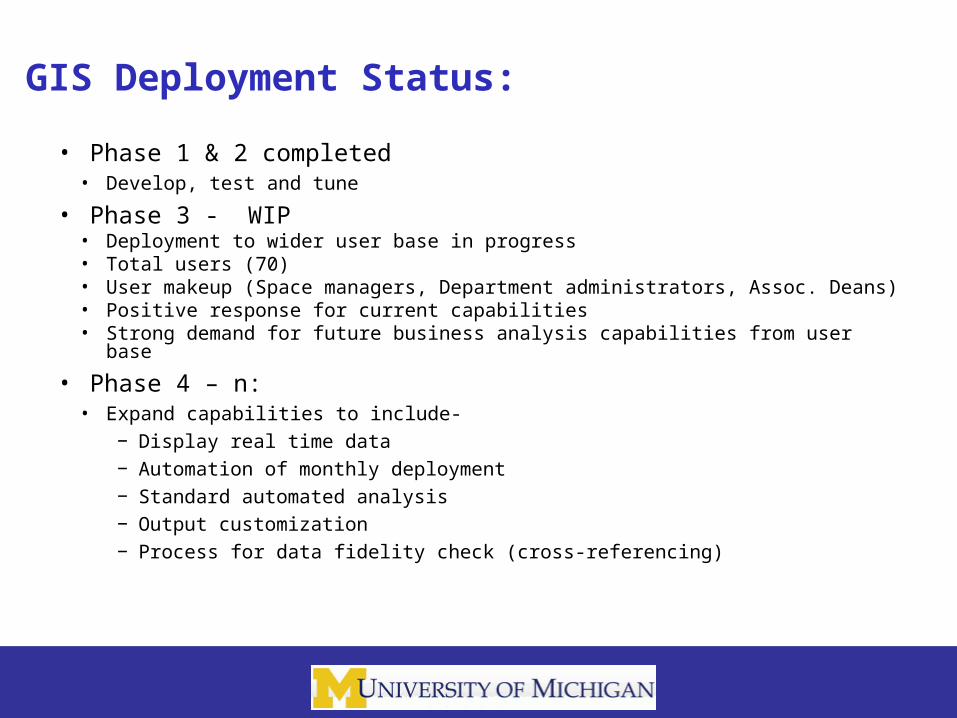
• Phase 1 & 2 completed• Develop, test and tune
• Phase 3 - WIP• Deployment to wider user base in progress• Total users (70)• User makeup (Space managers, Department administrators, Assoc. Deans)• Positive response for current capabilities • Strong demand for future business analysis capabilities from user base
• Phase 4 – n:• Expand capabilities to include-
− Display real time data− Automation of monthly deployment− Standard automated analysis− Output customization− Process for data fidelity check (cross-referencing)
GIS Deployment Status:

• RSB GIS Initiative enabled:• Faculty and Program assignment• Kiosks “Way finding” Application
• Future initiatives to support recruitment, alumni analyses • Space Information and Real Estate Planning – Campus
GIS• School of Natural Resources • Utilities and Plant Engineering:
• interested in leveraging GIS for HVAC planning to combat rising energy costs
• CSCAR• MAP Library• School of Public Health
GIS on UM Campus:

29
1850-2010 Medical School Occupied Space
Medical School Cumulative Net Assignable Square Footage (NASF)
0
200,000
400,000
600,000
800,000
1,000,000
1,200,000
1,400,000
1,600,0001
85
0
18
55
18
60
18
65
18
70
18
75
18
80
18
85
18
90
18
95
19
00
19
05
19
10
19
15
19
20
19
25
19
30
19
35
19
40
19
45
19
50
19
55
19
60
19
65
19
70
19
75
19
80
19
85
19
90
19
95
20
00
20
05
20
10
20
15
20
20
Oc
cu
pie
d S
pa
ce
(N
AS
F)
Note: non-clinical lease space included beginning 2001

Medical School Owned/Leased Space:1985-2020 w/ NCRC vs. New Construction
1948-1958 1959-1968 1969-1978 1979-1988 1989-1998 1999-2008 2009-201835.9% 73.4% 37.7% 28.3% 36.2% 42.9% 29.6%
Medical School Space Growth by Decade
w/ Pfizer
100,000
300,000
500,000
700,000
900,000
1,100,000
1,300,000
1,500,000
1,700,000
1,900,000
2,100,000
1985 1990 1995 2000 2005 2010 2015 2020
Ow
ned
/Lea
sed
Sp
ace
(NA
SF
)
UMMS Owned/Leased Space w/ Pfizer and Lease Consolidation
UMMS Owned/Leased Space w/o Pfizer Occupation or Lease Consolidation
KEC & MSRB I
MSRB II
MSRB IIICCGC
BSRB (257K NASF)
Kresge Complex (134k NASF)
Eye Center (2010)
Faculty Office Space (2013)
New Research Bldg (2014)
New Research Bldg? (2019)
PFIZER Buildings (UMMS occupied)
*Modeled Occupation of Pfizer Lab Buildings of .536M NASF + UMMS portion of offices

Annual Capital Expenditures and Facilities Operating Expenses – UMMS (FY09)
• Capital Expenditures1
• Debt $4.8M− Interest $1.7M− Principal $3.1M
• Depreciation $37.8M
− Buildings $26.7M − Equipment $11.1M
• Construction $11.8M
$54.4M
Operating Expenses Facilities
$31.5M Utilities
$19.5M Plant Ops
$9.2M OSEH
$0.46M UMMS Facilities
$2.0M CACR, LSI, P Commons $0.3M
Operating Leases $5.1M
$36.6M
Total (Cap & Op Ex): $91M
Facility Expense2: $61.35/SF
91%
4%5%
CapEx
Fac. Related OpEx
All Other UMMSExpenses
Note: (1) Income Statement Basis (e.g. Assets added and depreciation begins as buildings are used, not cash outlay basis. (2) UMMS Space FY2009 = 1,483,225 Occupied SF

KPI Deployments: Space Productivity
Space Productivity• Primary metric:
− $IDC/sqft - Indirect research expenditures per sqft of research space − FY2008 School calculation:
$75.2M IDC recovery in associated space 853K net assignable sqft of research space $88 IDC/sqft
• IDC/sqft - Informing operational and financial decisions:− Funds flow to departments− Medical School Space Policy
• Providing Incentives for efficient use of research space:− Executive Incentive Compensation for Department Chairs & Administrators− Basic Science Departments− Faculty rewards
÷

Space Productivity Incentive Goal:
The Medical School has set a goal of reaching a space productivity level of $110 IDC/sqft for all Medical School research expenditures occurring in Medical School net assignable space. The $110 IDC/sqft target will hold steady for FY2008-FY2010 to encourage and reward movement towards the target over time.
For FY2009, Departments will be assessed on their IDC/sqft metric over the one-year period July 1, 2008 to June 30, 2009.
The metric of IDC/sqft will be calculated using average occupied Medical School space and research expenditures attributed in the Medical School over the fiscal year. Median IDC/sqft will be calculated for Departments with occupied space, excluding outliers.
KPI Deployments: Space Productivity