Sept 25, 2009 I. GDP A.Definition B.Measurement C.Limitations Interesting Economic Fact: People born...
26
Sept 25, 2009 I. GDP A. Definition B. Measurement C. Limitations Interesting Economic Fact: People born in the winter months earn on average less than people born in summer. One possible reason: women who give birth in winter are poorer.
-
date post
19-Dec-2015 -
Category
Documents
-
view
214 -
download
0
Transcript of Sept 25, 2009 I. GDP A.Definition B.Measurement C.Limitations Interesting Economic Fact: People born...

Sept 25, 2009
I. GDPA. DefinitionB. MeasurementC. Limitations
Interesting Economic Fact:People born in the winter months earnon average less than people born in summer. One possible reason: women who give birth in winter are poorer.


Circular Flow Model

Macroeconomics and GDP

GDP
Gross Domestic Product: The market value of all final goods and services produced within a country in a year.


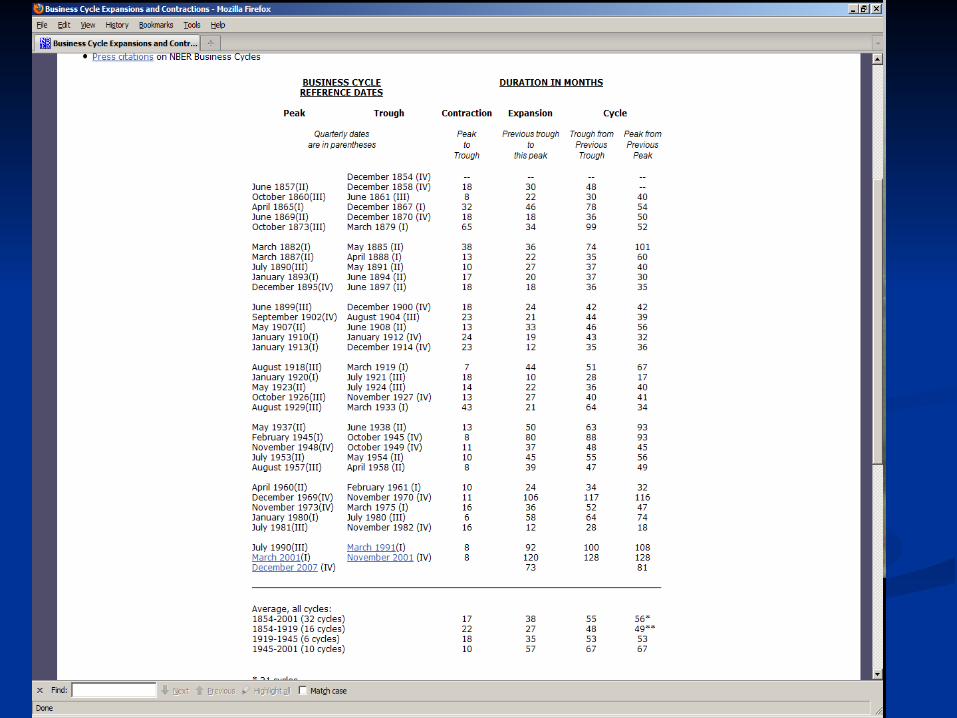
Recent GDP Trends

GDP Growth in your lifetime
GDP in 1990 = $5,800 billionGDP in 2008 = $14,441 billion
Growth = (14441-5800)/5800 = 148%

Adjust for inflation
We want 1990 quantities at 2008 prices GDP in 1990 at 2008 prices = Real 1990 output x 2008 price of each good produced = $8,034 billion
So real GDP growth is (14,441-8,034)/8,034 = 79.8%
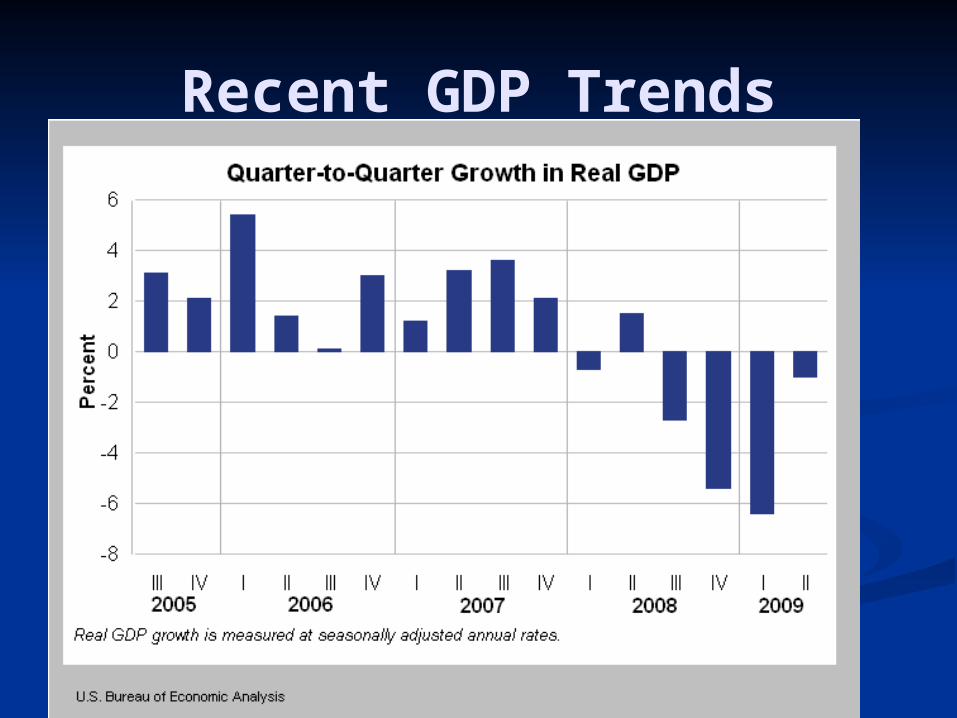
Components of GDP ($billion)
GDP $ 14,143.3 Consumption $ 9,996.6 71%Investment $ 1,558.6 11%Government Spending on Goods and Services $ 2,926.8 21%
Net Exports (X-IM) $ (338.7) -2%

GDP $ 14,143.3 Consumption $ 9,996.6 Goods $ 3,191.2 Services $ 6,805.3 Investment $ 1,492.2 Nonresidential $ 1,387.3 Residential Housing $ 346.2 Government Consumption $ 2,926.8 Federal $ 1,137.0 Defense $ 775.0 Nondefense $ 362.0 State and Local $ 1,789.8
Net Exports $ (338.7) Exports $ 1,492.2 Imports $ 1,830.8
Gory Details

What GDP Does Not Measure
1. Non-Priced Services2. Illegal Activity3. Leisure4. Bads5. Poverty and inequality6. Love, Satisfaction, Happiness

Environmental Quality and GDP

Rank Nation GDP in Billions GDP/capita1 United States $14,260 $46,9002 China $7,973 $6,0003 Japan $4,329 $34,0004 India $3,297 $2,9005 Germany $2,918 $35,4006 Russia $2,266 $16,1007 United Kingdom $2,226 $36,5008 France $2,128 $33,2009 Brazil $1,993 $10,200
10 Italy $1,823 $31,30012 Mexico $1,563 $14,20015 Canada $1,300 $39,100
202 Haiti $12 $1,300219 Afghanistan $22 $700
GDP Around The World

G20’s GDP as a proportion of world total:
2008

GDP per capita in PPP terms of G20: 2008

Are Natural Resources Key?
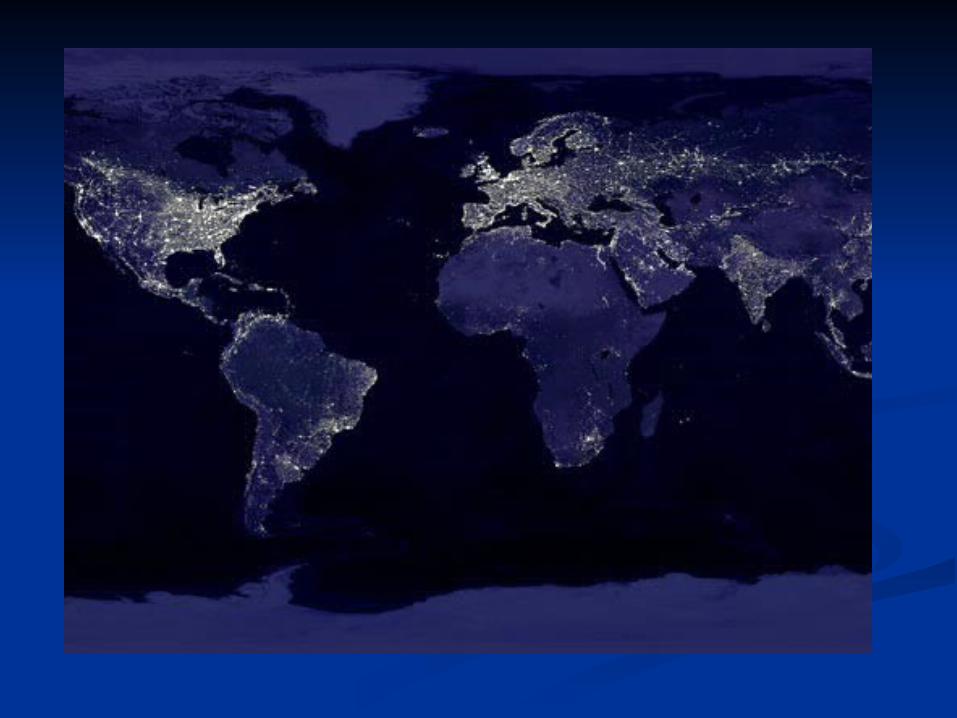


A Tale of Two Koreas
North Korea South KoreaGDP $40 billion $1,335 billion
GDP/capita $1,800 $27,600
Electricity Production
22 billion kwh 440 billion kwh
Telephone land lines
1.2 million 23.9 million
Cellular phones 0 43 million
Population 23 million 48 million
Note that in 1955 the two Koreas had approximately equal GDP per capita and they wereboth lower than Argentina’s. Today Argentina’s GDP per capita is $14,200


Pct of HHS withAll U.S.
HHs 1971Poor U.S. HHs 1994
Washing Machine 71% 72%
Dryer 44% 50%
Dishwasher 19% 20%
Refrigerator 83% 98%
Color TV 43% 93%
Telephone 93% 77%
Air Conditioner 32% 50%
One or more cars 80% 72%
Access to Goods: Growth and Poverty
Source: U.S. Census Bureau