Sepsis and septic shock - intensivistenopleiding.org · Sepsis and septic shock ... Dopa NE % * De...
52
Sepsis and septic shock Practical hemodynamic consequences Intensive Care Training Program Radboud University Medical Centre Nijmegen
Transcript of Sepsis and septic shock - intensivistenopleiding.org · Sepsis and septic shock ... Dopa NE % * De...

Sepsis and septic shockPractical hemodynamic consequences
Intensive Care Training ProgramRadboud University Medical Centre Nijmegen

Septic cardiomyopathy
• Present in > 50% and often masked by low vascular resistance - unmasked by NE
• Acute and reversible (in a few days)
• Accompanied by low filling pressures due to concomitant ↓ RV function and small increase in LV compliance
Veillard-Baron A. Ann Int Care 2011;1:6

Veillard-Baron A. Ann Int Care 2011;1:6

Veillard-Baron A. Ann Int Care 2011;1:6
RV dysfunction
Day 1 Day 2

Veillard-Baron A. Ann Int Care 2011;1:6

Septic cardiomyopathy
Veillard-Baron A. Ann Int Care 2011;1:6
Small increase in compliance

Veillard-Baron A. Ann Int Care 2011;1:6
Size of balloonis LV volume Highest mortality
Lowest mortality
Intermediate mortality

LVEF and CI in sepsis
Veillard-Baron A. Ann Int Care 2011;1:6

Excessive vasodilation
Increased endothelialpermeability
Venous pooling
Systolic myocardial dysfunction
Diastolic myocardial dysfunction
Mitochondrial dysfunctionMicrocirculatory shunting

Vasodilatation in SepsisSeptic shock with lactate acidosis
iNO synthase ↑
NO ↑
cGMP ↑
Vasopressin secretion ↑
Vasopressin stores ↓
Vasopressin plasma ↓
ATP ↓, H+ ↑, Lactate ↑ vascular smooth muscle
Open KATPOpen KCa
Cytoplasmic Calcium ↓
Phosphorylated myosin ↓
Vasodilatation


IFN-Υ ± IL-10 ↑
IDO activity ↑
Tryptophan ↓ & kynurenine ↑
Increased KT ratio plasma
Lymphocyte apoptosis ↑
Microvascular reactivity ↓
IL-6 ↑e NO ↓
Darcey CJ. PLOSone 2011;6:e21185
N = 80

Changsirivathanathamrong D. Crit Care Med 2011;39:2678-2683
INOTROPIC DOSE
IDO ACTIVITY
N = 16

Changsirivathanathamrong D. Crit Care Med 2011;39:2678-2683

Microcirculation
• Measured by Sidestream Darkfield Imaging or NIRS
• Decrease in capillary density with increased heterogeneous perfusion
• Evidence accumulating that changes in perfusion induce tissue hypoxia (in contrast to the adaptive theory)

De Backer D. Ann Intensive Care 2011;1:27

Microcirculation in sepsis
0
25
50
75
100
% perfused vessels % perfused capillaries % absent blood flow % intermittent blood flow
Control Acetylcholine
De Backer D. Am J Respir Crit Care Med 2002;166:98-104
Normal Sepsis

Nitroglycerin and microcirculation in sepsis
Boerma EC. Crit Care Med 2010;38:93-100
N = 70
Patients with severe sepsis/septic shock treated with EGDT

Boerma EC. Crit Care Med 2010;38:93-100

Mitochondrial dysfunction

XXX XXX
Sepsis ONOO- ↑↑
Peroxynitrite
PARP + Caspase activation
ApoptosisNecrosis

Treatment
• Volume loading
• Inotropic agents
• Increasing afterload with NE / vasopressin
• Vasodilator (experimental)

HES 130/0.4 versus NaCl 0.9% - CRYSTMAS• Prospective MC (N=24), DB RCT
• Age ≥ 18, severe sepsis
• Primary endpoint: amount of fluid for achieving hemodynamic stability
Guidet B. Crit Care 2012;16:R94

HES 130/0.4 versus NaCl 0.9% - CRYSTMAS• 88 vs 86 patients reached hemodynamic
stability (NS)
• Amount of fluid < with HES: 1379 ± 886 vs 1709 ± 1164 mL (p = 0.0185)
• Cumulative volume over 4 days similar
• Time to reach HDS 11.8 ± 10.1 vs 14.3 ± 11.1 hours (NS)
• No differences in LOS, morbidity, mortalityGuidet B. Crit Care 2012;16:R94

HES 130/0.4 versus NaCl 0.9% - CRYSTMAS
0
10
20
30
40
Mortality 28D Mortality 90D ARF after screening
(%)
HES 130/0.4 NaCl 0.9%
NS NS
Guidet B. Crit Care 2012;16:R94
NS

Guidet B. Crit Care 2012;16:R94

HES 130/0.42 versus Ringer’s acetate
• Adult patients with severe sepsis
• MC (N = 26), blinded, stratified clinical trial
• HES 130/042 vs Ringer’s acetate
• Daily maximum dose 33 mL/kg IBW
• Primary outcome composite death/dialysis dependence at D90
Perner A. N Engl J Med 2012;367:124-134

HES 130/0.42 versus Ringer’s acetate
0
15
30
45
60
Death/DD Day 90 Death Day 90 Severe bleeding RRT
Ringer’s HES 130/04
P = 0.03 P = 0.03 P = 0.09 P = 0.04
No differences in total amount of fluid neededPerner A. N Engl J Med 2012;367:124-134

HES 130/0.4 versus Ringer’s acetate
Perner A. N Engl J Med 2012;.../...

Durairaj L. Chest 2008;133:252-263
35.4 - 65.2%
15% BJA 2012

Fluid therapy and microcirculation
Proportion perfused small vessels
Baseline Fluids
Early septic shock
Late septic shock Ospina-Tascon G. Intensive Care Med 2010;36:949-955
Despite similar changes in CI

Lactate driven therapy
0
10
20
30
40
50
33,9
43,5
Mor
talit
y (%
)
Control Lactate driven
N = 348P = 0.067
Admission lactate ≥ 3 mmol/lGoal: lactate ↓ ≥ 20% in 2 hrs
• After correction for risk factors mortality lower in lactate group (HR 0.61, p = 0.006)
• Duration MV ↓, duration ICU stay ↓, lower SOFA score
Jansen TC. Am J Respir Crit Care Med 2010, 182:752-761

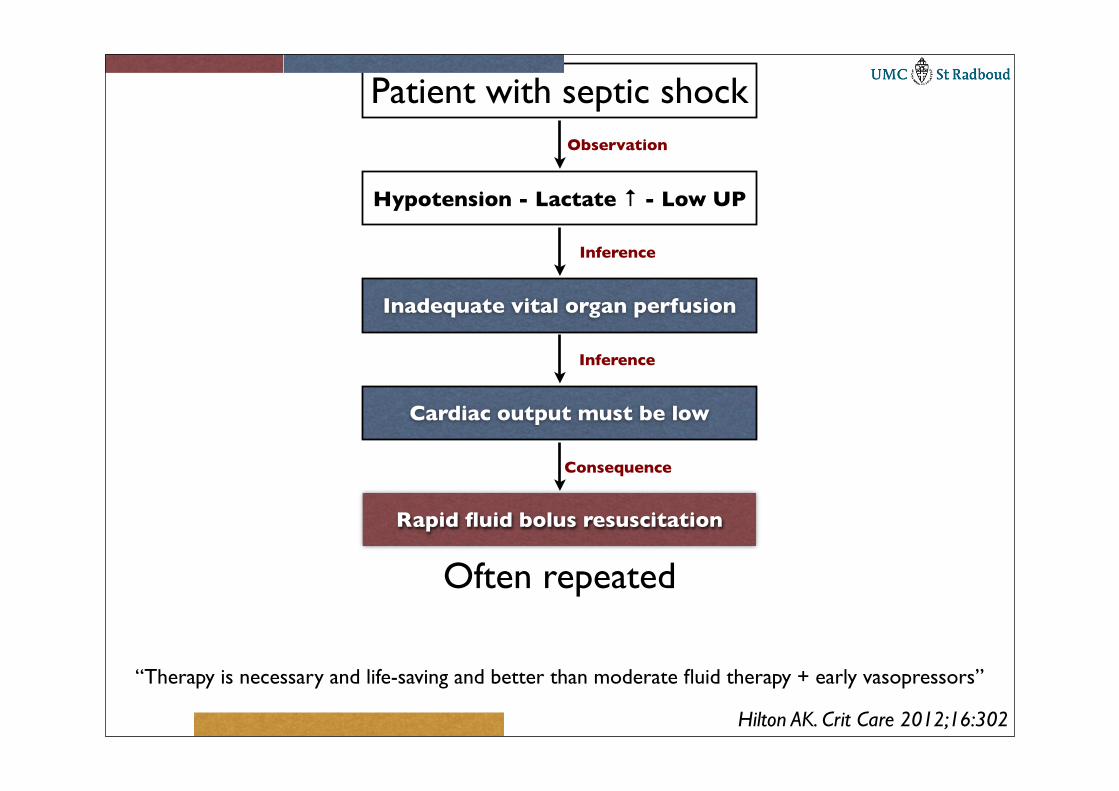
Patient with septic shock
Hypotension - Lactate ↑ - Low UP
Observation
Inadequate vital organ perfusion
Inference
Cardiac output must be low
Inference
Rapid fluid bolus resuscitation
Consequence
“Therapy is necessary and life-saving and better than moderate fluid therapy + early vasopressors”
Often repeated
Hilton AK. Crit Care 2012;16:302

SmvO2
Cardiac Output = VO2
CaO2 - CmvO2
Fick Equation
CaO2 = (Hb (mmol/l) × 2.16 × SaO2) + (0.003 × PaO2 (mm Hg))
CmvO2 = (Hb (mmol/l) × 2.16 × SmvO2) + (0.003 × PmvO2 (mm Hg))
The amount of dissolved oxygen in plasma is negligible

Normally ScvO2<SmvO2 due to the higher oxygen extraction of the brain
Oxygen extraction in the heart almost maximal
Oxygen extraction in the kidneys is minimal
Low cardiac output may decrease perfusion of the GI tract, lowering oxygen saturation in the VCI and changing the relationship between ScvO2 - SmvO2

General remarks
• SmvO2 is a surrogate for cardiac output only if Hb, SaO2 and VO2 remain constant
• If SaO2 is low, the difference between A-V saturation is a better surrogate for cardiac output
• The relation between cardiac output and SmvO2 is non-lineair (next slide)

50% 70%
Mixed Venous Oxygen Saturation (%)
Car
diac
Inde
x (%
of n
orm
al)

Initial lactate clearance and mortality
0
20
40
60
80
100
In-Hosptal mortality
%
Lactate clearance Lactate non-clearance
N = 166
N = 38N = 128
Non-clearance is decrease in lactate < 10%
Lactate Non-
clearance
Lactate clearance
ScvO2 < 70% 3 20 23
ScvO2 ≥ 70% 11 114 125
14 134 148
P = 0.457
No relation between ScvO2 > 70 and lactate clearance
Arnold RC. Shock 2009;32:35-39

ScvO2 and cardiac output in sepsis
Perner A. Acta Anaesthesiol Scand 2010;54:98-102

Arterial waveform derived variables
10,3 0,4 0,5 0,6 0,7 0,8 0,9
CVP
GEDVI
LVEDAI
SVV
SPV
PPV
AUC
29 full-text articles685 patients
Marik PE. Crit Care Med 2009;37:2642-2647
P < 0.001
P < 0.001

PPV SPV
SVV
Lansdorp B. BJA 2012: Epub ahead of print

Predictive value of PLR test
10,6
Semirecumbent starting
Supine starting
Arrhythmias
Sinus rhythm
Partial support
Controlled ventilation
PLR-cPP
PLR-cCO
Area Under Curve
0,80
P < 0.001
9 full-text articles353 patients
Cavallaro F. Intensive Care Med 2010;36:1475-1483

0
1
2
3
4
5
6
-6 -4 -2 0 2 4 6 8 10 12 14 16 18 20
CVP (mm Hg)
Increase in CVP
Venous ReturnCardiac Output
(l/min)
PEEP increase
Increase in CVP

0
1
2
3
4
5
6
-6 -4 -2 0 2 4 6 8 10 12 14 16 18 20
CVP (mm Hg)
Venous ReturnCardiac Output
(l/min)

Dopamine or Norepi in patients with shock
0
5
10
15
20
25
30
Arrhythmic events
NorepenephrineDopamine
%
De Backer D. N Engl J Med 2010;362:779-789

0
5
10
15
20
25
Arrhythmias A. fib VT VF0,51,0
11,012,4
1,22,4
20,5
24,1
Dopa NE
*%
De Backer D. N Engl J Med 2010;362;779-789

Dopamine or Norepi in patients with shock
De Backer D. N Engl J Med 2010;362:779-789

Norepinephrine and preload
Before After
CI (l/min/m2) 3.2 ± 1.0 3.6 ± 1.1
GEDVI (ml/m2) 694 ± 148 742 ± 168
Septic shockN = 105
Decreased SVV from13 ± 6 to 9 ± 5%
Only patients with a low EF (< 45%) and an increasein MAP > 75 mm Hg had no increase in CI
Hamzaoui O. Crit Care 2010;14:R142

Vasodilatory shock - N = 21
NE 0.20 ± 0.18μg/kg/min.
NE 0.29 ± 0.18μg/kg/min.
NE 0.42 ± 0.31μg/kg/min.
Nygren A. Acta Anaesthesiol Scand 2010;54:814-820

Levosimendan and myocardial depression
Enrolment
ScreeningLVEF > 45%
48 hours
Dobu (5 μg/kg/min) +Norepinephrine (MAP 70)
Start
ScreeningLVEF < 45%
EchoHemodynamics
Gastric perfusion
24 hours
Levosimendan (0.2) ordobutamine (5 μg/kg/min)
Stop
EchoHemodynamics
Gastric perfusion
Morelli A. Intensive Care Med 2005;31:638-644
N = 28

Levosimendan and myocardial depression
Morelli A. Intensive Care Med 2005;31:638-644
LevosimendanLevosimendan DobutamineDobutamine
Baseline 24 h Baseline 24 h
EDVI (ml/m2) 75.8 ± 23.8 66.2 ± 24.6 ** 84.2 ± 25.1 82.9 ± 26.4
ESVI (ml/m2) 46.7 ± 21.9 36.9 ± 19.4 ** 52.4 ± 25.8 50.5 ± 25.3
LVEF (%) 37.1 ± 3.0 45.4 ± 8.4 ** 37.3 ± 2.6 40.8 ± 11.3
20
35
50
SVI LVSWI SVI LVSWI
Before After
Levosimendan Dobutamine
** **