Sentry 2000 - Extant Techextanttech.com/Docs/Sentry Manager Operations Manual.pdf · 1 Sentry 2000...
41
1 Sentry 2000 Operations Manual The Extant Technology Sentry 2000 is a miniature microprocessor controlled instrument designed to operate in the harsh pasteurizer environment. Logged data is transferred by placing the Sentry 2000 onto the Interface. Sentry Manager, a Microsoft Windows © application used in conjunction with the Extant Technology Interface to setup and initialize the Sentry 2000, recover data after a test, and display and analyze test results. Using Sentry Manager, values specific to measurement requirements are selected by the user. These variables include: time of day and / or temperature at which logging will commence and the time interval between measurements (sample rate). When a Sentry 2000 is connected to an Interface, these variables are read and used to control operation.
Transcript of Sentry 2000 - Extant Techextanttech.com/Docs/Sentry Manager Operations Manual.pdf · 1 Sentry 2000...
1
Sentry 2000
Operations Manual
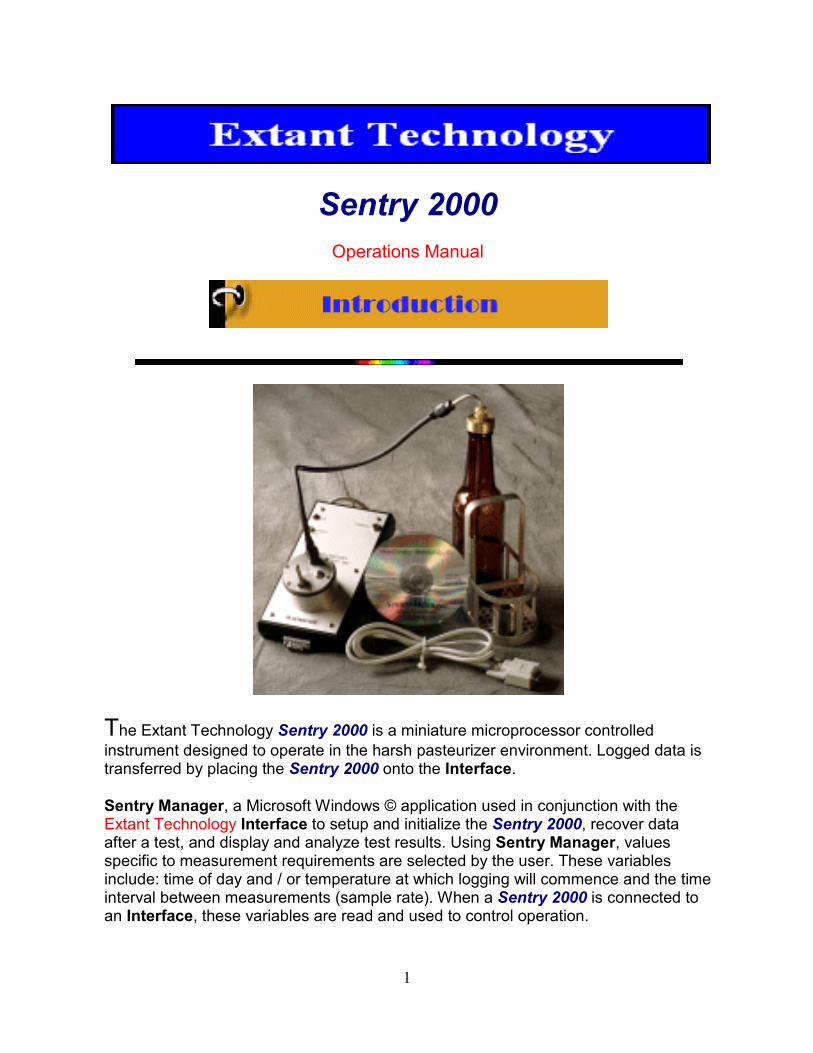
The Extant Technology Sentry 2000 is a miniature microprocessor controlled instrument designed to operate in the harsh pasteurizer environment. Logged data is transferred by placing the Sentry 2000 onto the Interface.
Sentry Manager, a Microsoft Windows © application used in conjunction with the Extant Technology Interface to setup and initialize the Sentry 2000, recover data after a test, and display and analyze test results. Using Sentry Manager, values specific to measurement requirements are selected by the user. These variables include: time of day and / or temperature at which logging will commence and the time interval between measurements (sample rate). When a Sentry 2000 is connected to an Interface, these variables are read and used to control operation.
2
Table of Contents
The following contents provide detailed information for installation and operation of the Sentry 2000 and Sentry Manager software. It is suggested that Chapter 1.0, Installation and Configuration be reviewed first. Please pay particular attention to Section 1.5 concerning the installation of Table Files for your Sentry 2000.
Section 1.0 Installation and Configuration
Section 2.0 Sentry Operation
Section 3.0 Manual Operation
Section 4.0 Automatic Operation
Section 5.0 Water Bath Test
Section 6.0 Warranty and Technical Support
3
Section 1.0
1.1 Applying Power to the Interface
The Interface contains a rechargeable battery pack which will, from a full charge, provide power for at least 8 hours. Charge the batteries by plugging the Battery Charger output connector into the power connector on the Interface. Twelve to fourteen hours are required to fully charge the batteries. The Interface can be operated with the Battery Charger attached; the batteries will be charged regardless of the position of the Power Switch.
1.2 Connecting the Interface to your PC
1.2.1 Serial Port Installation
Connect the Interface cable to an available Serial Port on the PC (COM1, COM2, COM3 or COM4).
1.2.2 USB Port Installation
Connect the USB to Serial Adapter to the 9 pin connector on the Interface cable and plug the USB adapter into an available USB port. Windows will recognize the USB device and install it. Use the CD that came with the USB adapter (if necessary) to install the Serial Port driver. Select an unused Serial Port from COM1, COM2, COM3 or COM4.
Note: Insure that an internal modem or some other device is not utilizing the selected Serial Port.
4
1.3 Installing Sentry Manager Software
Insert the Sentry Manager CD into the CD drive of the PC. The installation screen should appear and you will be prompted to select the installation desired. The following options are available:
Install Sentry Manager Software to your hard drive Copy / View Operation Manual
When Sentry Manager is installed, a folder will be generated in the Start - Programs Task Bar titled Sentry Manager. Sentry Manager can be run by selecting Sentry Manager.
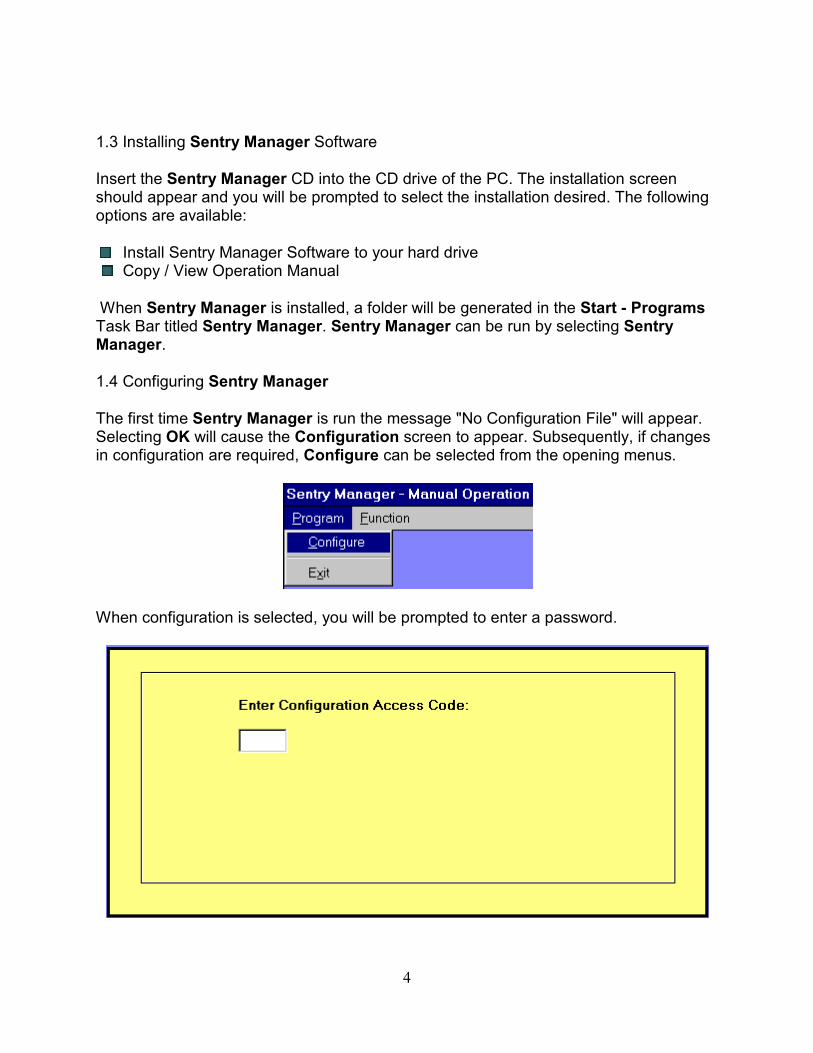
1.4 Configuring Sentry Manager
The first time Sentry Manager is run the message "No Configuration File" will appear. Selecting OK will cause the Configuration screen to appear. Subsequently, if changes in configuration are required, Configure can be selected from the opening menus.
When configuration is selected, you will be prompted to enter a password.
5
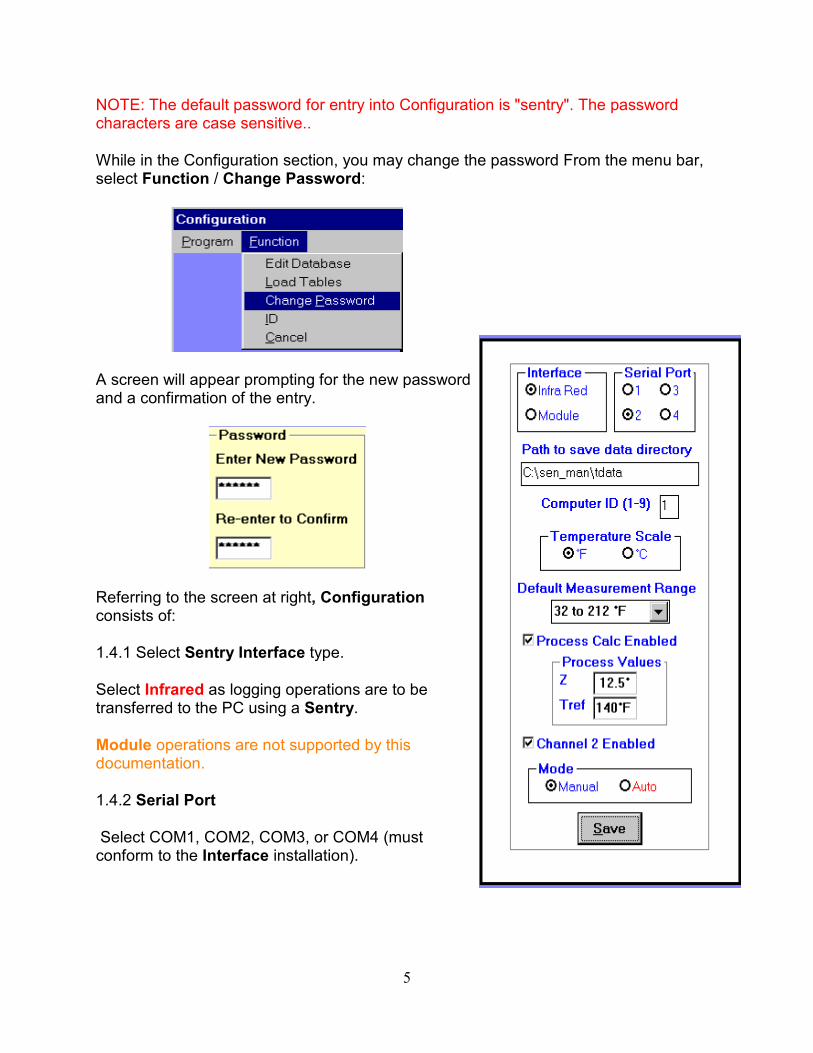
NOTE: The default password for entry into Configuration is "sentry". The password characters are case sensitive..
While in the Configuration section, you may change the password From the menu bar, select Function / Change Password:
A screen will appear prompting for the new password and a confirmation of the entry.
Referring to the screen at right, Configuration consists of:
1.4.1 Select Sentry Interface type.
Select Infrared as logging operations are to be transferred to the PC using a Sentry.
Module operations are not supported by this documentation.
1.4.2 Serial Port
Select COM1, COM2, COM3, or COM4 (must conform to the Interface installation).
6
1.4.3 Enter Path to Save Data Directory
Enter the path to a directory where data files will be saved; i.e. c:\sen_man\tdata
Note: The directory can be any valid directory. Sentry Manager will create the directory if it does not exist.
1.4.4 Computer ID
Unless more than one computer will be used and it is desirable to segregate data, use the default value - Computer 1.
1.4.5 Select the desired Temperature Scale
Fahrenheit or Centigrade
1.4.6 Default Measurement Range
Select the measurement range that is the default for the Sentry(s) you have received. The Sentry Manager Program defaults to a measurement range of 0-100 degrees C. Refer to the documentation supplied with your Sentry(s) to verify the correct measurement range you should select.
1.4.7 PU Calculation Enabled
When checked, allows calculation, display, and printing of pasteurization units (Pus). A user input box appears with default values. To change the values, place the curser within the box and click. A new value can then be entered.
NOTE: Changing any of the default values will result in the calculations expressed as an F0 calculation used primarily in the food processing industry. The default values are standards for the brewing industry. It is suggested that these values not be changed without careful consideration.
1.4.8 Channel 2 Enabled
When checked, Sentry Manager will operate with two channel Sentrys. Typically, one channel will log ambient, or spray temperature while the other channel logs product temperature.
1.4.9 Manual Mode
Manual mode allows the operator to control all Sentry Manager initialization values and functions. If Manual Mode is chosen, select Save. The Configuration screen will be replaced with the Sentry Manager Manual Operation screen and normal operation will be enabled.
7
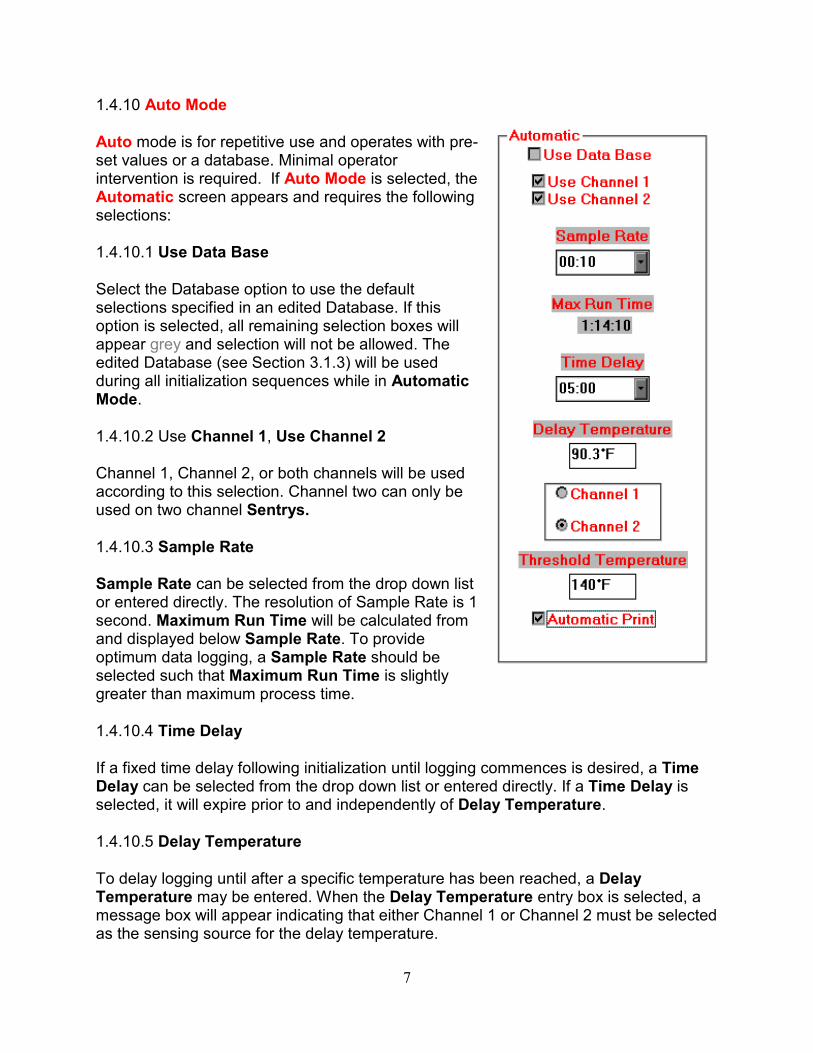
1.4.10 Auto Mode
Auto mode is for repetitive use and operates with pre-set values or a database. Minimal operator intervention is required. If Auto Mode is selected, the Automatic screen appears and requires the following selections:
1.4.10.1 Use Data Base
Select the Database option to use the default selections specified in an edited Database. If this option is selected, all remaining selection boxes will appear grey and selection will not be allowed. The edited Database (see Section 3.1.3) will be used during all initialization sequences while in Automatic Mode.
1.4.10.2 Use Channel 1, Use Channel 2
Channel 1, Channel 2, or both channels will be used according to this selection. Channel two can only be used on two channel Sentrys.
1.4.10.3 Sample Rate
Sample Rate can be selected from the drop down list or entered directly. The resolution of Sample Rate is 1 second. Maximum Run Time will be calculated from and displayed below Sample Rate. To provide optimum data logging, a Sample Rate should be selected such that Maximum Run Time is slightly greater than maximum process time.
1.4.10.4 Time Delay
If a fixed time delay following initialization until logging commences is desired, a Time Delay can be selected from the drop down list or entered directly. If a Time Delay is selected, it will expire prior to and independently of Delay Temperature.
1.4.10.5 Delay Temperature
To delay logging until after a specific temperature has been reached, a Delay Temperature may be entered. When the Delay Temperature entry box is selected, a message box will appear indicating that either Channel 1 or Channel 2 must be selected as the sensing source for the delay temperature.
8
NOTE: It is necessary to indicate the correct Default Measurement Range in the main configuration screen prior to entering a Delay Temperature. If the Delay Temperature has not been reached within one hour after initialization, the Sentry will automatically shut down. The Sentry must be reinitialized in order to log data.
1.4.10.6 Threshold Temperature
For calculation and display of Time Above Temperature, a Threshold Temperature must be entered.
1.4.10.7 Automatic Print
The Results screen, including the graph, will be printed automatically when OK is selected from the Results screen.
When all the desired options have been entered, select Save, indicating that configuration is complete, and the Configuration screen will be replaced with the Sentry Manager Automatic Operation screen. Automatic Operation is covered in Section 4.
1.5 Program \ Load Tables
Each Sentry (and Temperature Reference) is shipped with a Table File contained on a floppy disk (by serial number) created specifically for that unit. The table file must be installed in the same sub-directory that contains the Sentry Manager program. Sentry Manager has a feature that automatically installs Table Files in the proper directory:
1.5.1 Insert the Table File disk into drive A: or B:
1.5.2 From Sentry Manager Opening Screen, select Program / Configure from the menu bar to enter Configuration.
1.5.3 Select Program / Load Tables from the Configuration screen menu bar. The Table File will be loaded.
As a reminder, do not use a Sentry or Temperature Reference until the proper Table File has been loaded.
9
Section 2.0
The PU Sentry (Sentry) has a short probe connected directly to the case for measuring ambient temperature and a longer probe connected to the case by a flexible cable to measure internal temperature of the test container during processing. The Sentry must be configured (initialized) to meet the requirements of the measurements to be taken during a run. (See Sentry Manager Operation Section 3.0 or 4.0) The following general procedures should be used when conducting logging operations.
2.1 Prepare the Sentry
2.1.1 Place the Sentry on the Interface. The protrusion on the bottom of the Sentry will align with a similar sized opening in the center of the round indentation on the Interface front panel. Initialize the Sentry. 2.1.2 Remove the Sentry from the Interface and place it in the test container basket. Install the Channel 1 probe into the test container, using an appropriate adapter, and adjust the probe to the desired location.
2.1.3 Secure the probe cable to the container basket using the white plastic "twists" supplied with the container basket.
2.2 Conduct the logging operation (run).
2.2.1 After determining that there is sufficient vertical clearance for passage of the Sentry and test container basket through the pasteurizer, place the assembly in the pasteurizer inlet.
2.2.2 When logging is complete, remove the Sentry and the test container basket from the pasteurizer exit and return to the lab or test station.
2.2.3 Remove the Sentry from the measurement apparatus.
2.2.4 Clean and dry the exterior of the Sentry.
10
2.2.5 Place the Sentry back on the Interface.
2.2.6 Use Sentry Manager to extract and review the test data.
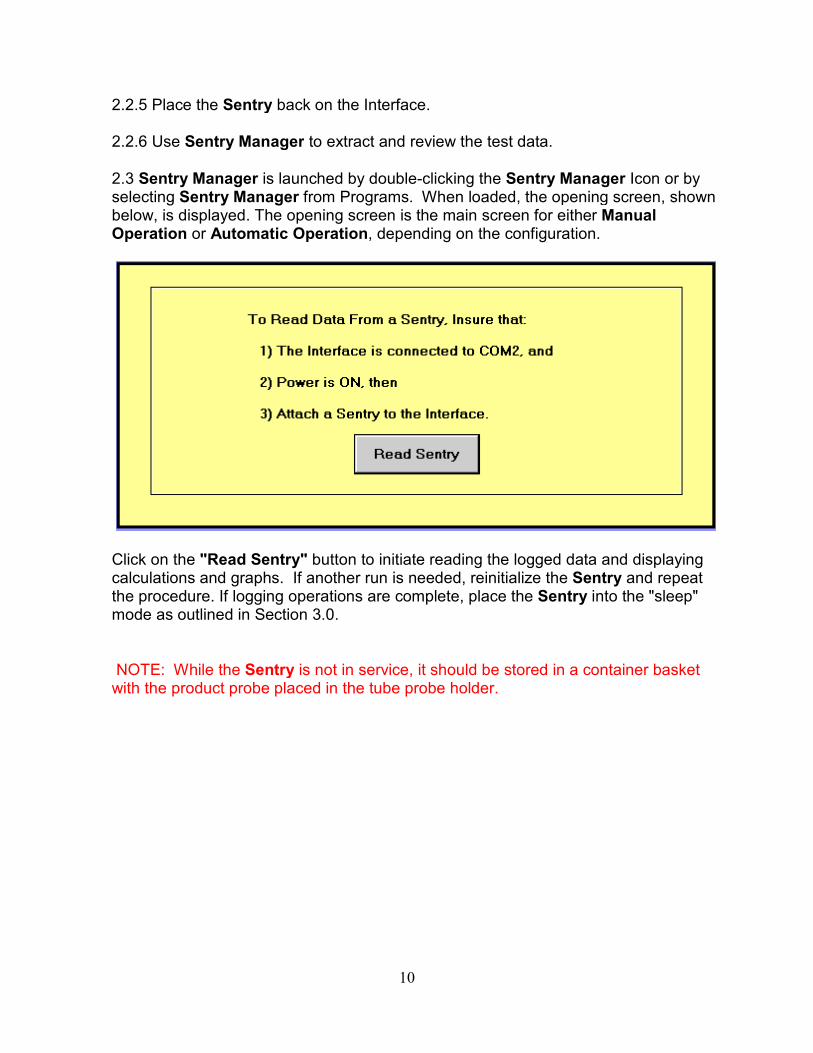
2.3 Sentry Manager is launched by double-clicking the Sentry Manager Icon or by selecting Sentry Manager from Programs. When loaded, the opening screen, shown below, is displayed. The opening screen is the main screen for either Manual Operation or Automatic Operation, depending on the configuration.
Click on the "Read Sentry" button to initiate reading the logged data and displaying calculations and graphs. If another run is needed, reinitialize the Sentry and repeat the procedure. If logging operations are complete, place the Sentry into the "sleep" mode as outlined in Section 3.0.
NOTE: While the Sentry is not in service, it should be stored in a container basket with the product probe placed in the tube probe holder.
11
Section 3.0
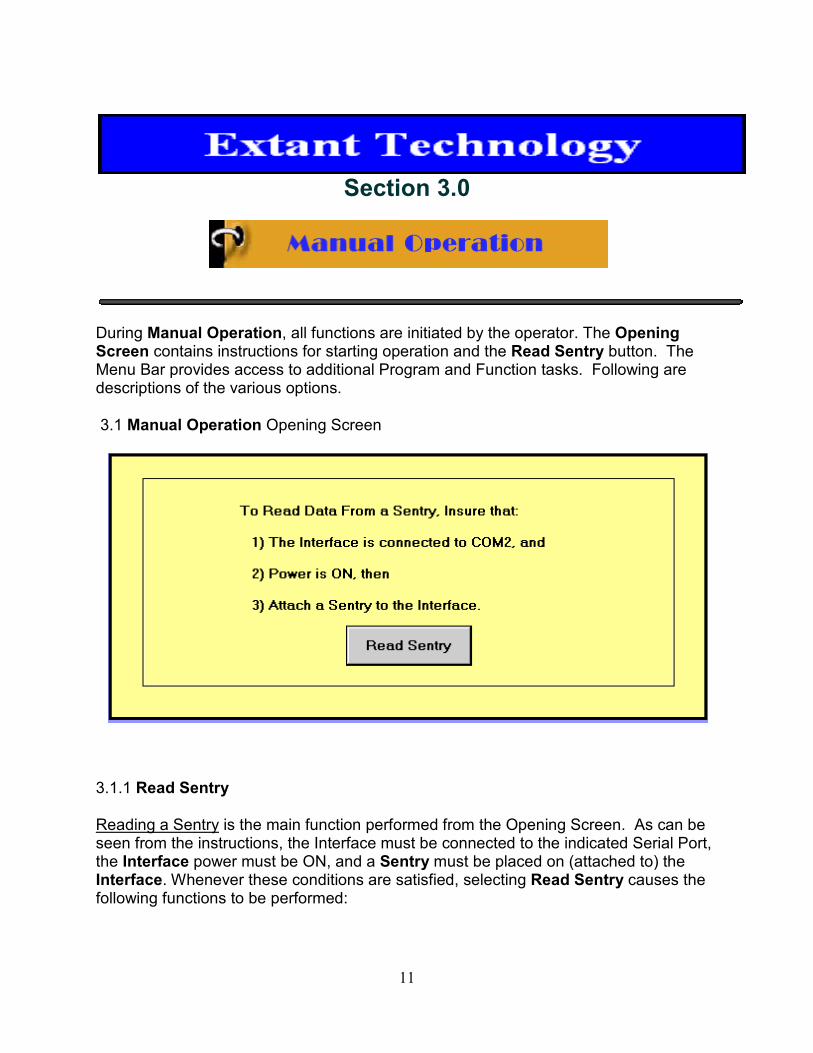
During Manual Operation, all functions are initiated by the operator. The Opening Screen contains instructions for starting operation and the Read Sentry button. The Menu Bar provides access to additional Program and Function tasks. Following are descriptions of the various options.
3.1 Manual Operation Opening Screen
3.1.1 Read Sentry
Reading a Sentry is the main function performed from the Opening Screen. As can be seen from the instructions, the Interface must be connected to the indicated Serial Port, the Interface power must be ON, and a Sentry must be placed on (attached to) the Interface. Whenever these conditions are satisfied, selecting Read Sentry causes the following functions to be performed:
12
3.1.1.1 Data stored in the Sentry is read and converted.
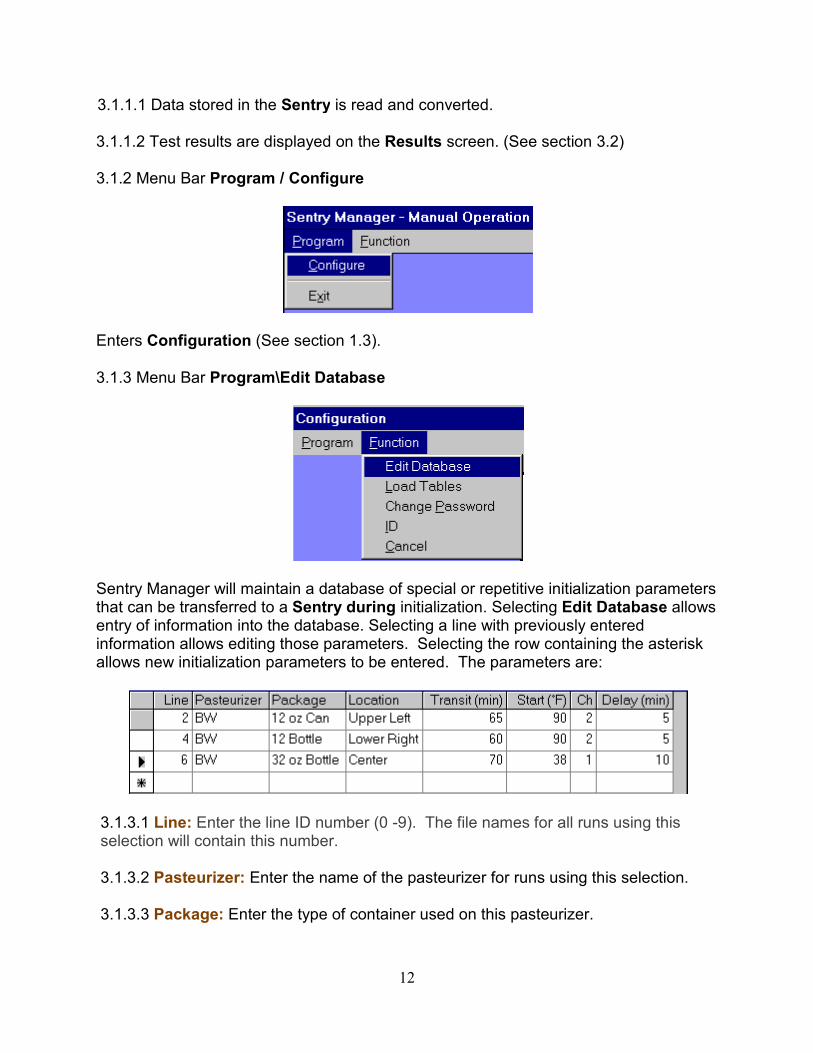
3.1.1.2 Test results are displayed on the Results screen. (See section 3.2) 3.1.2 Menu Bar Program / Configure
Enters Configuration (See section 1.3).
3.1.3 Menu Bar Program\Edit Database
Sentry Manager will maintain a database of special or repetitive initialization parameters that can be transferred to a Sentry during initialization. Selecting Edit Database allows entry of information into the database. Selecting a line with previously entered information allows editing those parameters. Selecting the row containing the asterisk allows new initialization parameters to be entered. The parameters are:
3.1.3.1 Line: Enter the line ID number (0 -9). The file names for all runs using this selection will contain this number.
3.1.3.2 Pasteurizer: Enter the name of the pasteurizer for runs using this selection.
3.1.3.3 Package: Enter the type of container used on this pasteurizer.
13
3.1.3.4 Location: Enter the position in the pasteurizer where the run will be made.
3.1.3.5 Transit (Min): Enter the normal transit time through the pasteurizer (in minutes). Run Time: (In minutes) From this entry, Sentry Manager will add a 10% margin and calculate the minimum Sample Rate.
3.1.3.6 Start (F or C): (Optional) Enter a Delay Temperature (in Fahrenheit or Centigrade, depending upon the selection made during configuration) that will start logging.
3.1.3.7 CH: (If Start (F or C) is entered) Enter the channel number (1 or 2) of the probe that is to determine Start (F or C).
3.1.3.8 Delay (Min): (Optional) Enter a Time Delay that will delay logging until the specified time has elapsed after a Sentry has been initialized.
NOTE: It is not necessary to enter data into all of the available fields in the Database.
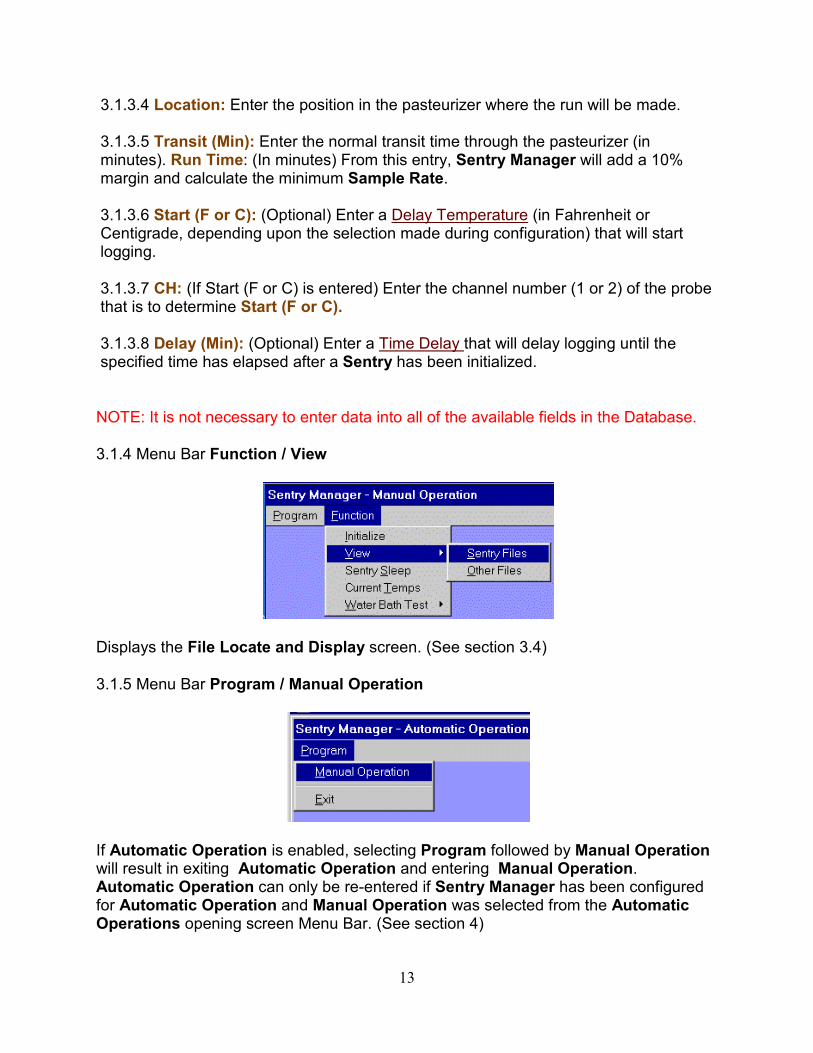
3.1.4 Menu Bar Function / View
Displays the File Locate and Display screen. (See section 3.4)
3.1.5 Menu Bar Program / Manual Operation
If Automatic Operation is enabled, selecting Program followed by Manual Operation will result in exiting Automatic Operation and entering Manual Operation. Automatic Operation can only be re-entered if Sentry Manager has been configured for Automatic Operation and Manual Operation was selected from the Automatic Operations opening screen Menu Bar. (See section 4)
14
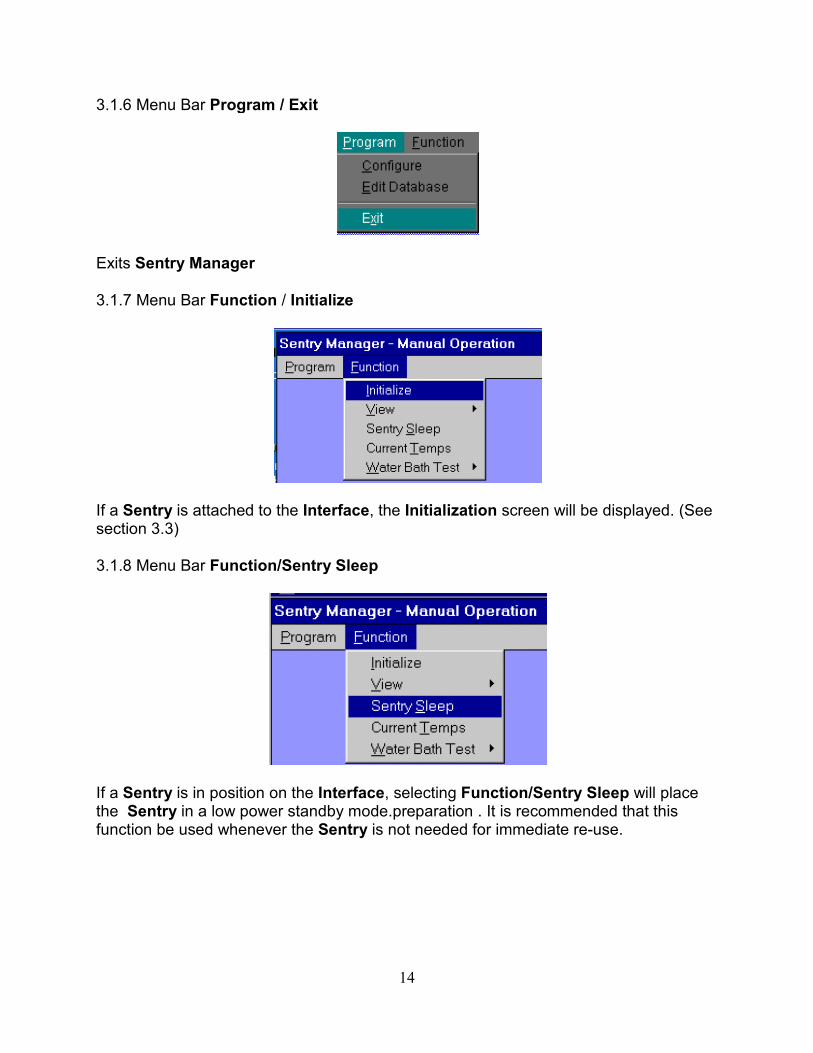
3.1.6 Menu Bar Program / Exit
Exits Sentry Manager
3.1.7 Menu Bar Function / Initialize
If a Sentry is attached to the Interface, the Initialization screen will be displayed. (See section 3.3)
3.1.8 Menu Bar Function/Sentry Sleep
If a Sentry is in position on the Interface, selecting Function/Sentry Sleep will place the Sentry in a low power standby mode.preparation . It is recommended that this function be used whenever the Sentry is not needed for immediate re-use.
15
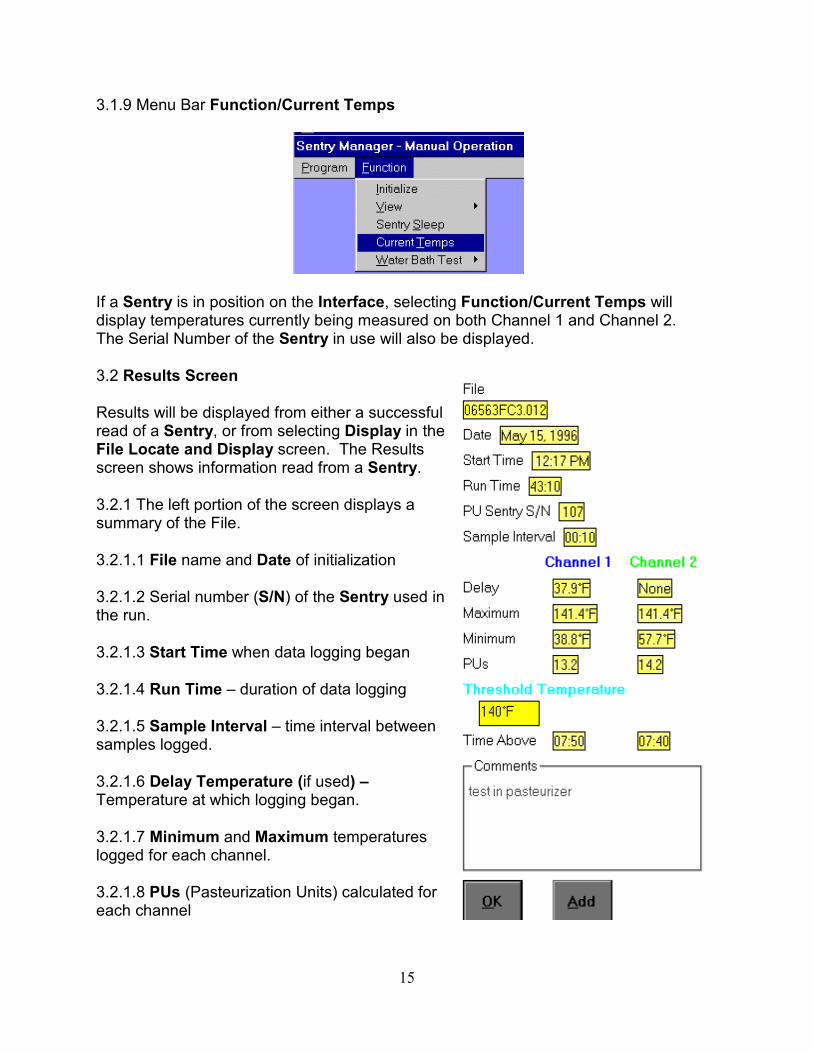
3.1.9 Menu Bar Function/Current Temps
If a Sentry is in position on the Interface, selecting Function/Current Temps will display temperatures currently being measured on both Channel 1 and Channel 2. The Serial Number of the Sentry in use will also be displayed.
3.2 Results Screen
Results will be displayed from either a successful read of a Sentry, or from selecting Display in the File Locate and Display screen. The Results screen shows information read from a Sentry.
3.2.1 The left portion of the screen displays a summary of the File.
3.2.1.1 File name and Date of initialization
3.2.1.2 Serial number (S/N) of the Sentry used in the run.
3.2.1.3 Start Time when data logging began
3.2.1.4 Run Time – duration of data logging
3.2.1.5 Sample Interval – time interval between samples logged.
3.2.1.6 Delay Temperature (if used) – Temperature at which logging began.
3.2.1.7 Minimum and Maximum temperatures logged for each channel.
3.2.1.8 PUs (Pasteurization Units) calculated for each channel
16
3.2.1.9 A Threshold Temperature (if entered in the text box) will result in Time Above the Threshold Temperature being calculated and displayed for each channel.
3.2.1.10 If the displayed results are new from a Sentry, Comments, in addition to those entered during Initialization can be entered in the Comment window. If the displayed results are from a previously read and saved file, additional comments cannot be entered.
3.2.2 The right portion of the Results screen contains:
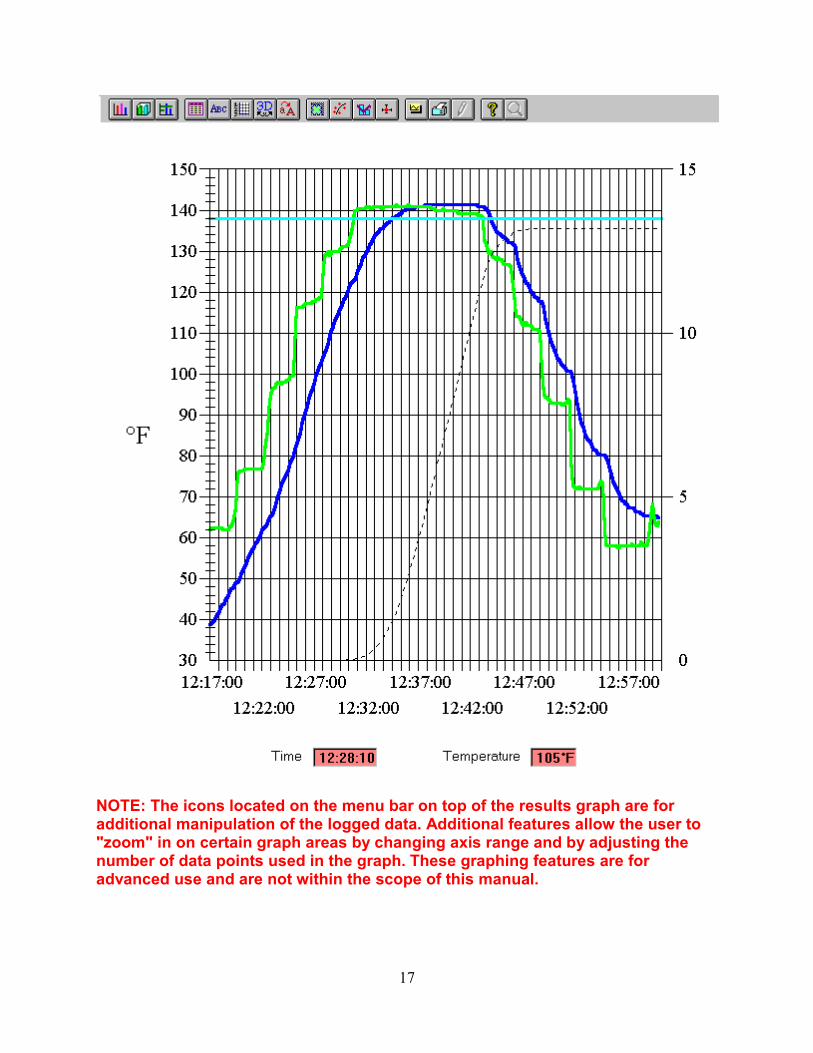
3.2.2.1 A graph of Temperature as a function of Time of Day for the channels logged. The temperature axis is scaled to 10 degrees above and below the maximum and minimum temperatures on the graph.
3.2.2.2 A graph of PUs accumulated as a function of Time of Day. The accumulated PUs are represented by a black dotted line. The right side PU axis is variably scaled based on maximum calculated PUs.
3.2.2.3 If a Threshold Temperature is entered, a horizontal line at that temperature is displayed.
3.2.2.4 For a two channel graph, the color of each graph corresponds to the Channel labels on the left portion of the screen. Similarly, the color of the Threshold Temperature label is the same as its graphic color.
3.2.2.5 As the mouse pointer is moved within the graph, the Time and Temperature values for that exact position on the graph are displayed in the corresponding boxes blow the graph.
17
NOTE: The icons located on the menu bar on top of the results graph are for additional manipulation of the logged data. Additional features allow the user to "zoom" in on certain graph areas by changing axis range and by adjusting the number of data points used in the graph. These graphing features are for advanced use and are not within the scope of this manual.
18
3.3 Command buttons are on the left at the bottom of the screen:
3.3.1 OK Command Button
When OK is selected:
3.3.1.1 If data was read from a Sentry, the displayed data will be saved in the named file. Following saving data, the query "Reinitialize?" will be displayed. Selecting "OK" will proceed to Initialization (See section 3.5); otherwise the Sentry will enter Sleep Mode and the Opening Screen will appear. 3.3.1.2 If a previously saved file is displayed, when OK is selected, the File Locate and Display screen (See section 3.4) will be re-displayed.
3.3.2 Add Command Button
Selecting Add copies the graph from the Results screen to the Multiple Graph screen and causes the Multiple Graph screen to be displayed. (See section 3.6)
3.3.3 Cancel Command Button (only if Multi Graph in use)
The Cancel Command Button is visible only if the Multiple Graph screen contains graphs. Selecting Cancel allows exiting the Results screen without copying the graph to the Multiple Graph screen or erasing the Multiple Graph screen so that additional graphs can be added.
3.4 The Menu Bar of the Results screen contains Display and View functions.
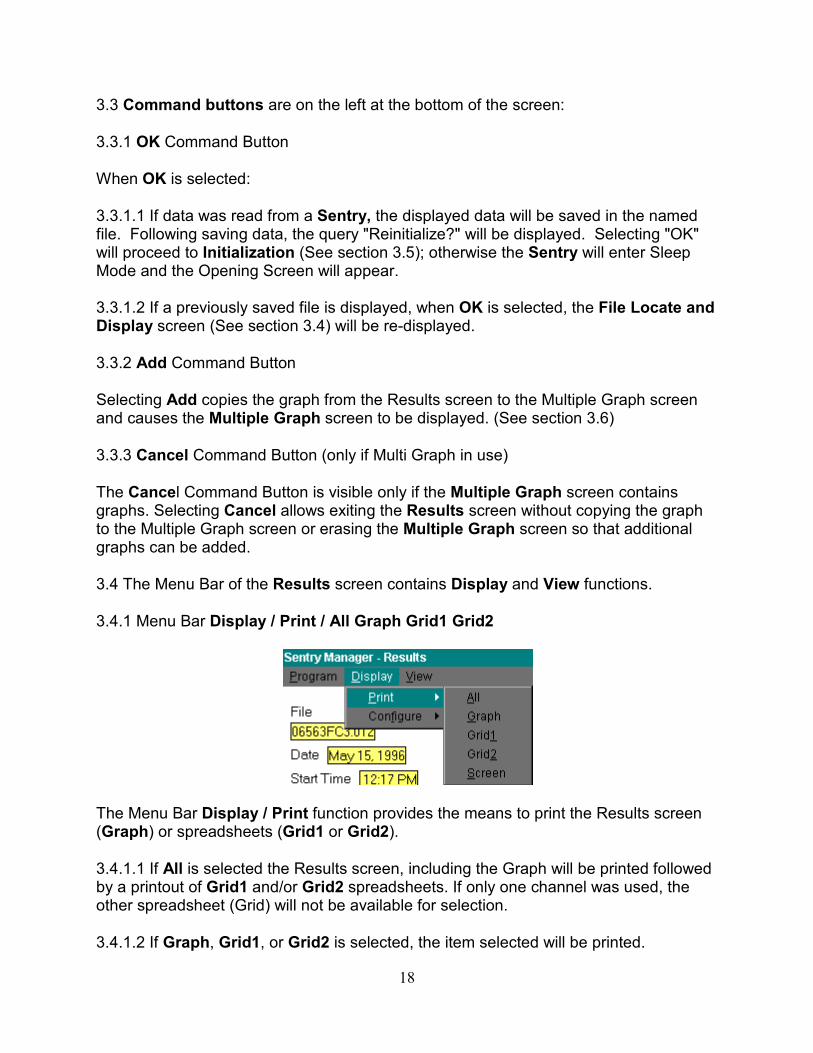
3.4.1 Menu Bar Display / Print / All Graph Grid1 Grid2
The Menu Bar Display / Print function provides the means to print the Results screen (Graph) or spreadsheets (Grid1 or Grid2).
3.4.1.1 If All is selected the Results screen, including the Graph will be printed followed by a printout of Grid1 and/or Grid2 spreadsheets. If only one channel was used, the other spreadsheet (Grid) will not be available for selection.
3.4.1.2 If Graph, Grid1, or Grid2 is selected, the item selected will be printed.
19
3.4.1.3 The Screen selection prints a "screen print" of the Results and Graph.
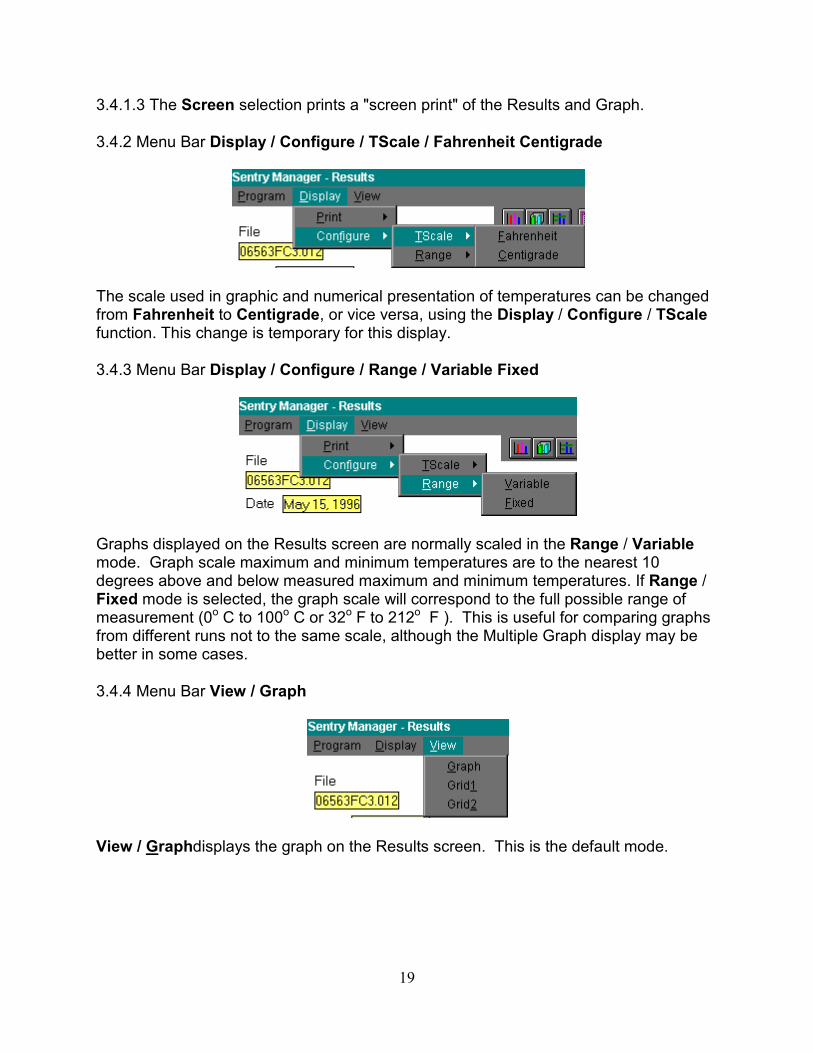
3.4.2 Menu Bar Display / Configure / TScale / Fahrenheit Centigrade
The scale used in graphic and numerical presentation of temperatures can be changed from Fahrenheit to Centigrade, or vice versa, using the Display / Configure / TScale function. This change is temporary for this display.
3.4.3 Menu Bar Display / Configure / Range / Variable Fixed
Graphs displayed on the Results screen are normally scaled in the Range / Variable mode. Graph scale maximum and minimum temperatures are to the nearest 10 degrees above and below measured maximum and minimum temperatures. If Range / Fixed mode is selected, the graph scale will correspond to the full possible range of measurement (0o C to 100o C or 32o F to 212o F ). This is useful for comparing graphs from different runs not to the same scale, although the Multiple Graph display may be better in some cases.
3.4.4 Menu Bar View / Graph
View / Graphdisplays the graph on the Results screen. This is the default mode.
20
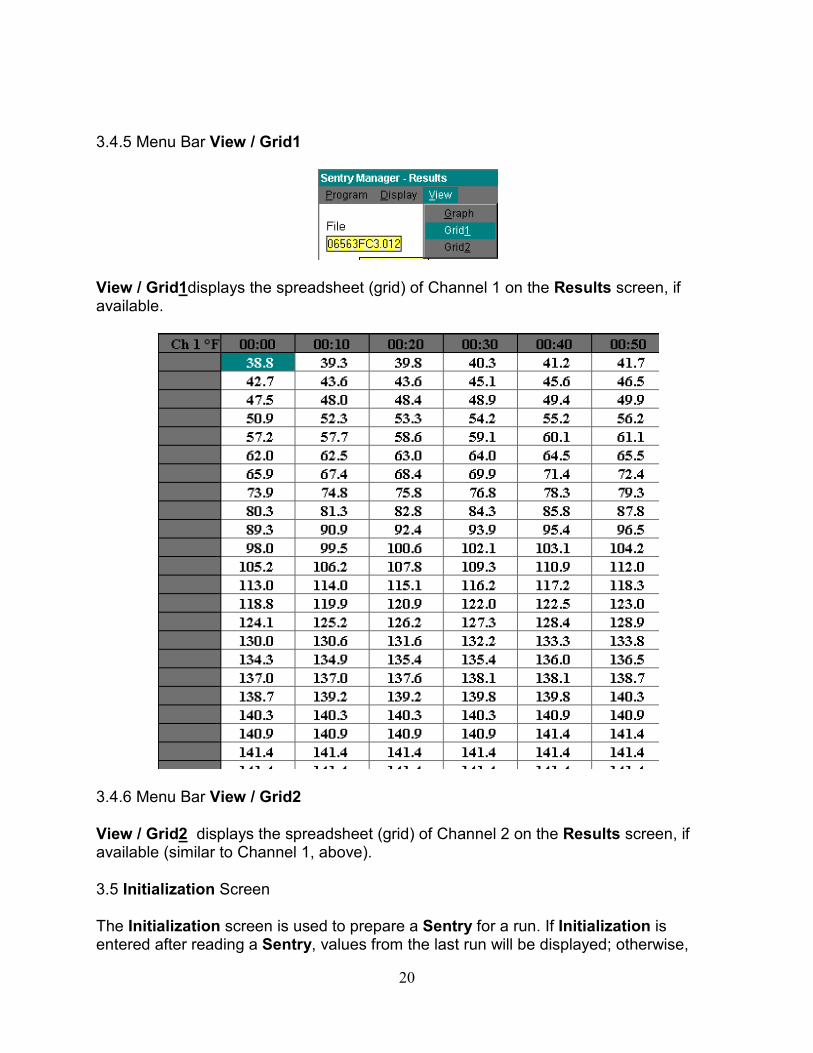
3.4.5 Menu Bar View / Grid1
View / Grid1displays the spreadsheet (grid) of Channel 1 on the Results screen, if available.
3.4.6 Menu Bar View / Grid2
View / Grid2 displays the spreadsheet (grid) of Channel 2 on the Results screen, if available (similar to Channel 1, above).
3.5 Initialization Screen
The Initialization screen is used to prepare a Sentry for a run. If Initialization is entered after reading a Sentry, values from the last run will be displayed; otherwise,
21
values from the last initialization or default values will be displayed. The following variables can be initialized:
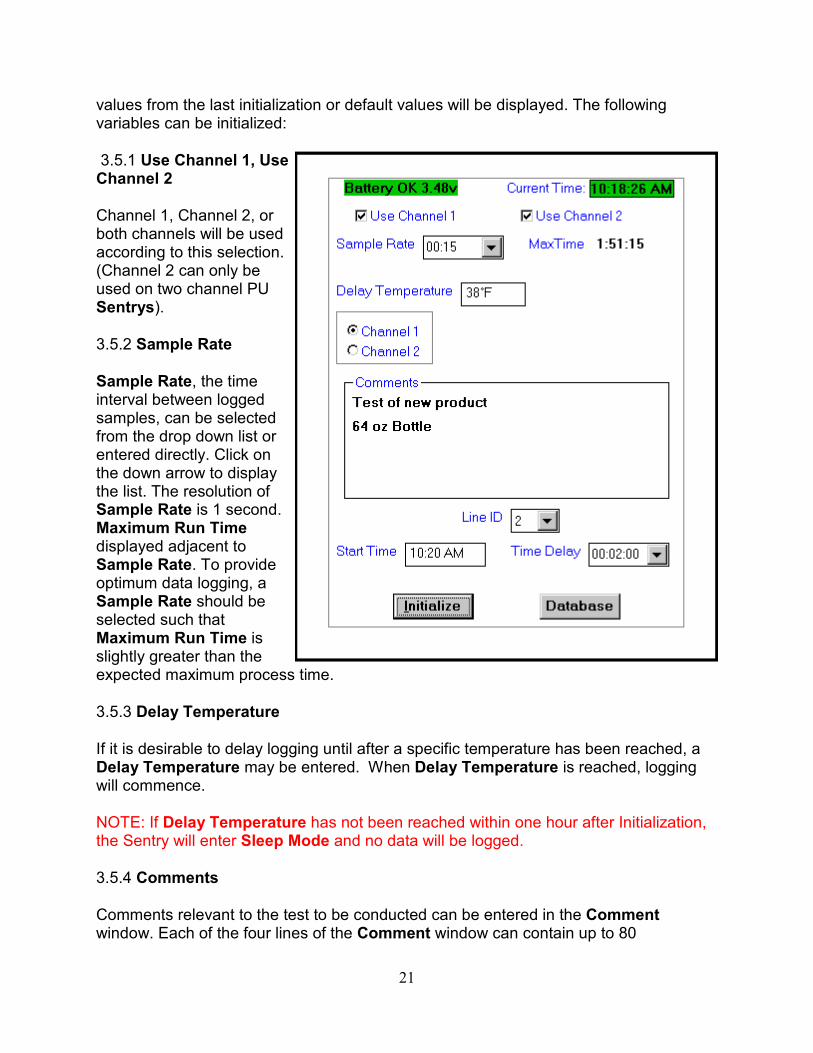
3.5.1 Use Channel 1, Use Channel 2
Channel 1, Channel 2, or both channels will be used according to this selection. (Channel 2 can only be used on two channel PU Sentrys).
3.5.2 Sample Rate
Sample Rate, the time interval between logged samples, can be selected from the drop down list or entered directly. Click on the down arrow to display the list. The resolution of Sample Rate is 1 second. Maximum Run Time displayed adjacent to Sample Rate. To provide optimum data logging, a Sample Rate should be selected such that Maximum Run Time is slightly greater than the expected maximum process time.
3.5.3 Delay Temperature
If it is desirable to delay logging until after a specific temperature has been reached, a Delay Temperature may be entered. When Delay Temperature is reached, logging will commence.
NOTE: If Delay Temperature has not been reached within one hour after Initialization, the Sentry will enter Sleep Mode and no data will be logged.
3.5.4 Comments
Comments relevant to the test to be conducted can be entered in the Comment window. Each of the four lines of the Comment window can contain up to 80
22
characters. If a comment is longer than the window, it will scroll as entered. Printed outputs will contain the complete comment.
3.5.5 Line ID
For convenience, an identifier (“0” to “9”) for a line or pasteurizer can be selected. The Line ID becomes the first digit of the file name extension; i.e., for a Line ID of “3” the file extension would be .312. By selecting a Line ID, the data files for similarly identified runs can be grouped when selected in the View Files function. The default value for Line ID is “0”.
3.5.6 Start Time / Time Delay
A initialized Sentry will begin logging (subject to Delay Temperature) after the Time Delay displayed. A Start Time (of day) can be entered in the Start Time box. Entry must be in the form hh:mm and will be interpreted within 12 hours of Current Time; ie, if it is 2:15 PM and Start at 2:00 is entered, Start Time will be 2:00 AM. Delay Time will be calculated from a Start Time entry and displayed. Alternatively, a Delay Time can be selected from the drop down list or entered directly. Start Time (of day) will be calculated and displayed. If a Delay Temperature value was entered, Start Time will be reached before a Sentry evaluates Delay Temperature.
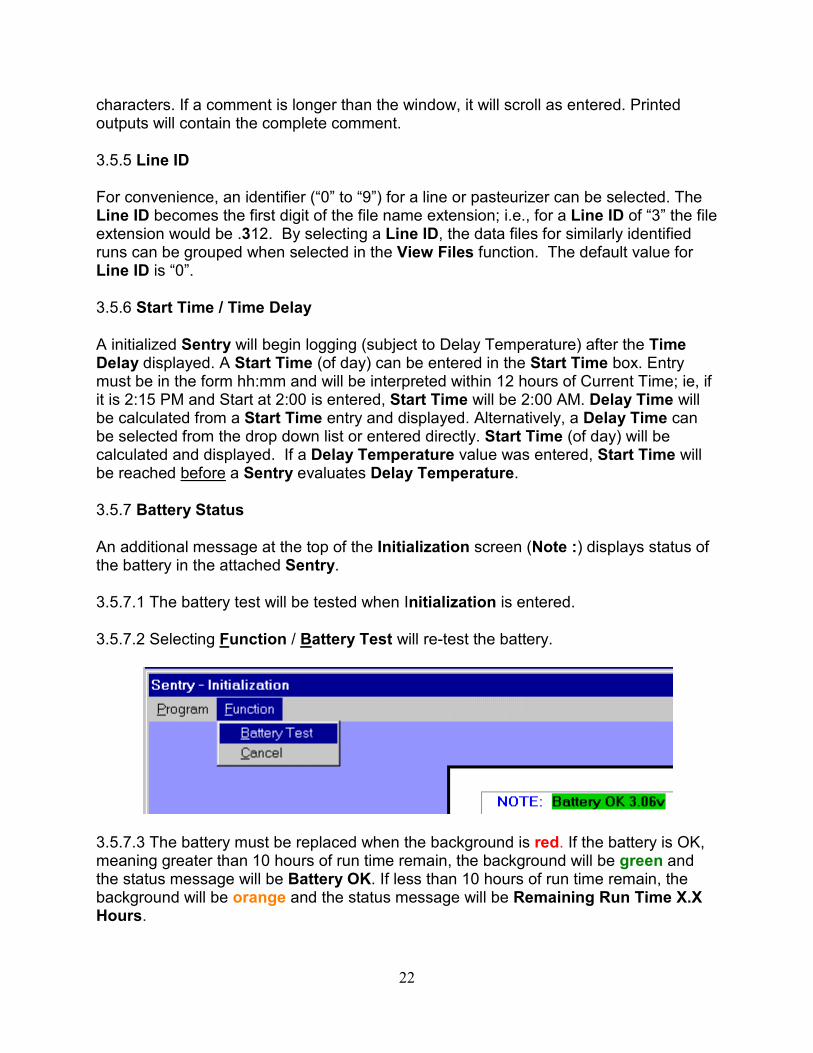
3.5.7 Battery Status
An additional message at the top of the Initialization screen (Note :) displays status of the battery in the attached Sentry.
3.5.7.1 The battery test will be tested when Initialization is entered.
3.5.7.2 Selecting Function / Battery Test will re-test the battery.
3.5.7.3 The battery must be replaced when the background is red. If the battery is OK, meaning greater than 10 hours of run time remain, the background will be green and the status message will be Battery OK. If less than 10 hours of run time remain, the background will be orange and the status message will be Remaining Run Time X.X Hours.
23
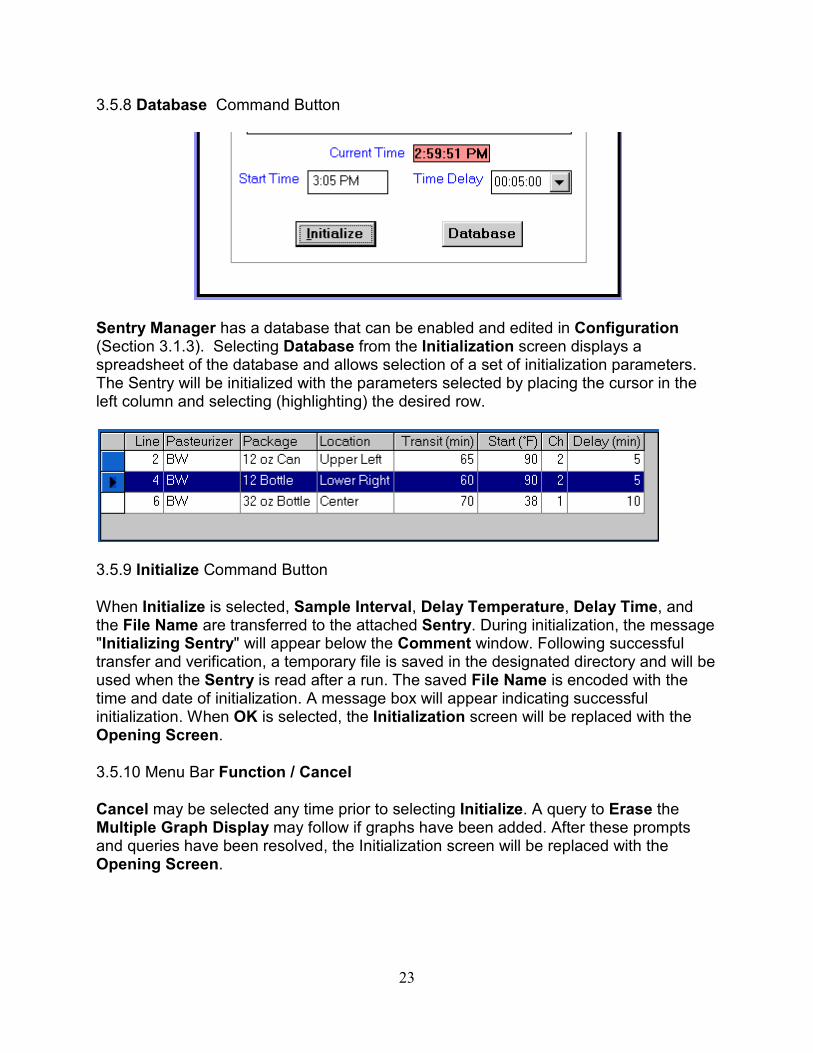
3.5.8 Database Command Button
Sentry Manager has a database that can be enabled and edited in Configuration (Section 3.1.3). Selecting Database from the Initialization screen displays a spreadsheet of the database and allows selection of a set of initialization parameters. The Sentry will be initialized with the parameters selected by placing the cursor in the left column and selecting (highlighting) the desired row.
3.5.9 Initialize Command Button
When Initialize is selected, Sample Interval, Delay Temperature, Delay Time, and the File Name are transferred to the attached Sentry. During initialization, the message "Initializing Sentry" will appear below the Comment window. Following successful transfer and verification, a temporary file is saved in the designated directory and will be used when the Sentry is read after a run. The saved File Name is encoded with the time and date of initialization. A message box will appear indicating successful initialization. When OK is selected, the Initialization screen will be replaced with the Opening Screen.
3.5.10 Menu Bar Function / Cancel
Cancel may be selected any time prior to selecting Initialize. A query to Erase the Multiple Graph Display may follow if graphs have been added. After these prompts and queries have been resolved, the Initialization screen will be replaced with the Opening Screen.
24
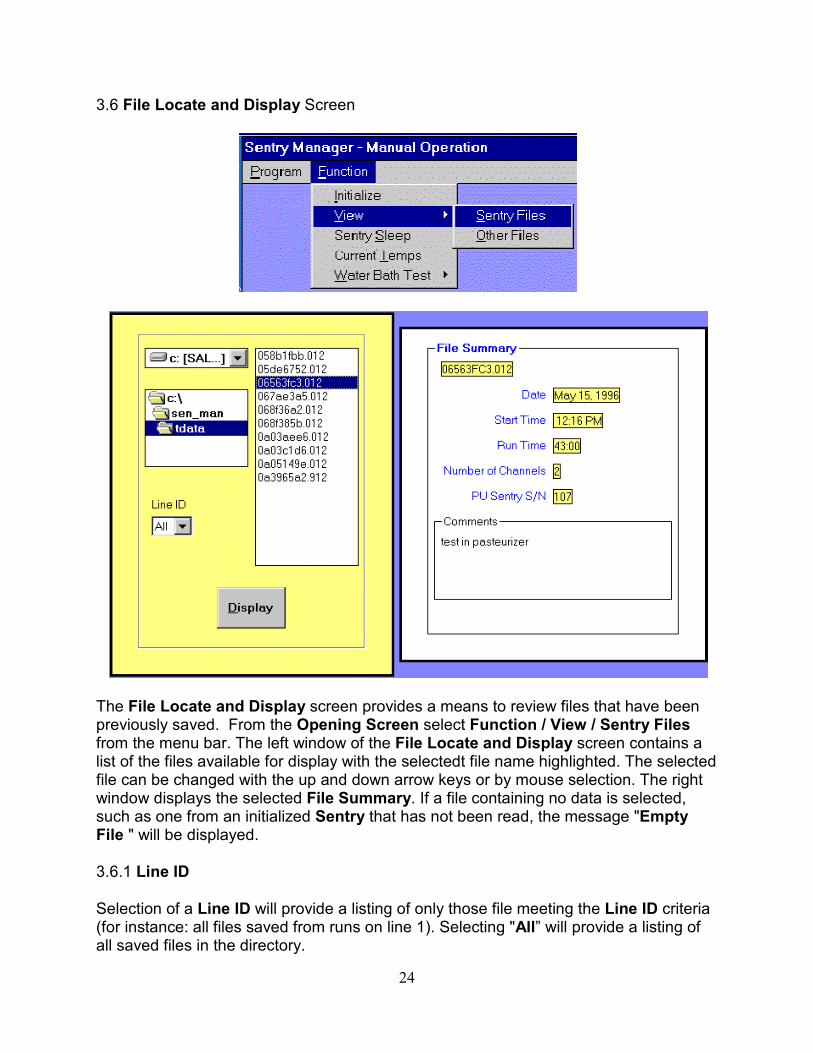
3.6 File Locate and Display Screen
The File Locate and Display screen provides a means to review files that have been previously saved. From the Opening Screen select Function / View / Sentry Files from the menu bar. The left window of the File Locate and Display screen contains a list of the files available for display with the selectedt file name highlighted. The selected file can be changed with the up and down arrow keys or by mouse selection. The right window displays the selected File Summary. If a file containing no data is selected, such as one from an initialized Sentry that has not been read, the message "Empty File " will be displayed.
3.6.1 Line ID
Selection of a Line ID will provide a listing of only those file meeting the Line ID criteria (for instance: all files saved from runs on line 1). Selecting "All” will provide a listing of all saved files in the directory.
25
3.6.2 Display Command Button
Selecting the Display command button results in a full display of the contents of the highlighted file on the Results screen (See section 3.2).
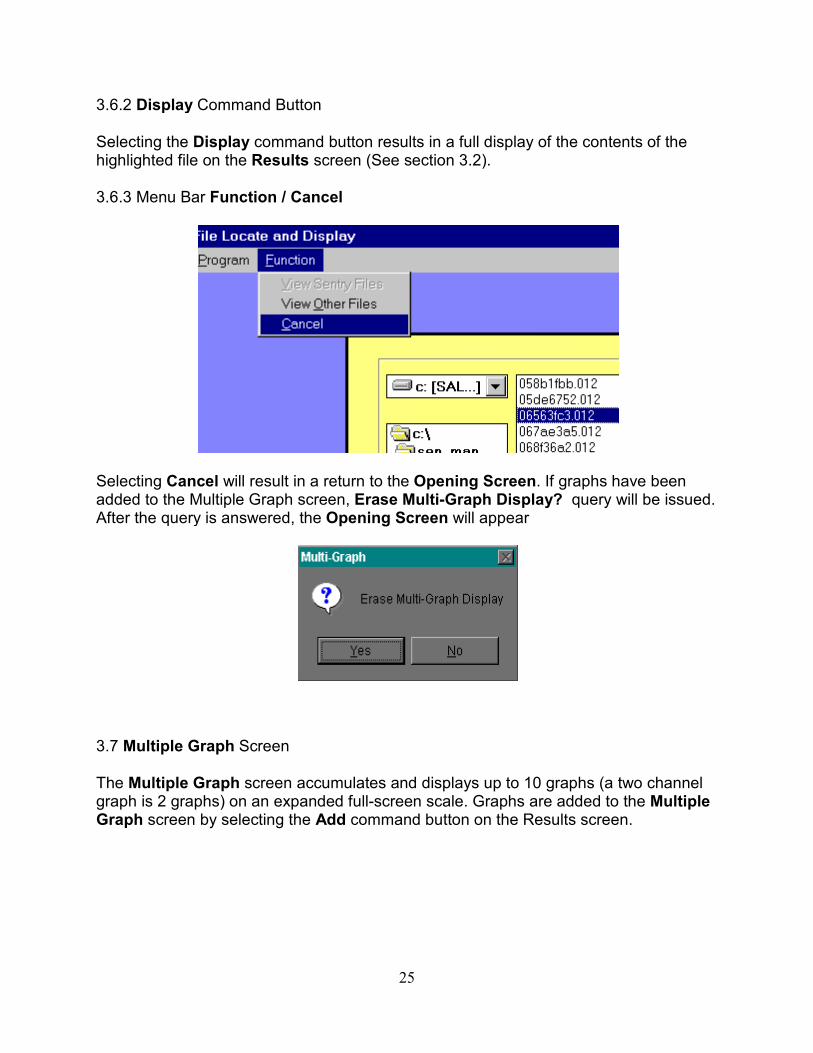
3.6.3 Menu Bar Function / Cancel
Selecting Cancel will result in a return to the Opening Screen. If graphs have been added to the Multiple Graph screen, Erase Multi-Graph Display? query will be issued. After the query is answered, the Opening Screen will appear
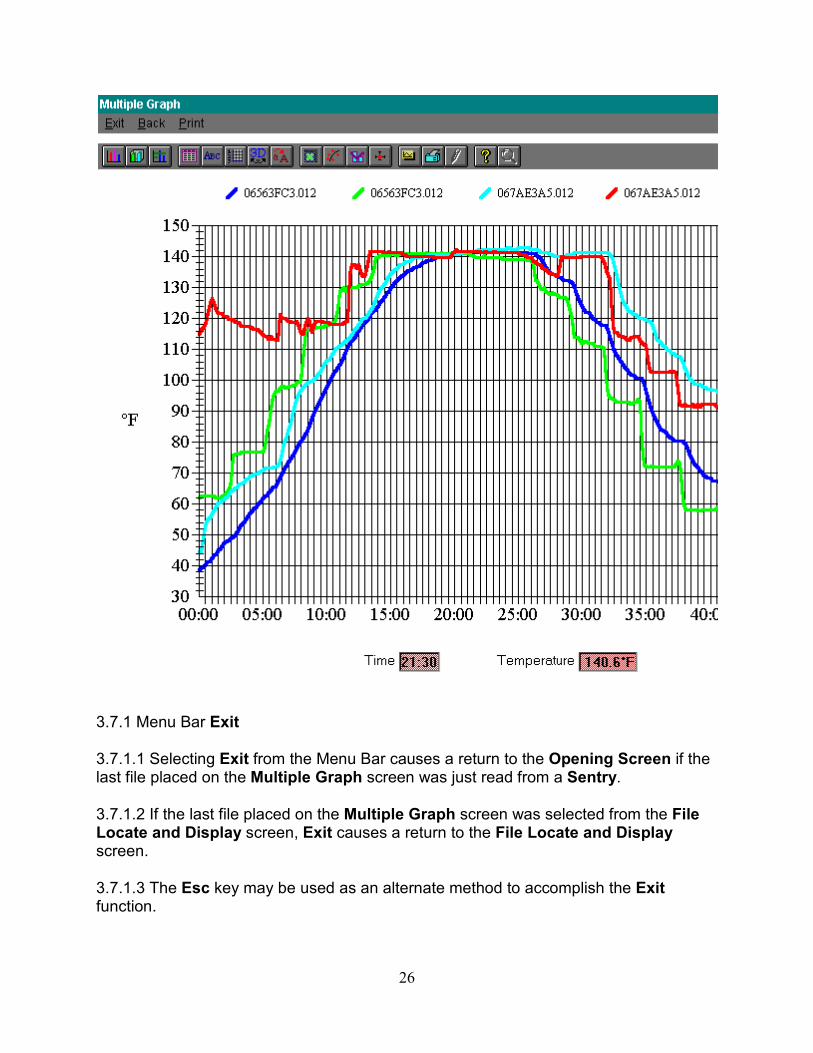
3.7 Multiple Graph Screen
The Multiple Graph screen accumulates and displays up to 10 graphs (a two channel graph is 2 graphs) on an expanded full-screen scale. Graphs are added to the Multiple Graph screen by selecting the Add command button on the Results screen.
26
3.7.1 Menu Bar Exit
3.7.1.1 Selecting Exit from the Menu Bar causes a return to the Opening Screen if the last file placed on the Multiple Graph screen was just read from a Sentry.
3.7.1.2 If the last file placed on the Multiple Graph screen was selected from the File Locate and Display screen, Exit causes a return to the File Locate and Display screen.
3.7.1.3 The Esc key may be used as an alternate method to accomplish the Exit function.
27
3.7.2 Menu Bar Back
3.7.2.1 Selecting Back returns to the Results screen for a review of the file last added to the Multiple Graph screen.
3.7.2.2 Selecting Add on the Results screen returns to the Multiple Graph screen.
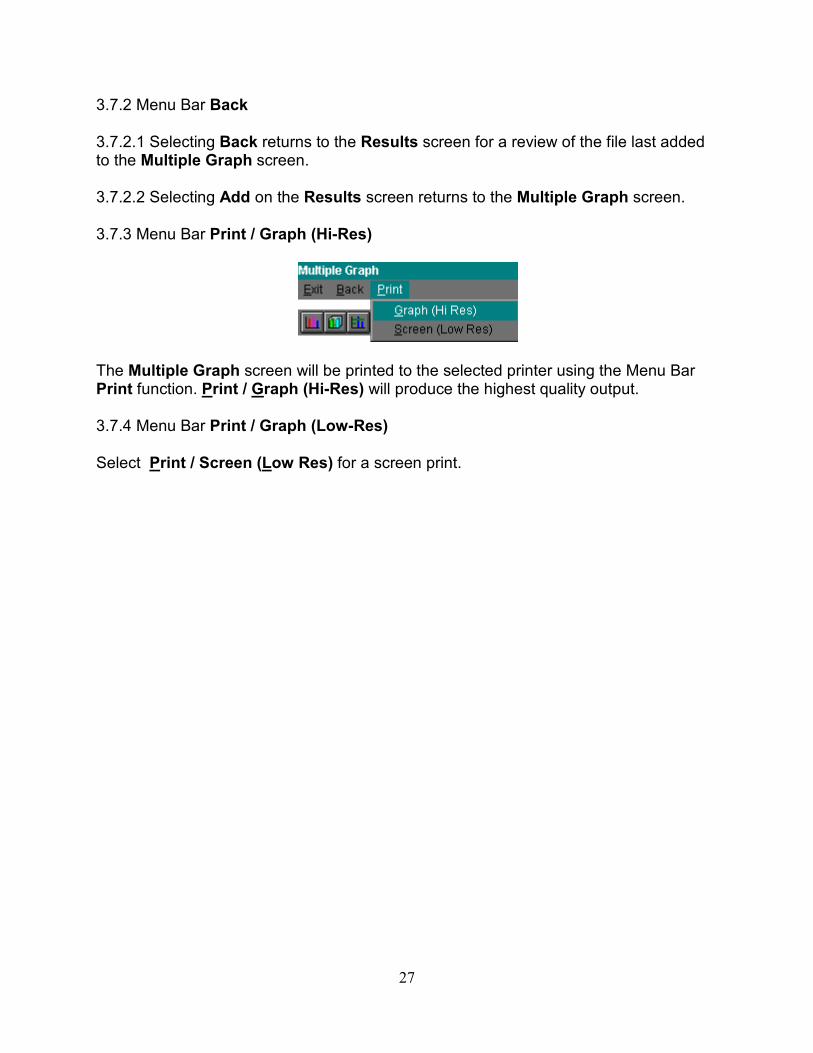
3.7.3 Menu Bar Print / Graph (Hi-Res)
The Multiple Graph screen will be printed to the selected printer using the Menu Bar Print function. Print / Graph (Hi-Res) will produce the highest quality output.
3.7.4 Menu Bar Print / Graph (Low-Res)
Select Print / Screen (Low Res) for a screen print.
28
Section 4.0
When configured for Automatic Operation, (see Section 1.3) minimal functions will be performed by the operator.. The Opening Screen contains instructions for starting operation and the Menu Bar provides access to additional Program functions.
4.1 Automatic Operation Opening Screen
4.1.1 Reading a Sentry
WARNING: Do not remove the Sentry from the Interface until these operations are complete. Doing so may result in loss of data.
When a Sentry is placed on the Interface the following functions are performed:
4.1.1.1 The Sentry contents are read and converted.
4.1.1.2 If the Sentry has not been previously read, test results, if any, are displayed on the Results screen. (see Section 4.2)
29
4.1.1.3 If the Sentry has been previously read and a file exists, a Reuse Now? query will be displayed. If “Yes” is selected, the Sentry will be re-initialized and the operator will be instructed to remove the Sentry. If “No” is selected, the Sentry will enter Sleep Mode and the message “Remove Sentry” will be displayed.
4.1.1.4 If the Sentry was previously initialized differently from the Automatic Mode parameters, the message Invalid Sentry will be displayed and no further operations will occur. This problem will be resolved by Initialization in Manual Mode.
4.1.1.5 If the Database function was enabled during Configuration, the database will be displayed for Initialization value selection prior to re-initialization.
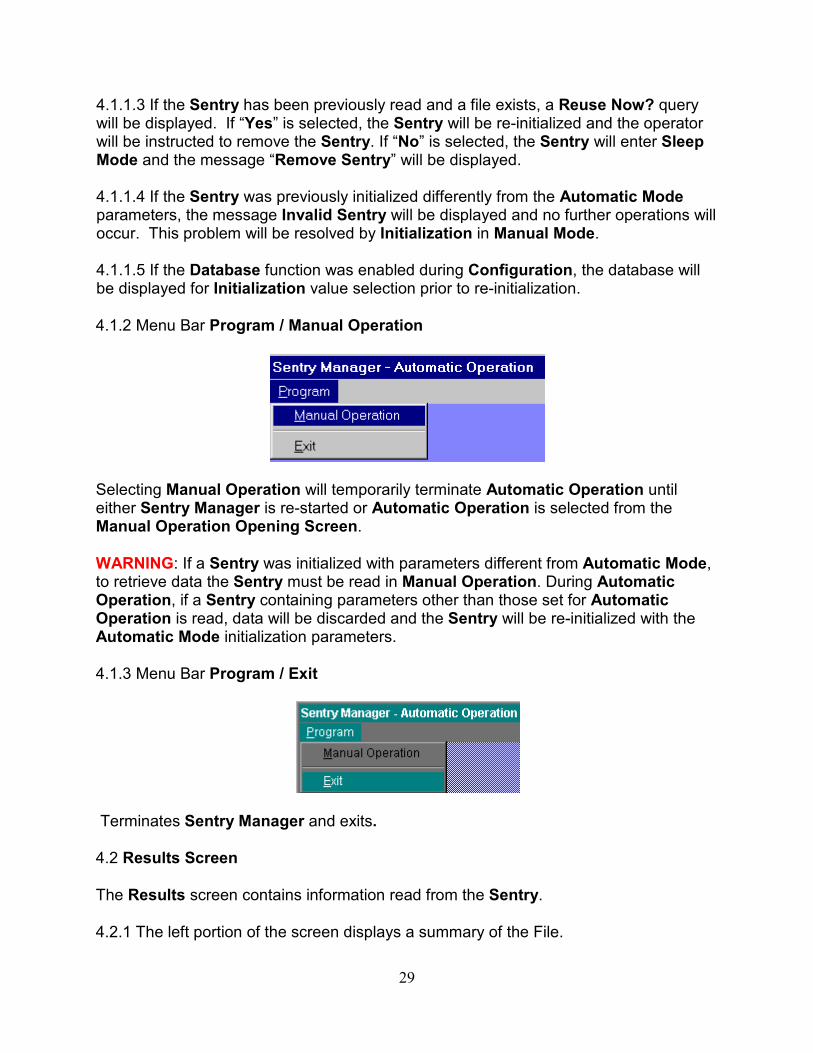
4.1.2 Menu Bar Program / Manual Operation
Selecting Manual Operation will temporarily terminate Automatic Operation until either Sentry Manager is re-started or Automatic Operation is selected from the Manual Operation Opening Screen.
WARNING: If a Sentry was initialized with parameters different from Automatic Mode, to retrieve data the Sentry must be read in Manual Operation. During Automatic Operation, if a Sentry containing parameters other than those set for Automatic Operation is read, data will be discarded and the Sentry will be re-initialized with the Automatic Mode initialization parameters.
4.1.3 Menu Bar Program / Exit
Terminates Sentry Manager and exits.
4.2 Results Screen
The Results screen contains information read from the Sentry.
4.2.1 The left portion of the screen displays a summary of the File.
30
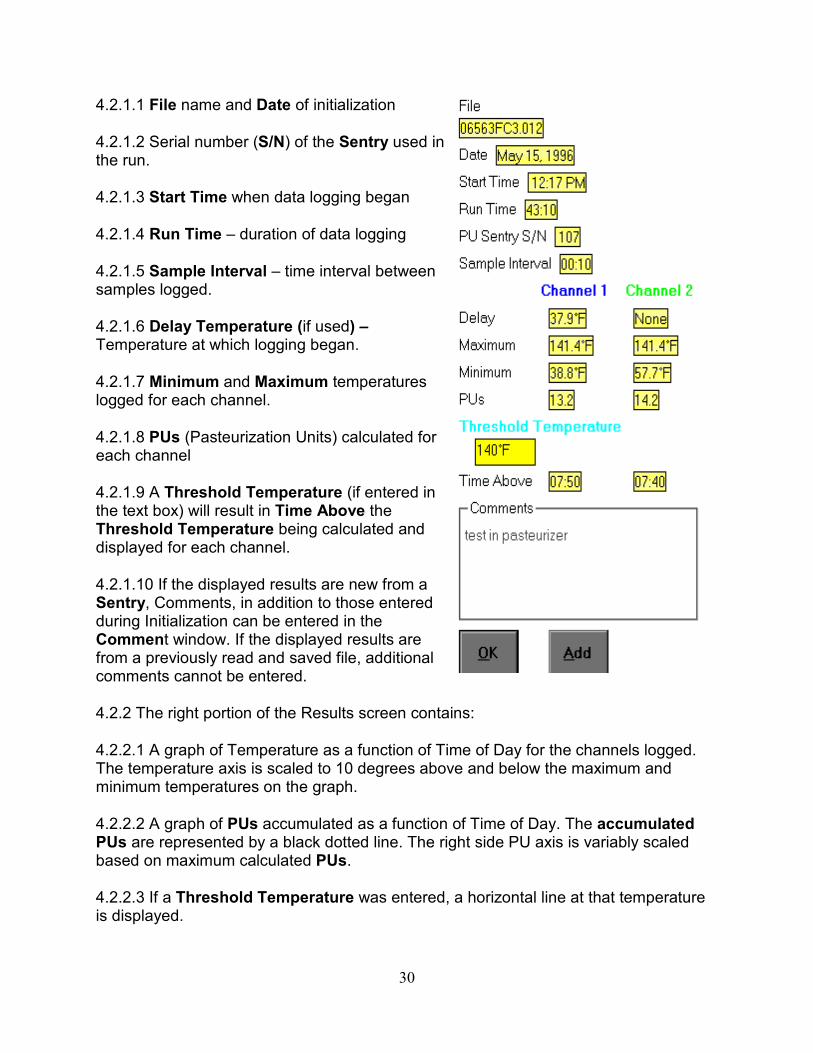
4.2.1.1 File name and Date of initialization
4.2.1.2 Serial number (S/N) of the Sentry used in the run.
4.2.1.3 Start Time when data logging began
4.2.1.4 Run Time – duration of data logging
4.2.1.5 Sample Interval – time interval between samples logged.
4.2.1.6 Delay Temperature (if used) – Temperature at which logging began.
4.2.1.7 Minimum and Maximum temperatures logged for each channel.
4.2.1.8 PUs (Pasteurization Units) calculated for each channel
4.2.1.9 A Threshold Temperature (if entered in the text box) will result in Time Above the Threshold Temperature being calculated and displayed for each channel.
4.2.1.10 If the displayed results are new from a Sentry, Comments, in addition to those entered during Initialization can be entered in the Comment window. If the displayed results are from a previously read and saved file, additional comments cannot be entered.
4.2.2 The right portion of the Results screen contains:
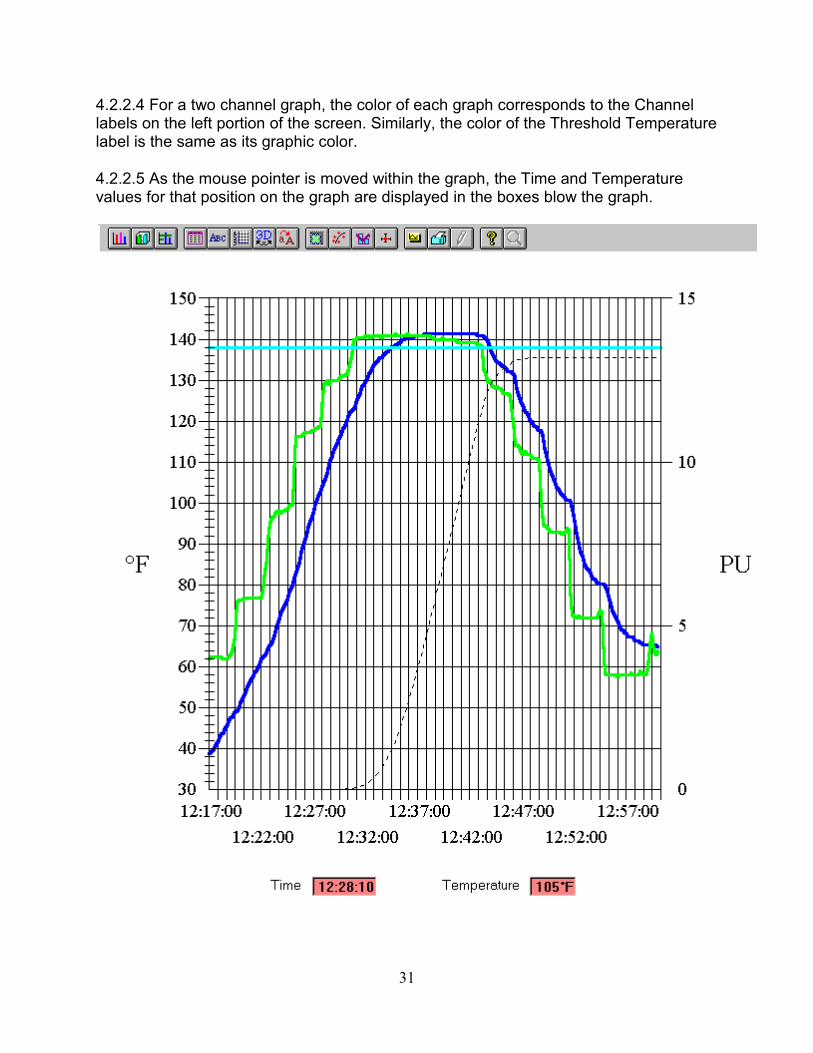
4.2.2.1 A graph of Temperature as a function of Time of Day for the channels logged. The temperature axis is scaled to 10 degrees above and below the maximum and minimum temperatures on the graph.
4.2.2.2 A graph of PUs accumulated as a function of Time of Day. The accumulated PUs are represented by a black dotted line. The right side PU axis is variably scaled based on maximum calculated PUs.
4.2.2.3 If a Threshold Temperature was entered, a horizontal line at that temperature is displayed.
31
4.2.2.4 For a two channel graph, the color of each graph corresponds to the Channel labels on the left portion of the screen. Similarly, the color of the Threshold Temperature label is the same as its graphic color.
4.2.2.5 As the mouse pointer is moved within the graph, the Time and Temperature values for that position on the graph are displayed in the boxes blow the graph.
32
NOTE: The icons located on the menu bar on top of the results graph are for additional manipulation of the logged data. Additional features allow the user to "zoom" in on certain graph areas by changing axis range and by adjusting the number of data points used in the graph. These graphing features are for advanced use and are not within the scope of this manual.
4.2.3 Comments
Comments relevant to the test can be entered in the Comment window. Each of the four lines of the Comment window can contain up to 80 characters. If a comment is longer than the available window, it will scroll as entered. Printed outputs will contain the complete comment.
4.2.4 Printing Results (no Automatic Print).
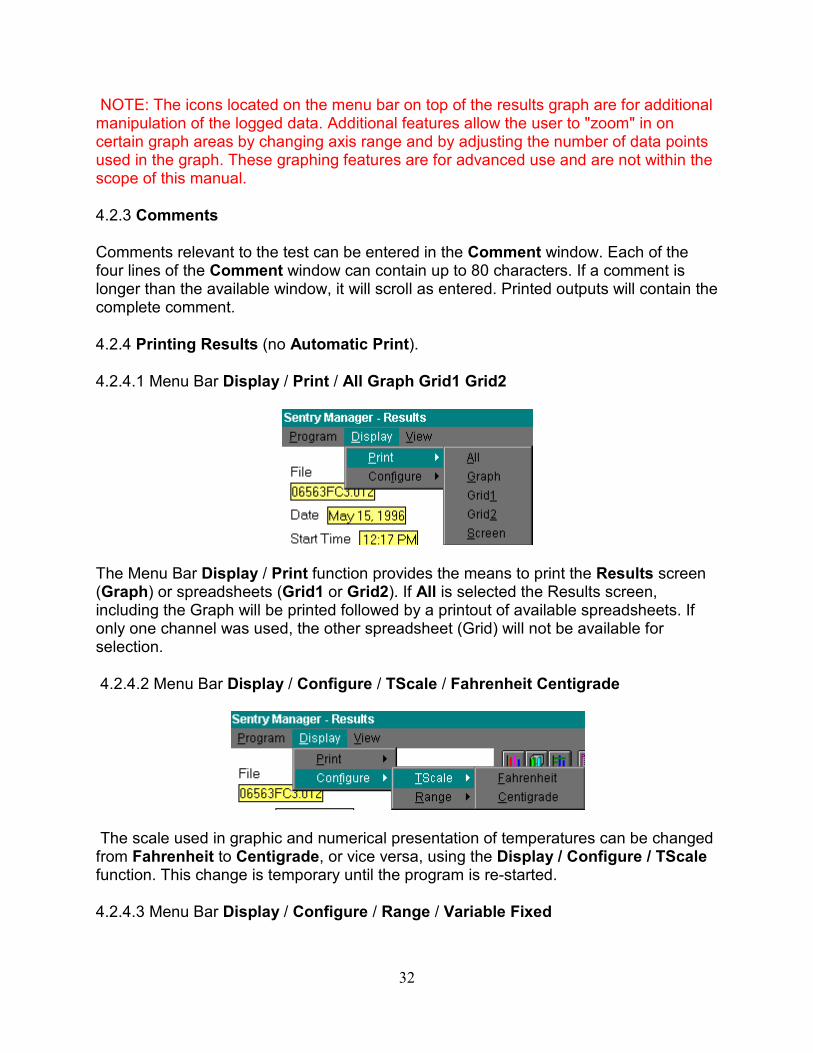
4.2.4.1 Menu Bar Display / Print / All Graph Grid1 Grid2
The Menu Bar Display / Print function provides the means to print the Results screen (Graph) or spreadsheets (Grid1 or Grid2). If All is selected the Results screen, including the Graph will be printed followed by a printout of available spreadsheets. If only one channel was used, the other spreadsheet (Grid) will not be available for selection.
4.2.4.2 Menu Bar Display / Configure / TScale / Fahrenheit Centigrade
The scale used in graphic and numerical presentation of temperatures can be changed from Fahrenheit to Centigrade, or vice versa, using the Display / Configure / TScale function. This change is temporary until the program is re-started.
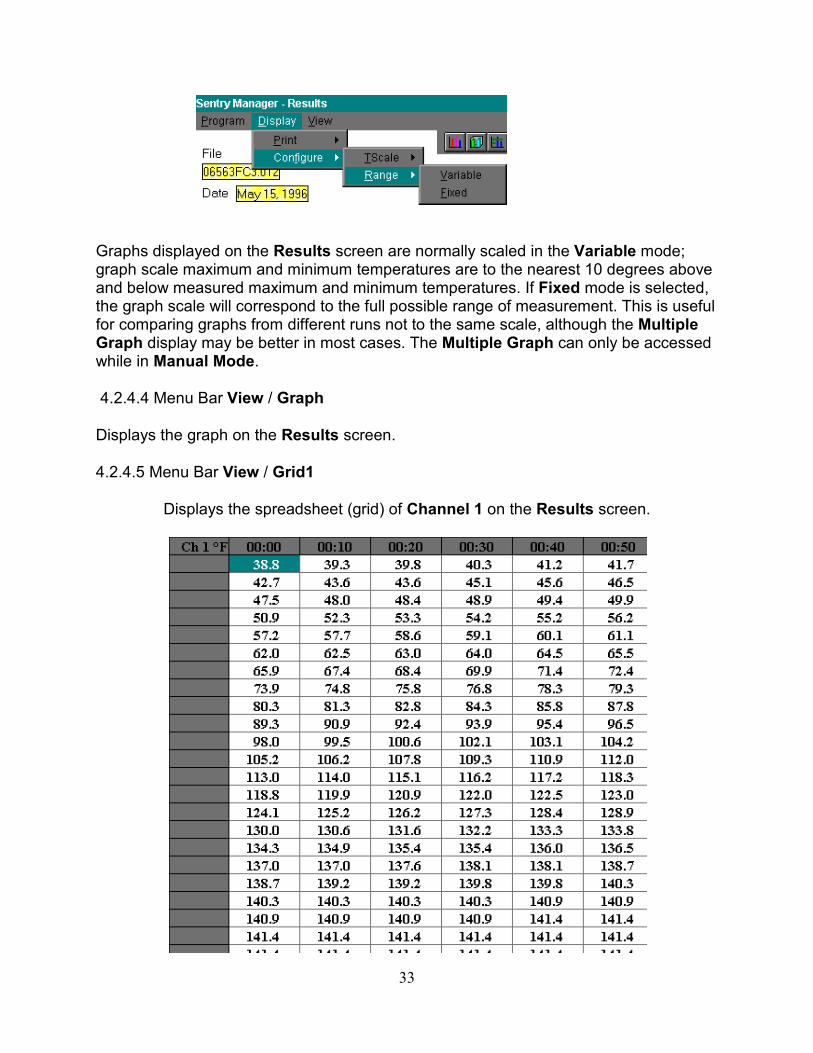
4.2.4.3 Menu Bar Display / Configure / Range / Variable Fixed
33
Graphs displayed on the Results screen are normally scaled in the Variable mode; graph scale maximum and minimum temperatures are to the nearest 10 degrees above and below measured maximum and minimum temperatures. If Fixed mode is selected, the graph scale will correspond to the full possible range of measurement. This is useful for comparing graphs from different runs not to the same scale, although the Multiple Graph display may be better in most cases. The Multiple Graph can only be accessed while in Manual Mode.
4.2.4.4 Menu Bar View / Graph
Displays the graph on the Results screen.
4.2.4.5 Menu Bar View / Grid1
Displays the spreadsheet (grid) of Channel 1 on the Results screen.
34
4.2.4.6 Menu Bar View / Grid2
Displays the spreadsheet (grid) of Channel 2 on the Results screen, if available.
4.2.5 OK Command Button
4.2.5.1 When OK is selected, test results will be saved in the appropriately named file.
4.2.5.2 If Automatic Print was selected during configuration, the Results screen will be printed.
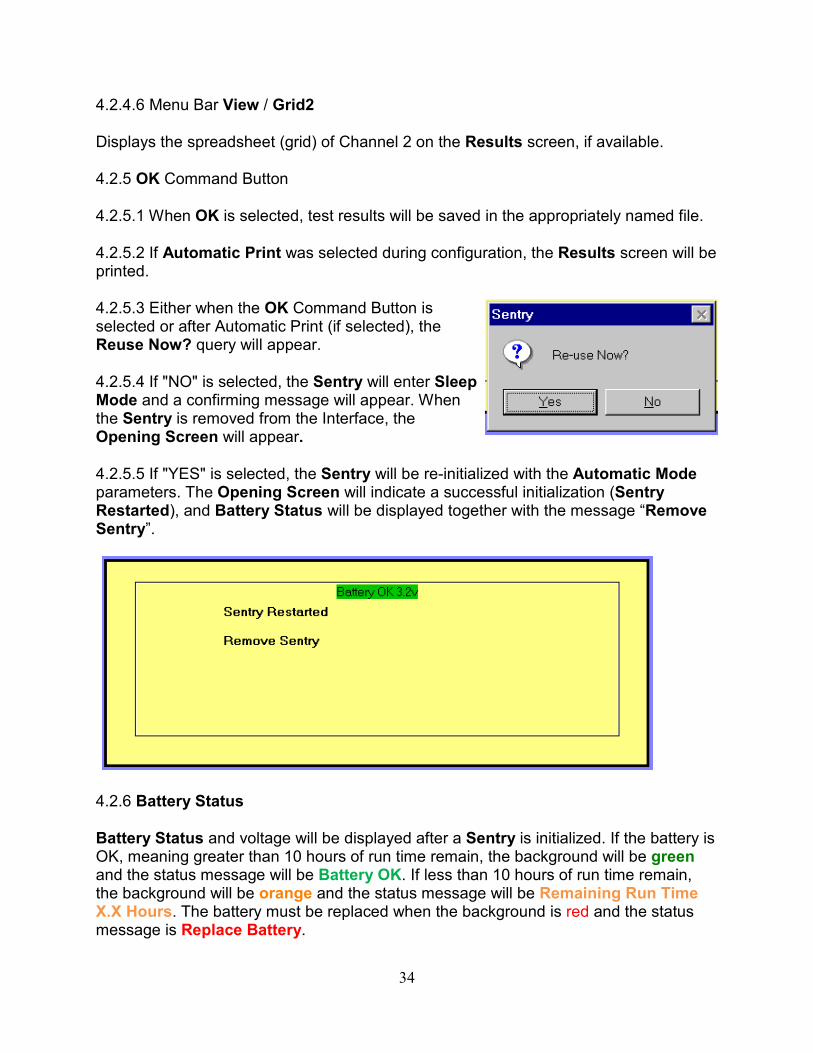
4.2.5.3 Either when the OK Command Button is selected or after Automatic Print (if selected), the Reuse Now? query will appear.
4.2.5.4 If "NO" is selected, the Sentry will enter Sleep Mode and a confirming message will appear. When the Sentry is removed from the Interface, the Opening Screen will appear.
4.2.5.5 If "YES" is selected, the Sentry will be re-initialized with the Automatic Mode parameters. The Opening Screen will indicate a successful initialization (Sentry Restarted), and Battery Status will be displayed together with the message “Remove Sentry”.
4.2.6 Battery Status
Battery Status and voltage will be displayed after a Sentry is initialized. If the battery is OK, meaning greater than 10 hours of run time remain, the background will be green and the status message will be Battery OK. If less than 10 hours of run time remain, the background will be orange and the status message will be Remaining Run Time X.X Hours. The battery must be replaced when the background is red and the status message is Replace Battery.
35
Section 5.0
5.1 Equipment Required:
5.1.1 Circulating water bath including a temperature controller and cover (Model # WB8205).
5.1.2 Extant Technology Temperature Reference (Model # TR1401).
Note: The table file for the Temperature Reference must be installed before Water Bath testing. (Section 1.5)
5.1.3 PC Interface (Model # SIU1302)
5.1.4 Sentry Manager Software.
5.2 Test Procedure
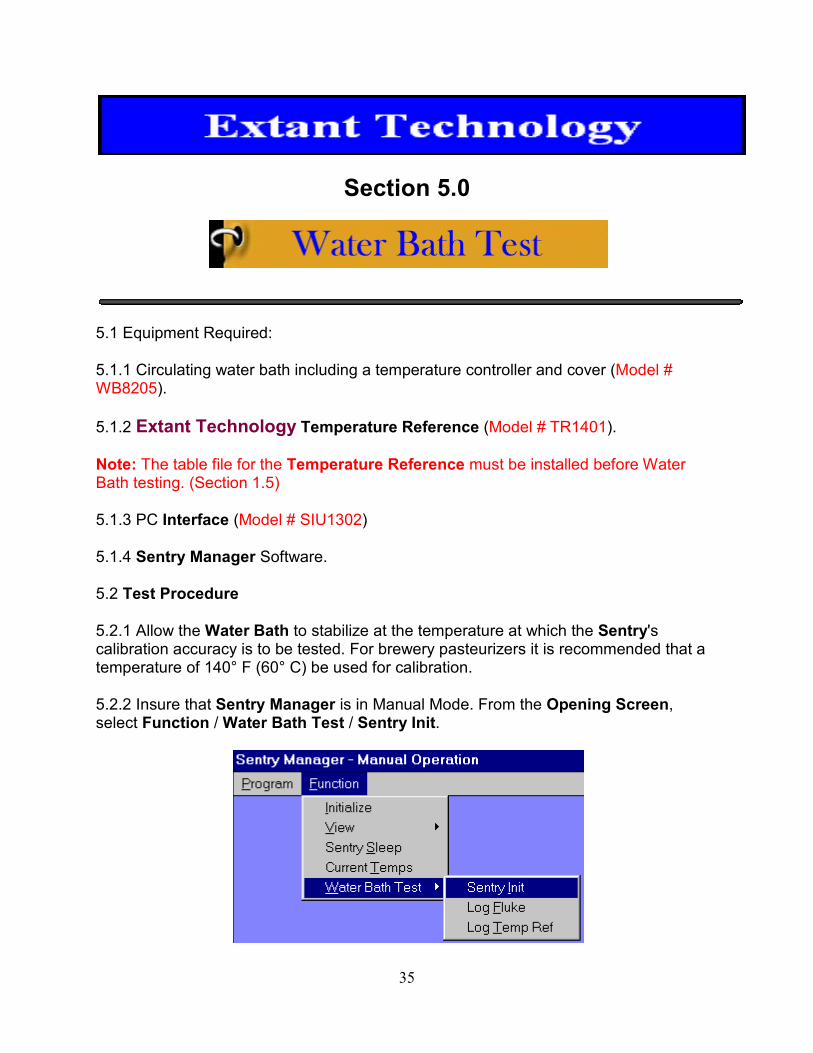
5.2.1 Allow the Water Bath to stabilize at the temperature at which the Sentry's calibration accuracy is to be tested. For brewery pasteurizers it is recommended that a temperature of 140° F (60° C) be used for calibration.
5.2.2 Insure that Sentry Manager is in Manual Mode. From the Opening Screen, select Function / Water Bath Test / Sentry Init.
36
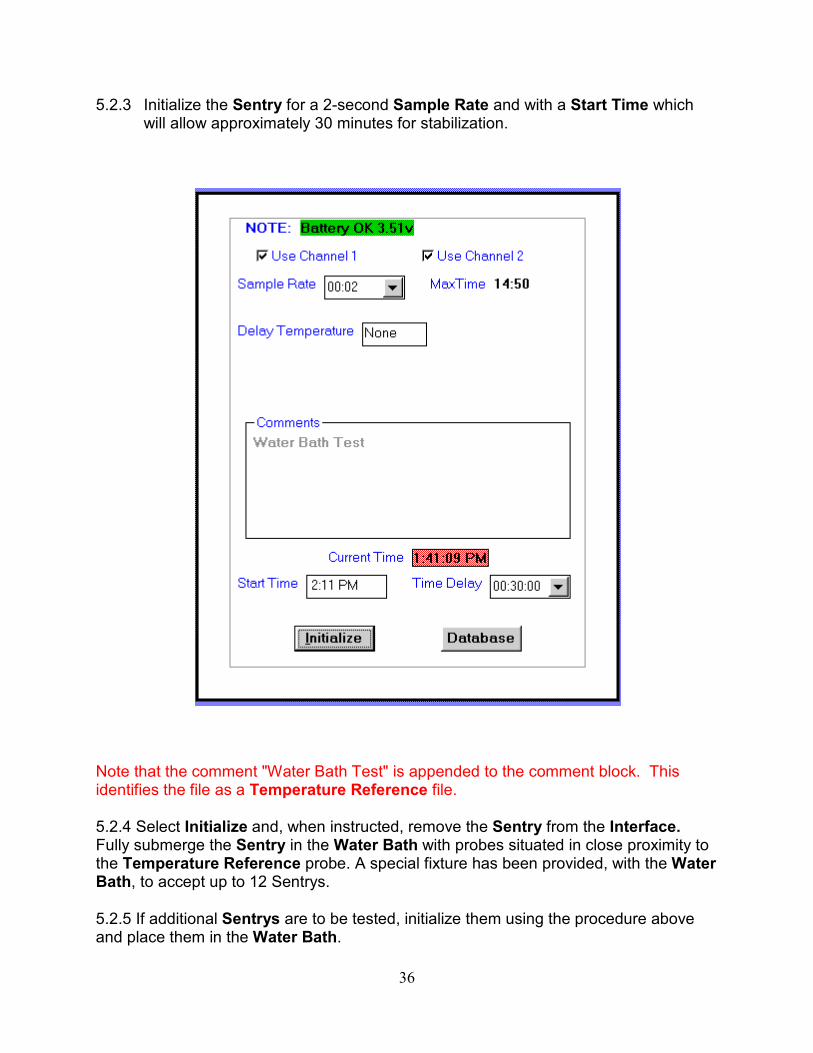
5.2.3 Initialize the Sentry for a 2-second Sample Rate and with a Start Time which will allow approximately 30 minutes for stabilization.
Note that the comment "Water Bath Test" is appended to the comment block. This identifies the file as a Temperature Reference file.
5.2.4 Select Initialize and, when instructed, remove the Sentry from the Interface. Fully submerge the Sentry in the Water Bath with probes situated in close proximity to the Temperature Reference probe. A special fixture has been provided, with the Water Bath, to accept up to 12 Sentrys.
5.2.5 If additional Sentrys are to be tested, initialize them using the procedure above and place them in the Water Bath.
37
5.2.6 After all Sentrys that are to be tested have been initialized and placed in the Water Bath, connect the Temperature Reference to the mating connector on the Interface.
5.2.7 Install the Temperature Reference probe into the Water Bath in close proximity to the Sentry probes previously placed in the bath.
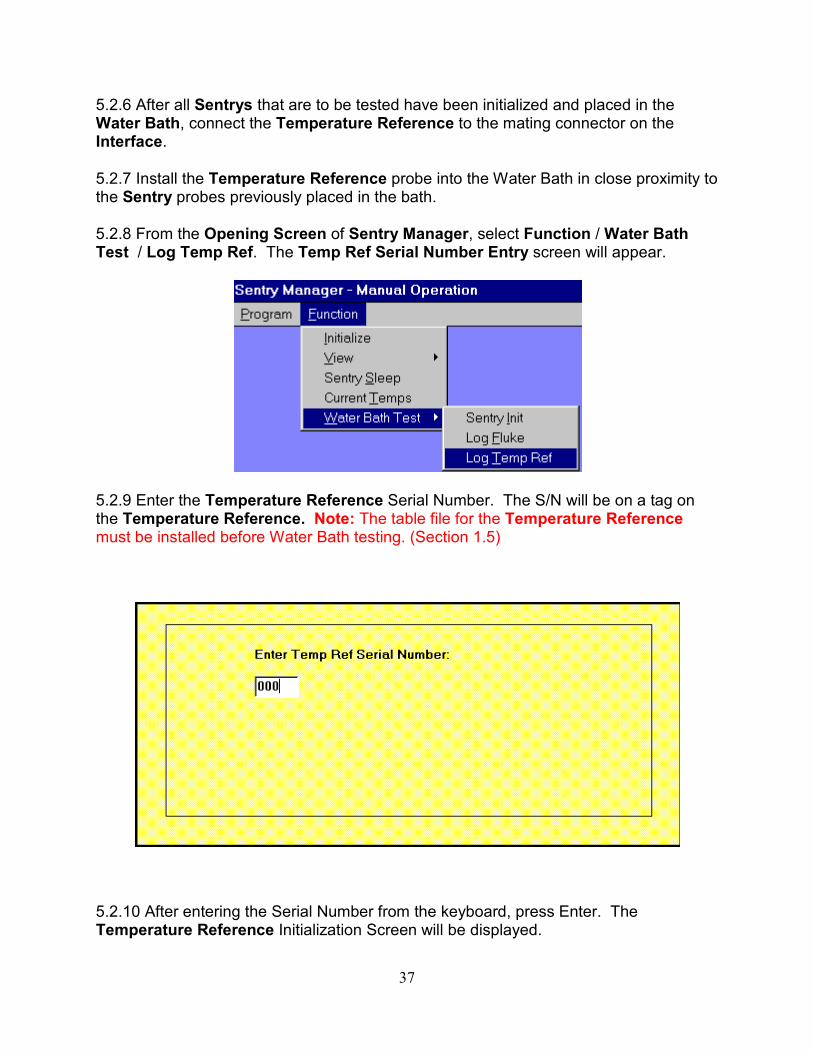
5.2.8 From the Opening Screen of Sentry Manager, select Function / Water Bath Test / Log Temp Ref. The Temp Ref Serial Number Entry screen will appear.
5.2.9 Enter the Temperature Reference Serial Number. The S/N will be on a tag on the Temperature Reference. Note: The table file for the Temperature Reference must be installed before Water Bath testing. (Section 1.5)
5.2.10 After entering the Serial Number from the keyboard, press Enter. The Temperature Reference Initialization Screen will be displayed.
38
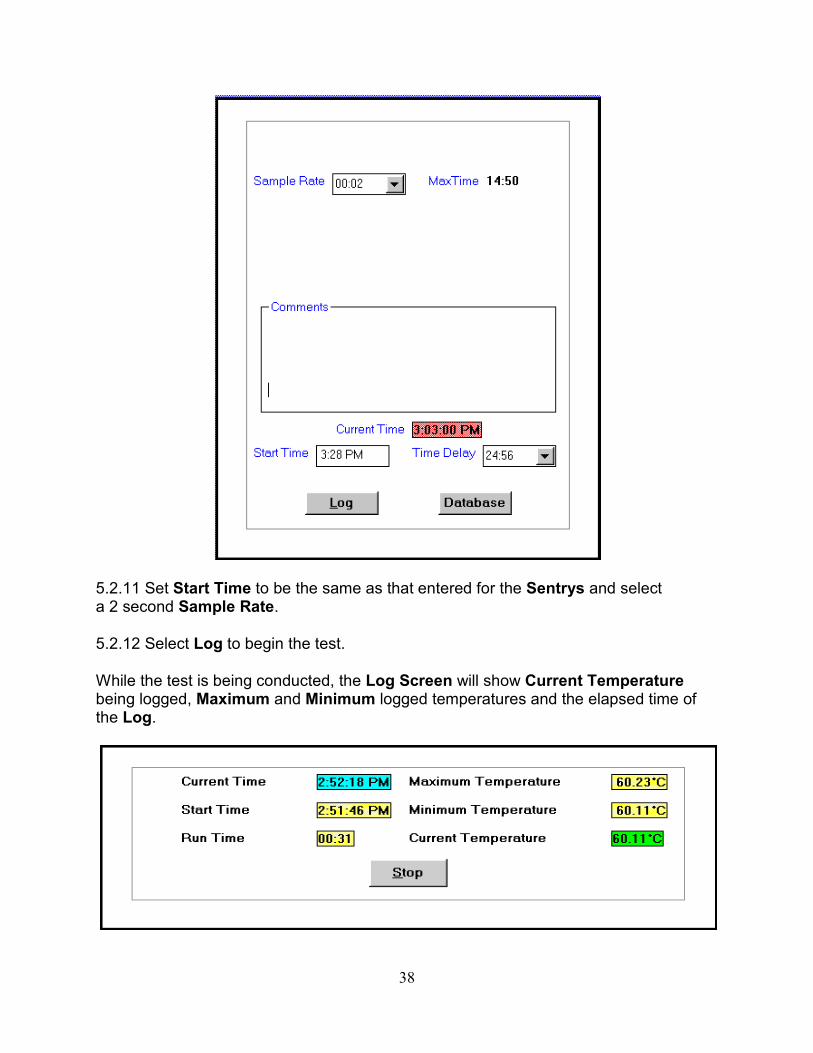
5.2.11 Set Start Time to be the same as that entered for the Sentrys and select a 2 second Sample Rate.
5.2.12 Select Log to begin the test.
While the test is being conducted, the Log Screen will show Current Temperature being logged, Maximum and Minimum logged temperatures and the elapsed time of the Log.
39
5.2.13 A graph of Temperature Reference data will be displayed when the test is complete. Save the graph for future use.
5.2.14 Disconnect the Temperature Reference from the Interface. The Opening Screen will be displayed.
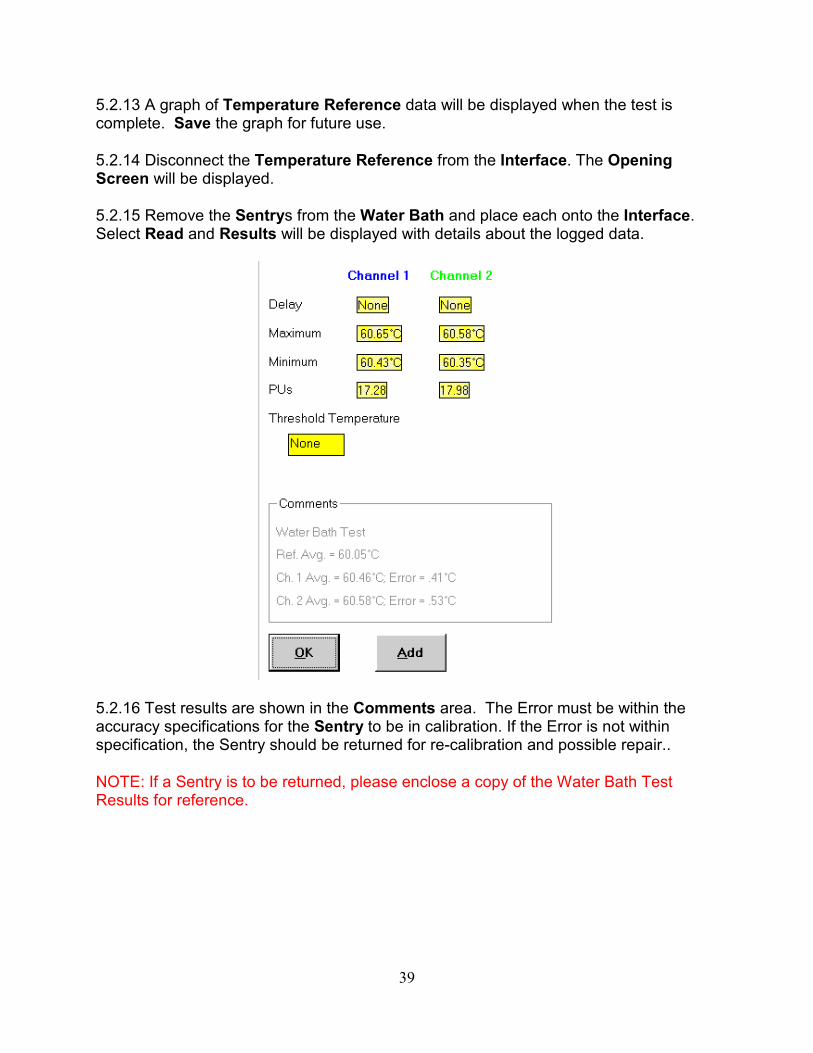
5.2.15 Remove the Sentrys from the Water Bath and place each onto the Interface. Select Read and Results will be displayed with details about the logged data.
5.2.16 Test results are shown in the Comments area. The Error must be within the accuracy specifications for the Sentry to be in calibration. If the Error is not within specification, the Sentry should be returned for re-calibration and possible repair..
NOTE: If a Sentry is to be returned, please enclose a copy of the Water Bath Test Results for reference.
40
Section 6.0
Warranty, Service and Technical Support
6.1 Factory Warranty
Extant Technology (Extant) products are covered by a Limited Factory Warranty covering defects in material and workmanship for a period of 1 (one) year from date of purchase. Additionally, accuracy and calibration are covered for a period of 1 (one) year from date of purchase. Normal battery depletion or damage caused by misuse, abuse, or accident is not covered.
6.2 Service and Maintenance
6.2.1 If service, maintenance or repair is needed, contact Extant by email at [email protected] or by phone at (210) 666-8316.
6.2.2 If Extant is unable to remedy the problem by return email or phone, an RMA will be issued.
6.2.3 Return the defective unit to:
Extant Technology, Inc. 12027 Colwick St San Antonio, TX 78216 Attn: Service Department RMA #
Include a detailed description of the problem.
6.2.4 Extant will diagnose the problem. If covered by warranty, repairs will be performed and the unit returned to you at no charge.
6.2.5 .If repairs are non-warranty, An estimate to repair will be generated and a Purchase Order will be requested.
6.2.6 After a Purchase Order is obtained, repairs will be performed.
NOTE: If repairs are not covered under warranty, shipping will be at customer’s expense.
41
6.3 Contacts
Extant Technology, Inc.
12027 Colwick St
San Antonio, TX 78216
210 666-8316
Fax: 210 666-9216
[email protected] www.extanttech.com