Article Volatile Organic Compound Composition of Urban Air ...

SENSORY EVALUATION AND VOLATILE COMPOUND ANALYSIS OF STRAWBERRY
FRUIT WITH AND WITHOUT MODIFIED ATMOSPHERE PACKAGING (MAP)
By
MAWELE SHAMAILA
B.Agric.Sci., The University of Zambia, 1981
M.Sc, (Plant Sci.) The University of Manitoba, 1985
A THESIS SUBMITTED IN PARTIAL FULFILLMENT OF
THE REQUIREMENTS FOR THE DEGREE OF
DOCTOR OF PHILOSOPHY
m
THE FACULTY OF GRADUATE STUDIES
Department of Food Science
We accept this thesis as conforming
to the required standard
THE UNIVERSITY OF BRITISH COLUMBIA
March 1992
© Mawele Shamaila, 19 92

In presenting this thesis in partial fulfilment of the requirements for an advanced
degree at the University of British Columbia, I agree that the Library shall make it
freely available for reference and study. I further agree that permission for extensive
copying of this thesis for scholarly purposes may be granted by the head of my
department or by his or her representatives. It is understood that copying or
publication of this thesis for financial gain shall not be allowed without my written
permission.
Department of fooj> Science The University of British Columbia Vancouver, Canada
Date r/JMcH it im
DE-6 (2/88)

ABSTRACT
In the last few years, packaging of horticultural commodities in
polymeric film pouches as means of extending their shelf life has
expanded at the retail level. The modified atmospheres in
commodity-containing pouches which consist of elevated levels of
C02 and reduced levels of 02 may influence the quality attributes
of the edible tissues. In this study, strawberries were stored at
1°C for 10 days under modified atmosphere package (MAP) conditions
in high barrier film pouches flushed with either carbon dioxide
(100% C02) , mixed gas (11% C02 + 11% 02 + N2 as balance) or air to
assess relationships between sensory attributes, chemical
parameters and gas chromatographic data by applying multivariate
statistical techniques.
The first two principal components which accounted for 92% of
variance indicated that the changes in sensory quality of
strawberries evaluated by quantitative descriptive analysis (QDA)
were mainly a contrast of desirable (strawberry odor, texture and
sweetness) against undesirable attributes (off-odor, fermented
odor, musty odor and bitterness). Strawberries stored for only a
few days were associated with desirable attributes. Deteriorated
samples due to treatment and/or storage time as a result of changes
in C02 and 02 were associated more with undesirable attributes.
There were statistical differences in nearly all attributes studied
between different treatments over storage time. Packaged
strawberries treated with air retained their desirable attributes
for longer storage time than those treated with mixed gas or carbon
n

dioxide, while unpackaged fruit developed fungal growth after 6
days of storage at 1°C.
As the storage time increased, the ethanol concentration
increased in strawberries packaged in the different gases, with
mixed gas treated samples showing the highest amounts. Significant
correlations were obtained between desirable and undesirable
attributes, and with soluble solids and ethanol content.
Most of the fifty volatile compounds extracted by a dynamic
headspace purge-and-trap (DHPT) technique and adsorbed onto Tenax
GC were identified by gas chromatography/mass spectrometry (GC/MS)
as esters. Total relative amounts of volatile compounds and total
amounts of butanoates from strawberries stored under different MAP
conditions were much lower than for unpackaged strawberries.
Significant correlations were found between odor attribute values
and volatile compounds such as methyl butanoate, 1-methylethyl
hexanoate, 3,7 dimethyl-1,6-octadien-3-ol and ethyl heptanoate.
Multiple regression of 25 selected volatile compounds with the odor
attribute values accounted for up to 70% of the variation, while
stepwise regression selected between 6 and 9 variables with up to
67% of variance being explained.
The data for 25 selected volatile compounds for untreated and
gas-treated strawberries were subjected to canonical variate
analysis (CVA). Samples held in air, mixed gas and the unpackaged
fruit and strawberries evaluated at day 0 were all initially
separated from strawberries held in carbon dioxide. After 10 days
in storage, all MAP strawberries were classified in close
iii

proximity, with the indication that quality attribute scores were
low. This was attributed to elevated C02 and reduced 02 levels in
packages containing the strawberries. Assessment of volatile
compound data by CVA could be valuable in monitoring quality of
strawberries and supplementing sensory evaluation of the fruit
stored under various conditions.
In a separate experiment, 6 strawberry cultivars, 'Mrak',
'Ranier', 'Redcrest', 'Selva', 'Sumas' and 'Totem' were compared
for sensory and chemical properties, and selected volatile
compounds. 'Redcrest' had the most intense sourness, lowest pH,
high titratable acidity and lowest overall fruit quality. Two-
dimensional partitioning (TDP) showed that the overall quality of
the strawberries was primarily dependent on odor and sweetness
level. Cultivars differed in all orthogonal variates except odor.
While judges could not detect odor differences, the total relative
amounts of volatile compounds were greatest for 'Mrak' and 'Selva'.
Canonical variate analysis (CVA) based on volatile compounds
classified the cultivars according to the region in which they were
bred.
IV

TABLE OF CONTENTS
ABSTRACT II
TABLE OF CONTENTS V
LIST OF TABLES VIII
LIST OF FIGURES XI
ACKNOWLEDGEMENT XV
INTRODUCTION 1
A. SENSORY AND VOLATILE COMPOUND ANALYSIS OF STRAWBERRIES
STORED UNDER MODIFIED ATMOSPHERE PACKAGING 4
LITERATURE REVIEW 4
Methods used to store strawberries 5 Modified atmosphere packaging (MAP) 6
Packaging of strawberries in polymeric films 6 Beneficial effects of modified atmosphere packaging (MAP). 7 Reduction in softening 8 Delayed microbial growth (fungal spoilage) 10 Reduced respiration rate 12 Reduced enzyme activity 13 Physiological effects of MAP on horticultural commodities. 13 Negative effects of elevated C02 and reduced 02 16
Strawberry flavor volatiles 17 Biosynthesis of flavor/aroma volatiles in strawberries.... 18 Volatiles of fruit kept under CA/MA conditions 21 Methods of volatile extraction and analysis 24 Liquid-liquid and steam distillation procedures 26 Headspace analysis of volatiles 28
Relationship between sensory and volatile compound data... 30 Multivariate analysis of sensory and flavor/aroma data.... 32
MATERIALS AND METHODS 34
Strawberry samples and preparation 3 4 Strawberry samples 34 Modified atmosphere packaging of strawberry samples 34 Gas treatment and storage of strawberry samples 35 Sampling procedure and analyses of MAP strawberry samples. 35
Sensory evaluation 35 Training of judges 3 6 Sample preparation for sensory evaluation 38
v

Chemical analyses 40
Extraction and analysis of volatiles from strawberries 42 Solvent extraction of volatile compounds 42 Distillation extraction of volatile compounds 42 Headspace volatile extraction procedures 43 Headspace volatile extraction with solvent desorption from Tenax GC 43 GC analysis of volatile compounds desorbed by solvent .. 46
Headspace volatile extraction with thermal desorption from Tenax GC 4 6
Volatile compound extraction from model system 47 Identification of volatiles by GC/MS 48
Gas monitoring in packages with strawberry fruit 48
Statistical analyses 50 Analysis of variance and correlations 50 Multivariate statistical analysis 50
RESULTS AND DISCUSSION 54
a. Sensory evaluation of strawberries stored under MAP 54
Sensory quality attributes of strawberries kept in storage.. 54 General sensory evaluation 54 Reliability of judges in sensory evaluation 55 Examination of the performance of judges with PCA 57 Analysis of variance (univariate) for sensory data 57 Multivariate analysis of variance of sensory attributes... 59 Differences among treatments over storage time 61 Relationship between sensory attributes 74 Correlation coefficients among sensory attributes 74
Multivariate statistical analysis of sensory data 76 Principal component analysis (PCA) of sensory data 76 Changes in chemical parameters of strawberries 82 Relationship between sensory and chemical parameters 84 Changes in gas composition of fruit stored under MAP 86 Storage potential of strawberries kept under MAP 87
Conclusions 89
b. Flavor volatile analysis of strawberries stored under MAP. 91
Volatile compound extraction from strawberries 91 Direct solvent and simultaneous distillation extraction.. 92 Volatile extraction by dynamic headspace procedure 94 Evaluation of volatile extraction from a model system 97 Evaluation of strawberry volatile compound extraction by dynamic headspace technique 97 Identification of strawberry volatile compounds 105 Volatile compounds of strawberries stored under MAP 114
VI

Multivariate statistical analyses of sensory and volatile data 119 Simple correlation of odor attributes with volatile data. 119
Multiple regression of odor attributes with volatile data. 123 Preliminary data analysis with principal component and discriminant analysis 125 Principal component analysis (PCA) of volatile data 130 Discriminant/Canonical variate analysis of volatile data. 135
Conclusions 154
B. QUALITY ATTRIBUTES OF STRAWBERRY CULTIVARS GROWN IN
BRITISH COLUMBIA 157
INTRODUCTION 157
MATERIALS AND METHODS 158
Strawberry samples 158 Sensory and chemical evaluation 159 Volatile compound analysis 160 Statistical analyses 161
RESULTS AND DISCUSSION 162
Sensory evaluation of strawberry cultivars 162 Overall quality 165 Strawberry volatile compound analysis 165
Conclusions 170
GENERAL SUMMARY OF THESIS RESULTS 174
REFERENCES 177
vii

LIST OF TABLES
Table
1 Sensory attributes used to describe characteristics of strawberries stored under modified atmosphere packaging.... 37
2 Sensory score sheet used in quantitative descriptive analysis (QDA) of strawberry fruit 3 9
3 Influence of judges and replications on evaluation of sensory attributes of strawberries evaluated on day 0 56
4 Influence of gas treatment, storage time and judges on sensory attributes of strawberry fruit stored under modified atmosphere packaging for 10 days 60
5 Multivariate analysis of variance on all sensory attributes of strawberries stored for 10 days under modified atmosphere packaging conditions at 1°C 62
6 Mean score rating of odor attributes for strawberry fruit stored under modified atmosphere packaging for 10 days 63
7 Mean score rating of taste attributes for strawberry fruit stored under modified atmosphere packaging for 10 days 64
8 Mean score rating for texture and overall fruit quality rating of strawberry fruit stored under modified atmosphere packaging for 10 days 65
9 The changes in C02 and 02 levels in MA packages containing strawberries flushed with air, mixed gas and carbon dioxide and stored for 10 days at 1°C 72
10 Simple correlation coefficients between sensory attributes of strawberry fruit stored under modified atmosphere packaging for 10 days at 1°C 75
11 Soluble solids, Ph, titratable acidity, sugars and ethanol in strawberry fruit stored under modified atmosphere packaging for 10 days at 1°C 83
12 Correlation coefficients between sensory data of strawberries and chemical parameters 85
13 Reproducibility of peak areas of known volatile compounds in a model system 98
VI11

14 Reproducibility of peak areas of known volatile compounds extracted from an aqueous solution using dynamic headspace procedure 98
15 Means, standard deviations and coefficients of variation for specific volatile compounds extracted from strawberry fruit by the dynamic headspace technique 9 9
16 Influence of strawberry preparation on the peak areas of volatile compounds extracted by the dynamic headspace technique 101
17 Effect of nitrogen flow rate on the peak areas of volatile compounds extracted from strawberries using the dynamic headspace technique 103
18 Effect of purge-and-trap time (hr) on the peak areas of volatile compounds extracted from strawberries using the dynamic headspace technique 103
19 Effect of incubation temperature on the peak areas of volatile compounds extracted from strawberries using the dynamic headspace technique 104
2 0 Tentatively identified strawberry volatile compounds which were desorbed from Tenax GC adsorbent by diethyl ether 107
21 Tentatively identified strawberry volatile compounds which were thermally desorbed from Tenax GC adsorbent 110
22 Strawberry volatiles selected for statistical analysis 113
23 Relative amounts of selected volatiles of strawberry fruit evaluated at day 0 and at day 3 of storage at 1°C for unpackaged and MAP sample with input gases as air, mixed gas or carbon dioxide 116
24 Relative amounts of selected volatiles of strawberry fruit evaluated at day 0 and at day 6 of storage at 1°C for unpackaged and MAP samples with input gases as air, mixed gas or carbon dioxide 117
25 Relative amounts of selected volatiles of strawberry fruit evaluated at day 0 and at day 10 of storage at 1°C for unpackaged and MAP samples with input gas as air, mixed gas or carbon dioxide 118
26 Correlation coefficients between sensory attributes and quantity of volatiles peaks 122
IX

27 Summary of multiple regression of all volatile compounds and those selected by stepwise regression procedure against each of the odor sensory attributes 124
28 Regression equations developed from data volatiles compounds selected by stepwise regression regressed against each of the odor attributes 126
2 9 Principal component analysis of strawberry volatiles analyzed at days 3, 6 and 10 131
3 0 Strawberry volatile compounds selected by stepwise discriminant analysis for inclusion into models to predict the treatment and/ or quality category 13 6
31 Canonical variate analysis of strawberry volatile compounds evaluated at days 3, 6 and 10 13 8
32 Mahalanobis distances between different strawberry treatments analyzed by canonical variate analysis using 25 volatile compounds 142
33 Means of sensory attributes for strawberry fruit grown in British Columbia in 1989 and 1990 163
34 Mean soluble solids, pH, titratable acidity and sugars of strawberry cultivars grown in B.C 164
35 Correlation coefficients of sensory attributes of strawberry fruit grown in B.C. in 1989 and 1990 164
3 6 Two-dimensional partitioning of the total sum of squares for overall quality (%) of five strawberry cultivars grown in B.C 166
37 Relative amounts of selected volatile compounds of six strawberry cultivars grown in B.C 168
x

LIST OF FIGURES
Figure
1 Summary of proposed pathways for the formation of aldehydes and subsequent formation of carboxylic esters from lipid degradation 22
2 Set-up for the apparatus used to collect the headspace volatiles by trapping on the adsorbent Tenax GC 45
3 Principal component scores of nine judges who evaluated strawberries at day 0 58
4 Flavor profiles of strawberries evaluated at day 0 with unpackaged strawberries (4a), MAP strawberries packaged in air (4b), mixed gas (4c) and carbon dioxide (4d) and stored for 10 days at 1°C, respectively 67-70
5 Principal component loadings of sensory attributes of strawberries evaluated from different treatments and different storage times 78
6 Principal component scores of samples from different treatments evaluated at different storage times 80
7 The overall quality rating of strawberries from different MAP treatments kept in storage for 10 days at 1°C 88
8 Comparison of strawberry flavor profiles prepared by: direct solvent extraction (A); steam distillation (B) and vacuum steam distillation extraction (C) 93
9 Chromatograms obtained from strawberry volatiles extracted by headspace technique on a) charcoal adsorbent and b) Tenax GC eluted with solvent; and c) thermally desorbed from Tenax GC 95
10 Mass spectrum of methyl butanoate from a strawberry volatile extract and from mass spectra library 106
11 Typical GC chromatogram of a strawberry volatiles extract eluted from Tenax GC with diethyl ether 109
12 Flavor volatile profiles of unpackaged strawberry (A) and strawberry fruit packaged in air (B), mixed gas (C) or carbon dioxide (D) after 6 days storage at 1°C 115
13 Relative total amounts of volatile compounds extracted from strawberries stored under various MAP conditions for 10 days at 1°C 12 0
XI

14 Relative total amounts of butanoates extracted from strawberries stored under various MAP conditions for 10 days at 1°C 12 0
15 Predicted and observed scores of overall quality scores of strawberry fruit stored under MAP for 10 days using nine volatile compounds selected by stepwise regression.... 127
16 Principal component scores obtained from PCA of 25 volatile compounds from all strawberry samples evaluated from different treatments and storage times 128
17 Canonical variate scores obtained from CVA of 25 volatile compounds from all strawberry samples evaluated from different treatments and storage times 129
18 Principal component scores of strawberry samples from different treatments evaluated at day 0 and after 3 days in storage at 1°C 132
19 Principal component scores of strawberry samples from different treatments evaluated at day 0 and after 6 days in storage at 1°C 133
2 0 Principal component scores of strawberry samples from different treatments evaluated at day 0 and after 10 days in storage at 1°C 134
21 Canonical plot of the first two canonical variates for strawberries evaluated at day 0 and after 3 days in storage at 1°C 139
22 Canonical plot of the first three canonical variates for strawberries evaluated at day 0 and from different treatments evaluated after 3 days in storage at 1°C 140
23 Projection of canonical loadings of volatile data and centroid (mean) sample scores for strawberries evaluated at day 0 and strawberries from different treatments evaluated after 3 days in storage at 1°C 144
24 Canonical plot of the first two canonical variates for strawberries evaluated at day 0 and from different treatments evaluated after 6 days in storage at 1°C 146
25 Canonical plot of the first three canonical variates for strawberries evaluated at day 0 and from different treatments evaluated after 6 days in storage at 1°C 147
xii
26 Projection of canonical loadings of volatile data and centroid (mean) sample scores for strawberries evaluated at day 0 and strawberries from different treatments kept in storage for 6 days 1°C 149
27 Canonical plot of the first two canonical variates for strawberries evaluated at day 0 and from different treatments evaluated after 10 days in storage at 1°C 150
28 Canonical plot of the first three canonical variate for strawberries evaluated at day 0 and from different treatments evaluated after 10 days in storage at 1°C 151
29 Projection of canonical loadings of volatile data and centroid (mean) sample scores for strawberries evaluated at day 0 and strawberries from different treatments kept in storage for 10 days at 1°C 153
30 Relative amounts of some volatiles in the six cultivars of strawberry grown in B.C 169
31 Canonical plot of six cultivars grown in B.C. based on 25 selected volatile compounds 171
32 Projection of canonical loadings (correlations) of volatile data and centroid scores for six strawberry cultivars grown in B.C 172
Xlll

Dedicated to my late father (13/10/89) and mother (23/09/91) for
their love and patience through my studies.
xiv

ACKNOWLEDGEMENTS
I wish to express my greatest appreciation and gratitude to my
two major advisors, Dr. W.D. Powrie and Dr. B.J. Skura for their
encouragement, wise words, guidance and valuable assistance during
my studies, research and thesis preparation. I am also thankful to
Dr. S. Nakai who first introduced me to multivariate statistical
techniques and to Dr. P. Jolliffe both of whom served on my
committee and offered constructive criticism to my work.
Special regards are extended to my brothers Newton, Garneth,
Moffat and Frank, and all family members and friends for their
encouragement and support during my studies. I would also like to
thank all members of my sensory panel whose participation helped
complete this project.
I extend my appreciation to the Canadian International
Development Agency (CIDA), Ottawa and Pacific Asia Technologies,
Inc., Vancouver, B.C. for having provided the financial assistance,
and the University of Zambia (UNZA) for granting the study leave.
xv

1
1.0 INTRODUCTION
Strawberry [Fra.ga.ria. ananassa, Duchesne) is a highly perishable
fruit with a limited post-harvest shelf life at room temperature.
Although refrigerated storage is useful for extending shelf life of
strawberries, mold growth is visible on the surfaces of the fruit
within one week at 1°C (Sommer et al. , 1973; El-Kazzaz et al. ,
1983) . During frozen storage, strawberries retain their flavor and
color for several months, but upon thawing, the fruit becomes
unacceptably soft with excessive drip loss (Skrede, 1983) .
Irradiation is very effective for inactivating mold mycelium and
spores (Zegota, 1988), but concern for safety by consumers has led
to limited use in North America.
Recently, the packaging of horticultural commodities in
polymeric films with specific gas permeabilities in combination
with low temperature storage has increased in North America (Forney
et al., 1989; Kader et al. , 1989; Prince, 1989; Risse and McDonald,
1990). The development of a modified atmosphere within polymeric
film pouches can bring about an extension of the shelf-life of a
number of fruits and vegetables (Duan et al. , 1973; Han et al. ,
1985; Smith et al.,1987; Kader et al. , 1989; Prince, 1989).
Results have been documented for the benefits of storing
strawberries under elevated C02 and/or reduced 02 levels (Woodward
and Topping, 1972; El-Kazzaz et al. , 1983). Elevation of the C02
level and reduction in the 02 content of the microatmosphere around
the commodities can suppress the decay of fruit (Woodward and
Topping, 1972; El-Kazzaz et al., 1983; Harman and McDonald, 1983;

2
Han et al. , 1985), retard senescence and delay softening of the
fruit (Kader, 1980; Knee, 1980; 1973; Arpia et al., 1984), minimize
enzymic activity (Barmore and Rouse, 1976; Monning, 1983; Rosen and
Kader, 1989) and reduce respiration rate (Li and Kader, 1989) .
Although high C02 and/or low 02 levels in the microatmosphere
of produce extend shelf life, the development of off-flavors/odors
is of major concern. Off-flavors/odors may be induced by anaerobic
respiration (Carlin et al., 1990) and accumulation of certain
volatile compounds in commodities treated with low 02 and high C02
levels (Woodward and Topping, 1972). Burton (1982) reported that
strawberries developed off-flavor in a 3% 02 microatmosphere and
Browne et al. (1984) noted that, with 3-16% C02 in the gaseous
environment around palleted strawberries with polyethylene
covering, an off-flavor developed in the fruit during storage at
2°C. De Pooter et al. (1981; 1987) reported increases in volatile
compounds in apples stored under controlled atmosphere (CA) after
treatment with propionic acid. However, Paillard (1981) and
Lidster et al. (1983) found that CA suppressed the aroma of apple
fruit when stored under CA. It is therefore important to establish
relationships between the volatile compounds and sensory attributes
of fruit so that an objective measurement of quality changes can be
undertaken. Such relationships could be useful for monitoring the
quality of fruit during storage under various conditions.
The general objective of this study was to investigate the
relationship between sensory attributes and gas chromatographic
(GC) data for strawberries stored under different MAP conditions.

3
The specific objectives of the first part of the study were: a) to
use quantitative descriptive analysis (QDA) to assess the quality
attributes of strawberries stored for periods up to 10 days under
MAP at 1°C; b) to study the influence of MAP on chemical changes
such as pH, soluble solids, titratable acidity and ethanol, and
relate them to sensory changes; and c) to apply multivariate
statistical analysis to relate fruit quality changes to the effects
of MAP. The specific objectives of the second part of this study
were: a) to identify the types and the relative amounts of
volatiles of strawberries stored under different MAP conditions; b)
to study the influence of MAP on the volatile profiles of
strawberries kept in storage, and relate sensory attributes to GC
data; and c) to classify the treatment category and quality of
strawberries stored under MAP from the volatile compound data by
applying multivariate statistical techniques.
In a separate experiment, quantitative descriptive analysis
(QDA), and the headspace purge-and-trap technique were used to
evaluate strawberry cultivars grown in British Columbia (B.C.).
The objectives of this part of the study were to evaluate sensory
attributes of fruit quality and to determine their relative
importance in strawberry fruit by applying two-dimensional
partitioning (TDP). In addition, the volatile compounds of the
cultivars were evaluated for potential classification purposes.

4
A. SENSORY AND VOLATILE COMPOUND ANALYSIS OF STRAWBERRIES STORED
UNDER MODIFIED ATMOSPHERE PACKAGING (MAP).
2.0 LITERATURE REVIEW.
Commercial production of strawberry {Fragaria ananassa,
Duchesne) in North America is documented from as far back as 1800.
As of 1979, major production of the fruit was concentrated in
Europe, North and Central America, and Asia. Canada produced 1.4%
of the world's total production. Strawberries are mainly produced
for the fresh market, but a large quantity of the fruit also goes
for processing into jams, jellies, preserves and marmalades
(Salunkhe and Desai, 1980) .
Strawberry is a highly perishable fruit characterized by a
short post-harvest life at room temperature. This has mainly been
attributed to the fruit's high respiration rate, susceptibility to
fungal spoilage, and its delicate tissue (Woodward and Topping,
1972; Sommer et al., 1973) . These effects lead to rapid
deterioration of the fruit and loss in quality. The rapid
perishability of strawberries thus limits the distance and transit
time of shipment as well as storage period. Although airfreight is
an alternative to truck or rail transportation, the relatively high
cost and especially the high temperatures of up to 15°C encountered
in the cargo planes, may result in considerable losses due to fruit
decay.

5
2.1 Methods used to store strawberries.
Because of the limited shelf-life of strawberry fruit and its
susceptibility to mold growth, a number of storage techniques have
been applied to preserve the fruit. Low temperature storage or
precooling is a common procedure used to remove field heat soon
after harvest (Smith, 1963) . Salunkhe and Desai (1980) recommended
the use of temperatures between -0.6 to 0°C and relative humidity
(RH) between 90 to 95% for extending the shelf-life of strawberries
for up to a week. Freezing is the most effective preservation
method to store strawberries for several months (Douillard and
Guichard, 1989; 1990). However, the extensive textural changes and
drip loss that occur at thawing are undesirable (Skrede, 1983).
Irradiation of strawberries can inhibit the incidence of gray
mold. Maxie et al. (1971) found that sizeable losses from
postharvest decay could be prevented when the strawberries were
irradiated. Zegota (1988) found that irradiation, with a 2.5
kilogray (KGy) dose followed by cold storage, extended the shelf-
life of 'Dukat' strawberries to a minimum of 9 days. However, the
phobia surrounding irradiation and concern for safety have resulted
in restricted use of this technology in North America. Thermal
processing is another method used for preservation of strawberry
fruit. However, this is accompanied by unattractive discoloration
of the fruit due to the degradation of anthocyanin pigments
(Wrolstad et al. , 1980).

6
2.2 Modified atmosphere packaging (MAP).
2.2.1 Packaging of strawberries in polymeric films.
In the last few years, there has been increasing use of
packaging of fruit and vegetables in polymeric films with specific
gas permeability in combination with low temperature storage
(Forney et al., 1989; Kader et al., 1989; Risse and McDonald,
1990). Packaging of horticultural produce in polymeric films is a
common technique designed to prevent moisture loss, protect against
mechanical damage, and provide better appearance (Henig and
Gilbert, 1975; Bhowmik and Sebris, 1988) . Originally, the films
were aimed at reducing water loss with minimal injury to the
product. It is clear now that the primary function of the films in
the form of package systems is to develop a modified atmosphere
around fresh products during storage and extend their shelf life
(Forney et al., 1989) .
Controlled/Modified atmosphere (CA/MA) means that the
atmospheric composition surrounding a perishable product is
different from that of normal air. Prince (1989) defined CA as
'the intentional alteration of the natural gaseous environment and
maintenance of that atmosphere at a specified condition throughout
the distribution cycle, regardless of temperature or other
environmental variations.' He also defined MA as 'the initial
alteration of the gaseous environment in the immediate vicinity of
the product, permitting the packaged product interactions to
naturally vary their immediate gaseous environment.'
Generally, under modified atmosphere packaging (MAP),

7
horticultural produce is sealed in a film pouch or container
initially flushed with a specific gas mixture of varying
proportion, especially in C02 and 02 levels, and stored at
refrigeration temperature. Han et al. (1985) seal-packaged 'Fuji'
apples in bags consisting of polyethylene (PE) films with different
thicknesses between 0.02 and 0.06 mm, and stored the fruit for five
months at about 0°C. They found that the bags, made with PE film
effectively decreased weight loss and decay of the apples but the
fruit developed a slightly higher degree of internal browning than
unpackaged apples. Bhowmik and Sebris (1988) reported considerable
reduction in weight loss of shrink-wrapped peaches and better
sensory quality of the packaged fruit than the control. Forney et
al. (1989) studied changes in quality of broccoli stored under MAP
conditions. Water loss was decreased 17% by CA storage and 50% by
film-wrapping the broccoli. Compared to the control, broccoli
quality from both treatments was significantly better.
2.2.2 Beneficial effects of modified atmosphere packaging (MAP).
Horticultural products continue as living organisms after
harvest. Therefore, metabolic processes associated with
maturation, ripening and senescence, such as respiration, continue
into storage and lead to rapid quality deterioration of the fruit.
Modified atmosphere packaging (MAP), controlled atmosphere storage
and other storage techniques that result in high C02 and low 02
atmospheres are, however, known to extend the storage-life of a
variety of horticultural products (Brecht, 1980; Kader et al. ,

8
1989) . Maturation of apples and tomatoes was delayed under
atmospheres low in 02 and high in C02 (Smith et al. 1987) . Shelf
life of shredded lettuce, packed in 35 |im LDPE pouches flushed with
5% C02 and 5% 02, and stored at 5°C, doubled (Ballantyne, 1986).
Other examples of extensions of shelf life of horticultural
products stored under lowered 02 and increased C02 atmospheres have
been reported for bananas (Duan et al., 1973), peaches (Kader et
al., 1982; Bhowmik and Sebris, 1988), apples (Lau, 1985; 1988) and
broccoli (Forney et al., 1989).
The beneficial effects of modified/controlled atmosphere during
storage have been attributed to delayed softening (Kader, 1980;
Harman and McDonald, 1983; Arpia et al. , 1984), reduced respiration
(Li and Kader, 1989; Kubo et al., 1989), delayed ripening (Salunkhe
and Desai, 1980), less microbial spoilage (Woodward and Topping,
1972; El-Kazzaz et al. , 1983) and reduced enzyme activity (Monning,
1983; Barmore and Rouse, 1976; Rosen and Kader, 1989). Ke et al.
(1990) found that 'Bartlett' pears tolerated atmospheres containing
1.0, 0.5 or 0.25% 02 and also 20, 50 or 80% C02 at 0, 5 or 10°C
without detrimental effects on their quality attributes. They
noted that the beneficial effects of exposure of the fruit to 02-
reduced or C02-enriched atmospheres included reduction of
respiration rates, lower ethylene production rates, and retardation
of skin yellowing and flesh softening.
2.2.2.1 Reduction in softening.
Effective reduction in weight loss of fruit and vegetables

9
under MAP is important in keeping product quality. MAP has been
reported to delay fruit softening (Barmore and Rouse, 1976).
Harman and McDonald (1983) reported that atmospheres, containing 4%
to 10% C02, decreased softening of Kiwi fruit, but that higher C02
concentrations had no further additional effect on firmness.
'Spartan' apples kept in 1% 02 + 2% C02 microatmosphere at 0°C for
6-9 months were firmer and had higher acidity than apples kept at
standard commercial atmospheres of 2.5% 02 + 2% C02 (Lau, 1983).
However, reduction of the storage C02 level from 2% to 0.5%
decreased firmness and increased the incidence of core browning
while the fruit stored in 2.5% 02 microatmosphere developed scald.
The rate of Kiwi fruit softening during storage was reduced by
elevated levels of C02 and accelerated by ethylene (C2H2) (Arpia et
al. 1984). 'Rabbiteye' blueberry cultivars stored in high C02
atmospheres resulted in greater percentages of marketable and firm
fruit as well as better sensory ratings than blueberries stored in
air (Smittle and Miller, 1988) .
The reduction in softening of fruit kept under MAP may be
attributed in part to reduced moisture loss (Henig and Gilbert,
1975; Risse and McDonald, 1990). Han et al. (1985) reported that
a weight loss of 3.4% in non-packaged apples was sufficient to
cause shrivelling and result in the loss of commercial value in 7
days. Forney et al. (1989) found that storage of broccoli under
controlled atmosphere reduced water loss by 17% while film wrapping
reduced water loss by 50% as compared to the control stored in air.
They concluded that the reduced water loss in these treatments may

10
be related to their inhibitory effect on senescence, as evidenced
by decreased yellowing and floret expansion relative to the
control.
2.2.2.2 Delayed microbial growth (fungal spoilage).
The main post-harvest pathogenic disorder of strawberries is
the gray mold rot caused by Botrytis cinerea which may invade the
floral parts in the field (El-Kazzaz et al., 1983). Although
development of the pathogen after penetrating the tissues is slow
at 2°C, it is very rapid at high temperatures (Sommer et al. ,
1973). The spread of the fungus is also facilitated in storage by
contact of sound and infected fruit. Elevation of C02 content of
the storage atmosphere suppressed the decay of strawberries and
extended their shelf-life (El-Kazzaz et al., 1983). Burton (1982)
pointed out that modified atmospheres can decrease rotting of
strawberries by pathogens, often by delaying ripening of fruit
since ripe fruit is more susceptible to attack by pathogens.
The success of controlled/modified atmosphere storage of
strawberry fruit in delaying microbial growth can be attributed to
the fact that the fruit can tolerate up to 2 0% C02 and 02
concentrations as low as 2% (Brecht, 1980; Kader, 1980; Kader et
al. , 1989). Carbon dioxide, at concentrations greater than 5-10%,
inhibits growth of microorganisms, especially aerobes, when
strawberries are kept at refrigeration temperatures. King and
Nagel (1975) attributed the inhibitory effect of C02 to alteration
of microbial cell permeability. Follstad (1966) and Wells and Uota

11,
(1970) found that growth of fungi decreased linearly with reduced
02 between 21 to 0% and also with increased C02 atmospheres (between
10 to 45%) containing 21% 02. However, Svircev et al. (1984)
reported that inhibition by increased C02 varied with different
fungi. The germination of Peronospora hyoscyami was reduced in the
presence of 0.8% C02 while Botrytis cinerea and Aspergillus niger
required 5 and 15% C02 in order to germinate, respectively.
Woodward and Topping (1972) found that strawberries, stored at 3°C
in air with 5, 10, 15 and 20% C02, remained in good condition for
10 days, with reduced mold rotting due to Botrytis.
Of the many gas conditions studied by El-Kazzaz et al. (1983),
air + 15% C02 and CA (2.3% 02 + 5% C02) + 10% CO were the most
effective atmospheres for suppressing fruit rot. The presence of
ethylene resulted in more decay development, which suggests that
ethylene might enhance disease development or fungal growth, or
cause tissue damage. Kim et al. (1986) studied the storability of
strawberries in air supplemented with various levels of C02. They
found 14% and 10% decay in fruit stored in air with 20% and 30% C02
for five weeks, respectively. However, the fruit stored in air for
two weeks had 53% decay. Dixon and Kell (1989) reported that much
of the value of C02 treatment of fruits is due to the delay of
their rotting by fungi. But they also pointed out that lowering
the temperature combined with partial pressures of C02 in the range
of 0.2 to 0.5 atmospheres provided a strong check to fungal growth.

12
2.2.2.3 Reduced respiration rate.
The single most important phenomenon occurring during storage
that results in deterioration of vegetative produce is respiration.
Fruit stored under CA/MA have been reported to have a reduced
respiration rate (Kubo et al. 1989) . Forney et al. (1989) found
that C02 production and 02 consumption of broccoli held in CA or
plastic films was reduced by 30 to 40% relative to the controls.
Li and Kader (1989) studied the residual effects of controlled
atmosphere storage of strawberry fruit. Low levels of 02 (0.5-2%)
and high levels of C02 (10-20%) and their combinations were found
to reduce respiration of the fruit, but most importantly, had a
residual effect. At the end of storage, fruit transferred to air
maintained flesh firmness and color.
The tolerance of fruit to different levels of C02 and 02 depends
on the storage temperature, gas composition, and the fruit type
(Porritt and Meheriuk, 1968; Bohling and Hansen, 1983; Kader,
1985). Kubo et al. (1989; 1990) found 60% C02, 20% 02 and 20% N2
reduced the respiration rate of a number of fruits and vegetables
as measured by 02 uptake. Although they found a decrease in
respiration rate of a number of climacteric fruits including
apples, melons, tomatoes and bananas, little change in respiration
was noted at the preclimacteric stage. Also, little change was
found in non-climacteric fruit and vegetables including lemons,
potatoes, sweet potatoes and cabbage. They concluded that the
respiratory response to high C02 was quite different depending on
the kind of horticultural crop and stage of maturity.

13
2.2.2.4 Reduced enzyme activity.
Enzymes continue their metabolic activity after harvest and
into storage. Some of their activities are detrimental to fruit
quality. Tissue softening which has been attributed to
disintegration of pectic substances and cellulose fibrillar
materials, involves enzymes such as polygalacturonase and cellulase
(Han et al., 1985; Abeles and Takeda, 1990). Although Han et al.
(1985) found no significant differences in enzyme activity between
apples packaged in different films, a highly significant and
negative relation was obtained between enzyme activity and
firmness. Pectinesterase is another important enzyme involved in
softening of fruit. Barmore and Rouse (1976) suggested the use of
pectinesterase activity to monitor the changes in softening time of
fruit during controlled atmosphere storage.
Succinate dehydrogenase and other enzymes have been found to be
inhibited by CA/MA conditions (Frenkel and Patterson, 1973; 1977) .
This may explain the increase in succinic acid noted in apples
stored in atmospheres containing high C02 levels (Monning, 1983) .
2.2.3 Physiological effects of MAP on horticultural commodities.
The effect of elevated carbon dioxide and decreased oxygen has
been under investigation by a number of researchers. These gases
may have a strong reduction effect on respiration due to their
inhibitory effect on several respiratory enzymes of the Krebs
cycle. Ke et al. (1990) found that exposure of 'Bartlett' pears to
0.5% or 0.25% 02 at 0°C significantly decreased respiration rates

14
as compared to those pears stored in air. Frenkel and Patterson
(1973; 1977) suggested that low 02 and high C02 levels influence the
mitochondrial enzymic activities since they noted the suppression
of succinic dehydrogenase activity and ultrastructure alterations
in various organelles that included mitochondria, plastids and also
the tonoplast and cytoplasm of pears. Brecht (1980) reported that
02 levels between 3% and 21% had an influence on the Krebs cycle in
the mitochondria, and that levels below 3% also inhibited the
glycolytic system in the cytosol. Kerbel et al. (1988) studied the
influence of C02 in air on the glycolytic pathway of peach fruit.
Fruit kept under MA with elevated C02 levels exhibited decreased
respiration rates and ethylene evolution rates compared to those
for fruit stored in air. They also found that
ATP:phosphofructokinase and PPi:phosphokinase-activities declined
and thus concluded that C02 may have an inhibitory effect on the
sites of both kinases in the glycolytic pathway. However, Burton
(1982) suggested that the beneficial effects of storage of fruit in
low 02 microatmospheres results more from suppression of the
activity of comparatively low-02-af f inity enzymes such as
polyphenolase, fi-type cytochromes, ascorbic acid oxidase and
glycolic acid oxidase than from suppression of the basal metabolism
mediated by cytochrome-c oxidase.
Excessive levels of C02 may also be injurious to plant tissues.
Frenkel and Patterson (1977) noted ultrastructural alterations of
membranes in the tissues of pears stored under elevated C02. They
suggested that high C02 may alter interfacial tension of lipid

15
layers and thus impair the ability of lipid-containing membranes to
maintain structural continuity, resulting in membrane collapse.
Also, excessive bicarbonate ions resulting from high C02 tensions
was thought to form insoluble calcium carbonate salts, thus
rendering calcium unavailable for maintenance of membrane structure
and ultimately contributing to ultrastructural collapse.
Apple fruit, suffering from C02-injury, have been reported to
accumulate succinic acid in the tissues and this has been
attributed to the inhibition of succinate dehydrogenase activity by
C02 (Frenkel and Patterson, 1973; 1977). Monning (1983) reported
that CA-storage of apples not only inhibited succinate
dehydrogenase but other enzymes as well. They concluded that C02
may inhibit the glycolysis pathway, succinate dehydrogenase
activity, and also possibly the formation of citrate/isocitrate and
a-ketoglutarate. Frenkel and Patterson (1977) reported that the
inhibitory effect of C02 on succinic dehydrogenase activity may
lead to restricted turnover of respiratory metabolites, and this
would result in limited ATP production (Siriphanich and Kader,
1986) or in reduced synthesis of essential intermediary
metabolites. Exposure to high C02 may lead to a drop in pH due to
the dissociation of carbonic acid to bicarbonate and hydrogen ions
(Siriphanich and Kader, 1986) . This drop in pH beyond normal
limits could result in a stage where normal physiological functions
might not be sustained. Burton (1982) reported that increased C02
levels may influence reactions that involve reversible
decarboxylation such as those that may involve pyruvate, citrate

and a-ketoglutarate.
16
2.2.4 Negative effects of elevated C02 and reduced 02.
Although storage of a number of horticultural products under
CA/MA has been beneficial, high levels of C02 or low levels of 02
may induce anaerobic respiration which can lead to off-flavor/odor
development (Carlin et al. 1990). Burton (1982) reported that
strawberries, stored in MA having 3% 02, develop off-flavors. El-
Kazzaz et al. (1983) detected off-flavors in strawberries treated
with air + 15% C02. Woodward and Topping (1972) suggested that
long-term storage of strawberries in MA with 02 levels of 1% or
lower may lead to off-flavors, and that the use of high C02
concentrations in the microatmosphere may be restricted to the
storage of strawberries for periods for up to 7 days where adequate
refrigeration is unavailable. Browne et al. (1984) noted that
strawberries, at 2°C in a microatmosphere of 3-16% C02 within
patented polyethylene covers, developed off-flavor during fruit
storage.
With very low 02 concentrations (below 1%) in the
microatmosphere, off-flavors caused by fermentative reactions can
take place in a number of fruits such as bananas, apples, avocados
and strawberries (Brecht, 1980). Bohling and Hansen (1983)
reported that high C02 and low 02 concentrations in the
microatmosphere of strawberries bring about reduced respiration
rates. Carlin et al. (1990) reported that C02 levels higher than
30% or 02 levels less than 2% induced microbial spoilage of carrots

17
stored in low 02 permeable films. Atmospheres containing more than
4% C02 in air (15-20% 02) reduced the softening of Kiwi fruit
(Harman and McDonald, 1983) . Fruit stored in atmospheres
containing greater than 10% C02 for more than 16 weeks, developed
abnormal texture, unacceptable appearance and off-flavor.
2.3 Strawberry flavor volatiles.
During the maturation and ripening of strawberry fruit, a
number of biochemical reactions are responsible for the development
of aroma compounds (Tressl and Jennings, 1972; Paillard, 1981) .
Volatile compounds such as aldehydes, alcohols and esters are well
known as major contributors to the aroma of fruits and vegetables
(Eriksson, 1979). In some fruits and vegetables, specific
compounds have been identified as contributors to the unique flavor
and aroma of each particular produce. Hexanol, trans-2-hexenal and
2-methylbutanoate contribute to typical apple aroma (Dimick and
Hoskin, 1981) .
Although it has been suggested that the strawberry has no
'character impact' compound (Yamashita et. al, 1976 a,b), most of
the volatile compounds identified in this fruit include alcohols,
aldehydes and esters (Teranishi et al. 1963; Honkanen and Hirvi,
1990) . McFadden et al. (19 65) combined gas chromatography (GC) and
mass spectrometry (MS) to analyze the complex oil of strawberry
volatiles. Among the 150 compounds isolated were alcohols, esters,
acetals, aldehydes, furfural, aromatic aldehydes, ketones as well
as terpenes and aromatic hydrocarbons. Schreier (1980) studied

18
volatiles of cultivated strawberries of Fragaria ananasa c.v. Senga
Sengana, Senga Litessa and Senga Gourmella using GC/MS after the
extraction of compounds by combined vacuum distillation-liquid-
liquid extraction, and by prefractionation on silica gel. The main
compounds isolated from the fresh and frozen fruit were methyl and
ethyl butanoate, methyl and ethyl hexanoate, trans-2-hexenyl
acetate, trans-2-hexenal, trans-2-hexen-l-ol as well as 2,5-
dimethyl-4-methoxy-3-(2 if) -furanone.
The compound, 2 , 5-dimethyl-4-methoxy-3- (2if) -furanone, in
strawberry has been isolated and identified (Scheier, 1980;
Pickenhagen et al., 1981), and is now recognized as the compound
contributing to that unique flavor/aroma characteristic of
strawberry fruit. Douillard and Guichard (1990) studied the aroma
compounds characterizing six strawberry cultivars. Sixty compounds
identified by GC-MS were mainly esters, but also compounds related
to furanone such as 2,5-dimethyl-4-methoxy-2,3-dihydrofuran-3-one
(mesifurane), 2,5-dimethyl-4-hydrofuran-3-one (furanoel) and
nerolidol. However, Dirinck et al. (1981) also reported sulphur
containing compounds that included methylthiol esters, methylthiol
acetate and methylthiol butanoate in strawberry fruit. They
indicated that these compounds had to be considered to explain the
differences in the aroma of strawberry varieties.
2.4 Biosynthesis of flavor/aroma volatiles in strawberries.
Formation of esters and other volatiles in fruits and
vegetables have been at the center of flavor research in the last

19
few years (Salunkhe and Do, 1976). Weurman (1961) found that seven
volatiles were formed when an enzyme mixture and a mixture of
nonvolatiles prepared from different parts of raspberry fruit were
added together. In many fruits and vegetables, the precursors of
the volatiles have been identified. In bananas, the precursor to
isoamyl alcohol and isoamyl acetate volatiles, which typify banana
flavor, has been identified as the amino acid, leucine (Tressl and
Drawert, 1973). They also found that other amino acids, such as
valine and phenylalanine, and fatty acids, were converted to
alcohols, esters and ketones by the fruit.
The biosynthesis of carboxylic esters is thought to result from
the esterification of aliphatic alcohols with organic acids in
strawberry fruit tissue. Yamashita et al. (1975; 1976a; 1977)
studied the formation of volatile esters in strawberries.
Aldehydes, such as acetaldydes, propanal, butanal, pentanal and
hexanal, were reduced to their corresponding alcohols upon
incubation with the fruit. The aliphatic alcohols such as methyl,
ethyl, isopropyl, isobutyl, 72-amyl and hexyl were subsequently
converted to their respective esters i.e. acetate, propionate, n-
butanoate, isovalerate and caproate during incubation with
strawberry fruit. The headspace gas of 'Golden Delicious' apples,
treated with propionic acid, C3- to C6-aldehydes or C2-to C6-
carboxylic acid vapors, was analyzed by De Pooter et al. (1981;
1983). They found that propionic acid was esterified to
propionates, and the aldehydes and acids to alcohols and esters,
respectively. They suggested that the aldehydes were either

20
transformed into the corresponding alcohols and esterified with
carboxylic acids present in the tissues or (to a small degree)
oxidized into acids, which reacted with tissue alcohols.
Conversion of aldehydes into alcohols and subsequent
esterification to esters is thought to be enzyme catalyzed
(Eriksson, 1979; Yamashita et al. 1979; Bartley and Hindley, 1980).
Weurman (1961) could only obtain volatiles from a raspberry extract
preparation when both the enzyme, alcohol dehydrogenase, and
coenzyme I were present. Yamashita et al. (1976b and 1978) found
two alcohol dehydrogenases in strawberry seeds. One enzyme was
found to be NAD-ADH specific and reacted with ethanol and allyl
alcohol while the other was NADP-ADH specific and reacted with
benzyl alcohol and geraniol (Yamashita, et al., 1982). They
concluded that the NAD-dependent alcohol dehydrogenase (alcohol:NAD
oxidoreductase) reacted only with alcohols and aldehydes, while
aromatic and terpene , alcohols were better substrates for NADP-
dependent alcohol dehydrogenase (alcohol:NADP oxidoreductase) than
aliphatic alcohols and aldehydes.
Aldehydes are important compounds in the whole pathway leading
to synthesis of esters. It has been established that aldehydes
originate mainly from enzymic breakdown of linoleic and linolenic
acids and other fatty acids (Galliard and Philips, 1972; Galliard
and Philips, 1975; Galliard et al. 1976; Eriksson, 1979). Galliard
and Matthew (1976) found an enzyme system in cucumbers that
catalyzed the a-oxidation of fatty acids to shorter chain products.
Galliard et al. (1976) reported the major aldehyde in the cucumber,

21
resulting from lipid degradation, was trans-2-nonenal. A
lipoxygenase-type enzyme system was involved in the cleavage
process. Galliard et al. (1976) and Galliard et al. (1977)
proposed enzymic pathways for the biogenesis of aldehydes such as
hexanal, cis-3- and trans-2-nonenal from lipids in tomato fruit
(Figure 1) . They suggested that the main pathway involved the
sequential activity of lipoxygenase, hydroperoxide cleavage and
cis-3-:trans-2-enal isomerase enzyme. In addition to lipids, amino
acids can be converted to volatile compounds. Yu et al. (1968)
analyzed compounds produced from amino acids by enzyme extracts
from tomato fruit. Carbonyl compounds such as propanal as well as
alcohols were produced from alanine, leucine and valine as
substrates. They suggested that the mechanism may involve
transamination.
2.5 Volatiles of fruit kept under CA/MA conditions.
Assessment of aroma of fruits and vegetables is an important
aspect in the control of quality during storage of the fresh
products. Modified atmosphere storage extends the storage life of
a number of fresh products, but development of off-flavors/odors is
of concern (El-Kazzaz, et al. 1983; Browne et al., 1984). With the
identification of flavor/aroma compounds contributing to
undesirable attributes, these compounds could be used as indicators
of off-odor. Takeoka et al. (1986) studied the formation of
artifacts in Kiwi fruit concentrate stored at -10°C. They found a
number of degradation products that were considered to contribute

Lipid
22
Linoleic acid Linolenic acid
Lipoxygenase
9-Hydroperoxy 13-Hydroperoxy 9-Hydroperoxy 13-Hydroperoxy
I cis-3-Nonenal Hexanal
I trans-2-Nonenal
I
L cis-:
K Hexi
cis-3-Hexenal
1 cis-3,cis-6-Nonadienal
trans-2-Hexenal
J trans-2, cis-6-Nonadienal
I trans-2- cis-3- Hexan-1-ol trans-2- trans-2, Nonen-1-ol Nonen-1-ol Hexen-1-ol cis-6-
Nonadien-1-ol
cis-3, cis-6-
Nonadien-1-ol
Alcohols + Carboxylic acid' Carboxylic esters
Figure 1. Summary of proposed pathways for the formation of aldehydes and subsequent formation of carboxylic esters from lipid degradation (Galliard et al. 1976; Galliard et al. 1977; Eriksson, 1979).
23
to off-flavors in the Kiwi fruit concentrate.
Synthesis of volatiles continues in harvested fruits and
vegetables during storage (Tressl and Jennings, 1972) . The amounts
and types of volatiles formed can be influenced by storage
conditions. Johansson (1961) reported increased non-ethylenic
volatiles in CA rooms containing stored apples, but water scrubbing
of the gas mixture in the rooms prevented the increase of volatiles
in the CA room atmosphere. De Pooter et al. (1981) compared the
formation of volatiles in intact apple fruit that had been treated
with propionic acid and kept under CA or air. Higher amounts of
propionate and total propyl esters were formed in fruit kept under
CA than in air. De Pooter et al. (1987) noted that apples kept
under CA had increased concentrations of aldehydes derived from
added carboxylic acids and suggested the presence of a reductive
path for the conversion of carboxylic acids into aldehydes. They
concluded that high carbon dioxide levels in CA-storage interferes
with carboxylic acid metabolism and alcohol dehydrogenase activity,
leading to a deterioration of aroma quality. Crouzet et al. (1985)
found more volatiles in tomato fruit stored under CA than in
artificially or field-ripened fruit.
However, there appears to be contradictory evidence on the
effects of CA/MA storage on fruits with regard to volatile
compounds. This may be related to the type and maturity of fruit
as well as the storage conditions under investigation. 'Cox's
Orange Pippin' apples gradually lost their ability to ripen
normally when stored in a 2% 02 microatmosphere at 3.5°C, but their
24
transfer to air at 20°C resulted in slight production of volatiles
(Patterson et al., 1974). Paillard (1981) analyzed the headspace
aroma compounds of 'Cox' apples placed in CA storage and showed a
depressed rate of some volatile compound production during the
ripening stage. Yahia et al. (1990) studied the effect of CA
storage on volatiles of 'Mcintosh' and 'Cortland' apples.
Controlled atmosphere storage (3% 02 + 3% C02 + 94% N2) of apples at
0°C for 19 weeks caused a 'residual suppression' effect on the
production of propyl butanoate, butyl hexanoate and hexyl
hexanoate. They concluded that CA may alter the metabolism of the
fruit by blocking the normal production of some volatiles.
Other researchers also found that apples stored under CA either
failed to synthesize adequate amounts of desirable volatiles or had
reduced production of overall volatiles (Guadagni et al. , 1971) .
Lidster et al. (1983) found that the development of headspace
ethanol, acetaldehyde, ethyl butanoate and hexenal was suppressed
in apples stored in modified atmosphere at 2.8°C. Although
placement of fruit in room air initially regenerated ethyl
butanoate and hexenal, storage of fruit in 1.5% C02 + 1.0% 02 for
320 days completely suppressed the principal headspace volatiles
and blocked their subsequent regeneration in room air. Willaert et
al. (1983) also found that long term storage of apples under CA
resulted in a decrease of aroma quality.
2.6 Methods of volatile extraction and analysis.
A number of extraction methods have been used to study flavor

25
volatiles of strawberry fruit and other horticultural products
(Leahy and Reineccius, 1984; Nunez, et al., 1984). These methods
include liquid-liquid or solvent extraction (Hirvi, 1983; Idstein
et al. 1984; Douillard and Guichard, 1989), steam/distillation
extraction at atmospheric pressure or under vacuum (Pino, 1982;
Bartely and Schwede, 1987; Ohta, et al., 1987) and headspace
volatile extraction (Schaefer, 1981; Liardon et al. 1984) .
The objective of the study generally governs the method of
choice and this in turn affects the type and amounts of volatiles
obtained (Parliment, 1986). Yabumoto and Jennings (1977) used
direct headspace sampling, entrapment of headspace gas on Porapak
Q adsorbent and steam distillation-extraction (SDE) of volatiles of
cantaloupe. Direct headspace sampling resulted in low boiling
volatiles while Porapak Q trapping was less efficient at trapping
ethylene, methyl acetate, ethyl acetate and ethanol. SDE resulted
in extraction of high boiling compounds. Of the three methods
Nunez et al. (1984) used in their grapefruit studies, SDE gave the
best results as compared to distillation-solvent extraction.
However, Bartley and Schwede (1987) found that the concentrations
of mango volatiles were markedly decreased when the volatiles were
isolated by SDE as compared to a headspace vapor concentration
procedure. The variation in the type and amounts of volatiles
obtained can be attributed to the fact that each isolation
procedure alters to some extent the overall aroma composition of
the product extracted. Honaken and Hirvi (1990) attributed this
fact to formation of new compounds and artifacts during the

26
extraction procedure. Jennings and Filsoof (1977), after studying
a number of preparation and extraction methods, concluded no single
sampling procedure is entirely satisfactory, but that one procedure
may be superior depending on the sample composition and the
compounds of interest.
2.6.1 Liquid-liquid and steam distillation procedures.
The liquid-liquid (solvent) method for extraction of volatiles
is the easiest among all extraction procedures and involves simply
mixing the liquid sample with a solvent to extract the volatiles.
Mixtures of different solvents such as diethyl ether, pentane and
dichloromethane have been found to be efficient in the extraction
of volatiles. Flath and Forrey (1970), using isopentane, extracted
45 volatiles from 'Smooth Cayenne' pineapple. Schreier et al.
(1980) used liquid-liquid extraction, adsorption chromatography on
silica gel and coupled gas chromatography-mass spectrometry (GC-MS)
to study the aroma compound composition of ten Burgundy Pinot noir
wines. Hirvi (1983) extracted volatiles from a number of
strawberry varieties by mixing the pressed juice with a mixture of
pentane-diethyl ether (1:2). Douillard and Guichard (1989)
identified and quantified 61 volatiles from fourteen frozen
strawberry varieties after direct extraction with dichloromethane.
Leahy and Reineccius (1984) reported that solvent extraction is
limited to the analysis of foods that contain little or no lipids.
They also noted that this method is labor intensive, and results in
poor extraction of low boiling compounds. Tressl et al. (1977)

27
extracted 100 aroma components from cooked white asparagus using a
liquid-liquid procedure. However, they required 18 L of sample and
24 hr to extract the volatiles.
Distillation extraction involves removal of volatiles by the
application of heat. Dix and Fritz (1987) found distillation
extraction to be a simple, fast and effective isolation procedure
with excellent recoveries of a number of organic compounds with
boiling points ranging from 77 to 238°C. Distillation under normal
atmospheric pressure usually involves high extraction temperatures
(Nunez, et al. , 1984; Ohta, et al. , 1987). This generally results
in formation of artifacts by thermal degradation or hydrolysis
(Leahy and Reineccius, 1984). Vacuum distillation is used to limit
the thermal degradation of volatiles and formation of artifacts.
Pino (1982) and Pino et al. (1986 a,b) used a vacuum rotary
evaporator to extract volatiles from orange and grapefruit juices
with diethyl ether being used to separate the volatiles from the
distillate vapor. Guichard and Souty (1988) extracted 82 compounds
from six cultivars of fresh apricots using vacuum distillation and
fractionation on a silica gel column. Takeoka et al. , (1986)
extracted volatiles from Kiwi fruit concentrate by vacuum
distillation, followed by continuous liquid-liquid extraction.
Variation of direct steam distillation led to simultaneous
steam distillation-extraction (SDE). Likens and Nickerson (1964)
designed the Likens-Nickerson apparatus for the simultaneous steam
distillation-extraction (SDE) of volatiles from liquid samples.
Hayase et al. (1984) extracted volatiles from mangoes using

28
simultaneous SDE. They identified 114 to 13 0 compounds which
included hexanal and fcraris-2-hexenal. Spencer et al. (1978)
extracted esters, monoterpernes and lactones from fresh and canned
peaches using SDE. The advantage of this extraction apparatus is
the concentration of dilute sample solution with small amounts of
solvent. The use of a vacuum minimizes artifact formation due to
use of low temperature. Ohta et al. (1987) extracted and
identified a high-boiling, unstable compound, 2,5-dimethyl-4-
hydroxy-2,3-dihydro-3-furanone from pineapple fruit using this
procedure.
2.6.2 Headspace analysis of volatiles.
Isolation of volatiles from the headspace vapor of food phase
as a means of extracting volatiles has become very common in recent
years (MacLeod and /Ames, 1986) . Direct headspace analysis of food
volatiles in the vapor phase is one of the simplest procedures in
analyzing equilibrium headspace vapor (Jennings and Filsoof, 1977).
This method also gives more meaningful results than solvent or
distillation procedures because of minimal introduction of
artifacts (Bartely and Schwede, 1987) . Leahy and Reineccius (1984)
reported that headspace methods are simple and rapid, and more
importantly, measure the odorous compounds in the proportions
typically presented to the human nose.
Improvements to direct headspace volatile analysis have
included the concentration of volatiles on solid adsorbents by
purging the headspace vapor. The solid adsorption headspace

29
procedure involves purging a gas, generally nitrogen, over the
headspace of the sample and through an outlet coupled to a tube
packed with an adsorbent. The common solid adsorbents that have
been used include Tenax GC (Bartley and Schwede, 1989), Porapaks
(Jennings et al. , 1972; Tassan and Russel, 1974; Yabumoto and
Jennings, 1977) and Chromosorbs (Chairote et al., 1981) which are
all synthetic porous polymers. Activated charcoal has also been
used as a volatile adsorbent (Dart and Nursten, 1984). The choice
of the adsorbent depends on the properties and concentration of
compounds and their purity. Schaefer (1981) evaluated five
adsorbents during the study of carrot volatiles. Although Porapak
Q and Ambersorb were found to be the best adsorbents, Porapak Q
produced a number of blank peaks while large volumes of solvent
were required to desorb the volatiles from Ambersorb. Tenax GC was
found to have a low trapping efficiency while activated carbon was
unable to trap some aldehydes. MacLeod and Ames (1986) compared
Tenax GC and Tenax TA and obtained superior blank gas chromatograms
from Tenax TA. Tenax GC was highly stable at a very high
temperature, had relatively low background levels and was capable
of extracting high-boiling compounds. Headspace vapor analysis
with adsorbents has been used to adsorb volatiles from beverages
(Jennings et al. 1972), onions (Mazza et al. , 1980), sourdough
(Hansen and Lund, 1987), oysters (Josephson et al. 1985) and
tomatoes (Buttery et al. 1988). Desorption of volatiles from the
trap either involves thermal desorption (Tassan and Russel, 1974;
MacLeod and Ames, 1986; Bartley and Schwede, 1989) or solvent

30
extraction (Hansen and Lund, 1987; Buttery et al. 1988). The
headspace analysis procedures are best suited for the most
volatile, low boiling compounds.
2.7 Relationship between sensory and volatile compound data.
Sensory quality of food is an important aspect in the success
of a 'new' storage technique. Sensory panel evaluation of food
products has become a standard quality assurance practice. To
measure sensory quality, a set of sensory quality criteria that
describes the largest, most relevant and most reliable variations
for a given product is required (Piggot, 1986). Therefore, it is
important that descriptors be examined first to determine whether
they are truly critical to the evaluation of the product. Because
of the many quality variables that can be used, statistical
approaches can be utilized to evaluate sensory descriptors,
performance of judges and product under study (Kwan and Kowalski,
1980) .
Sensory evaluation by itself, however, is inadequate to
describe all the quality changes in food products. Thus, sensory
evaluation has been used in conjunction with instrumental analysis
to offer a better explanation of quality changes in food products
(Liardon et al. 1984). The presence of trace amounts of volatiles
are responsible for the odor that gives much of a product character
(Yahia et al., 1990). More than 150 compounds were identified in
strawberry fruit (McFadden et al., 1965). Therefore, correlation
of sensory data with instrumental analysis of volatile compounds to

31
assess the aroma quality of fruit is important. Min (1981)
obtained good correlations between sensory evaluation and GC data
of edible oil subjected to various levels of oxidation. Pino
(1982) and Pino et al. (1986a,b) applied linear regression to
sensory and volatile compound data for orange and grapefruit
juices. Such compounds as myrcene, 2-hexanol, linalool in orange
juice and methyl butanoate, ethyl butanoate, limonene, nootkatone
in grapefruit juice were found to contribute significantly to juice
aroma. Spencer et al. (1978) applied stepwise multiple regression
to determine the relationship of sensory and volatile data from
fresh and canned peaches.
Description of odor of gas chromatographic eluates can provide
valuable information as well (Tassan and Russel, 1974). Chairote
et al. (1981) trapped apricot headspace volatiles on chromosorb
adsorbent and subjected the traps to a sniff test. Their results
indicated that the aroma of apricot was due to the presence of
compounds such as benzaldehyde, linalool, 4-terpineol and 2-
phenylethanol which are responsible for the floral and fruity notes
of the aroma. Hayase et al. (1984) characterized the changes in
odors of tomato fruit during ripening by using the GC-sniff method.
They found that hexenal, trans-2-hexenal, 2-iso-butylthioazole, 2-
methyl-2-hepten-6-one, geranylacetone and farnesylacetine increased
with natural and artificial ripening. It is thus possible to
obtain valuable information concerning the character and the
strength of odorous components (Honkanen and Hirvi, 1990). Hall
and Anderson (1985) reported that the importance of any volatile

32
compound to food odor and flavor is generally determined by
relating the actual concentration of the compound to an odor or
flavor threshold value. They used multiple regression analysis to
obtain predictive equations, some of which had high correlations
with flavor descriptors.
Although strawberry fruit has been described as having no
'character impact compound', some of the compounds identified in
the berries have been correlated with sensory data. Honkanen and
Hirvi (1990) reported that correlations have been obtained between
the sensory character of odor of fresh strawberries with
concentrations of volatile compounds such as ethyl butanoate, ethyl
hexanoate, trans-hexen-2-enal, 2 , 5-dimethyl-4-methoxy-2ff-furan-3 -
one and linalool. Guichard and Souty (1988) compared the relative
quantities of aroma compounds in six cultivars of fresh apricots.
They found that 'Moniqui' had a flowery aroma due to the presence
of terpenic ketones. However, 'Polonais', which contained many C6-
compounds, had herbaceous notes.
2.8 Multivariate analysis of sensory and flavor/aroma data.
Because large amounts of data are collected during volatile
compound analysis, appropriate methods for data handling and
analysis are required. McFadden et al. (1965) isolated 150 volatile
compounds from strawberry fruit; however no statistical analysis
was carried out. Multivariate statistical analysis (MVA) methods
are now being commonly used in food science studies especially
those related to flavor volatile analysis. Aishima (1979 a,b) and

33
Aishima et al. (1979) applied MVA to GC volatiles extracted from
soy sauce samples. The techniques used by those researchers
included multiple regression, principal component analysis (PCA)
and discriminant analysis. They concluded that: a) eight brands of
soy sauce could be discriminated and classified by use of those MVA
techniques; b) the GC data could be related to sensory scores; and
c) large sets of data could be reduced in dimension. Schreier and
Reiner (1979) carried out discriminant analysis on GC data from
German and French brandies and French cognacs. Statistically
highly significant separations between the samples were obtained
and volatile esters were found to contribute to the separation and
classification of individual groups. Liardon and Ott (1984) and
Liardon et al. (1984) first applied stepwise discriminant analysis
(SDA) to select, from the bulk of coffee headspace components, the
most significant volatiles for discriminating the different
profiles. The subsets obtained were analyzed by canonical (CA) and
discriminant (DA) analysis. They found that 55 profiles could be
classified into 15 coffee categories with a 90% success rate. MVA
has also been applied in the characterization of white wine
(Cabezudo et al., 1985) and frozen peas (Martens, 1986).

34
3.0 MATERIALS AND METHODS.
3.1 Strawberry samples and preparation.
3.1.1 Strawberry samples.
'Chandler' strawberries, imported from California and purchased
from local wholesalers in Vancouver, British Columbia, were used in
these experiments. Soon after purchase, the strawberries were
selected on the basis of uniform red color, moderate size, touch-
firmness and lack of physical damage. The selected berries were
weighed into samples of 3 00 grams each.
3.1.2 Modified atmosphere packaging of strawberry samples.
Each 300 gram strawberry sample was packed into pouches made
from high barrier polyolefin plastic film (CL 804, Dupont Canada,
Windsor, ON). The gas transmission rates of the film were 0.31,
1.55 and 4.65 cm3/m2/24 hr/atm at 23°C for nitrogen, oxygen and
carbon dioxide, respectively (Dupont Canada, Windsor, ON) . The
moisture vapor transmission rate was 4.65 g/m2/24 hr at 95% RH at
23°C. Each pouch measured 2 0 cm by 2 0 cm with a surface area to
sample weight ratio of 1.33 cm2/g. Each pouch with 3 00 grams of
fruit sample was flushed with the intended gas or gas mixture and
quickly heat sealed. Samples for sensory evaluation and chemical
analysis were packaged in duplicate while samples for gas and
volatile compound analyses were packaged in triplicate. Unpackaged
strawberry samples (control) were placed in open flat cardboard
boxes which were wrapped with low barrier plastic film to prevent
excessive moisture loss and dehydration of fruit.

35
3.1.3 Gas treatment and storage of strawberry samples.
The gases used to flush the packaged fruit were carbon dioxide
(100% C02) , mixed gas (11% C02 + 11% 02 + 78% N2) and air (Linde
Specialty Gas Co., Vancouver, BC & Edmonton, AB) . All fruit
samples were stored at 1°C for up to 10 days. The whole experiment
was repeated five times during the study period (August 1989 -
preliminary; March 1990, April 1990, July 1990 - experimental data
collection; and October 1990 - data for comparison between
headspace volatile compounds desorbed by solvent and thermal
desorptions).
3.1.4 Sampling procedure and analyses of MAP strawberry samples.
Modified atmosphere packaged fruit for each gas treatment and
unpackaged fruit was removed from storage at days 3, 6 and 10, and
analyzed for desired parameters. The strawberries were also
analyzed at day 0 prior to storage. At each sampling time, the
strawberries from each treatment were subjected to sensory
evaluation, volatile compound determination and gas analysis.
Chemical analyses of ethanol, glucose and fructose as well as the
determination of soluble solids, pH, titratable acidity were
carried out.
3.2 Sensory evaluation.
Quantitative descriptive analysis (Stone et al. , 1974) was used
to evaluate sensory attributes of strawberry fruit stored under
modified atmosphere (MA) conditions. This procedure involved

36
extensive training of judges, as well as the judges establishing
descriptive terms to characterize the product under investigation
and also being able to quantitatively estimate the intensity of
each attribute (Kwan and Kowalski, 1980; McTigue et al., 1989).
3.2.1 Training of judges.
Nine judges, aged between 25-40 years (5 females and 4 males),
with sensory evaluation experience were trained in descriptive
evaluation of strawberry fruit. All judges were associated with
the Food Science Department (UBC) and were selected on the basis of
interest and availability. Due to the small number of judges, all
were retained through the study with continued training. The
strawberries used during the training sessions had been subjected
to various treatments such as storage at 0, 5, 10 and 2 0°C with and
without packaging in different gas mixtures and different film
pouches for 2 to 5 days. A two-week training period involving four
sessions was used to familiarize the judges with characteristics of
strawberries and to establish terms to describe the quality
attributes of strawberry fruit stored under different gas
conditions (MAP) at 1°C. Further, standardization of the judges on
the varying intensities of sensory (flavor) characteristics was
essential. During the training sessions, a number of descriptors
from the literature (Noble and Shannon, 1987) and suggestions from
the judges were used. The terms retained were those that the
majority of judges agreed upon as the ones that would discriminate
and differentiate the fruit (Table 1). A sensory score sheet with

37
Table 1. Sensory attributes used to describe characteristics of strawberry fruit stored under modified atmosphere packaging.
Sensory attribute Definition
Odor by mouth 1. Strawberry odor
2. 3.
4.
5.
Off-odor Fermented odor
Musty odor
Earthy odor
Taste 6. 7. 8.
Sweet Sour Bitter
Typical strawberry odor with fruity, estery aroma Undesirable odor indicating spoilage Odor characterized by alcoholic and fermented product Odor associated with moldy, musty character Odor associated with earth or soil
Natural sweetness Natural sourness Natural bitterness
Others 9. Texture 10. Overall fruit quality
Firmness of fruit Acceptance of fruit taking into consideration of all the above attributes

38
10 cm unstructured scale lines, each with anchored terms at both
ends such as 'none' and 'very strong', 'not unacceptable' and
'very acceptable' was used (Table 2). The judges indicated the
intensity of each attribute by placing a vertical line on the
unstructured line. Numerical data were obtained by measuring the
distance from the left side (zero) to the vertical line made on the
scale.
3.2.2 Sample preparation for sensory evaluation.
At each sampling time, the strawberries from each treatment
were removed from storage 1 1/2 hr prior to sensory evaluation to
equilibrate to room temperature. The strawberries from each
treatment were sliced into small pieces (1/8), mixed for
homogeneity and subjected to sensory evaluation in replicate. The
room was air-conditioned and illuminated with a red light. The
coded samples (3 digit) were presented one at a time in a random
order to the judges who sat in a round table set-up and made
independent evaluations. The judges obtained their servings for
each treatment from one main plate and there was a 3-5 min interval
between each serving. Water and unsalted crackers were provided to
the judges and used between each each serving. After the first set
of replicate samples were evaluated, a short break (5 min) was
taken at which time a discussion was initiated to ensure all judges
were in agreement in their evaluation of sensory attributes, and as
a means of continuous training. Replicate samples were evaluated
at each session. At the end of each evaluation session, the judges

39
Table 3. Sensory score sheet used to quantitaively evaluate strawberry fruit
SENSORY SCORE SHEET
NAME DATE . .SAMPLE.
Please evaluate the flavor/odor by mouth of these samples of strawberry. Make a vertical line on each horizontal line to indicate the intensity of each attribute.
none Strawberry odor +
very strong +
Off-odor none +
very strong +
Fermented (alcoholic)
Musty (Old/stale)
none +
none +
very strong +
very strong +
Earthy/soil none +
very strong +
Texture not firm
+ very firm
+
Sweet none +
very sweet +
Sour none +
very sour +
Bitterness none +
very bitter +
not acceptable Overall quality + (acceptance)
very acceptable +
Comments:

40
were formally asked if they thought any of the samples were totally
unacceptable and such samples were eliminated in the next
evaluation session.
3.3 Chemical analyses.
For the measurement of soluble solids, pH, titratable acidity,
glucose, fructose and ethanol, 50 to 100 gram samples were used.
Each strawberry sample was weighed, blended at a high speed at room
temperature in a Waring blender for 3 min without the addition of
water, followed by centrifugation at 10,000xg for 10 min at 1°C.
The supernatant was filtered through a Whatman No. 4 filter paper
and the filtrate was used for analysis. Soluble solids content of
a sample was measured by placing a few drops of the filtrate on the
prism surface of an Abbe Mark II Refractometer (Cambridge
Instrument, Buffalo, NY) at 2 0°C. The pH of the strawberry
filtrate was measured by a Fisher Accumet pH meter Model 62 0
(Fisher Scientific Co., Ottawa, ON). Titratable acidity was
assessed by titrating the diluted filtrate (1:10) with 0.IN NaOH to
pH 8.1 and was calculated as citric acid (g/lOOg sample). Glucose,
fructose and ethanol were analyzed using enzymatic assay kits
(Boehringer Mannheim, Laval, PQ). All measurements were carried
out in duplicate.
In the ethanol analysis, ethanol is oxidized to acetaldehyde in
the presence of the enzyme alcohol dehydrogenase (ADH) by
nicotinamide-adenine dinucleotide (NAD).
Ethanol + NAD+ < > Acetaldehyde + NADH + H+ (1)

41
Under alkaline conditions, the trapped acetaldehyde is oxidized in
the presence of aldehyde dehydrogenase (Al-DH) to acetic acid. The
NADH formed is then determined by means of absorbance at 340 nm.
Acetaldehyde + NAD+ + H20 > Acetic acid + NADH + H+ (2)
In glucose and fructose determinations, D-glucose and D-
fructose are phosphorylated by the enzyme hexokinase (HK) and
adenosine-5'-triphosphate (ATP) to glucose-6-phosphate (G-6-P) and
fructose-6-phosphate (F-6-P) with the simultaneous formation of
adenosine-5'-diphosphate (ADP).
D-glucose + ATP > G-6-P + ADP (3)
D-fructose + ATP > F-6-P + ADP (4)
In the presence glucose-6-phosphate dehydrogenase (G6P-DH), G-6-P
is oxidized by nicotinamide-adenine dinucleotide phosphate (NADP)
to gluconate-6-phosphate with the formation of reduced
nicotinamide-adenine dinucleotide phosphate (NADPH).
G-6-P + NADP+ > Gluconate-6-phosphate + NADPH + H+ (5)
At the end of this reaction, F-6-P is then converted to G-6-P by
added phosphoglucose isomerase (PGI) to form G-6-P. The G-6-P
subsequently reacts with NADP forming gluconate-6-phosphate and
NADPH. In each case, the NADPH formed is stoichiometric with the
amount of glucose and fructose. The amount of NADPH was determined
from the absorption values at 340 nm (Boehringer Mannheim manual,
1989) .

42
3.4 Extraction and analysis of volatiles from strawberries.
3.4.1 Solvent extraction of volatile compounds.
One hundred grams of each strawberry fruit sample were blended
with 100 mL of deionized water in a Waring blender for 3 min at
room temperature and the slurry was extracted twice, each time with
100 mL of distilled dichloromethane or a mixture of diethyl ether
and pentane (2:1) after vigorous shaking and standing for 2 hours
at room temperature (Douillard and Guichard, 1990) . All high grade
solvents were obtained from BDH Chemicals, Toronto, ON. The
solvent extracts were dried over anhydrous Na2S04 (BDH Chemicals,
Toronto, ON), and then were concentrated by holding the flask in a
water bath maintained at 40°C. Finally the extract was
concentrated further to approximately 200 (XL by a gentle stream of
N2 over the surface. The concentrated extracts (1 (XL) were
injected into the GC for isolation and analysis.
3.4.2 Distillation extraction of volatile compounds.
Direct and vacuum steam/distillation were also used to extract
volatile compounds from strawberry fruit (Schreier, 1980) . A 100-
gram sample of fruit was blended with 100 mL of deionized water in
a blender as described in section 3.4.1. The blended mixture was
subjected to distillation without and with a vacuum at 650 Pa using
a Buchi Rotavapor apparatus unit (Glasapparatefabrik, Flawil,
Switzerland) or to a modified Likens-Nickerson apparatus for
simultaneous steam distillation extraction (Aishima, 1983). With
distillation extraction in the Rotavapor apparatus, the temperature

43
was maintained at 80-90°C without vacuum and 45-50°C with vacuum
using a Buchler Thermolift (Buchler Instruments, Inc., Fort Lee,
NJ) water bath. When the Likens-Nickerson apparatus was used, the
blended fruit in flasks were heated to a temperature of 40-50°C
with the aid of a heating jacket. The volatile compounds were
collected by condensing them on traps cooled to -1°C with water
containing anti-freeze. The extraction was carried out for 2 hr
and the condensed volatile compounds were separated by liquid-
liquid or solvent extraction using dichloromethane or a mixture of
diethyl ether and pentane (2:1) at room temperature. The extracts
obtained were concentrated to approximately 200 |LlL as described in
section 3.4.1 and analyzed by GC.
3.4.3 Headspace volatile extraction procedures.
Strawberries taken from storage were extracted by a dynamic
headspace technique and analyzed by gas chromatography (GC), and
the volatile compounds identified with gas chromatography-mass
spectrometry (GC-MS).
3.4.3.1 Headspace volatile extraction with solvent desorption from
Tenax GC.
Strawberry samples were enclosed in flasks and the volatile
compounds extracted by purging the headspace gas with N2 and
trapping the volatile compounds onto a porous polymer - Tenax GC
(Dirinck et al. , 1977; Hirvi and Honkanen, 1982; Olafsdottir et
al. , 1985) . Three hundred grams of a strawberry sample from each

44
treatment were sliced into quarters and placed into 2 L three-neck
round bottomed flasks held at 40°C (Figure 2). An inlet tubing
delivered high grade prepurified UHP (ultra-high purity) N2 (Linde
Specialty Gas Co., Vancouver, BC) flowing at 30 mL/min. Gas from
the flask flowed through outlet glass tubing and passed through an
adsorbent trap containing Tenax GC (p-2,6-diphenyl-p-phenylene
oxide; 60-80 mesh, Alltech Co., Deerfield, IL). Approximately 120
mg of Tenax GC was packed into each glass tubing and secured at
both ends with deactivated glass wool. The glass wool and the
glass tubings were deactivated with SYLON™-CT (5% dimethyl-
dichlorosilane) (Sulpelco Inc., Toronto, ON) prior to use. The
glass tubings measured 11.5 cm in length, 6 mm outer diameter and
4 mm internal diameter. The Tenax GC adsorbent was conditioned
before use with N2 which passed through the traps at 2 0 0°C for 4 or
more hr at a flow rate of 30 mL/min (Jennings and Filsoof, 1977) .
During volatile compound extraction, the flasks containing the
fruit slices were held in a water bath at 40°C for 3 0 min and then
purged with prepurified N2 at 3 0 mL/min for 2 hr. The volatile
compounds trapped onto the Tenax GC were eluted with 2 mL of double
distilled diethyl ether (BDH Chemicals, Toronto, ON). The ether
extract was concentrated by a gentle stream of N2 on the surface to
approximately 200 (J.L and 1 |LlL was injected into the GC and GC-MS
for separation and identification of the volatile compounds. To
quantify the compounds, 2-nonanone (PolyScience Corp., Niles, IL)
was added to the flasks as the internal standard before purging the
volatile compounds. This internal standard was dissolved in

45
Tenax GC
Nitrogen inlet
i—. _Glass stopper
Strawberries
Water bath
Figure 2. Set-up for the apparatus used to collect the headspace volatiles by trapping on the adsorbent Tenax GC.

46
diethyl ether in the ratio of 1:10 and 0.5 mL was added to the
flask. Quantitation was performed by taking the ratio of each peak
to that of the internal standard as relative amounts of volatile
compounds.
3.4.3.1.1 GC analysis of volatile compounds desorbed by solvent.
Volatile compounds desorbed by solvent from the Tenax GC
adsorbent were separated and analyzed on a Varian 3700 GC (Varian
Associates, Inc., Palo Alto, CA) equipped with a flame ionization
detector (FID) and connected to a fused SPB-1 non-polar capillary
column (30 m, 0.20 mm i.d., 0.25 (im film thickness - Supelco Inc.,
Toronto, ON) . The temperature was held at 3 0°C for 5 min and then
programmed to 2 00°C at 5°C/min. Injector port and detector
temperatures were set at 250°C, and the flow rates for hydrogen and
air were 30 and 300 mL/min, respectively. Helium carrier gas flow
was set at 3 0 mL/min and into the column at 1 mL/min. The split
ratio was 100:1. Peak areas were integrated and recorded on a
Hewlet-Packard 3390A integrator (Hewlet-Packard, Avondale, PA).
3.4.3.2 Headspace volatile extraction with thermal desorption from
Tenax GC.
Volatile compounds were extracted from strawberries and trapped
in a similar manner as described in section 3.4.3.1. This was
followed by thermal desorption-gas chromatography/mass spectrometry
analysis - TDGC/MS (Hirvi and Honkanen, 1982). The trapped
volatiles from each strawberry sample were thermally desorbed from

47
the Tenax GC with a Dynatherm Thermal Desorption Unit (TDU) Model
850 (Hewlet-Packard, Avondale, PA) . The TDU was operated at a
desorption temperature of 2 5 0°C for 5 min. The TDU valve
compartment was held at 150°C with the heated transfer line at
165°C.
The TDU was coupled to a Hewlett-Packard 5988A GC/MS (Hewlet-
Packard, Avondale, PA). The desorbed volatile compounds were cryo-
focused at 10°C using liquid carbon dioxide. The GC/MS was
connected to a non-polar, thick, capillary column (60 m, 0.32 mm
i.d., 1.0 |Llm film thickness) phase bonded with 5% diphenyl:94%
dimethyl:1% vinyl polysiloxane phases (SPB-5, Sulpelco, Inc.,
Toronto, ON). The analytical column was held at 10°C for 5 min,
ramped to 160°C at 5°C/min, then programmed at 8°C/min to a final
temperature of 250°C and held at this temperature for 4 min. The
column was directly interfaced to the mass spectrometer (MS) source
through a 250°C transfer line. The MS was operated with an ion
source temperature of 200°C, ionization voltage of 70 eV and
electron multiplier at 2200 V. The data were stored on a hard disk
and held for processing.
3.4.4 Volatile compound extraction from model system.
Available known volatile compounds were added to diethyl ether
for model studies. These standard compounds were obtained from
Aldrich Co., Milwaukee, WI and PolyScience Corp., Niles, IL. Each
standard was added to diethyl ether in the ratio of 1:10 and
directly injected into the GC to determine the retention times, the

48
response of the volatile compounds and performance of the GC with
repeated injection. The standards were also extracted using the
headspace extraction procedure described above as a measure of
recovery of volatile compounds after extraction.
3.4.5 Identification of volatile compounds by GC/MS.
At UBC, GC-MS analyses were performed with a Hewlett-Packard
5985 mass spectrometer (Hewlet-Packard, Avondale, PA) directly
coupled to a gas chromatograph using the same column and injection
conditions with same temperature programme conditions described in
section 3.4.3.1.1. Electron impact mass spectra were recorded at
70 eV (ion source energy), and the ion source and interface
temperature were set at 200°C and 285°C, respectively. At BC
Research, a Hewlett-Packard 5988A GC/MS (Hewlet-Packard, Avondale,
PA) was used to acquire mass spectras. The column conditions for
the GC are described in section 3.4.3.2.
Available standard volatile compounds were analyzed on the same
GC/MS systems. The mass spectral patterns of the volatile
compounds were first matched with the standard spectra from the
National Bureau of Standards (NBS) Library on the Data System.
Confirmation of volatile compounds was made by using retention time
data and the spectral data from analysis of available authentic
volatile compounds.
3.5 Gas monitoring in packages with strawberry fruit
The gas composition of the atmosphere within each pouch was

49
monitored during the storage period. C02 and 02 were analyzed by
sampling 0.5 mL of headspace gas using a 1 mL gas-tight syringe
fitted with a stainless steel needle and injecting the gas into the
Shimadzu Gas chromatograph 14A (Shimadzu Scientific Instruments,
Inc., Kyoto, Japan) equipped with a thermal conductivity detector
(TCD) . Sampling of gases from the pouches was made through a clear
GE Silicone seal (GE Canada, Mississauga, ON) adhered to each pouch
by 3M Scotch™ magic tape. The GC was fitted with dual stainless
steel columns (1.8 m and 3.2 mm i.d.) packed with Porapak N (80-
100 mesh, Sulpelco Inc., Toronto, ON) for separating C02 and
Molecular Sieve 5A (60-80 mesh, Sulpelco Inc., Toronto, ON) for 02.
The flow rate for helium, the carrier gas, was 3 0 mL/min. Oven
temperature was set at 80°C and injector port and detector
temperatures were 150°C. A standard gas (Linde Specialty Gas, Co.,
Edmonton, AB) containing 14.0% C02, 4.49% 02, 0.50% C2H2, and the
balance being N2 was used to standardize the GC prior to gas sample
analysis. Peak areas for the gases were integrated and directly
converted to percentage gas by a Shimadzu CR501 Chromatopac
integrator (Shimadzu Scientific Instruments, Inc., Kyoto, Japan).
For each treatment, triplicate injections were made at each
sampling time. Gas sampling commenced 1-2 hr after packaging and
placing in storage and thereafter was measured at each sampling
time. Air contains 0.93% argon (Ar) (Weast, 1984). Since 02 and
Ar coeluted in the column system employed for in-package gas
analysis, the Ar content was subtracted from the 02 content.

50
3.7 Statistical analyses.
3.7.1 Analysis of variance and correlations.
The sensory data obtained were subjected to analysis of
variance (ANOVA) using General Linear Models (GLM) and means were
separated by least significant difference (LSD) (Greig and
Bjerring, 1980; SAS, 1985). The experimental design for sensory
measurements was a randomized incomplete block design over time and
in repeated measurement (Gomez and Gomez, 1984; Nakhasi et al. ,
1991). The main effects used in the analysis of sensory data in
the three-way ANOVA were gas treatments (carbon dioxide, mixed gas,
air, as well as unpackaged), storage times (0, 3, 6 and 10 days)
and judges (block). Sensory data collected during the
experimentation were combined (March, April and July). Fisher's
(protected) least significance differences (lsd) were computed for
the treatments and storage times to determine the significant
difference among these effects (SAS, 1985). Simple correlation
coefficients were computed for all sensory variables with chemical
parameters and with gas chromatographic data (SAS, 1985) .
3.7.2 Multivariate statistical analysis.
Multivariate analysis using principal component, multiple
regression and discriminant analysis were applied to the collected
sensory and volatile data (BMDP, 1985; SAS 1985; SYSTAT/SYGRAPH,
1989). These techniques were applied to reduce the dimension of
data and to identify subsets of variables of sensory attributes and
volatile compounds that would best explain the important changes in

51
the fruit stored under MAP conditions. Multivariate analysis of
variance (MANOVA) was used to examine all the sensory attributes at
once to reveal their influence on treatments over storage time, and
multiple discriminant analysis was used to classifying samples
based on gas chromatographic data into different treatment and/or
quality level (Noble et al. 1984; SAS, 1985).
Three types of multivariate analyses were performed by BMDP
(1985), SAS (1985) and SYSTAT/SYGRAPH (1989) computer packages.
(1) Principal component analysis (PCA)
Principal component analysis is a statistical technique that
involves transformation of the original set of p variables (Xa/ X2,
. . . , Xp) obtained from n observations into smaller sets of linear
combinations that account for most of the variance of the original
set of variables (Dillon and Goldstein, 1984) . Principal
components (PCk) are calculated from equation 6.
PCk = auX! + a12X2 + a13X3 + ... + akiXk (6)
where aki represents the eigen vector with the sum of squares being
one. The variance in PCk is maximized among all principal
components with PCk and PCk+1 being uncorrelated (Aishima, 1979a) .
(2) Discriminant analysis
Multiple discriminant analysis (canonical variate analysis) was
also used to obtain a more detailed analysis of volatile compounds
and interpret the flavor changes in the fruit as well as
classifying the fruit into various treatments and/or quality
levels. The main objective of multiple discriminant analysis is to
classify a number of observations (n) into previously defined

52
groups (k) based on several measurements (Xx, X2, . . . , Xp) taken on
predictor variables (Dillon and Goldstein, 1984). Using the
independent variables, the technique derives linear combinations
which are used to calculate discriminant scores or functions which
aid in classification of individual observations. The discriminant
function is expressed as:
Zi = ailXl + ai2X2 + • • • + ^ipXp (V)
where Z{ is the discriminant score, aip is the discriminant weight
and Xp is the independent variable. The linear combination derived
(Zt) is calculated in such a way as to maximize the ratio of
between-group variation to within-group variation. The generalized
distance calculated from discriminant functions are called
Mahalanobis (D2) distance and canonical variables are calculated in
order to discriminate samples on the basis of two dimensional space
(Aishima, 1979b). The resultant canonical variables form a new co
ordinate system in which the samples can be plotted. Stepwise
discriminant analysis can also be used to select subsets of
independent variables that best discriminate among the samples.
(3) Multiple regression analysis
Regression analysis estimates or predicts the mean value of the
dependent variable Y on the basis of the known or fixed values of
one or more explanatory (independent) variables Xi (Dillon and
Goldstein, 1984) . A multiple regression model is generally
expressed as:
Y = B0 + BaXi + B2X2 + BiXi + . . . + BmXm + e (8)
where Y and Xi represent dependent and independent variables,

53
respectively. B0 and Bi represent a constant and partial regression
which are calculated by a linear least square method while e is the
error term. A correlation coefficient between Y and scores
estimated from calculated multiple regression model is called a
multiple correlation coefficient (R) . R2, called a multiple
determination coefficient, expresses the explained ratio of
variation in Y from the multiple regression model (Aishima, 1979b).

54
4.0 RESULTS AND DISCUSSION
4.1 Part 1. Sensory evaluation of strawberries stored under MAP.
The objectives of Part one of this study were to: a) use
quantitative descriptive analysis (QDA) to assess the changes in
sensory quality attributes of strawberries during storage under
modified atmosphere packaging (MAP) conditions at 1°C; b) study the
influence of MAP on some chemical changes (pH, soluble solids,
glucose and fructose, titratable acidity and ethanol), and relate
them to sensory quality changes, and c) apply multivariate
statistical analysis to relate fruit quality changes due to the
effects of MAP.
4.2 Sensory quality attributes of strawberries kept in storage.
4.2.1 General sensory evaluation.
The changes in sensory quality of strawberries packaged in
different gases or gas mixtures and stored at 1°C for 10 days were
determined by quantitative descriptive analysis (QDA). The sensory
descriptive terms were obtained during the training sessions. The
odor descriptors were strawberry odor, off-odors, fermented, musty
and earthy odors. The taste attributes included sweetness,
sourness and bitterness. Texture (firmness) of fruit was evaluated
by the chewing action of panelists. The judges evaluated the
overall quality of strawberries in terms of flavor acceptance
(scores rated on a 10 cm scale line) with consideration of all
attributes evaluated. A value of less than 3 for overall quality
for the strawberries evaluated was considered unacceptable and

55
rejected. A value of 3 was the average rating for samples the
judges indicated were unacceptable or were not to be included in
the next sensory evaluation session.
4.2.2 Reliability of judges in sensory evaluation.
Sensory score results for strawberries evaluated at day zero
were subjected to statistical analysis to assess the performance of
judges with repeated evaluation of the same samples (replication).
Combined data from the three experimental periods (March, April and
July) for all the sensory attributes from each of the nine judges
was used. A two-way analysis of variance in a randomized complete
block design with judges (block) and replication as the main
effects was carried out on the sensory attributes. There were no
significant differences among replications and also no differences
from the judges by replication interaction (Table 3) . This
indicates that the judges were consistent and repeatable in their
evaluation of replicated samples. However, judges were found to be
the major source of variation for seven of the sensory attributes.
The seven attributes were strawberry odor, off-odor, earthy odor,
texture, sweetness, sourness and overall fruit quality, with the
terms fermented odor, musty odor and bitterness found to be non
significant among the judges. Statistically significant results
among the judges may be due to inconsistent use of sensory terms.
Hall and Lingnert (1984) reported that the inconsistent use of
terms is a well known phenomenon in sensory analysis of foods and
should be taken into consideration. They also suggested that this

56
Table 3. Influence of judges and replications on evaluation of sensory attributes of strawberries evaluated on day 0 (data from nine judges).
Sensory attributes
Strawberry odor Off-odor Fermented odor Musty odor Earthy odor Texture Sweetness Sourness Bitterness Overall quality
Jz
5.76***y
2.35* 1.35 1.89 4.54*** 2.80*
11.23*** 3.56** 1.90 5.98***
F ratio
R
0.84 1.77 0.65 0.63 0.77 1.05 0.40 0.60 0.81 0.34
JXR
0.15 1.59 0.66 0.54 0.78 0.44 0.59 0.52 0.33 0.37
Mean square
erroi
4.41 1.19 0.35 0.72 1.51 0.43 4.22 6.48 0.18 5.26
ZJ=judges; R=replications; JR=judgeXreplication. y**^**^* significantly different at the 0.1, 1 and 5% level, respectively.

57
was an indication that the judges were not only using different
levels on the rating scale but also judged the magnitudes of the
differences between the samples to be different.
4.2.3 Examination of the performance of judges with PCA.
The combined results of nine judges for all the sensory
attributes of strawberry fruit evaluated at day 0 were subjected to
principal component analysis (PCA) to identify outliers and
inconsistent judges. The strawberry samples (replicates) evaluated
by each judge were treated as 'objects' and the ten sensory
attributes as 'features' (variables) which formed a 'data vector'
describing the object (Kwan and Kowalski, 1980) . From the
analysis, four principal components (PC) were obtained with
eigenvalues greater than 0.90 and these PC accounted for 79% of the
variance. From the plot of the first two PC's, most of the judges'
scores were clustered closely together indicating agreement in
their evaluation of the same sample, except for scores of judges C
and D (Figure 3). Therefore, sensory scores from these judges (C
and D) were eliminated from further analyses and all subsequent
analyzed data based on the results of the seven remaining judges.
4.2.4 Analysis of variance (univariate) for sensory data.
Data for the seven judges retained after PCA were analyzed by
three-way analysis of variance (ANOVA) in a randomized incomplete
block design (SAS, 1985; Steel and Torrie, 1980; O'Mahony, 1985;
Piggot, 1986;). The main factors used were the different

58
GO
CM
c CD C o Q. E o o
a. o i _
D_
0
-1 "
-2 -
-3 -
-5
I
B C
- C
C
C
l
I I I
EcE B H H D D -B E ^ BC c b F
B A^§R E A 0 E f l B
F F ^ ^ F fr _
A A F D
G P A E
C
B C D "
D
I I I D
-3 •1 0 1
Principal component 1 (31%)
Figure 3. Principal component plot of the scores of nine judges who evaluated strawberries at day 0 (letters represent each judge).

59
treatments, storage time and judges (as block). The analysis was
aimed at determining whether or not differences existed between the
different treatments with respect to each storage time and at
different storage times. The results of the ANOVA for sensory
attribute ratings across the treatments and storage time are
summarized in Table 4. Nearly all attributes were influenced by
the treatment and storage time. There were highly significant
differences among the treatments and between the various storage
times for all sensory attributes of strawberries stored under MAP
conditions except the attributes of earthy odor and sourness.
Although inconsistent judges were eliminated prior to analysis of
variance, the judges were still a highly significant source of
variation in all attributes studied except the term earthy odor.
Heymann and Noble (1987) eliminated inconsistent judges in their
study but they also failed to produce consistent results among the
remaining judges.
4.2.5 Multivariate analysis of variance of sensory attributes.
The individual analysis of variance (ANOVA) for each attribute
was followed with multivariate analysis of variance (MANOVA). In
ANOVA, the F test enables one to test for significant sample
differences over one attribute, while in MANOVA, the Bartlet or
approximate F test using Wilk's lambda (or other statistics),
enables the inspection of the data as a whole (Noble et al., 1984) .
Powers and Ware (1986) reported that MANOVA involves joint
examination of the measurement values to learn whether treatments

60
Table 4. Influence of gas treatment, storage time and judges on sensory attributes of strawberry fruit stored under modified atmosphere packaging for 10 days at 1°C (data from seven judges).
Sensory attributes
Strawberry odor Off-odor Fermented odor Musty odor Earthy odor Texture Sweetness Sourness Bitterness Overall quality
Treatment
29.06***2
72.14*** 27.66*** 52.15*** 1.05
20.17*** 6.76*** 0.73
15.48*** 61.24***
F ratio
Time
18.02*** 28.71*** 11.71*** 26.03*** 0.76
11.20*** 15.99*** 2.70 4.30***
38.17***
Judges
12.87*** 6.19*** 7.69*** 9.61*** 1.17
19.67*** 18.52*** 13.63*** 12.99*** 9.15***
Table 4 (cont.). Influence of gas treatment, storage time and judges on sensory attribute of strawberry fruit stored under modified atmosphere packaging for 10 days at 1°C (data from seven judges) .
Sensory attribute
Strawberry odor Off-odor Fermented odor Musty odor Earthy odor Texture Sweetness Sourness Bitterness Overall quality
Treat7 X Time
1.33 3.10*** 2.64* 9.61*** 0.62 2.05 1.21 0.81 2.04 3.60**
F ratio
Treat X Judges
1.28 1.84** 1.94*** 2.89* 0.76 0.84 1.52 3.88*** 1.36 0.81
Time X Judges
3.89** 4.87*** 2.19* 2.36*** 0.21 2.18* 3.38*** 4.75*** 0.96 3.09***
Treat X Time X Judges
0.56 0.98 0.93 3.39*** 0.70 0.60 0.55 0.68 1.15 0.84
Mean
square error
3.50 5.24 3.94 0.87
20.12 4.41 4.64 3.23 3.11 5.06
z***,**,* Significantly different at 0.1, 1 and 5% levels, respectively.
YTreat=gas treatment; Time=storage time (evaluation at days 0, 3, 6 and 10).

61
have affected significant differences in a product. Table 5 shows
the summary of the MANOVA for all the sensory attributes of MAP
strawberries. Analysis of the sensory attributes across the
treatments and all sampling times for the seven judges showed
highly significant differences among treatments, storage time,
judges and, their interactions. Piggot and Jardine (1979)
indicated that significance among samples results from large
dispersion among the different samples. They concluded that such
results from sensory data indicate agreement in the use of the
terms, and the attributes are effective overall as product
discriminators. Therefore, the judges were effective in
discriminating among the different treatments at the same storage
time and at different storage times.
4.2.6 Differences among treatments over storage time.
At each sensory evaluation session, the judges were presented
with stored unpackaged strawberry samples and stored strawberries
packaged in air, mixed gas or carbon dioxide. The intensity of
each attribute was evaluated on a 10 cm unstructured scale line.
The intensity scores of most sensory attributes changed during
storage of strawberries and among the different gas treatments.
Tables 6, 7 and 8 shows the calculated means of perceived
intensities for the different sensory attributes for each treatment
at each storage time.
During the 10-day storage period, the judges were able to
detect changes in the sensory attributes among the different

62
Table 5. Multivariate analysis of variance on all sensory attributes of strawberries stored for 10 days under modified atmosphere packaging conditions at 1°C (evaluation of samples at days 0, 3, 6 and 10).
Sources of variation
Approximate F ratio
Treatment Judges Storage time Treatment X Judges Treatment X Storage time Judges X Storage time
5.83**z
16.43** 2.98** 2.07** 1.54** 1.97**
z** Significantly different at the 1% level.
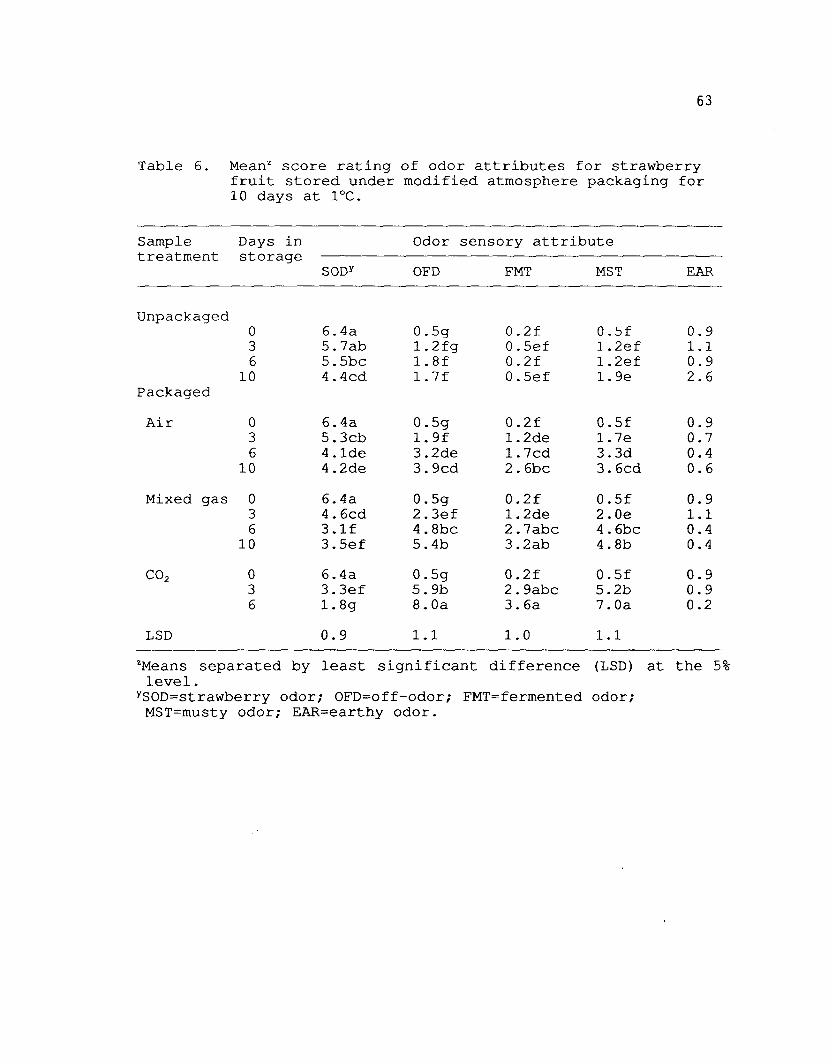
63
Table 6. Mean2 score rating of odor attributes for strawberry fruit stored under modified atmosphere packaging for 10 days at 1°C.
Sample treatment
Unpackaged
Packaged
Air
Mixed gas
C02
LSD
Days in storage
0 3 6
10
0 3 6
10
0 3 6
10
0 3 6
SODy
6.4a 5.7ab 5.5bc 4.4cd
6.4a 5.3cb 4.1de 4.2de
6.4a 4.6cd 3.If 3.5ef
6.4a 3.3ef 1.8g
0.9
Odor sens
OFD
0.5g 1.2fg 1.8f 1.7f
0.5g 1.9f 3.2de 3.9cd
0.5g 2.3ef 4.8bc 5.4b
0.5g 5.9b 8.0a
1.1
ory attribute
FMT
0.2f 0.5ef 0.2f 0.5ef
0.2f 1.2de 1.7cd 2. 6bc
0.2f 1.2de 2.7abc 3.2ab
0.2f 2.9abc 3. 6a
1.0
MST
0.5f 1.2ef 1.2ef 1.9e
0.5f 1.7e 3.3d 3. 6cd
0.5f 2.0e 4.6bc 4.8b
0.5f 5.2b 7.0a
1.1
EAR
0.9 1.1 0.9 2.6
0.9 0.7 0.4 0.6
0.9 1.1 0.4 0.4
0.9 0.9 0.2
*Means separated by least significant difference (LSD) at the 5% level.
ySOD=strawberry odor; OFD=off-odor; FMT=fermented odor; MST=musty odor; EAR=earthy odor.

64
Table 7. Mean2 score rating of taste attributes for strawberry fruit stored under modified atmosphere packaging for 10 days at 1°C.
Sample Days in treatment storage
Taste sensory attribute
Sweet Sour Bitter
Unpackaged
Packaged
Air
Mixed gas
CO,
0 3 6 10
0 3 6
10
0 3 6
10
0 3 6
5.4a 5.3ab 4.6abc 4.lbcd
5.4a 5. 3ab 4.3bcd 4.2bcd
5.4a 5.5a 3.2de 3.8cd
5.4a 3.7cde 2.7e
3.4 3.2 3.0 2.9
3.4 3.2 2.2 2.6
3.4 2.9 2.4 3.0
3.4 2.8 2.5
0.2e 0.8cde 0.4de 0.8cde
0.2e 0.8cde 0.4de 1.3bc
0.2e l.lcd 1.4bc 2.0b
0.2e 2.0b 3.0a
LSD 1.1 0.9
zMeans separated by least significant difference (LSD) at the 5% level.

Table 8. Mean2 score rating for texture and overall rating of strawberry fruit stored under modified atmosphere packaging for 10 days at 1°
Sample Days in storage
Texture Overall qualityy
Unpackaged
Packaged
Air
Mixed gas
C02
0 3 6
10
0 3 6
10
0 3 6
10
0 3 6
7.4a 6.7ab 5.6cdef 6.6abc
7.4a 6.Obcde 5.lefgh 5.4defg
7.4a 6.3bcd 5.0fgh 4.3hi
7.4a 4.4gh 3.4i
LSD 1.0
7.5a 6.4b 6.2bc 5 .2c
7.5a 5.7bc 4.0d 3.5d
7, 5. 3. 1.
5a 6bc Ode 9f
7.5a 2.2ef 0.6g
1.1
zMeans separated by least significant difference (LSD) at the 5% level.
yOverall quality in terms of overall flavor acceptance (score of less than 3 indicates unacceptable sample).

66
treatments and at different storage times. Strawberries from
different gas treatments subsequently received lower scores in
desirable attributes of strawberry odor, sweetness and texture
(lost their firm texture) but progressively received higher scores
of undesirable attributes of off-odor as well as fermented and
musty odors during the storage period. The high score ratings at
day 0 for strawberry odor, texture, sweetness and overall quality
of 6.4, 7.4, 5.4 and 7.5, respectively, dropped to 1.8, 3.4, 2.7
and 0.6, respectively, after 6-10 days of storage of MAP
strawberries among the different treatments. The low score rating
for off-odor, fermented and musty odors of MAP strawberries at day
0 of 0.5, 0.2 and 0.5 increased to 8.0, 3.6 and 7.0 after 6-10 days
among the different treatments, respectively. The differences in
rating of the strawberries can be attributed to both the treatments
and time in storage.
Figures 4a, b, c and d show quantitative descriptive polygons
illustrating the sensory attributes evaluated in the strawberry
fruit stored under MAP at 1°C. Each treatment was compared with
samples evaluated at day 0. The relative intensity for each
sensory attribute is depicted by the length of the line from the
center and represents the mean of each attribute. The least change
in sensory attribute rating among the different treatments during
storage was between the unpackaged strawberries (Figure 4a) .
Significant changes in the unpackaged strawberries were observed
after 10 days from the stand point of strawberry odor, off-odor and
overall fruit quality. Ratings of some of the different attributes

67
MST FMT
Figure 4a. Flavor profiles (quantitative descriptive polygons) of strawberries evaluated at day 0 (F) and unpackaged strawberries (U) stored for 10 days at 1°C (numbers stand for days in storage; SOD=strawberry odor; 0FD=off-odor; FMT=fermented odor; MST=musty odor; EAR=earthy; TEX=texture; SWT=sweet; SOU=sour; BIT=bitter; OVQ=overall quality).

MST FMT
68
SOU SWT
Figure 4b. Flavor profiles (quantitative descriptive polygons) of strawberries evaluated at day 0 (F), and strawberries packaged in air (A) and stored for 10 days at 1°C (numbers stand for days in storage; SOD=strawberry odor; 0FD=off-odor; FMT=fermented odor; MST=musty odor; EAR=earthy odor; TEX=texture; SWT=sweet; S0U=sour; BIT=bitter; OVQ=overall quality).

69
Figure 4c. Flavor profiles (quantitative descriptive polygons) of strawberries evaluated at day 0 (F), and strawberries packaged in mixed gas (M) and stored for 10 days at 1°C (numbers stand for days in storage; SOD=strawberry odor; 0FD=off-odor; FMT=fermented odor; MST=musty odor; EAR=earthy odor; TEX=texture; SWT=sweet; S0U=sour; BIT=bitter; OVQ=overall quality).

70
MST FMT
Figure 4d. Flavor profiles (quantitative descriptive polygons) of strawberries evaluated at day 0 (F), and strawberries packaged in carbon dioxide (C) and stored for 10 days at 1°C (numbers stand for days in storage; SOD=strawberry odor; 0FD=off-odor; FMT=fermented odor; MST=musty odor; EAR=earthy odor; TEX=texture; SWT=sweet; S0U=sour; BIT=bitter; OVQ=overall quality).

71
changed between day 0 to the end of the storage time (10 days) from
6.4 to 4.4 for strawberry odor, 0.5 to 1.7 for off-odor, and 7.5 to
5.2 for overall quality. Fruit packaged in air showed significant
deviations from day 0 samples in strawberry odor, off-odor,
fermented odor, musty odor, texture, sweetness and overall fruit
quality after 10 days in storage (Figure 4b) . Some of these
attributes showed rating changes from 6.4 to 4.2 for strawberry
odor, 0.5 to 3.9 for off-odor, 0.2 to 2.6 for fermented odor, 0.5
to 3.6 for musty odor, 7.4 to 5.4 for texture and 7.5 to 3.5 for
overall quality. Compared to MAP strawberries packaged in air, MAP
strawberries packaged in mixed gas (11% C02 + 11% 02) had
significantly lower ratings after 6 days in storage for strawberry
odor, texture, sweetness, overall quality and a high rating of
undesirable attributes of off-odor, fermented odor and musty odor
(Figure 4c). The ratings for strawberry odor, off-odor, fermented
odor, musty odor, texture and overall quality changed from 6.4 to
3.1, 0.5 to 4.8, 0.2 to 2.7, 0.5 to 4.6, 7.4 to 5.0 and 7.5 to 3.0,
respectively after 6 days in storage.
The changes in the ratings of attributes for strawberries kept
in air and mixed gas may be related to changes in 02 and C02 levels
in the packages. With an increase in storage time of MAP
strawberries, 02 decreased and C02 increased in the microatmosphere
surrounding the strawberries in the package systems (Table 9).
After 3 days of storage, 02 levels in the microatmospheres of MAP
strawberries were 9.8% and 2.2% while the C02 levels were 10.1% and
18.9% for input air and mixed gas, respectively, in package

72
Table 9. Changes in carbon dioxide and oxygen levels in MA packages containing strawberries flushed with air, mixed gas and carbon dioxide and stored for 10 days at 1°C.
Days stor,
0Z
3 6
10
in age
Air
C02
l.ly
10.1 19.4 22.3
02
20.1 9.8 4.1 3.8
Gas composition (%)
Mixed
C02
10.0 18.9 25.9 26.8
gas
02
10.2 2.2 2.0 2.0
Carbon
C02
95.9 97.3 92.9 95.2
dioxide
02
0.3 0.1 0.1 0.2
zGas measurements started two hours after MAP packaged strawberries were placed in storage at 1°C.
yGas sampling made from three separate packages.

73
systems. Bretch (1980), Kader (1980) and Kader et al. (1989)
reported that strawberries can tolerate 02 levels as low as 2% and
C02 levels as high as 2 0%. These levels were exceeded in MAP
samples treated with the mixed gas after 6 days of storage and air
treated MAP samples after 10 days of storage. Such levels of 02
and C02 could cause anaerobic respiration and development of
undesirable attributes (Carlin et al. 1990) . Off-flavors formed by
anaerobic reactions due to very low 02 (less than 1%) have been
noted in a number of fruits including bananas, apples, avocados and
strawberries (Brecht, 1980). Burton (1982) reported that
strawberries develop off-flavors in atmospheres containing 3% 02
while El-Kazzaz et al. (1983) detected off-flavors in strawberries
treated with air + 15% C02.
The changes in sensory attributes were more pronounced and
striking in fruit stored in packages initially flushed with carbon
dioxide (100% C02 treated samples). Within 3 days of storage,
fruit in the C02 flushed packages had a significantly low rating of
the desirable attributes of strawberry odor, texture, and sweetness
as well as high ratings for the undesirable attributes of off-odor
and musty odor (Figure 4d). There was also a very low rating for
the overall quality of the fruit. These changes may be as a result
of anaerobic respiration caused by the high carbon dioxide levels.
The carbon dioxide levels in the microatmospheres were greater than
90% throughout the 10-day storage period in the MAP packages of
strawberries treated with carbon dioxide (Table 9).
The sweetness rating of strawberries generally declined for all

74
treatments but significant changes and the lowest rating were
observed with strawberries stored in carbon dioxide (Table 7) .
Changes in the attributes of bitterness, sourness and earthy odor
of strawberries showed inconsistent changes.
4.2.7 Relationship between sensory attributes.
4.2.7.1 Correlation coefficients among sensory attributes.
Some of the sensory attributes used in this study are
associated with the high quality factors of strawberries while
others are associated with low quality factors of the fruit. To
study the relationship between sensory attributes, simple pairwise
correlations between all attributes were computed.
Correlations between the different sensory attributes of
strawberries are shown in Table 10. Strawberry odor, was highly
correlated to overall fruit quality (r=0.69) but negatively
correlated with the undesirable attributes of off-odor (r=-0.62),
fermented odor (r=-0.45) and musty odor (r=-0.57). All of the
undesirable attributes of strawberries were positively correlated
with each other but negatively correlated with overall fruit
quality. Texture, sweetness and overall fruit quality were
positively correlated with each other. The attributes of earthy
odor and sourness of the fruit showed non-significant correlations
with other attributes. Guinard and Cliff (1987) reported that in
descriptive analysis, a significant correlation between two terms
suggests that they may have been used to describe the same
attribute. This may have been true in cases where attributes were

Table 10. Simple correlation coefficients between sensory attributes of strawberry fruit stored under modified atmosphere packaging for 10 days (used all the data collected).
Sen. attr
SOD OFD FMT MST TEX SWT SOU BIT OVQ
Z
SODy
1.00 -0.62***x
-0.45*** -0.57*** 0.41*** 0.48***
-0.08 -0.24*** 0.69***
OFD
1.00 0.60*** 0.79***
-0.49*** -0.32*** 0.01 0.51***
-0.77***
Correlation coefficient
FMT
1.00 0.44***
-0.38*** -0.22*** 0.09 0.34***
-0.55***
MST
1.00 -0.53*** -0.42*** 0.01 0.43***
-0.69***
TEX
1.00 0.50***
-0.12* -0.28*** -0.53***
s
1 -0 -0 0
(r)
SWT
.00 ^ 27*** .21*** m47***
SOU
1.00 0.18** a.02
BIT
1.00 -0.40***
zSen. attr.=sensory attributes ySOD=strawberry odor; OFD=off-odor; FMT=fermented; MST=musty; TEX=texture; SWT=sweet; SOU=sour; BIT=bitter; OVQ=overall fruit quality,
x**^**^* significantly different at the 0.1, 1 and 5% levels, respectively,
en

76
used to describe related sensory attributes such as off-odor,
fermented odor and musty odor. The judges were trained, however,
to use the terms for the desired attributes, although some of the
attributes may have been describing related terms. Schutz and
Darmell (1974) suggested that significant relationships between
sensory characteristics could be due to the fact that the
characteristics covary in the sample, and are measuring the same
property and are measures of properties opposite of one another.
The negative correlation between strawberry odor, texture,
sweetness and overall fruit quality with off-odor, fermented and
musty odor during storage indicates that as the undesirable
attributes of strawberries developed with storage time under MAP,
the desirable attributes diminished in magnitude.
4.2.8 Multivariate statistical analysis of sensory data.
To measure the sensory quality of fruit held under MAP at 1°C,
a set of sensory attributes which described the largest, most
relevant and most reliable variations were used. Because of the
many variables involved, multivariate techniques are required for
the examination of the total sensory variation of the product under
study (Piggot, 1986) .
4.2.8.1 Principal component analysis of sensory data.
Principal component analysis (PCA) on the correlation matrix,
generated from the sensory ratings for each gas treatment at each
storage time, across all the attributes, was carried out. PCA was

77
performed to reduce the number of variables, and to illustrate the
relationships among all sensory attributes (variables) with regards
to different treatments as well as storage time.
The first two principal components (PC) obtained after PCA
accounted for 80% and 12% of the variance, respectively. These two
PC had eigenvalues greater than 1. In the scree test (Guinard and
Cliff, 1987; Heymann and Noble, 1987, 1989), the scree plot showed
a break at the second eigenvalue. Therefore, these two PC were
thought of as the most 'important' and thus interpretation of data
will be limited to these 2 PC. Principal component analysis
reduced the ten sensory attributes to two principal components.
In Figure 5, the factor loadings of the ten sensory attributes
from data collected during the storage periods are plotted on the
first two PC and the sensory attributes (variables) are plotted as
vectors. The sensory attributes of strawberry fruit stored under
modified atmosphere packaging at 1°C were mainly a contrast of the
desirable attributes (strawberry odor, firm texture and sweetness)
against the undesirable attributes (off-odor, fermented odor, musty
odor and bitterness) . The 180° orientation of the vectors of the
contrasting attributes indicates that they were inversely
correlated (Rogers et al. , 1986) . Overall quality of the fruit was
associated with the desirable attributes. The desirable and
undesirable attributes were highly correlated amongst each other as
demonstrated by the small angle between their vectors. Also, they
were highly correlated with the first PC as indicated by their
close alignment to this axis. All the attributes of importance had

78
1.0
CM
CM
c CD c o Q. E o o "co Q.
o
0.5
0.0 -
-0.5 -0.6 -0.4 -0.2 0.0 0.2 0.4 0.6
Principal component 1 (80%)
Figure 5. Principal component loadings of sensory attributes of strawberries evaluated from different treatments and different storage times (sensory attributes plotted as vectors; SOD=strawberry odor; 0FD=off-odor; FMT=fermented odor; MST=musty odor; EAR=earthy; TEX=texture; SWT=sweet; S0U=sour; BIT=bitter; OVQ=overall quality).

79
vectors of equal length, an indication that they were all important
in explaining the differences in the samples. The right angle
between sourness and earthy odor attributes with all other
attributes indicates there was no correlation and that these
attributes were associated more with the second PC.
In Figure 6, the scores of samples from the different
treatments and different storage times were plotted on the first
two PC. The samples, depending on quality due to treatment and
storage time, were separated along the first PC according to
desirable attributes found in high quality strawberries or
undesirable attributes that developed in storage under MAP
(anaerobic conditions) (Figures 5 and 6). The unpackaged
strawberries evaluated at day 0, and unpackaged samples that had
been held in storage for 3, 6 and 10 days, the MAP strawberries
with input air stored for 3 and 6 days, and the MAP strawberries
with input mixed gas (11% C02 + 11% 02) stored for 3 days were all
characterized by high ratings of desirable attributes. The
attributes associated with these samples included strawberry odor,
firm texture, sweetness as well as overall quality of the fruit.
All these samples were located on the righthand side of the plot
(Figure 6) and received high positive scores on PC 1. Examination
of sensory data (Table 6, 7, 8) shows that ratings of desirable
attributes in strawberries was high early in storage and in samples
not subjected to 100% C02 gas treatment (abusive treatment). At
the same time, the undesirable attributes received low scores. The
C02 levels were less than 19% and the 02 more than 2% in the

80
4 r
2 -
1 ~
0 -
-2 <= -10 -5 0
Principal component 1 (80%)
Figure 6. Principal component scores of samples from different treatments (unpackaged=U; air=A; mixed gas=M; carbon dioxide=C) evaluated at different storage times (numbers stand for days in storage).

81
packaged strawberries (Table 9). Although the unpackaged
strawberries were still associated with desirable attributes for up
to 10 days, many of the berries had fungal growth. Growth of
fungus on strawberries leading to decay is the major cause of loss
of strawberries during storage (El-Kazzaz, et al., 1983) .
The strawberries packaged in air and stored up to 10 days at
1°C, and the strawberries packaged in mixed gas (11% C02 + 11% 02)
and stored for 6 and 10 days, possessed undesirable attributes of
off-odors, fermented odor, musty odor and bitterness (Figure 5 and
6). These samples received lower scores on PC 1 and the intensity
scores of undesirable attributes were high while those of desirable
attributes were low (Table 6, 7, 8). The strawberries packaged in
carbon dioxide (100% C02) were found to be associated with the
undesirable attributes within three days of storage and received
lower values on PC 1. All these samples were located on the
lefthand side of the plot (Figure 6).
It is clear that strawberries packaged in 100% C02 quickly
developed undesirable sensory attributes that are common in
deteriorated, low quality fruit. Strawberries packaged in low C02
and high 02 levels were initially associated with attributes of
high quality but developed the undesirable attributes with
increasing storage time. Strawberries packaged in mixed gas (11%
C02 + 11% 02), quickly accumulated C02 and depleted 02 within the
package atmosphere and developed undesirable attributes earlier
than the strawberries packaged with air atmosphere. This may be
attributed to the rapid build-up of C02 and depletion of 02 in these

82
packages (Table 9). Regardless of the treatment, with extended
storage and high C02 levels greater than 2 0% and 02 levels less than
3%, all the fruit developed undesirable attributes. The
development of undesirable attributes with storage time under MAP
can be attributed to changes in the gas composition.
4.2.9 Changes in chemical parameters of strawberries.
Changes in chemical composition of strawberries stored under
MAP at 1°C are shown in Table 11. The pH of strawberries subjected
to various treatments sampled at different storage times varied
between 3.47 to 3.85. Although there were fluctuations in pH
measurements, there was no trend in pH changes among the
treatments. pH changes may be attributed in part to dissolved
carbon dioxide in the tissues as carbonic acid or from organic
acids produced under anaerobic respiration. Under our conditions
of study, the increase in organic acids may not have significantly
affected the pH changes due to the buffering capacity of the
tissues (Day et al., 1990).
Soluble solids varied between 6.3 and 8.4; however, the changes
were not consistent among the treatments (Table 11). Inconsistent
results for soluble solids contents in fruits stored under CA or
MAP have been reported by other researchers (El-Kazzaz et al. ,
19 83; Day et al. , 19 90) . This could be due to the dynamic
equilibrium of anabolism and catabolism of carbohydrates.
Titratable acidity, glucose and fructose measured for
strawberries from the different treatments at different storage

83
Table 11. Soluble solids, pH, titratable acidity, sugar and ethanol in strawberry fruit stored under modified atmosphere packaging at 1°C.
Sample treatment
Unpackaged
Air
Mixed gas
Days in storage
Carbon dioxide
0 3 6
10
0 3 6
10
0 3 6
10
0 3 6
Soluble solids (%)
7.9W
7.9 7.1 7.4
7.9 7.9 7.2 7.0
7.9 8.4 7.1 6.9
7.9 7.4 6.3
PH
3.70 3.60 3.47 3.54
3.70 3.63 3.57 3.61
3.70 3.85 3.76 3.59
3.70 3.75 3.64
TAZ
1.06 0.92 1.12 1.12
1.06 1.23 1.01 1.11
1.06 1.00 0.98 0.99
1.06 0.98 0.84
Glue*
3.75 3.74 3.57 3.75
3.75 4.13 3.60 3.44
3.75 4.42 3.79 3.48
3.75 4.05 3.24
Fruc"
4.10 4.00 3.91 3.93
4.10 4.53 3.95 3.72
4.10 4.95 4.11 3.76
4.10 4.33 3.45
Ethanol (g/100g)
0.20 0.20 0.20 0.20
0.20 0.25 1.24 2.32
0.20 1.17 1.85 2.73
0.20 1.03 1.07
zTA=titratable acidity (g/lOOg) yGluc=glucose (g/lOOg). xFruc=fructose (g/lOOg). "Duplicate measurements.

84
times did not show any consistent trend (Table 11) . This may be an
indication of the dynamic metabolic state of the strawberries in
storage under various conditions. Unpackaged strawberries did not
accumulate ethanol during the 10-day storage period. However,
there was accumulation of ethanol in gas-treated strawberries, with
the highest accumulation in fruit packaged in mixed gas (Table 11) .
Accumulation of ethanol in fruit treated with carbon dioxide did
not change much after 3 days in storage. In the absence of 02 or
in the presence of high C02 levels, anaerobic respiration takes
place with the resultant accumulation of ethanol and acetaldehyde
(Thomas, 1929; Li and Kader, 1989; Ke et al. 1991).
4.2.9.1 Relationship between sensory and chemical parameters.
Table 12 shows the simple pairwise relationship between sensory
attributes studied with chemical parameters of soluble solids,
glucose, fructose, pH, titratable acidity and ethanol. There were
no significant relationships between pH and titratable acidity with
any of the sensory attributes. Except for the significant
relationship between glucose and fructose with sweetness, all other
sensory attributes did not show a significant correlation with
these two chemical parameters. Strawberry odor, texture,
sweetness, sourness and overall fruit quality had a positive
relationship with soluble solids but negative with ethanol content.
The undesirable attributes of off-odor, fermented odor, musty odor
and bitterness had a negative relationship with soluble solids but
positive with ethanol content. Ethanol is known to accumulate

85
Table 12. Correlation coefficients between sensory attributes of strawberries and chemical parameters (used means).
Sensory Chemical parameter Attribute
SODz
OFD FMT MST EAR TEX SWT SOUR BIT OVQ
Soluble solids
0.77**y
-0.74** -0.68* -0.76** 0.16 0.78** 0.91*** 0.66*
-0.53 0.78**
Glucose
0.41 -0.41 -0.37 -0.43 -0.02 0.46 0.62* 0.50
-0.20 0.44
Fructose
0.42 -0.41 -0.37 -0.45 -0.11 0.46 0.66* 0.50
-0.23 0.46
PH
-0.15 -0.20 0.21 0.17
-0.40 -0.04 0.11 0.15 0.30
-0.13
Titratable acidity
0.51 -0.55 -0.47 -0.55 0.21 0.43 0.43 0.20
-0.46 0.48
Ethano
-0.66* 0.64* 0.77** 0.62*
-0.38 -0.72** -0.60* -0.51 0.72**
-0.72**
zSOD=strawberry odor; OFD=off-odor; FMT=fermented; MST=musty; EAR=earthy; TEX=texture; SWT=sweet; SOU=sour; BIT=bitter; OVQ=Overall fruit quality.
y***f**t* significantly different at 0.1, 1 and 5% level, respectively.

86
under high C02 levels and reduced 02 levels and has been attributed
to off-odor development. Li and Kader (1989) found that
atmospheres of 1% 02 + 15% C02 and 0.5% 02 + 2 0% C02 led to
accumulation of ethanol in strawberries. Ke et al. (1991) found
that off-flavors in strawberries correlated very well with ethanol,
ethyl acetate and acetaldehyde.
4.2.10 Changes in gas composition of fruit stored under MAP.
In general, there was a decline in 02 levels and an increase in
C02 levels in packages initially flushed with air and mixed gas
(Table 9). Similar changes in gas composition of produce packaged
in films were reported by Forney et al. (1989) and Nakhasi et al.
(1991) . Changes in the headspace gas composition could be
attributed primarily to the result of fruit respiration since the
film used was a high barrier type. Day et al. (1990) reported that
the low 02 permeability of high barrier packaging film restricts 02
diffusion into the packages from atmospheric air, so that oxygen
consumed in the aerobic respiration process cannot be replenished.
These changes in the gas compositions may have led to reduced
respiration rate. Forney et al. (1989) attributed this respiration
rate to lowering of 02 levels and simultaneous increase in C02
levels in the storage atmosphere. The accumulation of C02 was more
rapid in packages flushed with mixed gas than with air. The 02
concentrations decreased to lower levels in packages flushed with
mixed gas earlier than in packages flushed with air. The C02
levels in microatmosphere of packages of strawberries treated with

87
carbon dioxide remained at more than 90% throughout the entire
storage period.
4.2.11 Storage potential of strawberries kept under MAP.
In terms of overall fruit quality, unpackaged strawberries were
acceptable with a rating value of greater than 3 up to 10 days in
storage (Figure 7). With 6 days of storage, the unpackaged
strawberries started to develop surface fungal growth and by the
tenth day of storage, most of the berries were covered with
mycelium. Fruit in packages flushed with air prior to sealing was
of good quality for 10 days with a final overall quality rating of
3.5. Strawberries packaged in mixed gas received a rating of 3
after 6 days in storage but were unacceptable after 10 days with a
final rating of 1.9. Although strawberries packaged with air as
the initial microatmosphere and with mixed gas had a good fresh
tissue appearance with a green calyx and no fungal growth after 10
days of storage, they had developed undesirable odors (Table 6, 7,
8) . The absence of fungal growth in packaged fruit may be
attributed to the presence of high C02 and low 02 levels. Day et
al. (1990) found that yeast and mold populations in blueberries
packaged in high barrier film (0.232, 0.775 and 4.65 cm3/m2/24 h/atm
for N2, 02 and C02, respectively) were much lower compared to
blueberries packaged in intermediate barrier films (341, 1287 and
6512 cm3/m2/24 h/atm for N2, 02 and C02, respectively) . Yeasts and
molds are known to be sensitive to high carbon dioxide and low
oxygen levels (Follstad, 1966; Wells and Uota, 1970; Svircev et

0 3 6 Days in storage
10
- >
Carbon dioxide
Mixed gas
i Air
Unpackaged
Unacceptable
Figure 7. The overall quality rating of strawberries from different MAP treatments kept in storage for 10 days at 1°C.

89
al., 1984). Strawberries packaged in carbon dioxide were
unacceptable within 3 days of storage. It appears that air with an
initial 02 content of about 21% (with no C02) may be valuable as an
input gas for extending the storage life of MAP strawberries under
the conditions of the present study.
Of the three gas treatments, carbon dioxide treated
strawberries samples were the worst in terms of overall quality.
With air and mixed gas treated strawberries, the fruit quality was
maintained for a moderate storage period. The deterioration of the
packaged strawberries occurred earlier with mixed gas as the flush
as compared with the air flush. This occurrence may be related to
the rapid accumulation of C02 and depletion of 02 in the package
systems with the mixed gas flush (Table 9). Unpackaged samples
developed visible mold within six days of storage.
4.3 CONCLUSIONS
Quantitative descriptive analysis was used to study the sensory
quality changes of strawberries stored under modified atmosphere
conditions. Strawberries were stored at 1°C for 10 days under MAP
conditions in high barrier film pouches flushed with carbon dioxide
(100% C02), mixed gas (11% C02 + 11% 02 + 78% N2) , or air. Sensory
score differences between samples were statistically significant
for various treatments at different storage time. During the 10-
day storage period, sensory scores for desirable attributes
decreased in all gas-treated strawberries while the scores of
undesirable attributes increased. Air-treated samples had higher

90
overall quality ratings than the rating for the mixed gas- or
carbon dioxide-treated samples at each storage time. Although
unpackaged samples scored highest in overall quality at all storage
times, fungal growth became apparent after 6 days in storage at
1°C.
Principal component analysis (PCA) was used to examine the
changes in sensory quality of MAP strawberries during the storage
period for all gas treatments. The plot of the first two principal
components, which accounted for 92% of variance, indicated that the
changes in sensory quality of strawberries under MAP were mainly a
contrast of desirable against undesirable attributes. Fresh
strawberries at the beginning of the experimentation were
considered to have desirable attributes. As the storage time
progressed, undesirable attributes of the strawberries were noted
by the panel members. PCA was successful in separating out
strawberry samples on the basis of gas treatment and/or sensory
quality by using scores of several sensory attributes.
Changes in pH, soluble solids, titratable acidity, glucose and
fructose contents for MAP strawberries stored for various times
were not related to the different gas treatments. The ethanol
content increased in gas treated samples, with mixed gas-treated
samples showing the highest ethanol content. Desirable attributes
were positively correlated to soluble solids but negatively
correlated to ethanol content. The undesirable attributes were
negatively correlated with soluble solids but positively with
ethanol content.

91
4.4 Part 2. Flavor volatile analysis of strawberries stored under
MAP.
The objectives of Part 2 of this research were to: a) extract
and identify the types and relative amounts of volatile compounds
of strawberries stored under MAP conditions; b) study the influence
of MAP on volatile profiles of strawberries and their influence on
quality; and c) predict the treatment category and quality of
strawberries stored under MAP from the data for volatile compounds
by applying multivariate statistical analyses, and also relate
sensory to GC data.
4.5 Volatile compound extraction from strawberries.
A number of methods have been used to extract volatile
compounds from strawberry fruit (McFadden et al., 1965; Schreier,
1980; Honkanen and Hirvi, 1990). Preliminary studies were
conducted to evaluate: a) direct solvent extraction using
dichloromethane, diethyl ether and pentane, either separately or as
a mixture of diethyl ether and pentane in a 2:1 proportion (Hirvi,
1983; Pino et al. , 1986b); b) volatilization techniques. The
volatilization techniques included direct distillation using a
Rotavapor unit, simultaneous steam distillation extraction (SDE)
with and without vacuum (Nunez et al. 1984; Takeoka et al., 1986),
dynamic purge-and-trap of volatiles onto Tenax GC adsorbent
followed by either diethyl ether desorption (Olafsdottir et al. ,
1985; Hansen and Lund, 1987) or thermal desorption (Hirvi and
Honkanen, 1982; Jeltema et al. 1984). A charcoal adsorbent, ORBO™

92
was also used and the adsorbed volatiles were eluted from the trap
with dichloromethane (Schreier, 1980).
4.5.1 Direct solvent and simultaneous distillation extraction.
Figure 8 shows chromatograms of unstored, fresh strawberry
volatile compounds obtained by direct solvent extraction, and
simultaneous distillation extraction (SDE) without and with vacuum
applied. With a direct solvent extraction method, which involved
mixing a strawberry fruit sample (blended sample or filtrate from
the blended sample) with dichloromethane in equal volumes (1:1),
many volatile compounds were extracted (Figure 8A) . Similar
results with minor variation in volatile compounds were obtained
with other solvents (pentane and diethyl ether). Although this
solvent extraction method has been used by other researchers for a
variety of foods, it requires large amounts of sample and a large
solvent volume to sample volume ratio as well as numerous repeated
extractions (Tressl et al., 1977; Barron and Etievant, 1990). By
using the SDE method without application of vacuum, more volatile
compounds were extracted than with the solvent extraction method
but much higher temperatures of 70-100°C were necessary for
extraction (Figure 8B). To minimize any undesirable heat effects
on the strawberry volatile compounds, steam distillation with a
vacuum (650 Pa) was used with extraction temperatures of 40-50°C.
The gas chromatograms shown in Figure 8C indicated that a greater
number and amount of volatile compounds were extracted by this
method compared to the number and amount of volatiles obtained with

93
B «-
&VM
Figure 8. Comparison of strawberry flavor profiles prepared by: direct solvent extraction (A); steam distillation (B) and vacuum steam distillation extraction (C) (volatile compounds extracted from fresh strawberries).

94
either the direct solvent extraction or steam distillation used
without vacuum. Because of the possibility of the formation of
artifacts during the high temperature extraction process as well as
the requirement of a large sample size and high solvent volume to
sample volume ratio (Ohta et al. , 1987), these above mentioned
methods were not used further in this study.
4.5.2 Volatile extraction by dynamic headspace procedure.
The dynamic headspace evaluation of strawberries stored under
modified atmosphere packaging at 1°C was aimed at the
identification of volatile compounds that may contribute to the
unpleasant off-flavors/odors. The selection of the dynamic
headspace method was based on the supposition that only naturally-
occurring volatile compounds in strawberry fruit would be
extracted. Headspace purge-and-trap of volatile compounds on an
adsorbent such as Tenax GC or powdered charcoal, followed by either
solvent desorption or thermal desorption of the volatile compounds
are commonly used in the dynamic headspace extraction procedures.
The headspace method is known to introduce the least number of
artifacts of any of extraction methods (Schreier, 1980; Bartley and
Schwede, 1987) .
Figure 9 shows, the chromatograms for adsorbed strawberry
volatile compounds from charcoal traps which were extracted with
dichloromethane, from Tenax GC traps extracted by diethyl ether,
and from heated Tenax GC traps. Although the three chromatograms
have similar patterns, some volatile compound profile differences

95
B
ii idf UUJIUJ \ii V! u L**1 P nAiWdM*
1« IS ~i T T r
WJ y^juLiM T T T 1
1* IS
Figure 9. Chromatograms obtained from strawberry volatiles extracted by headspace technique A) charcoal adsorbent and B) Tenax GC eluted with solvent; and C) thermally desorbed from Tenax GC (volatile compounds extracted from fresh strawberries).

96
were evident. After desorption of the volatile compounds from the
charcoal trap, 37 volatile peaks were obtained on the chromatogram
(Figure 9A), but this value was lower than the number of volatile
compounds peaks from the Tenax trap (Figure 9B and C). Charcoal
adsorbents are known to strongly adsorb some volatile compounds
which would explain the failure to desorb all trapped volatile
compounds (Schaefer, 1981). Adsorption of volatile compounds on
Tenax GC adsorbent followed by solvent (diethyl ether) desorption
resulted in 58 chromatographic peaks (Figure 9B) . Mazza et al.
(1980) and Olafsadottir et al. (1985) found the Tenax procedure was
suitable for concentrating headspace volatile compounds. Thermal
desorption of strawberry volatile compounds from Tenax GC resulted
in 55 peaks being resolved (Figure 9C). Volatile compounds that
may have been strongly adsorbed to the Tenax may have been desorbed
at elevated temperatures during thermal desorption. Aishima (1983)
isolated ethylguaiacol, a high boiling compound from soy sauce, by
thermal desorption. However, the high temperature desorption may
possibly introduce artifacts.
Although a number of similar volatile compounds were extracted
with the various extraction procedures, variations especially with
the thermal desorption procedure were obtained. Desorption of
volatile compounds by solvent extraction of Tenax GC brings about
the release of low molecular and less polar compounds, while the
thermal desorption method has the effect of releasing both low and
high molecular weight compounds from the Tenax GC, and may also
result in formation of artifacts (Honanken and Hirvi, 1990). For

97
the major part of the research on GC profiling of volatile
compounds from MAP strawberries, the dynamic headspace procedure
involving trapping of volatile compounds on the Tenax GC followed
by solvent desorption was used.
4.6 Evaluation of volatile extraction from a model system.
A model system with known volatile compounds including six
esters and three ketones diluted with diethyl ether in various
concentrations was used to determine the degree of compound
separation by direct injections onto the GC column. The
reproducibility of peaks with repeated injections was good with
coefficients of variation of 3.9 to 5.5% for the esters and ketones
(Table 13) .
The model system of known compounds was added to water and used
to study the reproducibility of recovering the compounds by
headspace purge-and-trap of volatiles on the Tenax GC adsorbent and
elution of volatiles with diethyl ether. Coefficients of variation
for the various compounds ranged between 3 to 16.3% (Table 14).
4.7 Evaluation of strawberry volatile compound extraction by
dynamic headspace technique.
A study was initiated to assess the reproducibility of GC
profiles of volatile compounds in a fresh strawberry extract
derived by the dynamic headspace technique. Table 15 shows the
means, standard deviations and coefficients of variation for the 25
selected volatile compounds for an assessment of the

98
Table 13. Reproducibility of peak areas for known volatile compounds in a model system. The same volatile compound mixture was injected four times into GC.
Peak Compound Peak areas of volatile compounds No.
1. 2. 3. 4. 5. 6. 7. 8. 9.
3-Pentanone Methyl butanoate Ethyl butanoate Hexyl butanaote Ethyl hexanoate 2-Nonanone Ethyl heptanoate 3-Heptanone Ethyl octanoate
Mean2
34649.5 30890.8 37351.0 33161.5 39720.5 45692.3 42565.8 45432.3 44149.0
SDy
1421.2 1202.3 1711.3 1672.3 1565.0 2324.1 2324.1 2490.0 2449.8
%CVX
4.1 3.9 4.6 5.0 3.9 5.5 5.5 5.5 5.5
'mean of 4 injections into GC. ySD=standard deviation. xCV=coefficient of variation (%CV=standard deviation/mean*100) .
Table 14. Reproducibility of GC peak areas for known volatile compounds extracted from an aqueous solution by the dynamic headspace technique.
Peak Compound Peak areas of volatile compounds No.
1. 2. 3. 4. 5. 6. 7. 8. 9.
3-Pentanone Methyl butanoate Ethyl butanoate Hexyl butanaote Ethyl hexanoate 2-Nonanone Ethyl heptanoate 3-Heptanone Ethyl octanoate
Mean2
4074.0 7901.4
13708.3 15661.2 97582.0 67493.3 88918.7 68363.3 60393.7
SDy
380.1 1094.5 408.6
2559.7 5848.0 4739.7 5976.5 6266.4 6689.1
%CVX
9.3 13.9 3.0 16.3 6.0 7.0 6.7 9.2
11.1
2Mean of 4 replicate extracts by dynamic headspace technique. ySD=standard deviation. xCV=coefficient of variation (%CV=standard deviation/mean*100) .

99
Table 15. Means, standard deviations and coefficients of variation for specific volatile compounds extracted from strawberry fruit by the dynamic headspace technique (volatile compounds extracted from fresh strawberries).
Peak No.z
1 2 3 4 5 6 7 8 9
10 11 12 13 14 15 16 17 18 19 20 21 22 23 24 25
Volatile compound
Ethyl propionate Methyl butanoate Ethyl butanoate Butyl acetate 1-Methylethyl butanoate 2-Methylethyl butanoate Pentyl acetate 2-Methyl-l-butyl acetate 2-Octanone Methyl hexanaote Butyl butanoate Ethyl hexanoate 1-Hexenyl acetate 2-Hexenyl acetate 1-Methylethyl hexanoate Methyl heptanoate 3,7-Dimethyl 1,6-octadien-3-Ethyl heptanoate Hexyl butanoate Ethyl octanoate Octyl acetate s-Octyl acetate Hexyl hexanoate Octyl propanoate Unkwown
MeanY
3.3 45.5
176.7 37.2 9.2 5.4 4.3 4.0 1.8
48.7 19.8
259.5 17.2
116.8 3.1 0.5
-ol 0.8 1.8 9.1 2.2
10.6 2.3 1.8 7.1 0.6
SDX
0.5 7.1
32.3 6.5 1.9 0.8 0.9 0.7 0.2 8.1 3.9
41.1 2.4
20.7 0.5 0.1 0.1 0.3 1.4 0.4 1.2 0.2 0.3 0.8 0.1
%CVW
15.1 15.6 18.3 17.5 20.4 14.4 20.1 18.4 11.4 16.6 19.6 15.8 13.7 17.7 16.3 19.3 15.5 17.6 15.3 16.1 11.8 8.0
18.4 11.8 18.5
zpeaks were renumbered to represent only selected volatile compounds from strawberry extract.
yMean of 4 replicate extracts by dynamic headspace technique. Relative amounts of volatile compounds were calculated as the ratio between each sample peak area to the peak area of the internal standard (X10~2) .
xSD=standard deviation. wCV=coefficient of variation (%CV=standard deviation/mean*100) .

100
reproducibility of GC peak areas for the strawberry volatile
compounds extracted by the dynamic headspace technique. Volatile
compounds from four strawberry samples were independently extracted
and injected into the GC. The coefficients of variation for the
four extracts were between 8-21% with an average of 16.2%.
Although the strawberries were sorted for uniformity based on
color, size and touch-firmness, variability of up to 21% among
replicated samples extracted by the headspace procedure were
obtained. Kallio and Lapvetelainen (1984) and Douillard and
Guichard (1989) reported coefficients of variation of up to 49%
with the solvent extraction procedure, and they attributed this
variability to the different stages of maturity of the berries.
Aishima (1983) used the headspace procedure to study volatile
compounds of soy sauce samples and reported variability of up to
27%.
The influence of strawberry tissue disruption prior to the
dynamic headspace extraction was studied. The disrupted strawberry
tissue samples included: 1) tissue macerated by Waring blender at
full speed for 3 min at room temperature; 2) strawberries sliced in
half; 3) strawberries sliced in quarters and 4) decapped whole
strawberries. Table 16 shows the influence of preparation methods
for the strawberry samples on the peak areas of selected volatile
compounds extracted by the dynamic headspace technique. In
general, more volatiles were extracted from sliced strawberries
than from the whole fruit, with more volatile compounds being
recovered from quartered strawberries than with the sliced halved

101
Table 16. Influence of strawberry preparation on the peak areas of volatile compounds extracted by dynamic headspace technique2 (volatile compounds extracted from fresh strawberries).
Vol at :ile compound
Ethyl propionate Ethyl butanoate Ethyl hexanoate 2-Hexenyl acetate
Total
Relative
Mascerated tissue
5. 59. 56. 20.
143.
. 9 X
.4
.9
.8
.0
amounts
Sample
Whole fruit
11.8 142.8 64.3 98.3
317.2
of
pn
volatilesY
sparations
Half sliced fruit
7.5 216.3 126.2 163.6
513.6
(xl0"2)
Quarter sliced fruit
13. 401. 237. 312.
964.
.4
.3
.0
.8
.5
ZA flow rate of 30 mL/min and incubation temperature of 40° were used.
yRelative amounts of volatile compounds were calculated as the ratio between each sample peak area to the peak area of the internal standard.
xMean of three samples extracted separately.

102
fruit. Maceration of the fruit resulted in lower amounts of
volatile compounds being extracted than with other preparation
methods. For further studies, strawberries were sliced into
quarters and used for volatile compound extraction. This slicing
was intended to simulate somewhat the disintegration of strawberry
tissue during the first few bites in the mouth with the release of
volatile compounds.
The effects of N2 flow rate, incubation time and incubation
temperature on the extraction of volatile compounds were studied.
A N2 flow rate of 45 mL/min was found to be better for the
extraction of most of the volatile compounds compared to the flow
rates of 15 and 3 0 mL/min (Table 17). However, a high flow rate
would result in loss of volatile compounds due to bleeding through
the adsorbent (Schaefer, 1981). As the incubation time increased
for collection of volatile compounds, more volatiles were adsorbed
on the Tenax GC (Table 18). With 3 hr and 4 hr collection times,
the amount of strawberry volatile compounds collected was much
higher than for the 1 hr and 2 hr periods. But longer incubation
times are known to result in large variation of volatile compounds
being collected (Olafsdottir et al., 1985). As shown in Table 19,
the most suitable temperature for the extraction of selected
volatile compounds from strawberries was 40°C. In this study, the
strawberries were sliced into quarters, a N2 flow rate of 30
mL/min., a purge-and-trap time of 2 hr and incubation temperature
of 40°C were used.

103
Table 17. Effect of nitrogen flow rate on the peak areas of volatile compounds extracted from strawberries using the headspace technique2 (volatile compounds extracted from fresh strawberries).
Volatile compounds Relative amounts of volatilesy(xlO 2)
Nitrogen flow rate (mL/min)
15 30 45
Ethyl propionate Ethyl butanoate Methyl hexanoate Ethyl hexanoate 2-Hexenyl acetate
Total
140.lx
204.3 52.0 65.6
109.2
571.2
99.7 196.9 52.4 83.0
105.5
537.5
98.4 242.6 80.9 187.9 126.2
736.0
zPurge-and-trap time was 2 hr and incubation temperature 40°C. yRelative amounts of volatile compounds were calculated as the ratio between each sample peak area to the peak area of the internal standard.
xMean of three samples extracted separately.
Table 18. Effect of purge-and-trap time (hr) on the peak areas of volatile compounds extracted from strawberries using the dynamic headspace technique2
Volatile compounds Relative amounts of volatilesy(xlO )
Purge-and-trap time (hr)
Ethyl propionate Ethyl butanoate Methyl hexanoate Ethyl hexanoate 2-Hexenyl acetate
95.2X
102.7 35.1 24.6 61.4
99.7 196.9 52.4 83.0
105.5
72.8 333.9 83.8
307.3 139.4
42.6 251.9 64.6
342.8 124.3
Total 319.0 537.5 937.2 826.2
z Flow rate of 30 mL/min and incubation temperature of 40°. yRelative amounts of volatile compounds were calculated as the ratio between each sample peak area to the peak area of the internal standard.
xMean of three samples extracted separately.

104
Table 19. Effect of incubation temperature on the peak areas of volatile compounds extracted from strawberries using the dynamic headsapce technique2 (volatile compounds extracted from fresh strawberries) .
Volatile compound Relative amounts of volatilesY(xlO )
Incubation temperature (°C)
40 60 80
Ethyl propionate Ethyl butanoate Methyl hexanoate Ethyl hexanoate 2-Hexenyl acetate
9 9 . 7 X
1 9 6 . 9 5 2 . 4 8 3 . 0
1 0 5 . 5
6 8 . 4 1 0 4 . 5
4 7 . 6 1 2 7 . 6
8 6 . 5
1 0 0 . 0 4 9 . 2 2 9 . 8 2 1 . 1 4 6 . 2
Total 537.5 434.6 246.3 ZA flow rate of 30 mL/min and purge-and-trap time of 2 hr were used.
YRelative amounts of volatile compounds were calculated as the ratio between each sample peak area to the peak area of the internal standard.
xMean of three samples extracted separately.

105
4.8 Identification of strawberry volatile compounds.
Volatile compounds from quartered strawberries held at 40°C
v/ere trapped on Tenax GC after purging the headspace of a flask
with N2 gas. The retention time and mass spectrum obtained for
each strawberry volatile compound were matched with known mass
spectra in a computer data library. Figure 10 shows the match of
a library mass spectrum of methyl butanoate with the mass spectrum
of a strawberry volatile compound. Table 2 0 indicates the
identified volatile compounds present in the strawberry volatile
fraction trapped on Tenax GC, and Figure 11 shows a representative
GC chromatogram for the strawberry volatile extract eluted from
Tenax GC with diethyl ether. The chromatogram was re-numbered to
represent selected peaks, and numbering was in order of elution
time. Up to 50 volatile compounds were identified as components of
the strawberry volatile extract, and they included 40 esters, 2
alcohols, 6 carbonyls and 2 sulphides (Table 20) . Among the esters
were ethyl acetate, ethyl propionate, methyl and ethyl butanoates,
methyl and ethyl hexanoates, 3-hexenyl acetate, 2-hexenyl acetate,
methyl and ethyl heptanoates, and hexyl butanoate. The alcohols
included 3,7-dimethyl-1,6-octadien-3-ol (linalool), and ethanol
which eluted together with the solvent, diethyl ether.
Table 21 presents identified strawberry volatile compounds
thermally desorbed from the Tenax GC traps. The 40 compounds
identified by GC-MS methodology included 25 esters, 10 carbonyl
compounds, 3 alcohols, 2 acids and 1 sulphide compound. Ester
compounds included ethyl acetate, methyl butanoate, ethyl 2-

106
1 Sc an 1 1 O O O O — j 1 KJUJILtlCJ J
1 1 1 fl«O0H 1 3 i ^ 1 bwwen ! ^ i /oop»J 1 3 38 I ? 0 G . G H \
( _ ^ M i a i *" i ° 1 c
t c ! 0 0 0 0 T
i o 4 ICE fifiAPH i i 1 . i 6 0 0 0 1 i-> J 4 1 , . / i 4»4ujen/ 1 4 j 2 0 8 0 K
i < j e* • i • ' • •
8 / 8
43
1 1 1 1 i l i
( I / . / 1 8 m in J o f LIHIHI
71 l\ 1 <.
C O J O
\
i
i i i i
t
Bulo.no i c AC i d , m e t h y l I r.
1 j l ( i 1 i I i
.1 l l Hi i • i •
1 90 40
• 7 1 4 I J \ *
\
59 N
\
i i
1. ! i
« 4
• i • • • • i • • • • , .
50 60 70 Iu4_ _ _ ,f^l
e s
• i •
80
: / U I U Z 4 .
67 / i
1
U
i02 \
y 4-\ r^T \
t e r u t i )
m u ; / 1 1 1 90
4 r\*\
\ \
• 1
!00
— 1 curxntn
:8000 ;
:5000
:4880
:2000
: 1000G
; f l00 f l
6 0 0 0
;4000
'
1
8utanoic acid, methvl ester <9CI) flol. Ut. : 102.067
Figure 10. Mass spectrum of methyl butanoate from strawberry extract and its' match from the library spectra (volatile compound extracted from fresh strawberries).

107
Table 20. Tentatively identified2 strawberry volatile compounds which were desorbed from Tenax GC adsorbent by diethyl ether (volatile compounds extracted from fresh strawberries).
Peak Volatile compound Retention time No. (min)
l.y
2. 3. 4. 5. 6. 7. 8. 9. 10. 11. 12. 13. 14. 15. 16. 17. 18. 19. 20. 21. 22. 23. 24. 25. 25. 26. 27. 28. 29. 30. 31. 32. 33. 34. 35. 36. 37. 38. 39. 40.
Acetaldehyde Ethanol Acetone 2-Methylpentane Ethyl acetate Acetic acid Ethyl propionate Ethyl-2-methyl acetate Propionic acid Propyl acetate Methyl butanoate Dimethyl disulphide Propyl-2-methyl acetate Ethyl butanoate Butyl acetate Ethyl 1-methylbutanaote Ethyl 2-methylbutanoate Ethyl 3-methylbutanoate Pentyl acetate 2-Methyl-l-butyl acetate 2-Methyl acetyl-1-butanoate 2-Octanone Propyl butanoate Ethyl pentanoate Methyl hexanoate 3-Acetyldihydro 2 (3)-furanone Methyl heptanoate Dimethyl trisulphide Butyl butanoate 1-methylpropyl butanoate Ethyl hexanoate 3-Hexenyl acetate 2-Hexenyl acetate Hexyl acetate 1-Methylethyl hexanoate 2-Nonanone (internal standard) Pentyl methyl acetate 3,7-Dimethyl-l,6-octadien-3-ol Ethyl heptanoate 6-Ethyl-2-methyl octane Methyl nonanoate
5.14 5.87* 6.01 6.30* 6.50 6.80 7.29 7.83* 7.85 7.90 8.76* 9.14
10.70 10.80 11.08 11.80 11.90 12.20 12.77* 13.18* 13.20* 13.31* 13.57 13.67* 14.20 15.78* 16.22 16.44* 16.56 16.97 17.15 17.77 19.53* 19.74 20.06 20.13* 20.49 21.02

108
41. 42. 43. 44. 45. 46. 47. 48. 49. 50. 51. 52. 53. 54.
Phenylmethyl acetate 2-Ethylhexyl acetate 2-Methylpropyl hexanoate Hexyl butanoate Ethyl octanoate 1-Dodecane Octyl acetate sec-Octyl acetate 2-Methylbutyl hexanoate Octyl propionate Hexyl hexanoate Octyl 2-propionate Unknown 3 Unkown 4
21.50 21.59 22.05 22.85* 23.01* 23.01 23.44 24.29 25.28 27.40 28.51 28.68 29.03 29.16
zVolatile compounds identified by GC/MS. yPeaks 1 to 3 eluted with the solvent peak "Reference (authetic) compound used to confirm identified strawberry volatile compound.

1 0 9
H<iOMl->r
:OM(io
70000
5MW)
*vub (J-X 1 1 — ] 1 1 1
29 8 JO 35 10 IS SO T
10
Figure 11. Typical GC chromatogram of strawberry volatiles eluted from Tenax GC with diethyl ether (peaks re-numbered to show GC peaks of interest; IS=2-nonanone used as internal standard; volatile compounds extracted from fresh strawberries).

110
Table 21. Tentatively identified2 strawberry volatile compounds which were thermally desorbed from Tenax GC adsorbent (volatile compounds extracted from fresh strawberries).
Peak Volatile compound name Retention time No.
1. 2. 3. 4. 5. 6. 7. 6. 8. 9. 10. 10. 11. 12. 13. 14. 15. 16. 17. 18. 19. 20. 21. 22. 23. 24. 25. 26. 27. 28. 29. 30. 31. 32. 33. 34. 35. 36. 37. 38. 39. 40.
2-Propane Ethyl ether Dichloromethane Hexane Ethyl acetate Trichloromethane 3-Buten-l-ol or Ethyl-3-butenoate Unknown 2,2,3-Trimethylpentane Ethyl propionate Methyl butanoate Ethyl 2-methylpropionate Methyl benzene Methyl 3-methylbutanoate Isocyanato-ethane Ethyl butanoate Unknown Ethyl 1-Methylbutanoate Unknown Ethyl 2-methylbutanoate 1,4-Dioxane 2-Hexenal 3-Methyl-l-butyl acetate 4-Methyl-2-hexanone Propyl butanoate Ethyl pentanoate Phenyl butanedioc acid Pentyl acetate Methyl hexanoate Ethyl-3-methyl-2-butenoate Dimethyl trisulfide Ethyl hexanoate 4-Hexenyl acetate 3-Methyl-l,3-pentadiene 1-Hexene 2,5,6-trimethyl octane 2-Octen-4-ol 2-Methylbutyl 2-methylpropionate 2,2,2-Trimethylhexane 4-Ethyl-2,2,6,6-tetramethylheptane 2,8-Dimethyl undecane 2-Nonanone
(min)
7.69 8.11 9.13
12.00 12.42*y
12.84 13.19 14.79 15.95 17.95* 17.72* 19.44 20.10 20.30 21.30 21.62* 22.00 23.21 23.42 23.59 23.79 23.79 24.74 25.42 25.61* 25.71* 25.80 26.24 26.77* 27.43 29.45 29.72* 29.97 30.11 30.30 30.89 31.53 31.92 32.24 32.37 32.92 33.33*

I l l
41. 42. 43. 44. 45. 46. 47. 48. 49. 50.
3,7-Dimethyl-l,6-octadien-3-ol 2-Methyl hexanoate Phenylmethyl acetate Ethyl benzoate Hexyl butanoate Ethyl octanoate Octyl acetate 2,3-Dimethyl-3-hexanol Phenylmethyl butanoate 1-Methyloctyl butanoate
33.72 34.23 35.80 36.09 36.19 36.32* 36.67 37.29 40.27 41.06
z V o l a t i l e compounds i d e n t i f i e d by GC/MS. YReference ( a u t h e t i c ) compound used t o conf i rm i d e n t i f i e d
s t r a w b e r r y v o l a t i l e compound.

112
methylpropionate, methyl 3-methyl butanoate, propyl butanoate,
ethyl pentanoate, methyl hexanoate, ethyl-3-methyl-2-butenoate,
ethyl hexanoate, phenylmethyl acetate and ethyl octanoate. The
carbonyl compounds were 2-hexenal, 1-hexene, 3-methyl-1,3-
pentadiene and 4-ethyl-2,2,6,6-tetramethylheptane. Thermal
desorption produced alkenes such as 3-methyl-1,3-pentadiene which
were not eluted from the Tenax GC with diethyl ether. Ethanol was
not detected and this may be due to the bleeding of the low
molecular weight compound through Tenax GC trap (Schaefer, 1981) .
Most of the strawberry volatile compounds identified in this
study have been reported to be present in fresh strawberries by
other researchers (McFadden et al., 1965; Schreier, 1980; Dirinck
et al. , 1981; Hirvi and Honkanen, 1982; Douillard and Guichard,
1990). The variation in the types and amounts of the strawberry
volatile compounds apparently depends on the method of volatile
compound extraction and fruit maturity. Of the many strawberry
volatile compounds tentatively identified in this research study,
the most frequently appearing ones in the GC chromatograms under
all the conditions are presented in Table 22.
Volatile compounds that have been reported to contribute to
typical strawberry aroma include methyl butanoate, ethyl butanoate,
methyl hexanoate, ethyl hexanoate, trans-2-hexyl acetate, trans-2-
hexenal, trans-2-hexen-l-ol and 2,5-dimethyl-4-methoxy-3(2H)-
furanone (furanoel) (Schreier, 1980; Hirvi and Honkanen, 1982;
Douillard and Guichard, 1990) . Some of these volatiles, such as
the hexanoates, heptanoates and the hexenyl acetates, were

Table 22. Strawberry volatile compounds selected for statistical analysis (peaks re-numbered).
Peak No.
4 5 14 15 16 17 19 20 22 25 29 30 31 32 33 36 37 38 44 45 47 48 50 51 54
Renumbered Peaksy
1 2 3 4 5 6 7 8 9 10 11 12 13 14 15 16 17 18 19 20 21 22 23 24 25
Labelz
a b c d e f g h i J k 1 m n o P q r s t u V
w X
Y
RTX
5.18 5.49 8.57 9.07
10.72 10.80 11.70 11.79 12.88 13.51 16.22 16.44 16.56 16.88 17.77 19.86 19.99 20.09 22.80 22.96 23.39 24.24 28.48 28.59 29.14
Volatile compound
Ethyl propionate Methyl butanoate Ethyl butanoate Butyl acetate Ethyl 1-methylbutanoate Ethyl 2-methylbutanoate Pentyl acetate 2-Methyl-l-butyl acetate 2-Octanone Methyl hexanaote Butyl butanoate Ethyl hexanoate 3-Hexenyl acetate 2-Hexenyl acetate 1-Methylethyl hexanoate Methyl heptanoate 3,7-Dimethyl-l,6-octadien-3-ol Ethyl heptanoate Hexyl butanoate Ethyl octanoate Octyl acetate sec-Octyl acetate Hexyl hexanoate Octyl propionate Unknown
zLabel=peak name, used in canonical plots (Figures 23, 26, 29) yRe-numbered peaks selected for statistical analysis. xRT=retention time in minutes.

114
tentatively identified as indicated in Tables 20, 21 and 22.
4.9 Volatile compounds of strawberries stored under MAP.
Strawberry volatile compounds were extracted on days 3, 6 and
10 from unpackaged strawberries and from MAP strawberries with
input gases as air, mixed gas (11% C02 + 11% 02) or carbon dioxide
(100% C02) . Volatile compounds were also extracted from fresh
strawberries at day 0 (prior to storage) . The GC analyses of
strawberry extracts were carried out on the same day as the
extraction to obviate any chemical changes of the volatile
compounds during the storage of the ether extract from the Tenax GC
traps.
Figure 12 shows typical GC chromatograms obtained from
unpackaged strawberries and from MAP strawberries with input gases
as air, mixed gas or carbon dioxide after 6 days of storage. These
chromatograms possessed more than 60 peaks, 50 of which were
tentatively identified (Table 20). The profiles of the
chromatograms were similar with the most noticeable differences
being the peak heights. The ratio of each sample peak area to the
peak area of an internal standard (2-nonanone) was used to express
the relative amounts of strawberry volatile compounds. The
relative amounts of volatile compounds varied depending on the type
of volatile compound, treatment and storage time (Tables 23, 24 and
25). The variation in the relative amounts of volatile compounds
for the different treatments and storage times presumably was
related to changes in the perceived flavor/odor of strawberries

B
S 5
ill lj mJk. LiJ_ 51 IS tl
' T IS
I!
iiliil J&1 t
<f £
.-MjJ*t^.A»_MM_ i) IS St IS It IS
It it
Figures 12. Flavor volatile profiles of unpackaged strawberries (A) and MAP strawberries packaged in air (B), mixed gas (C) or carbon dioxide (D) after 6 days of storage at 1°C.

Table 23. Relative amounts2 of selected volatiles from strawberry fruit evaluated at day 0 and at day 3 of storage at 1°C for unpackaged and MAP samples with input gases as air, mixed gas or carbon dioxide.
Labely Volatile compound Relative amounts (xlO"2)
Day 0 Unpack" Air Mixed Carbon gas dioxide
a b c d e f g h i J k 1 m n o P q r s t u V w X
y
Total
Ethyl propionate Methyl butanoate Ethyl butanoate Butyl acetate Ethyl 1-methylbutanoate Ethyl 2-methylbutanoate Pentyl acetate 2-Methyl-l-butyl acetate 2-0ctanone Methyl hexanoate Butyl butanoate Ethyl hexanoate 3-Hexenyl acetate 2-Hexenyl acetate 1-Methylethyl hexanoate Methyl heptanoate 3,7-Dimethyl-l,6-octadien-3-Ethyl heptanoate Hexyl butanoate Ethyl octanoate Octyl acetate sec-Octyl acetate Hexyl hexanoate Octyl propionate Unknown
3.7 45.8 179.4 37.2 9.9 6.3 4.2 3.7 1.6
50.2 19.6
260.6 20.1 116.8 3.0 0.5
-ol 1.0 1.8 9.6 2.4 8.9 2.7 1.7 6.1 0.7
797.5
3.3 38.0 247.7 47.0 22.1 7.7 5.6 3.5 1.9
38.4 15.0
292.5 11.7 109.0 3.0 0.7 0.8 1.4 9.1 2.8 13.9 1.9 1.9 8.8 0.7
888.4
10.6 30.4 190.2 20.8 25.9 10.5 12.0 5.9 1.2 32.1 4.6
174.5 15.7 135.7
1.3 2.2 0.8 2.9 6.5 3.1 6.3 3.0 1.7 2.7 1.1
701.7
6.7 6.5
146.1 13.1 63.5 12.1 10.6 4.9 1.1 8.8 1.1
161.0 9.9
54.3 2.3 1.8 0.7 1.6 1.8 3.7 6.4 1.7 1.0 0.5 1.4
522.6
5.7 7.0
168.2 35.2 22.5 7.6 10.4 7.2 2.3 18.4 0.8
313.3 6.6
104.7 4.9 0.4 3.7 13.1 0.7 3.6 16.7 3.5 0.6 1.0 1.7
759.8
zRelative amounts of volatile compounds were calculated as the ratio between each sample peak area to the peak area of the internal standard.
yLabel=peak name, used in canonical plots (Figures 23, 26, 29). "Unpackaged strawberries.

Table 24. Relative amounts2 of selected volatiles of strawberry fruit evaluated at day 0 and at day 6 of storage at 1°C for unpackaged and MAP samples with input gas as air, mixed gas or carbon dioxide.
Labely Volatile compound Relative amounts (xl0~2)
Day 0 Unpack" Air Mixed Carbon gas dioxide
a Ethyl propionate b Methyl butanoate c Ethyl butanoate d Butyl acetate e Ethyl 1-methylbutanoate f Ethyl 2-methylbutanoate g Pentyl acetate h 2-Methyl-l-butyl acetate i 2-0ctanone j Methyl hexanaote k Butyl butanoate 1 Ethyl hexanoate m 3-Hexenyl acetate n 2-Hexenyl acetate o 1-Methylethyl hexanoate p Methyl heptanoate q 3,7-Dimethyl-l,6-octadien-3-ol r Ethyl heptanoate s Hexyl butanoate t Ethyl octanoate u Octyl acetate v sec-Octyl acetate w Hexyl hexanoate x Octyl propionate y Unknown
Total 797.5 1071.5 699.9 456.7 995.7
zRelative amounts of volatile compounds were calculated as the ratio between each sample peak area to the peak area of the internal standard.
yLabel=peak name, used in canonical plots (Figures 23, 26, 29) . "Unpad aged strawberries.
3 . 7 4 5 . 8
1 7 9 . 4 3 7 . 2
9 . 9 6 . 3 4 . 2 3 . 7 1 .6
5 0 . 2 1 9 . 6
2 6 0 . 6 2 0 . 1
1 1 6 . 8 3 . 0 0 . 5 1 .0 1 .8 9 . 6 2 . 4 8 . 9 2 . 7 1.7 6 . 1 0 . 7
5 . 7 9 . 8
3 5 5 . 2 3 4 . 6 9 9 . 3 1 6 . 0 1 7 . 9
5 . 6 3 . 1 8 . 7 1 .5
3 9 4 . 4 1 0 . 3 7 7 . 7
2 . 1 0 . 6 0 . 6 1 .2 0 . 6 3 . 9
1 8 . 2 1 .4 1 .1 1.2 1 .0
9 . 5 3 3 . 0
1 2 1 . 7 2 6 . 6
6 . 4 6 . 4 3 . 2 2 . 8 1 .2
4 5 . 9 1 6 . 2
2 2 2 . 6 1 5 . 7
1 4 3 . 8 1 .9 1 .9 1.0 2 . 0
1 2 . 1 4 . 0 7 . 9 3 . 5 2 . 3 6 . 3 2 . 1
9 . 1 9 . 3
1 2 0 . 6 9 . 3
5 1 . 4 1 7 . 6 1 6 . 1
4 . 3 1 .1
1 1 . 3 1.0
1 4 2 . 5 1 0 . 4 2 8 . 1
1 .9 2 . 3 1.0 1 .9 2 . 7 4 . 4 5 . 5 1 .7 0 . 7 1.0 1 .5
7 . 0 6 . 4
2 2 7 . 1 4 4 . 2 3 2 . 3
9 . 0 1 7 . 0
7 . 2 3 . 2
1 4 . 7 0 . 8
4 5 0 . 3 4 . 0
1 1 2 . 2 8 . 3 0 . 5 3 . 8
1 5 . 5 0 . 0 3 . 4
2 4 . 0 1 .3 0 . 1 1.2 2 . 2

Table 25. Relative amounts2 of selected volatiles of strawberry fruit evaluated at day 0 and at day 10 of storage at 1°C for unpackaged and MAP samples with input gas as air, mixed gas or carbon dioxide.
Labely Volatile compound Relative amounts (xl0~2)
Day 0 Unpack0 Air Mixed Carbon gas dioxide
a b c d e f g h i J k 1 m n 0
P q r s t u V w X
y
Ethyl propionate Methyl butanoate Ethyl butanoate Butyl acetate Ethyl 1-methylbutanoate Ethyl 2-methylbutanoate Pentyl acetate 2-Methyl-l-butyl acetate 2-Octanone Methyl hexanaote Butyl butanoate Ethyl hexanoate 3-Hexenyl acetate 2-Hexenyl acetate 1-Methylethyl hexanoate Methyl heptanoate 3,7-Dimethyl-l,6-octadien-3-ol Ethyl heptanoate Hexyl butanoate Ethyl octanoate Octyl acetate sec-Octyl acetate Hexyl hexanoate Octyl propionate Unknown
Total
3.7 45.8 179.4 37.2 9.9 6.3 4.2 3.7 1.6
50.2 19.6
260.6 20.1 116.8 3.0 0.5 1.0 1.8 9.6 2.4 8.9 2.7 1.7 6.1 0.7
797.5
6.7 8.2
350.7 34.8 103.3 18.8 14.5 5.6 3.3 12.8 1.9
520.7 13.5 92.6 2.8 0.7 1.0 1.5 1.0 4.7 17.5 2.4 0.9 1.3 1.1
1222.4
11.1 19.7 59.3 12.2 7.6 4.0 2.5 3.2 0.5
26.3 2.8 94.0 12.1 86.2 2.9 1.8 0.9 2.3 3.9 2.6 7.0 5.1 1.6 2.7 2.1
374.5
8.3 23.5 166.9 29.8 17.1 11.2 8.9 7.2 3.6
41.7 11.9
374.9 7.2
141.4 4.7 3.6 2.9 10.5 5.3 4.3 16.9 9.5 2.3 7.9 2.9
924.3
8.8 9.5
190.5 39.5 24.6 9.7
23.7 8.0 4.4 18.3 1.6
467.1 3.8 95.0 8.0 0.6 5.5 13.9 0.7 3.3
21.1 1.5 0.6 1.4 2.1
963.0
zRelative amounts of volatile compounds were calculated as the ratio between each sample peak area to the peak area of the internal standard.
yLabel=peak name, used in canonical plots (Figures 23, 26, 29) . "Unpackaged strawberries.

119
stored under modified atmosphere packaging conditions.
The total relative amount of volatile compounds, total relative
amount of groups of various volatile compounds and relative amounts
of individual volatile compounds extracted for each treatment at
each storage time were examined. In general, the total amount of
volatile compounds extracted from strawberries stored under MAP
conditions was lower than that for unpackaged strawberries (Figure
13). There was no particular trend for relative amounts of
individual and group volatile compounds from the strawberries held
under different MAP conditions. However, the relative total amount
of butanoates for strawberries kept under MAP conditions was lower
than that for unpackaged strawberries (Figure 14). Other
researchers including Guadagni et al. (1971), Lidster et al. (1983)
and Willaert et al. (1983) found volatile compound synthesis to be
diminished in apples stored under high C02 and low 02 levels. De
Pooter et al. (1987) concluded that the reduced volatile synthesis
in 'Golden Delicious' apples under CA storage could be attributed
to the interference with the carboxylic acid metabolism and alcohol
dehydrogenase activity.
4.10 Multivariate statistical analyses of sensory and volatile
data.
4.10.1 Simple correlation of odor attributes with volatile data.
Data from the different MAP treatments and storage time were
combined and subjected to correlation and regression analyses. The
correlation and regression analyses were applied to data on the

120
O >
c 3 O E a
« o •* V > a v
14.0O
1 1.60
9 . 2 0
6 .80
4 . 4 0
2 .00
H— Unpackaged
0 3 6
Days in s to rage
p - - A - - Air
— o — Mixed gas
-•+•••• Carbon dioxide
10
Figures 13- Relative total amounts of volatile compounds extracted from strawberries stored under various MAP conditions for 10 days at 1°C.
03
a o c (0
• * -a .a
c 3 o E a
>
6 .00
4 . 8 0
•ft 3 . 60 -
2.40 -
1.20
0 .00
— i — Unpackaged
- -A - - Air
— o — Mixed gas
••••+•••• Carbon dioxide
0 3 6
Days in storage
10
Figures 14. Relative total amounts of butanoates extracted from strawberries stored under various MAP conditions for 10 days at 1°C.

121
sensory attributes of strawberry odor, off-odor, fermented odor and
musty odor, overall fruit quality as well as relative amounts of
volatile compounds. The other sensory attributes such as texture,
sweetness, sourness and bitterness were omitted since they are
related to nonvolatile constituents (Spencer et al. 1978).
Correlation coefficient analysis was carried out in an attempt
to reveal any volatile compounds that may have a strong
contribution or correlation with desirable or undesirable odor
attributes. Reasonably high significant correlations were obtained
between some of the sensory attribute scores and the relative
amounts of strawberry volatile compounds detected by GC. Table 2 6
shows that the relative amounts of some volatile compounds were
positively correlated to desirable strawberry odor and overall
quality for strawberries under MAP conditions. These compounds
included methyl butanoate, butyl butanoate, 3-hexenyl acetate and
hexyl butanoate. Further, these compounds were negatively
correlated to the undesirable attributes. Compounds positively
correlated to the undesirable attributes (off-odor, fermented odor
and musty odor) but negatively to desirable attributes were 1-
methylethyl hexanoate, methyl heptanoate, 3,7-dimethyl-1,6-
octadien-3-ol, ethyl heptanoate, octyl acetate and the unknown. It
appears that the presence of these compounds may have contributed
to undesirable attributes detected by the judges among the
different treatments. However, the chemical changes taking place
in strawberries stored under MAP conditions may be due to more than
one volatile compound (Powers, 1982). Therefore, a number of

Table 26. Correlation coefficients (r) between sensory attributes and quantity of volatile peaks (relative amounts of volatile compounds, n=108) .
Label2 Volatile compound
b g h
i k m 0
P q
r s u V
w X
y
Methyl butanoate Pentyl acetate 2-methyl-l-butyl acetate 2-octanone Butyl butanaoate 3-Hexenyl acetate 1-Methylethyl hexanoate Methyl heptanoate 3,7-Dimethyl-l,6-octadien-3-ol Ethyl heptanoate Hexyl butanoate Octyl acetate sec-Octyl acetate Hexyl hexanoate Octyl propionate Unknown
Correlation
OVQy
0.31***x
-0.13
-0.32*** -0.18 0.33*** 0.32***
-0.44*** -0.20*
-0.57*** -0.57*** 0.23**
-0.28* 0.27** 0.14 0.17
-0.47***
SOD
0.41*** -0.22*
-0.34*** -0.19* 0.39*** 0.35***
-0.40*** -0.18
-0.54*** -0.54*** 0.35***
-0.31*** -0.19 0.20* 0.23*
-0.47***
coefficients(r)
OFD
-0.40*** 0.21*
0.34*** 0.22*
-0.35*** -0.38*** 0.49*** 0.49***
0.64*** 0.64***
-0.36*** 0.33*** 0.16
-0.28** -0.23* 0.40***
FMT
-0.31*** 0.12
0.24* 0.03
-0.29** -0.29** 0.43*** 0.43***
0.53*** 0.55***
-0.22* 0.11 0.15
-0.20* -0.19* 0.40***
MST
-0.36** 0.15
0.29** 0.21
-0.31** -0.36*** 0.43*** 0.43***
0.62*** 0.59***
-0.30** 0.33** 0.20*
-0.24* -0.18 0.40***
zLabel=peak name, used in canonical plots (Figures 23, 26, 29) . yOVQ=overall quality; SOD=strawberry odor; OFD=off-odor; FMT=fermented odor; MST=musty odor, x***^**^* significantly different at 0.1, 1 and 5% level

123
volatile compounds may have had a cumulative effect in the
perception of desirable or undesirable attributes by the judges.
4.10.2 Multiple regression of odor attributes with volatile data.
Multiple regression analysis was performed to: a) determine the
relationship between sensory scores and relative amounts of
volatile compounds obtained from strawberries stored under MAP and
b) predict the sensory quality of strawberries from the data of
relative amounts of volatile compounds. Regression could aid in
reducing the data set and elucidating important quality-determining
volatile compounds (Leland et al. 1987). Also, one can evaluate
the contribution that each variable makes to the regression of the
dependent variable on the independent variables (Pino, 1982;
Powers, 19 82) .
Multiple regression models were developed by regressing all the
data on relative amounts of volatile compounds, and by the use of
forward stepwise regression on the odor attributes to select
variables of importance for the sensory attributes (SAS, 1985).
Table 27 shows a summary of multiple regression of all 25 volatile
compounds to predict odor scores as well as subsets obtained by
stepwise regression. The R2 indicates that the volatile compounds
could explain up to 70% of the variance of the sensory attributes,
when all of the data for the volatile compounds were used in the
regression for each sensory attribute. With different sensory
attributes, forward stepwise regression selected between 6 to 9
volatiles and on average accounted for 65% of the variance. Higher
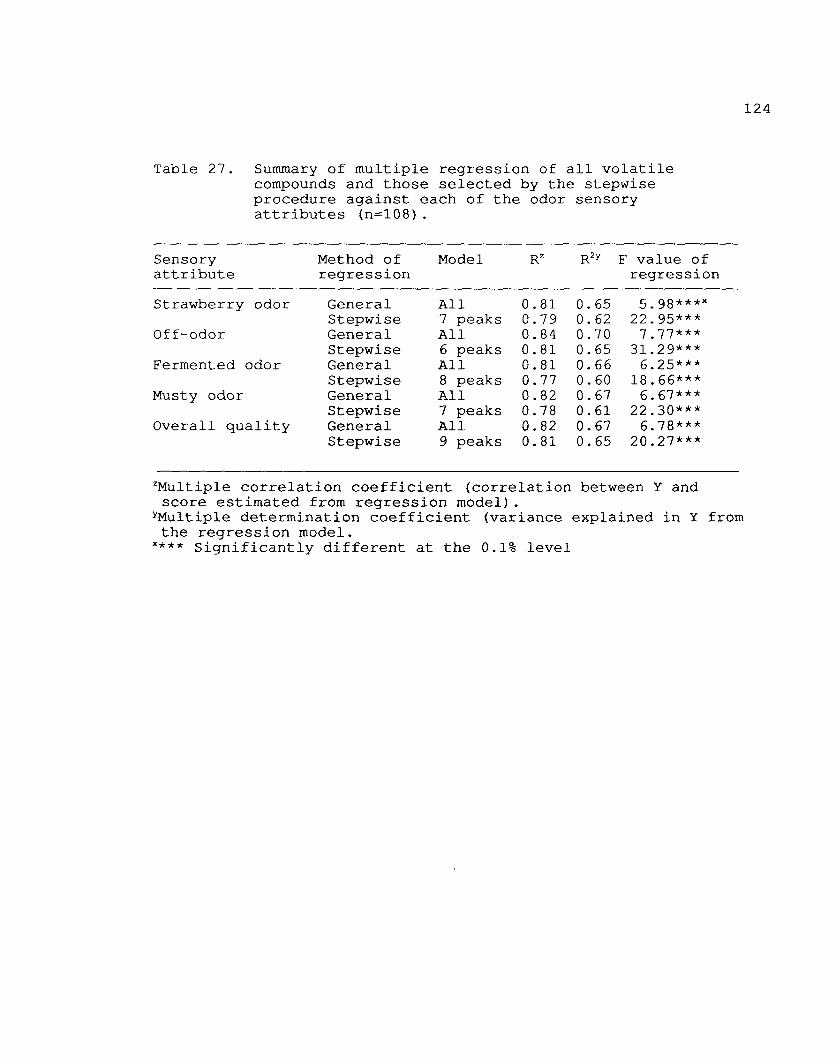
Table 27. Summary of multiple regression of all volatile compounds and those selected by the stepwise procedure against each of the odor sensory attributes (n=108).
Sensory attribute
Strawberry odor
Off-odor
Fermented odor
Musty odor
Overall quality
Method of regression
General Stepwise General Stepwise General Stepwise General Stepwise General Stepwise
Model
All 7 peaks All 6 peaks All 8 peaks All 7 peaks All 9 peaks
Rz
0.81 0.79 0.84 0.81 0.81 0.77 0.82 0.78 0.82 0.81
R2y
0.65 0.62 0.70 0.65 0.66 0.60 0.67 0.61 0.67 0.65
F value of regression
5.98***x
22.95*** 7.77*** 31.29*** 6.25*** 18.66*** 6.67***
22.30*** 6.78***
20.27***
zMultiple correlation coefficient (correlation between Y and score estimated from regression model).
yMultiple determination coefficient (variance explained in Y from the regression model. **** Significantly different at the 0.1% level

125
variance was explained when all the variables were used in the
regression. Therefore, for modelling and subsequent analysis, the
25 volatile compounds and some of the subsets from stepwise
regression were used. Such information would be valuable in
assessing the value of relative amounts of selected volatile
compounds as indicators of quality changes of the strawberries
stored under MAP. Table 2 8 shows the regression equations
developed from data for selected volatile compounds by stepwise
regression for predicting odor sensory attributes and overall
quality. Figure 15 shows the observed and predicted values of
overall fruit quality from volatile compounds selected by stepwise
regression (based on the equation in Table 28) . Data from the
following volatile compounds were included in the equation: ethyl
butanoate; 1-methylpropyl butanoate; 1-hexenyl acetate; 3-
methylethyl hexanoate; 3,7-dimethyl-l,6-octadien-3-ol; hexyl
butanoate; sec-octyl acetate; octyl 2-propionate and the unknown.
4.10.3 Preliminary data analysis with principal component and
discriminant analysis.
All GC data collected at each storage time from each treatment
were subjected to principal component analysis and discriminant
analysis. The scores of the first two principal components and
first two canonical variates were plotted, to aid in interpretation
of data. It was impossible to develop a clear picture of the
behavior of the different treatments at various storage times with
changes in gas composition from Figures 16 and 17. Therefore, the

126
Table 28. Regression equations developed from data for volatile compounds selected by stepwise regression regressed against each of the odor attributes (n=108) .
SODz= 4.328 + 0.002*cY + 0.085*k + 0.079*m - 0.393*q - 0.068*s - 0.127*t - 0.391*y
OFD = 3.458 - 0.004*c - 0.079*k - 0.073*m + 0.598*q + 0.090*r + 0.464*y
FMT = 2.011 - 0.003*c - 0.018*d - 0.073*k - 0.050*m + 0.145*o + 0.414*q + 0.102*s + 0.216*y
MST = 3.034 - 0.004*c - 0.090*k - 0.100*m + 0.776*q + 0.085*s + 0.156*t - 0.255*y
OVQ = 4.328 + 0.003*c + 0.137*k + 0.149*m - 0.190*0 - 0.450*q - 0.276*s - 0.230*v + 0.177*x - 0.354*y
ESOD=strawberry odor; OFD=off-odor; FMT=fermented odor; MST=musty odor; OVQ=overall fruit quality.
yVolatile compounds listed in Table 22.

127
0 1 2 3 4 5 6 7 8
Overall quality score
Figure 15. Predicted and observed scores of overall quality of strawberry fruit stored under MAP for 10 days using nine volatile compounds selected by stepwise regression.

128
4
£ 0
-1 -
-2 -2
M
M MC
* B
b
K g 4 1 K
K C
H
*k„ K M ^ | Ju^J M
H
Hff M H
BJ M M I B A
G %SL*\* F F F A B % B
E
F
0 1 4
Principal component 1
Figure 16. Principal component scores obtained from PCA of 25 volatile compounds from all strawberry samples evaluated from different treatments and storage times (A=samples evaluated at day 0; B, C, D=unpackaged samples; E, F, G=samples packaged in air; H, I, J=samples packaged in mixed gas, K, L, M=samples packaged in carbon dioxide and evaluated at days 3, 6 and 10, respectively).

129
6 F
4 -
2 -
•= 0 -
-2 -
-4 -
-6
L
» «
D \
^bo D
L
L ^ M
L M M M
M K C K
E H M K K
EE H
t£ H K K
\B B I'm J K
K
F F ^ n « G G d Jj
F F f
G G J
G
-10 -5 0 10
Canonical varlate 1
Figure 17. Canonical variate scores obtained from CVA of 25 volatile compounds from all strawberry samples evaluated from different treatments and storage dates (A=samples evaluated at day 0; B, C, D=unpackaged samples; E, F, G=samples packaged in air; H, I, J=samples packaged in mixed gas, K, L, M=samples packaged in carbon dioxide and evaluated at days 3, 6 and 10, respectively).

130
data were divided into different groups based on storage time and
re-analyzed by the same statistical procedures to indicate how
relative amounts of selected volatile compounds could be used as
indicators of the quality changes taking place in the strawberries
stored under various MAP conditions.
4.10.4 Principal component analysis (PCA) of volatile data.
Principal component analysis was first used to: a) examine the
data for interpretable patterns; b) transform and reduce the amount
of data; c) determine which volatile peaks correlated well with
each other and d) determine the relationship of a volatile compound
with overall fruit quality. The data from each treatment based on
storage time at 1°C, were analyzed. At each storage time, five
principal components (PC) with eigenvalues greater than 1.0 and %
cumulative proportion (variance explained) of 84, 86 and 86% for
day 3, 6 and 10 samples were obtained, respectively (Table 29) .
Therefore, the information contained for the 25 volatile compounds
(variables) was contracted (reduced) into five principal components
(PC) with only 14-16% loss of information at each storage time.
Figures 18, 19 and 2 0 show plots for the first two principal
components for strawberries that had been in storage for 3, 6 and
10 days at 1°C. At all storage times, PCA failed to separate the
data for different treatments into distinct groups or form some
interpretable pattern in the distribution of data for the different
samples. Although data for some samples from different treatments
showed some groupings, interpretation was difficult. Headley and

131
Table 29. Principal component analysis of strawberry volatiles analyzed after 3, 6 and 10 days.
Days in Principal Eigenvalue % Proportion % Cumulative storage component contribution proportion
3 1 7.1 28 28 2 6.2 25 53 3 3.9 16 69 4 2.4 9 78 5 1.5 6 84
1 8.7 35 35
2 5.4 21 56 3 3.4 14 70 4 2.3 9 79 5 1.6 6 86
10 1 8.0 32 32 2 6.2 25 57 3 3.6 15 72 4 2.2 9 81 5 1.3 4 86

132
C\j
CM
c Q) C O
a E o o
13 CL O
Q_
2 -
0 -
-1 -
-2 -2 •1 0 1
Principal component 1 (28%)
Figure 18. Principal component scores of strawberry samples evaluated at day 0 (F) and from different treatments (unpackaged=U; air=A; mixed gas=M; carbon dioxide=C) evaluated after 3 days in storage at 1°C.

1 3 3
CTS
CM -+-• c 0 c O Q. E o o
Q. o c
0 h
£ "1 *-
-2 •1 0 1
Principal component 1 (35%)
Figure 19. Principal component scores of strawberry samples evaluated at day 0 (F) and from different treatments (unpackaged=U; air=A; mixed gas=M; carbon dioxide=C) evaluated after 6 days in storage at 1°C.

134
2 -
1 -
0
-2 1 0 1 2
Principal component 1 (32%)
Figure 20. Principal component scores of strawberry samples evaluated at day 0 (F) and from different treatments (unpackaged=U; air=A; mixed gas=M; carbon dioxide=C) evaluated after 10 days in storage at 1°C.

135
Hardy (1989) successfully applied PCA in their classification of
different whiskies varying in composition of 48 volatile compounds
as a result of dilution, blending or contamination. Kwan and
Kowalski (1980) applied PCA to determine the consistency of
individual judges and uniformity among them during the evaluation
of wines. However, Aishima (1979a,b) found that the scattergrams
from PCA could not be used to discriminate 8 brands of soy sauce,
but instead, successfully applied discriminant analysis on the
principal components obtained from PCA. Heymann and Noble (1989)
reported that PCA is not a very useful technique in classification
of samples but is valuable in the initial examination of data and
to detect data containing outliers.
4.10.5 Discriminant/Canonical variate analysis of volatile data.
Because of the failure of PCA to classify or give some kind of
interpretable pattern from the GC data, multiple discriminant
analysis was applied. The GC data for 25 selected volatile
compounds (Table 22) as well as volatile compound data subsets
obtained after stepwise discriminant analysis (Table 30) were used
in an attempt at classification. Multiple discriminant analysis
was used to find the function which would be able to best separate
samples into predetermined groups by maximizing intergroup
distances while minimizing within group distance (Jeltema et al.
1984). Leland et al. (1987) used discriminant analysis to build
and assess classification models of milk samples subjected to
different oxidation levels. The objective of using discriminant

136
Table 30. Strawberry volatile compounds selected by stepwise discriminant analysis for inclusion into models to predict the treament and/or quality category.
Days in Label3 Selected volatile compound F ratio
a d k m P q t X
b e f h J 1 m n P r X
a e g m P
Ethyl propionate Butyl acetate Butyl butanoate 3-Hexenyl acetate Methyl heptanoate 3,7 Dimethyl-1,6-octadien-3-ol Ethyl octanoate Octyl propionate
Methyl butanoate Ethyl 1-methylbutanoate 2-Methylethyl butanoate 2-Methyl-l-butyl acetate Methyl hexanoate Ethyl hexanoate 3-Hexenyl acetate 2-Hexenyl acetate Methyl heptanoate Ethyl heptanoate Octyl acetate
Ethyl propionate Ethyl 1-methylbutanoate Pentyl acetate 3-Hexenyl acetate Methyl heptanoate
to enter
22.3***b
27.4*** 23.8*** 17.4*** 16.1*** 28.2*** 16.6*** 19.4***
43.2*** 63.9*** 53.1*** 53.1*** 52.8*** 46.0*** 52.9*** 54.3*** 53.8*** 48.2*** 52.7***
27.6*** 38.7*** 38.9*** 26.2*** 30.8***
z*** Significantly different at the 0.1% level YLabel=peak name, used in canonical plots (Figures 23, 26, 29) .

137
analysis in this research was to classify the chromatograms into
groups corresponding to the different treatments and/or quality of
strawberries stored under MAP.
For all three storage times, the multivariate statistic of
Wilk's lambda from canonical variate analysis (CVA) indicated
highly significant differences between the treatments (Table 31).
The strawberries from different MAP treatments for each storage
time differed significantly, based on the relative amounts of all
volatile compounds extracted from each sample. From these
statistical tests, however, it was not possible to determine which
sample treatments differed from one another nor was it possible to
tell which volatile compounds were of importance. Therefore,
results from canonical variate analysis (CVA) at each storage time
were examined.
For the three storage times, the first three canonical variates
constructed from the 25 volatile compounds accounted for 95, 97 and
94% of the total variance for day 3, 6 and 10, respectively (Table
31) . In each case, all the canonical variates were highly
significant with most of the variance being explained
by the first three. Therefore, further discussion will be limited
to these three variates.
Figures 21 and 22 show the plots of the first two and first
three canonical variates of individual observations from each
sample treatment after 3 days in storage. Three distinct groups
were formed with group 1 containing strawberries evaluated at day
0 (F) and unpackaged strawberries from day 3 of storage (U) . Group

138
Table 31. Canonical variate analysis of strawberry volatiles evaluated at days 3, 6 and 10
Days in Wilk's2 Canonical Canonical Eigen Signif.Y Variance storage lambda variate correlation value level explained
(%)
10
1 2 3
1 2 3
1 2 3
0.984 0.961 0.939
0.998 0.995 0.980
0.984 0.968 0.958
30.9 11.9 7.5
204.2 91.0 24.9
30.1 15.0 11.2
* ** * ** ***
***
*** ** *
***
* * * ***
58 81 95
62 90 97
50 75 94
M u l t i v a r i a t e s t a t i s t i c . y***f**f* s i g n i f i c a n t l y d i f f e r e n t a t t h e 0 . 1 , 1 and 5% l e v e l ,
r e s p e c t i v e l y . x S i g n i f i c a n c e l e v e l .

139
10
I- c
•5 0
-5
-10
o
c
-10
M M
^ MM
A AA
A A
0
BFiy u^¥ip
F
F
FU
10
Canonical variate 1 (58%)
Figure 21. Canonical plot of the first two canonical variates for strawberries evaluated at day 0 (F) and from different treatments (unpackaged=U; air=A; mixed gas=M; carbon dioxide=C) evaluated after 3 days in storage at 1°C.

140
Figure 22. Canonical plot of the first three canonical variates for strawberries evaluated at day 0 (F) and from different treatments (unpackaged=U; air=A; mixed gas=M; carbon dioxide=C) evaluated after 3 days in storage at 1°C.

141
2 contained strawberries packaged in air (A) and those in mixed gas
(M) , while group 3, which was clearly separated, represented
strawberries packaged in carbon dioxide (C). Examination of the
Mahalanobis distances (probabilities) showed that all the sample
centroids, except those of day 0 (F) and unpackaged strawberries
after 3 days of storage were significantly different (Table 32).
The first canonical variate separated the unpackaged and MAP
packaged strawberry samples (Figure 21). The data for treatments
of packaged strawberries with air (A) , mixed gas (M) and carbon
dioxide (C) as input gases are located on the left-hand side of the
plot. Data for the other two unpackaged samples evaluated at day
0 and after 3 days of storage are located on the right-hand side of
the plot. The second canonical variate separated the data on
strawberries packaged in carbon dioxide from the data for all other
samples. This separation was based on quality ratings of
strawberries after 3 days of storage at 1°C. All samples, except
those treated with carbon dioxide, were still acceptable with an
overall fruit quality rating greater than 3 (sensory data in Tables
6, 7, 8) .
The failure of canonical variate 1 to separate the data for
samples evaluated at day 0 (F) and data for unpackaged strawberries
at day 3 of storage (U) could be attributed to the fact that few
quality changes would have occurred in the unpackaged strawberries
during that time interval. Sensory data for overall fruit quality
shows that the scores for strawberries at day 0 and unpackaged
strawberries evaluated at day 3 were close (Table 8). Although

142
Table 32. Mahalanobis2 distances between different strawberry treatments analyzed by canonical variate analysis using 25 volatile compounds.
Days in
StOTaye
3
6
10
F U A M C
F U A M C
F U A M C
Cent
F y
0 4.7
11.8***x
11.1*** 13.5***
0 22.3*-** 14.8*** 20.8*** 39.0***
0 12.2*** 10.6*** 12.5*** 15.7***
roids (means) o
U
0 11.7*** 10.9*** 13.4***
0 26.9*** 22.3*** 30.1***
0 10.2*** 9.2***
12.0***
if strawberry
A
0 8.5***
10.7***
0 23.5*** 33.1***
0 6.4*
12.2***
treatments
M
0 g_ g***
0 32.6***
0 11.3***
C
0
0
0
Generalized distance calculated from discriminant function. yF=day 0 samples; U=unpackaged samples; A, M, C=MAP samples held in air, mixed gas and carbon dioxide, respectively.
x***,**,* Significantly different at the 0.1, 1 and 5% level, respectively.

143
examination of Figure 21 shows that data for air and mixed gas
treated samples were grouped together, inclusion of the third
canonical variate in the plot (Figure 22) revealed that the data
for these sample treatments were different. The plot confirms the
significant difference as indicated by the Mahalanobis results
(Table 32). However, the overall fruit quality ratings were not
significantly different (Table 8) . Except for carbon dioxide
treated samples, data for all other treatments were located in the
lower part of the plot by the second canonical variate. The C02
and 02 levels in pouches with fruit treated with air and mixed gas
were still within tolerance levels for strawberries (Table 9) .
Brecht (1980) and Kader et al. (1989) reported that strawberries
can tolerate 02 levels as low as 2% and C02 levels as high as 20%.
These levels had not yet been reached in the microatmosphere of the
air- and mixed gas-treated samples. The depletion of 02 and
increase of C02 have been attributed to the deterioration in fruit
quality under CA/MA storage (El-Kazzaz et al. 1983). The 100% C02
treatment which is highly abusive, must account for the rapid
quality change of strawberries within 3 days of storage and clear
separation by CVA of these treated strawberries. Smith (1963)
reported that very high levels of C02 lead to death of cell tissues
and thus poor fruit quality.
The canonical loadings of the first two canonical variates were
plotted in an effort to determine the volatile compounds that might
relate to the quality ratings of strawberry samples from the
different treatments. Figure 23 shows the projection of the

144
0.4
0.3 -
0.2 -
0.1 -
.= o.o -a c o § -0.1
-0.2 -
-0.3 -0.3 -0.2 -0.1 0.0 0.1 0.2
Canonical variate 1 (58%)
Figure 23. Projection of canonical loadings (correlations) of volatile data and centroid (mean) sample scores for strawberries evaluated at day 0 and strawberries from different treatments (unpackaged=U; air=A; mixed gas=M; carbon dioxide=C) evaluated after 3 days in storage at 1°C. (lower case letters stand for volatile compounds in Table 23).

145
canonical configuration (canonical loadings) spanned by the first
two canonical variates (axes) which contributed to 82%
discrimination between the samples that had been in storage for 3
days. The centroid (mean) of sample scores of the different
treatments are overlaid on the plot. It appears that separation of
the sample treatments based on MA packaging with regards to the
first canonical variate was by contrasting the volatile compounds
pentyl acetate (g), 2-methyl-1-butyl acetate (h), and the unknown
(y) for the day 0 (F) and unpackaged (U) strawberries, and the
volatile compounds methyl butanoate (b) , methyl hexanoate (j),
butyl butanoate (k) , and hexyl butanoate (s) for strawberries
packaged with air (A) , mixed gas (M) and carbon dioxide (C) as
input gas. Separation based on quality was achieved by the second
canonical variate with the discriminating variables being
contrasted between ethyl propionate (a), methyl heptanoate (p) and
ethyl heptanoate (r) against butyl acetate (d) , ethyl hexanoate
(1), 1-methylethyl hexanoate (o) , 3,7-dimethyl-l,6-octadien-3-ol
(q) and octyl acetate (u) (Table 22).
Figures 24 and 25 show the plots of the first two and first
three canonical variates, respectively, of the different treatments
after 6 days of storage at 1°C. More groups of the samples were
formed and this may be due to different levels of deterioration.
The Mahalanobis distance (their probabilities) shows that all the
sample centroids were significantly different from each other
(Table 32) . The first canonical variate separated the good and the
worst samples (carbon dioxide-treated samples). After 6 days in

146
20
10 -
0
-10 -
-20 -30 -20 -10 0 10 20
Canonical variate 1 (62%)
Figure 24. Canonical plot of the first two canonical variates for strawberries evaluated at day 0 (F) and from different treatments (unpackaged=U; air=A; mixed gas=M; carbon dioxide=C) evaluated after 6 days in storage at 1°C.

147
Figure 25. Canonical plot of the first three canonical variates for strawberries evaluated at day 0 (F) and from different treatments (unpackaged=U; air=A; mixed gas=M; carbon dioxide=C) evaluated after 6 days in storage at 1°C.

148
storage, the samples held in a high carbon dioxide microatmosphere
were deemed unacceptable (Table 8) while the other samples had
deteriorated to various degrees compared to the samples evaluated
at day 0. Except for the carbon dioxide treated samples, all
others samples were acceptable with an overall quality rating of 3
or greater (Table 8). Thus the first canonical variate separated
the unpackaged as well as air- and mixed gas-treated samples from
the carbon dioxide-treated samples based on the extent of their
level of deterioration. Overlaying the plot of canonical loadings
over the centroid (mean) of sample scores shows the volatile
compounds that were important in discriminating between the samples
(Figure 26). Separation of good samples from the worst samples was
a contrast between pentyl acetate (g) , 2-methyl-l-butyl acetate
(h) , 1-methylethyl hexanoate (o) , 3,7-dimethyl-l,6-octadien-3-ol
(q) and octyl acetate (u) for the good samples and methyl butanoate
(b), methyl haxanoate (j), 3-hexenyl acetate (m) , hexyl butanoate
(s) and hexyl hexanoate (w) for the worst samples.
Canonical plots of samples after 10 days in storage are shown
in Figures 27 and 28. Three distinct groups were formed by the
first two canonical variates. Since fruit undergoes natural
deterioration during storage, it is understandable that a clear
separation and classification by the first canonical variable of
samples evaluated at day 0 (F) and the unpackaged samples evaluated
after 10 days (U) occurred. The samples treated with the different
gases (air, mixed gas and carbon dioxide) were well separated from
day 0 samples by the second canonical variate. Although it appears

149
1.0
oo £J CM
(D
v_ Ctf >
o c o c o
0.5 -
0.0
-0.5 -0.2 -0.1 0.0 0.1 0.2
Canonical variate 1 (62%)
Figure 26. Projection of canonical loadings (correlations) of volatile data and centroid (mean) sample scores for strawberries evaluated at day 0 and strawberries from different treatments (unpackaged=U; air=A; mixed gas=M; carbon dioxide=C) kept in storage for 6 days at 1°C (lower case letters stand for volatile compounds in Table 23).

150
10
5 -
0 -
-5
•10
-15 -15 -10 0 10
Canonical variate 1 (50%)
Figure 27. Canonical plot of the first two canonical variates for strawberries evaluated at day 0 (F) and from different treatments (unpackaged=U; air=A; mixed gas=M; carbon dioxide=C) evaluated after 10 days in storage at 1°C.

151
Figure 28. Canonical plot of the first three canonical variates for strawberries evaluated at day 0 (F) and from different treatments (unpackaged=U; air=A; mixed gas=M; carbon dioxide=C) evaluated after 10 days in storage at 1°C.

152
that the packaged samples did not separate from each other, the
Mahalanobis distance probabilities of the centroids are
significantly different (Table 32) . The difference in grouping of
strawberries stored under MAP and those unpackaged after 10 days of
storage seem to indicate different forms of deterioration. The
deterioration of unpackaged samples may be attributed to molds
since the strawberries were almost entirely covered by fungal
mycelia by the tenth day of storage (Sommer et al. , 1973; El-Kazzaz
et al. , 1983; Day et al., 1990) . On the other hand, deterioration
of MAP strawberries may have been due to anaerobic respiration
reactions because of high C02 (greater than 20%) and low 02 (less
than 2%) levels (Kader, 1980; Kader et al., 1989; Carlin et al.,
1990) .
High C02 and low 02 levels were determined in all of the
microatmosphere of packaged strawberries after ten days of storage
(Table 9) . All of the packaged fruit held for 10 days received low
sensory ratings for desirable attributes and high ratings for
undesirable attributes (Tables 6, 7, 8) . The overall quality
ratings for the MAP packaged fruit were low (close to or less than
3) . Fruit packaged with air, mixed gas and carbon dioxide as input
gases may have had similar types and amounts of volatile compounds.
The relative amounts of volatile compounds were overlaid on the
plot of canonical loadings to elucidate the volatile compounds
aiding in discrimination (Figure 29). The day 0 samples (F) were
mainly discriminated by 1-methylethyl butanoate (e), methyl
heptaonate (p), hexyl hexanoate (w) and the unknown (y), and the

153
0.3
m CM
CvJ
(D -4-<
cd >
a c o c
o
0.2 -
0.1 -
0.0
-0.1 -
-0.2 ^ -0.4 -0.3 -0.2 -0.1 0.0 0.1 0.2
Canonical varlate 1 (50%)
0.3
Figure 29. Projection of canonical loadings (correlations) of volatile data and centroid (mean) sample scores for strawberries evaluated at day 0 and strawberries from different treatments (unpackaged=U; air=A; mixed gas=M; carbon dioxide=C) kept in storage for 10 days at 1°C (lower case letters stand, for volatile compounds in Table 23).

154
other samples by methyl butanoate (b), butyl acetate (d), pentyl
acetate (g) , 1-methylethyl-l-butyl acetate (o), 3,7-dimethyl-l,6-
octadien-3-ol (q) and ethyl heptanoate (r).
Using multiple discriminant/canonical variate analysis, it was
possible to follow the changes in quality of strawberries held
under different MAP conditions during storage at 1°C. The changes
in C02 and 02 levels with storage time may have influenced the
volatile profiles of MAP fruit with the consequence of deteriorated
samples possessing similar volatile compounds.
4.11 CONCLUSIONS
Liquid-liquid extraction, steam distillation extraction and
dynamic headspace extraction were evaluated for the removal of
volatile compounds from fresh strawberries. Headspace extraction
of the volatile compounds by Tenax GC followed by solvent
desorption was found to be most appropriate for removal of volatile
compounds from strawberries. Most of the fifty volatiles extracted
by the dynamic headspace technique onto the adsorbent Tenax GC were
separated and identified by gas chromatography/mass spectrometry
(GC/MS) as esters. The changes in amounts of volatile compounds in
strawberries packaged in pouches flushed with different gases were
found to depend on the treatment and storage time. Total relative
amounts of volatile compounds and total amount of butanoates from
strawberries stored under different MAP conditions were low
compared to amounts for unpackaged strawberries. Simple pairwise
correlations of volatile compounds and odor attributes indicated

155
that methyl butanoate, butyl butanoate, and hexyl hexanoate were
positively correlated with strawberry odor and overall quality but
negatively correlated with undesirable attributes. The undesirable
attributes (off-odor, fermented odor and musty odor) were
positively correlated with 2-methyl-1-butyl acetate, 1-methylethyl
hexanoate, 3,7 dimethyl-1,6-octadien-3-ol, ethyl heptanoate, octyl
acetate and an unknown. The volatile compounds listed above were
negatively correlated with desirable attributes. Multiple
regression of 25 selected volatile compounds with the odor
attributes accounted for up to 70% of the variation, while stepwise
regression selected between 6 and 9 variables with up to 65% of
variance being explained.
From the results of multiple discriminant/canonical variate
analysis, it was possible to follow the changes in quality of
strawberry fruit held under different gases during storage at 1°C.
The data for 25 selected volatile compounds from untreated and gas-
treated samples were subjected to discriminant/canonical variate
analysis (CVA). At each storage time, CVA was used to classify the
samples according to treatment and/or quality as evaluated by a
sensory panel. Sensory data for MAP strawberries in air and mixed
gas (3 days of storage), unpackaged fruit (3 days of storage) and
fresh strawberries evaluated (day 0) were separated by canonical
variate 2 from data for samples that had been held in carbon
dioxide (100% C02) . After 10 days in storage, all MAP strawberries
were classified in close proximity, with the indication that
quality attribute scores of the strawberries were low. This loss

156
in quality can be attributed to elevated C02 and lower 02 levels in
the microatmospheres of packaged strawberries. Canonical variate
analysis of the data on the volatile compound contents in
strawberry samples could be valuable in monitoring quality and
supplementing the sensory evaluation of fruit stored under various
conditions. Compared to principal component analysis (PCA),
canonical variate analysis appeared to provide some clear
classification of strawberry samples based on treatment and/or
quality of the fruit stored under modified atmosphere conditions.

157
5.0 Part 3. Quality Attributes of Strawberry Cultivars Grown in
British Columbia (B.C.)
5.1 INTRODUCTION
Under British Columbia (B.C.) growing conditions, selected
strawberry cultivars produce high quality fruit with attractive
aroma, flavor, color and textural features (Daubeny, 1979).
Generally, selection of acceptable strawberries is based on fruit
yield, plant growth characteristics and fruit quality (Sistrunk and
Moore, 1971) . Sensory attributes are important aspects of fruit
quality. Sensory attributes, such as color, texture, odor and the
balance between sweetness and sourness have been identified as
important determinants of overall quality of strawberry fruit (Luby
et al., 1987; Pritts et al. , 1987; Wang and Dale, 1990). Since
many sensory attributes can be determinants of overall quality, it
is desirable to identify those which are the most important.
Regression analyses have been used to identify major attributes
which contribute to fruit quality (Pino et al., 1986). Component
analysis was considered as a possible statistical procedure for
assessing attribute contributions to strawberry quality. Yield
component analysis has been used to partition yield components and
determine the proportion each measurable component contributes to
the total yield (Swartz et al. , 1985; Baumann and Eaton, 1986).
This method has not been used to determine differences among
cultivars with regard to the relative importance of specific
sensory attributes to the overall general quality assessment of the

158
fruit. Chemical factors such as pH, soluble solids, titratable
acidity and volatile compounds have been shown to be related to
overall quality assessment of fresh and frozen strawberry fruit
(Hirvi and Honkanen, 1982; Hirvi, 1983; Guichard and Souty, 1988;
Douillard and Guichard, 1990) . Cultivars vary in concentration of
specific volatiles commonly found in strawberry fruit such as
methyl butanoate, ethyl butanoate, methyl hexanoate and ethyl
hexanoate, fcrans-2-hexen-l-ol, trans-2-hexenal and 2,5-dimethyl-4-
methoxy-3 (2if) furanone (Schreier, 1980; Douillard and Guichard,
1989). Volatile compounds have been used to classify cultivars
into different groups (Douillard and Guichard, 1989; 1990), and are
also related to sensory data for strawberry cultivars (Hirvi,
1983) .
The objectives of this study were to: a) evaluate sensory
attributes of fruit quality and to determine their relative
importance in strawberry fruit grown in B.C., and b) to evaluate
the flavor volatile compounds of the cultivars for potential
classification.
5.2 MATERIALS AND METHODS
5.2.1 Strawberry samples
Five strawberry cultivars grown in B.C. were harvested at the
ripe stage in 1989 and 1990. The cultivars were 'Rainier',
'Redcrest', 'Selva', 'Sumas' and 'Totem'. 'Mrak' was also included
in 1990 for volatile compound analysis. 'Rainier' and 'Selva' are
used primarily for fresh market while the others are usually

159
processed. 'Selva' and 'Mrak' are day neutral cultivars which were
bred in California while the others are short day cultivars bred in
B.C., Washington or Oregon (Pacific Northwest). All the cultivars
were grown in hill rows and harvested on three dates within a 10
day period. Fruits from each cultivar were decapped and sorted for
uniformity in terms of moderate size, red color and touch-firmness.
5.2.2 Sensory and chemical evaluation
Quantitative descriptive analysis (QDA) was used for sensory
evaluation (Noble et al. 1984; Guinard and Cliff, 1987; Heymann
and Noble, 1987) . All analyses were carried out on the day of
harvest. Six judges, aged between 20-30 years (6 females, all
members of UBC Food Science Department), with sensory evaluation
experience were trained in descriptive evaluation of strawberries.
During the training sessions, the judges made suggestions and
established descriptive terms to characterize the various
strawberry cultivars. Replicated samples of each cultivar
consisting of eight berries were evaluated at each date for color,
texture, strawberry odor (in mouth), sweetness, sourness and
overall fruit quality. Evaluations of the coded berry samples by
the judges were made at a round table, under red lighting, with the
judges making independent judgements. Color evaluations were made
under normal lighting conditions. The judges used a 10 cm
unstructured line scale with anchored terms at both ends and
indicated the intensity of each attribute by placing a vertical
line on the scale. Quantitation of the results was achieved by

160
measuring the distance from zero to the vertical line. Water and
unsalted crackers were provided to the judges and used between
tasting of samples.
The fruit sample of 50-100 grams was blended in a Waring
blender (at room temperature) at low speed for 3 min in preparation
for determination of soluble solids, pH and titratable acidity.
The macerate was centrifuged at 10,000xg for 10 min at 1°C to
obtain a supernatant which was filtered thereafter with Whatman No.
4 filter paper. A few drops of the filtrate were placed on an Abbe
Mark II Refractometer (Cambridge Instrument, Buffalo, NY) to
measure the soluble solids. The pH was measured with a Fisher
Accumet pH meter Model 620 (Fisher Scientific Co., Ottawa, ON) .
Titratable acidity was measured by titrating diluted filtrate
(1:10) with 0. IN NaOH to pH 8.1 and calculated as citric acid
(g/lOOg sample). All measurements were made in duplicate.
5.2.3 Volatile compound analysis
For each of the six cultivars, volatiles were extracted by
purging the headspace gas of enclosed strawberries and trapping the
volatile compounds onto a porous polymer - Tenax GC (Dirinck et
al. , 1977; Olafsdorttir et al., 1985). Volatile compound analyses
for each cultivar were carried out in triplicate. The volatile
compound extraction procedure and analysis has been described in
the materials and methods section 3.4.3 - 3.4.5.

161
5.2.4 Statistical analyses
Data were analysed by analysis of variance of the date means,
preliminary analyses having showed no main effects of dates and few
interactions. Cultivar means were separated by • Fisher's
(protected) lsd (Steel and Torrie, 1980). The contributions of
several quality attributes to overall quality were assessed by two-
dimensional partitioning (TDP) of the total variation in the
overall quality assessment (Eaton et al., 1986). The quality
attributes were determined by the judges in the following arbitrary
sequence: color, texture, odor, sweetness, sourness and overall
quality. Orthogonalization of the attributes was carried out in
the same sequence. First, this sequence allowed the measurement of
the contribution, R2, of each variable to total variation in
overall quality after the contribution of preceding variables had
been taken into account. Second, a separate analysis of variance
was carried out on each of the orthogonal variates and the results
expressed as a further subdivision of the R2 values.
Canonical variate analysis (CVA) was applied to the selected 25
volatile compounds to differentiate and classify the six different
cultivars grown in B.C. (SAS, 1985; Liardon, et al. 1984;
SYSTAT/SYGRAPH, 1989) . Canonical variate analysis derives linear
combinations from the independent variables measured and the
discriminant functions obtained are used to classify samples to
prior defined groups (Dillon and Goldstein, 1984) .

162
5.3 RESULTS AND DISCUSSION
5.3.1 Sensory evaluation of strawberry cultivars.
Of the five cultivars, 'Totem' was evaluated by the judges as
the deepest in red color and 'Selva' was the least red with the
others intermediate in color (Table 33) . The deep red color of
'Totem', rated highest by the judges, makes it a popular and
preferred cultivar by the processing industry. 'Redcrest' had the
firmest texture whereas 'Ranier' and 'Sumas' had the softest
texture. There were no significant differences in the intensity of
the strawberry odor among the five cultivars. 'Sumas' cultivar was
considered by the sensory panel to be the sweetest while
'Redcrest' was the least sweet (Table 33). Sensory panel results
indicated that 'Redcrest' had the highest sourness, while 'Selva'
and 'Sumas' were the least sour. Although 'Redcrest' was evaluated
by the judges as the most sour, it had significantly higher soluble
solids and a more favorable ratio of sugars to titatrable acidity
(Hirvi, 1983) than all other cultivars (Table 34). However,
'Redcrest' also had the lowest pH and a high titratable acidity,
which may have been responsible for the intense sourness detected
by the panelists. 'Selva' and 'Sumas' had the lowest titratable
acidity. 'Redcrest' was rated lowest in terms of overall quality
perhaps because of its' high level of sourness and limited
sweetness.
Correlation coefficients among the sensory attributes were very
low and several were very highly significant (Table 35). Sweetness
was positively correlated with strawberry odor (r=0.50) but

Table 33. Means of sensory attributes for strawberry fruit grown in British Columbia in 1989 and 1990.
Cultivar Sensory attributes
Ranier Redcrest Selva Sumas Totem
LSD
Color
6.1c 6.5bc 5.2d 6.9b 8.2a
0.7
Texture
4.6d 6. 6a 6.1b 4.6d 5.5c
0.7
Sody
4.7a 4.6a 4.2a 4.4a 4.7a
0.9
Sweet
4. lab 2.6c 4.0b 4.7a 4.2ab
0.9
Sour
5.0b 8.3a 3.8c 4.4c 5.0b
0.8
Overall quality
4.4a 3.1b 4.5a 4.8a 4.6a
0.9
zmeans in columns with different letters are significantly different at the 5% level. Means were seperated by LSD test.
ySod=strawberry odor.

164
Table 34. Mean2 soluble solids, pH, titratable acidity and sugar to acid ratio of strawberry cultivars grown in B.C.
Cultivar
Ranier Redcrest Selva Sumas Totem
LSD
Soluble solids (%)
7.6c 9.7a 7.8bc 7.7bc 8.4b
0.9
Chemical measurements
PH
3.32bc 3.18d 3.49a 3.24cd 3.35bc
0.10
Titratable acidity (g/100g)
1.07a 1.04a 0.92b 0.91b 1.07a
0.12
Ratio of so to
luble solids titratable
acidity
7.8b 9.1a 8.6ab 8.6ab 7.9ab
1.2
"means within columns with different letters are significantly different at the 5% level. Means separated by LSD test.
Table 35.
Sensory attributes
Color Texture Odor Sweetness Sourness Ovq
Correlation coeffients of sensory att strawberry fruit grown in BC in 1989
Correlat:
Color Texture
1.00 0.04 0.19***y
0.11* 0.03 0.18***
1.00 0.02 -0.20*** 0.31***
-0.06
Lon coefficients
Sodz Sweet
1.00 0.50*** 1.00
-0.03 -0.35** 0.50*** 0.64***
ributes of and 1990.
Sour Ovq
1.00 -0.28*** 1.00
zSod=strawberry odor; Ovq=overall quality. y***^*^* significantly different at the 0.1, 1 repectively.
and

165
negatively to sourness (r=-0.35) . Overall quality of the fruit was
positively correlated to strawberry odor (r=0.50) and sweetness
(r=0.64) but negatively correlated to sourness (r=-28).
5.3.2 Overall quality.
The overall quality of strawberry fruit was related to a number
of sensory attributes studied (Table 36). All the attributes only
accounted for 50% of the variation in overall quality. Odor
accounted for 23.9% and sweetness 17.7% of the total variation in
overall quality evaluations of the cultivars in the study. Color
of the fruit accounted for 4.1% and sourness contributed 2.9% to
the total sum of squares.
There were significant cultivar effects upon overall quality of
the fruit and upon all orthogonal variates except strawberry odor
(Table 36). Therefore, differences among the cultivars could
mainly be attributed to the differences in these orthogonal
components of sensory attributes. Judges were a significant source
of variation in all attributes except texture. It is not unusual
for judges to be a major source of variation in sensory evaluation
of products (Hall and Lingnert, 1984). Lack of agreement among
judges has been attributed to inconsistent use of the sensory terms
or use of different levels of the rating scale (Heymann and Noble,
1987) .
5.3.3 Strawberry volatile compound analysis.
Selected volatile compounds identified in strawberry cultivars

Table 36. Two-dimensional partitioning of the total sum of squares for overall quality (%) of five strawberry cultivars grown in B.C.
Source df Independent Dependent variables variable
Y J/Y R/J/Y C CY CJ/Y Error
Total
1 10 12 4 4
40 48
119
Col2
0.5*y
0.7*** 0.1 1.4*** 0.6*** 0.4 0.5
4.1*
Tex
0.1* 0.1 0.1** 0.3*** 0.1** 0.2 0.2
1.1
Sod
1.2 14.9*** 0.8 0.2 0.2 3.0 3.7
23.9***
Swt
0.1 8.2*** 1.0* 1.8** 0.4 4.3*** 1.8
17.7***
Sou
0.0 1.3*** 0.2* 0.3** 0.1 0.7*** 0.3
2.9
Res
2.6 11.3** 2.1 15.7*** 0.5 11.2 6.9
50.3
XX
-3.7 -6.4 4.1
-18.6 1.0 8.0 15.7
0.0
Ovq
0.8 30.1** 8.2 1.1** 3.0*
27.7* 29.1
100.0
zCol=color; Tex=texture; Sod=strawberry odor/ Swt=sweetness; Sou=sourness; Ovq=overall fruit quality; Res=residual; XX=compensation (product terms); Y=years; J=judges; C=cultivars; R=replicates; /=within; df=degrees of freedom.
y***,**,* Significant at the 0.1, 1 and 5% level, respectively. Significance in the rows refers to analysis of variance and in the total rows to regression analysis.

167
grown in B.C. are shown in Table 37. Most of the compounds
identified were esters of acetates, butanoates and hexanoates.
Similar volatiles have previously been identified in strawberrry
fruit (Schreier, 1980; Hirvi, 1983; Douillard and Guichard, 1990;
Honkanen and Hirvi, 1990). The relative amounts of each volatile
compound varied among the different cultivars with 'Mrak' and
'Selva' containing the highest relative total amounts. The
individual volatile compounds in relatively high amounts included
methyl and ethyl butanoates, methyl and ethyl hexanoates, 2-hexenyl
acetate, and ethyl heptanoate. Six of the compounds were
quantified in relatively high amounts (Figure 30). 'Mrak'
contained high relative amounts of methyl butanoate. Ethyl
butanoate was highest in 'Mrak', 'Selva' and 'Totem'. 'Mrak',
'Selva' and 'Sumas' had considerably higher relative amounts of
ethyl hexanoate than 'Sumas' and 'Totem'. All the six cultivars
had high relative amounts of 2-hexenyl acetate, but 'Selva' had the
highest relative amount. Although the judges' results on
strawberry odor revealed non-significant differences among the
cultivars, volatile compound data indicates variation in the
relative amounts of the volatile compounds. Such differences could
be used to explain differences in the overall fruit quality of the
cultivars (Dirinck et al. 1981).
Canonical variate analysis (CVA) was applied to the 25 volatile
compounds to differentiate and classify the six different cultivars
grown in B.C. (Dillon and Goldstein, 1984; Heymann and Noble,
1989) . The first four canonical variates (CV) obtained were highly

Table 37. Relative amounts2 of selected volatile compounds of six strawberry cultivars grown in B.C.
Label Volatile compound Relative amounts of volatiles (xlO 2)
Mrak Ranier Redcrest Selva Sumas Totem
ay
b c d e f g h i J k 1 m n 0
P q
r s t u v w X
y
Ethyl propionate Methyl butanoate Ethyl butanoate Butyl acetate Ethyl 1-methylbutanoate Ethyl 2-methylbutanoate Pentyl acetate 2-Methyl-l-butyl acetate 2-octanone Methyl hexanoate Butyl butanoate Ethyl hexanoate 3-Hexenyl acetate 2-Hexenyl acetate 1-Methylethyl hexanoate Methyl heptanoate 3,7-Dimethyl 1,6-octadien-3-ol Ethyl heptanoate Hexyl butanoate Ethyl octanoate Octyl acetate sec-Octyl acetate Hexyl hexanoate Octyl propionate Unknown
Total
4.0 36.6 118.7
8.8 24.2 27.3 8.4 4.3 2.3 41.3 6.5
158.4 4.4
100.0 3.6 0.6
7.1 14.1 4.9 2.6 3.7 12.7 0.9 2.1 2.3
601.9
3.6 13.0 28.2 1.5 2.4 4.8 6.9 3.6 3.2 45.6 0.2
75.9 5.4 61.0 6.0 1.0
10.1 21.2 1.3 1.1 1.1 3.8 0.2 0.3 1.6
306.8
4.4 14.9 47.1 3.3 3.4 1.1 6.1 3.6 4.0 12.2 0.8
27.6 7.4 80.0 9.9 0.6
4.6 17.3 2.2 2.3 1.0 7.4 1.1 0.7 2.6
269.6
3.6 9.7 84.4 14.6 9.4 7.7 9.5 6.0 2.4 30.1 4.3
199.5 9.5
150.9 2.5 0.6
10.3 15.7 3.0 2.7 6.0
21.9 1.6 1.8 3.0
613.4
7.8 2.6 33.9 1.2 5.6 0.7 6.9 2.0 3.3
24.9 0.7
186.6 4.6
76.9 5.6 0.7
2.1 9.8 2.4 3.8 0.6 7.4 2.4 0.6 5.1
399.6
4.3 18.4 88.9 4.7 1.8 6.3 9.9 2.7 4.0 6.0 1.2 44.3 5.4 84.9 7.4 0.4
10.5 13.5 6.9 2.9 0.7 3.0 0.5 0.7 2.8
334.7
Calculated as the ratio between each peak to that of the internal standard. yLabel stands for identified volatile compound (used in Fig 32) .

CO w -J
< -J O >
Uu 0 CO \-z D o <
Hi >
< _J LU DC
2.10
1.68 -
1.26 -
0.84
0.42
0.00
Ethyl propionate
Ethyl butanoate
• Methyl hexanoate
Ethyl hexanoate
2-hexenyl aoetate
Ethyl heptanaote
MRA RAN RED SEL SUM TOT CULTIVARS
Figure 30. Relative amounts of some volatiles in six cultivars grown in B.C. (Mra=Mrak, Ran=Ranier, Red=Redcrest, Sel=Selva, Sum=Sumas, Tot=Totem).
IX)

170
significant and explained 97% of the variance, 85% of which was
explained by the first two variates (75% and 10% by the first and
second CV, respectively). The first canonical variate separated
and classified the cultivars into two main groups (Figure 31). One
group contained the cultivars 'Mrak' and 'Selva', both of which
originated from the breeding program of the University of
California, Davis. The second group contained the cultivars
'Rainier', 'Redcrest', 'Sumas' and 'Totem', all of which are
Pacific Northwest cultivars. A plot of the canonical loadings of
the flavor volatile compounds on the two variates (Figure 32)
showed that the volatile compounds that correlated well with the
first canonical variate and aided in separation of cultivars were
a contrast of 2-octanone and methyl hexanoate against butyl
acetate, ethyl 1-methylbutanoate, 2-methyl-l-butyl acetate, butyl
butanoate, 2-hexenyl acetate, octyl acetate, sec-octyl acetate and
octyl propionate. The cultivars from the California breeding
program were dominated by the latter group of volatile compounds.
Headspace flavor volatile evaluation and multivariate statistical
analysis such as CVA could aid breeders in the selection of new
cultivars that have desirable aroma during the varietal selection
program. The simple headspace procedure used in this reasearch has
the advatange of permiting determination of volatile compounds from
any sample size (Hirvi and Honkanen, 1982).
5.4 CONCLUSIONS
Cultivars grown in British Columbia differred significantly in

171
10
0 f-
-5
10 -15 -10 -5 0 10
Canonical variate 1 (75%)
Figure 31. Canonical plot of six strawberry cultivars grown in B.C. based on 25 selected volatile compounds. Letters stand for each cultivar: M=Mrak, R=Ranier, X=Redcrest, S=Selva, U=Sumas, T=Totem.

172
20
10 -
0
•10 -
-20
-30 t -40 -30 -20 10 0 10
Canonical varlate 1 (75%)
Figure 32. Projection of canonical loadings (correlations) of volatile data and centroid scores for strawberry cultivars grown in B.C. ((M=Mrak, R=Ranier, X=Redcrest/ S=Selva, T=Totem; lower case letters stand for volatile compounds listed in Table 39).

173
all sensory attributes except strawberry odor. 'Redcrest' was
lowest in overall fruit quality presumably, due to intense sourness
as related to low pH and high titratable acidity. Two-dimensional
partitioning (TDP), a statistical procedure originally used in
yield component analysis, showed that odor and sweetness were major
contributors to total variation of overall fruit quality.
Cultivars, judges and the cultivar by judge interaction also
contributed significantly to total variation. Although the judges
did not detect significant differences in strawberry odor among
cultivars, data showed that the cultivars differed in relative
total volatile compounds with 'Mrak' and 'Selva' containing the
highest amounts. The cultivars were classified into different
groups with CVA.

174
6.0 GENERAL SUMMARY OF THESIS RESULTS
Strawberries stored at 1°C for 10 days under modified
atmosphere package conditions in high barrier film pouches flushed
with either carbon dioxide (100 C02), mixed gas (11% C02 + 11% 02 +
78% N2) , or air were used to study changes in sensory attributes,
chemical properties and gas chromatographic data as indicators of
spoilage. The data collected was applied to multivariate
statistical techniques to analyze the multidimensional set of data.
From this study:
a) nearly all sensory attributes studied significantly differed
among the various treatments over storage time.
b) principal component analysis (PCA) of sensory attributes
indicated the changes among the various treatments over storage
time were a contrast of desirable and undesirable attributes.
c) packaged strawberries treated with air retained their desirable
attributes for longer storage times than those treated with mixed
gas or carbon dioxide.
d) most volatile compounds extracted from strawberry fruit by
dynamic headspace and identified by gas chromatography/mass
spectrometry (GC/MS) were esters.
e) some volatile compounds such as methyl butanoate, 1-methylethyl
hexanaote, 3,7 dimethyl-1,6-octadien-3-ol and ethyl heptanoate
correlated with odor attributes. Up to 70% of variation was
accounted for between odor attributes and the 25 selected volatile
compounds.
f) based on 25 selected volatile compounds, canonical variate

175
analysis (CVA) separated and classified the strawberries at each
storage time into different treatments and/or quality levels.
Therefore, CVA of chromatographic data together with sensory data
could be used to monitor quality changes in fruit stored under MAP.
g) increases in C02 levels and decreases in 02 levels initiated
development of undesirable attributes. Initial gas treatment with
high 02 of 21% (no C02) may be valuable in extending shelf life of
fruit stored under MAP. However, fungal growth may limit the
storage period of the strawberries.
In the last part of this research, strawberry cultivars from
two breeding regions were compared for sensory attributes, chemical
properties and gas chromatographic data.
From this study:
h) 'Redcrest' was rated lowest in overall fruit quality, probably
due to the cultivars' intense sourness, low pH and high titratable
acidity.
i) Two-dimensional partitioning (TDP) of sensory attributes showed
that the overall quality of strawberries was primarily dependent on
odor and sweetness level.
j) The cultivars differed in relative amounts of volatile
compounds, and canonical variate analysis classified the cultivars
according to the region in which they were bred.
FUTURE RESEARCH
a) Various polymeric films with varying gas permeability
characteristics, and different gas mixtures should be investigated

176
to increase the shelf life of strawberries under MAP.
b) To fully understand the volatile compounds causing the off-
odors, the mechanism of volatile synthesis in strawberry fruit
stored MAP should be investigated.

177
REFERENCES
Abeles, F.B. and Takeda, F. 1990. Cellulase activity and ethylene in ripening strawberry and apple fruits. Scientia Hort. 42:269-275.
Aishima, T. 1979a. Classification of soy sauce on principal components in gc profiles. Agric. Biol. Chem. 43:1905-1910.
Aishima, T. 1979b. Objective evaluation of soy sauce by statistical analysis of GC profiles. Agric. Biol. Chem. 43 :1935-1943.
Aishima, T. , Nagasawa, M. and Fukushima, D. 1979. Differentiation of the soy sauce by statistical evaluation of gas chromatographic profiles. J. Food Sci. 44:1723-1728.
Aishima, T. 1983. Comparison of headspace and distillation techniques for soy sauce aroma in relation to analysis by silica capillary gas chromatography and sensory evaluation. Agric. Biol. Chem. 46:69-77.
Arpia, M.L., Mitchell, F.G., Mayer, G. and Kader, A.A. 1984. Effects of delays in establishing controlled atmospheres on Kiwifruit softening during and following storage. J. Amer. Soc. Hort. Sci. 109:768-770.
Ballantyne, A. 1986. Modified atmosphere packaging of fruit and vegetables. In, Proceedings of the Second International Conference on Controlled/Modified Atmosphere/Vacuum Packaging. CAP 86:3-27.
Barmore, C.R. and Rouse, A.H. 1976. Pectinesterase activity in controlled atmosphere stored avocados. J. Amer. Soc. Hort. Sci. 101:294-296.
Barron, D. and Etievant, P.X. 1990. The volatile constituents of strawberry jam. Z. Lebensm. Unters. Forsch. 191:279-285.
Bartley, I.M. and Hindley, S.J. 1980. Alcohol dehydrogenase of apples. J. Exper. Bot. 31:449-459.
Bartley, J.P. and Schwede, A.M. 1987. Volatile flavor components in the headspace of the Australian or 'Bowen' mango. J. Food. Sci. 52:353-360.
Bartley, J.P. and Schwede, A.M. 1989. Production of volatile compounds in ripening Kiwi fruit {Actinidia chinensis) . J. Agric. Food Chem. 37:1023-1025.

178
Baumann, T.E. and Eaton, G.W. 1986. Competition among berries on cranberry upright. J. Amer. Soc. Hort. 11:869-872.
Bhowmik, S.R. and Sebris, C M . 1988. Quality and shelf life of individually shrink-wrapped peaches. J. Food Sci. 53:519-522.
BMDP. 1985. Statistical Software. University of California Press. Berkeley. CA.
Boehringer Mannheim Manual, 1989. D-Glucose/D-Fructose and Ethanol test kit. Boehringer Mannheim, Laval, PQ.
Bohling, H. and Hansen, H. 1983. Respiration of apples during storage as a function of different atmospheres and temperatures. Acta Hort. 138:93-105.
Brecht, P.E. 1980. Use of controlled atmospheres to retard deterioration of produce. Food Technol. 34(3):45-50.
Browne, K.M., Geeson, J.D. and Dennis, C. 1984. The effects of harvest date and C02-enriched storage atmospheres on the storage and shelf-life of strawberries. J. Hort. Sci. 59:197-204.
Burton, W.G. 1982. Biochemical and physiological effects of modified atmospheres and their role in quality maintenance. In, Post-Harvest Physiology of Food Crops. W.G. Burton (Ed.). London, pp. 97-109.
Buttery, R.G., Teranishi, R., Ling, L.C., Flath, R.A. and Stern, D.J. 1988. Quantitative studies on origin of fresh tomato aroma volatiles. J. Agric. Food Chem. 36:1247-1250.
Cabezudo, M.D., Polo, M.C., Herriz, M., Reglero, G., Gonzalez-Raurich, M., Caceres, I. and Martin-Alvarez, P. 1985. Using discriminant analysis to characterize Spanish white wines. In, The Shelf Life of Foods and Beverages. Proceedings of the 4th International Flavor Conference, Greece. Elsevier Science Publishers B.V. Amsterdam. The Netherlands, pp. 186-2 04.
Cappellini, M.C., Lachance, P.A. and Hudson, D.E. 1984. Effect of temperature and carbon dioxide atmospheres on the market quality of green bell peppers. J. Food Qual. 7:17-25.
Carlin, F., Nguyen-The, C. Hilbert, G. and Chambroy, Y. 1990. Modified atmosphere packaging of fresh, 'ready-to-eat' grated carrots in polymeric films. J. Food Sci. 55:1033-1038.
Chairote, G., Rodrigeuz, F. and Crouzet, J. 1981. Characterization of additional volatile flavor components of apricot. J. Food Sci. 46:1898-1906.

179
Crouzet, J., Signoret, A., Coulibaly, J. and Roudsari, M.H. 1985. Influence of controlled atmosphere storage on tomato volatile components. In, The Shelf Life of Foods and Beverages. Charalambous, G. (Editor). Elsevier Science Publshers B.V. Amsterdam. The Netherlands, pp. 355-367.
Dart, S.K. and Nursten, H.E. 1984. The changes in the volatile components of instant coffee with storage. In, Progress in Flavour Research. Proceedings of the 4th Weurman Flavour Research Symposium. Elsevier Science Publishers B.V. Amsterdam. The Netherlands, pp. 239-252.
Daubeny, H.A. 1979. The strawberry cultivars of the Pacific Northwest. Fruit Var. J. 33:44-45.
Day, N.B., Skura, B.J. and Powrie, W.D. 1990. Modified atmosphere packaging of blueberries: Microbiological changes. Can. Inst. Food Sci. Technol. J. 23:59-65.
De Pooter, H.L., Dirinck, P.J., Willaert, G. and Schamp, N.M. 1981. Metabolism of propionic acid by 'Golden Delicious' apples. Phytochem. 20:2135-2138.
De Pooter, H.L., Montens, J.P., Willaert, G.A., Dirinck, P.J., and Schamp, N.N. 1983. Treatment of 'Golden Delicious' apples with aldehydes and carboxylic acids: Effect on the headspace composition. J. Agric. Food Chem. 31:813-823.
De Potter, Van Acker, M.R. and Schamp, N.M. 1987. Aldehyde metabolism and the aroma quality of stored 'Golden Delicious' apples. Phytochem. 26:89-92.
Dillon, R.W. and Goldstein, M. 1984. Multivariate Analysis. Methods and Application. John Wiley and Sons. New York, NY. pp. 337-417.
Dimick, P.S. and Hoskin, J.C. 1981. Review of apple flavor - state of the art. Crit. Rev. Food Sci. Nutr. 18:387-409.
Dirinck, P., Schreyen, L. and Schamp, N. 1977. Aroma quality evaluation of tomatoes, apples, and strawberries. J. Agric. Food Chem. 25:759-763.
Dirinck, P.J., De Pooter, H.L., Willaert, G.A. and Schamp, N.M. 1981. Flavor quality of cultivated strawberries: The role of the sulfur compounds. J. Agric. Food Chem. 29:316-321.
Dix, K.D. and Fritz, J.S. 1987. Simple steam distillation for sample preparation prior to gas chromatographic determination of organic compounds. J. Chromatogr. 408:201-210.

180
Dixon, N.M. and Kell, D.B. 1989. The inhibition by C02 of the growth and metabolism of micro-organisms. J. Appl. Bacteriol. 67:109-136.
Douillard, C. and Guichard, E. 1989. Comparison by multidimensional analysis of concentrations of volatile compounds in fourteen frozen strawberry varieties. Sciences Des Aliments 9:53-76.
Douillard, C. and Guichard, E. 1990. The aroma of strawberry {Fragaria ananassa) : Characterization of some cultivars and influence of freezing. J. Sci. Food Agric. 50:517-531.
Duan, H., Gilbert, S.G., Ashkenazi, Y. and Henig, Y. 1973. The quality of bananas packaged in selected permeability films. J. Food Sci. 38:1247-1250.
Eaton, G.W., Bowen, P.A. and Jolliffe, P.A. 1986. Two-dimensional partitioning of yield variation. Hortscience 21:1052-1054.
El-Kazzaz, M.K., Sommer, N.F. and.Fortlage, R.J. 1983. Effect of different atmospheres on postharvest decay and quality of fresh strawberries. Phytopathol. 73:282-285.
Eriksson, C.E. 1979. Review of biosynthesis of volatiles in fruits and vegetables since 1975. In, Progress in Flavour Research. Land, D.G. and Nursten, H.E. (Ed). Applied Science Publishers. London, pp. 159-174.
Flath, R.A. and Forrey, R.R. 1970. Volatile components of 'Smooth Cayenne' pineapple. J. Agric. Food Chem. 18:306-309.
Follstad, M.N. 1966. Mycelial growth rate and sporulation of Alternaria tenuis, Botrytis cinerea, Cladosporium herbarum, and Rhizopus stolonifer in low-oxygen atmospheres. Phytopath. 56:1098-1099.
Forney, C.F., Rij, R.E. and Ross, S.R. 1989. Measurement of broccoli respiration in film-wrapped packages. HortScience 4:111-113 .
Frenkel, C. and Patterson, J.E. 1973. Effect of carbon dioxide on activity of succinic dehydrogenase in 'Bartlett' pears during cold storage. Hortscience 8:395-394.
Frenkel, C. and Patterson, M.E. 1977. Metabolic effects of C02 in 'Bartlett' pears. In, Controlled Atmospheres for the Storage and Transport of Perishable Agricultural Commodities. Dewey D.H. (Ed). Hort. Report 28, Michigan State Univ., East Lansing, MI.

181
Galliard, T. and Philips, D.R. 1972. The enzymic conversion of linoleic acid into 9-(non-1' , 3 '-dienoxy)non-8-enoic acid, a novel unsaturated ether derivative isolated from homogenates of Salanum tuberosum tubers. Biochem. J. 129:743-753.
Galliard, T. and Philips, D.R. 1975. The enzymic cleavage reaction of linoleic acid to C9 carbonyl fragments in extracts of cucumber (Cucumis sativus) fruit and the possible role of lipoxygenase. Biochim. Biophys. Acta 431:278-287.
Galliard, T. and Matthew, J.R. 1976. The enzymic formation of long chain aldehydes and alcohols by a-oxidation of fatty acids in extracts of cucumber fruit (Cucumis sativus). Biochim. Biophys. Acta 424:26-35.
Galliard, T., Philips, D.R. and Reynolds, J. 1976. The formation of cis-3-nonenal, fcrans-2-nonenal and hexanal from linoleic acid hydroperoxide isomers by a hydroperoxide cleavage enzyme system in cucumber {Cucumis sativus) fruits. Biochim. Biophys. Acta 398:1-9.
Galliard, T., Matthew, J.A., Wright, A.J. and Fishwick, M.J. 1977. The enzymic breakdown of lipids to volatile and nonvolatile carbonyl fragments in disrupted tomato fruits. J. Sci. Food Agric. 28:863-868.
Gomez, K.W. and Gomez, A.A. 1984. Statistical Procedures for Agricultural Research. 2nd Edition. IRRI. John Wiley & Sons. New York. pp. 256-262.
Greig, M. and Bjerring, J. 1980. A general least analysis of variance program. UBC Genlin. Computing Centre, UBC, Vancouver, B.C.
Guadagni, D.G., Bomben, J.L. and Hudson, J.S. 1971. Factors influencing the development of aroma in apples. J. Sci. Food Agric. 22:110-119.
Guichard, E. and Souty, M. 1988. Comparison of the relative quantities of aroma compounds found in fresh apricot {Prunus armeniaca) from six different varieties. Z. Lebensm. Unters. Forsch. 186:301-307.
Guinard, J. and Cliff, M. 1987. Descriptive analysis of Pinot noir wines from Carneros, Napa and Sonoma. Am. J. Enol. Vitic. 38:211-215.
Hall, G. and Lingnert, H. 1984. Flavor changes in whole milk powder during storage. I. Odor and flavor profiles of dry milk with addition of antioxidants and stored under air or nitrogen. J. Food Qual. 7:131-151.

182
Hall, G. and Anderson, J. 1985. Flavor changes in whole milk powder during storage. III. Relationships between flavor properties and volatile compounds. J. Food Qual. 7:237-253.
Hansen, A. and Lund, B. 1987. Volatile compounds in rye sourdough. In, Flavor Science and Technology. M. Martens, G.A. Dalen and H. Russwurm Jr. (Ed). John Wiley and Sons Ltd., New York, NY. pp.43-49.
Han, D.S., Hwang, I.Y., Park, K.H. and Shin, H.K. 1985. Modified atmosphere storage of Fuji apples in polyethylene films. Lebensm.-Wiss. Technol. 18:335-338.
Harman, J.E. and McDonald, B. 1983. Controlled atmosphere storage of Kiwi fruit: Effects on storage life and fruit quality. Acta Hort. 138:195-201.
Hayase, F., Chung, T. and Kato, H. 1984. Changes of volatile components of fruits during ripening. Food Chem. 14:113-124
Headley, L.M. and Hardy, J.K. 1989. Classification of whiskies by principal component analysis. J. Food Sci. 54:1351-1359.
Henig, Y.S. and Gilbert, S.G. 1975. Computer analysis of the variables affecting respiration and quality of produce packaged in polymeric films. J. Food Sci. 40:1033-1035.
Heymann, H. and Noble, A.C. 1987. Descriptive analysis of commercial Cabernet Sauvignon wines from California. Am. J. Enol. Vitic. 38:41-44.
Heymann, H. and Noble, A.C. 1989. Comparison of canonical variate and principal component analyses of wine descriptive analysis data. J. Food Sci. 54:1355-1358.
Hirvi, T. and Honkanen, E. 1982. The volatiles of two new strawberry cultivars, "Annelie" and "Alaska Pioneer", obtained by backcrossing of cultivated strawberries with wild strawberries, Fragaria vesca, Rugen and Fragaria virginiana. Z. Lebensm. Unters. Forsch. 175:113-116.
Hirvi, T. 1983. Mass fragmentographic and sensory analyses in the evaluation of the aroma of some strawberry varieties. Lebensm -Wiss. u - Technol. 16:157-161.
Honkanen, E. and Hirvi, T. 1990. The flavour of berries. In, Food Flavours. Part C. The Flavour of Fruits. Morton, I.D. and Macleod, A.J. (Ed.). Elsevier Science Publishers B.V., New York, NY. pp. 125-193.

183
Idstein, H., Herres, W. and Schreier, P. 1984. High-resolution gas-chromatography-mass spectrometry and -fourier transform infrared analysis of cherimoya {Annona cherimolia, Mill) volatiles. J. Agric. Food Chem. 32:383-389.
Jeltema, M.A.. Good, B.W., Hsu, F.S. and Parrish, M.E. 1984. Multivariate and gas chromatographic techniques in flavor research. In, Computers in Flavor and Fragrance Research. ACS Symposium Series 261. Washington, D.C. pp. 109-130.
Jennings, W.G. and Filsoof, M. 1977. Comparison of sample preparation techniques for gas chromatographic analysis. J. Agric. Food Chem. 25:440-444
Jennings, W.G, Wohleb, R. and Lewis, M.J. 1972. Gas chromatographic analysis of headspace volatiles of alcoholic beverages. J. Food Sci. 37:69-71.
Johannsson, J. 1961. Concentration of volatiles in controlled atmosphere storage and their relation to some storage operations. Amer. Soc. Hort. Sci. 80:137-144.
Josephson, D.B., Lindsay, R.C. and Stuiber, D.A. 1985. Volatile compounds characterizing the aroma of fresh Atlantic and Pacific oysters. J. Food Sci. 50:5-9.
Kader, A.A. 1980. Prevention of ripening in fruits by use of controlled atmospheres. Food Technol. 34(3):51-58.
Kader, A.A., El-Goorani, M.A. and Sommer, N.F. 1982. Postharvest decay, ethylene production, respiration and quality of peaches held in controlled atmospheres with added carbon monoxide. J. Amer. Soc. Hort. Sci. 107:856-859.
Kader, A.A. 1985. Modified atmospheres and low-pressure systems during transport and storage. In, Postharvest Technology of Horticultural Crops. Kader, A.A., Kasmire, R.F., Mitchell, F.G., Sommer, W.F. and Thompson, J.F. Special Publ. 3311. University of California, Davis, CA. pp. 58-64.
Kader, A.A., Zagory, D. and Kerbel, E.L. 1989. Modified atmosphere packaging of fruits and vegetables. CRC Crit. Rev. Food Sci. 28(1):l-30.
Kallio, H. and Lapvetelainen, A. 1984. Volatiles in relation to aroma in the berries of Rubus Articus Coll. In, Analysis of Volatiles. Walter de Gruyter and Co., New York. pp. 433-446.
Ke, D., van Gorsel, H. and Kader, A.A. 1990. Physiological and quality responses of 'Bartlett' pears to reduced 02 and enhanced C02 levels and storage temperature. J. Amer. Soc. Hort. Sci. 115:435-439.

184
Ke, D., Goldstein, L., O'Mahony, M. and Kader, A.A. 1991. Effects of short-term exposure to low 02 and high C02 atmospheres on quality attributes of strawberries. J. Food Sci. 56:50-54.
Kerbel, E.L., Kader, A.A. and Romani, R.J. 1988. Effects of elevated C02 concentrations on glycolysis in intact 'Bartlett' pear fruit. Plant Physiol. 86:1205-1209.
Kim, M.K., Kang, H.S. and Kim, K.H. 1986. On the storability of strawberry in air included the different C02 concentrations. Korean J. Food Sci. Technol. 18:66-70.
King, A.D. and Nagel, C.W. 1975. Influence of carbon dioxide upon the metabolism of Pseudomonas aeruginosa. J. Food Sci. 40:362-370.
Knee, M. 1973. Effects of controlled atmosphere storage on respiratory metabolism in apple fruit tissue. J. Sci. Food Agric. 24:1289-1298.
Knee, M. 1980. Physiological responses of apple fruits to oxygen concentrations. Ann. Appl. Biol. 96:243-253.
Kubo, Y. Inaba, A. and Nakamura, R. 1989. Effects of high C02 on respiration in various horticultural crops. J. Japan. Soc. Hort. Sci. 58:731-736.
Kubo, Y. Inaba, A. and Nakamura, R. 1990. Respiration and C2H2 production in various harvested crops held in C02-enriched atmospheres. J. Amer. Soc. Hort. Sci. 115:975-978.
Kwan, W. and Kowalski, B.R. 1980. Data analysis of sensory scores. Evaluations of panelists and wine score cards. J. Food Sci. 45:213-216.
Lau, O.L. 1983. Effects of storage procedures and low oxygen and carbon dioxide atmospheres on storage quality of 'Spartan' apples. J. Amer. Soc. Hort. 108:953-957.
Lau, O.L. 1985. Storage procedures, low oxygen, and low carbon dioxide atmospheres on storage quality of 'Golden Delicious' and 'Delicious' apples. J. Amer. Soc. Hort. Sci. 110:541-547.
Lau, O.L. 1988. Harvest indices, dessert quality, and storability of 'Jonagold' apples in air and controlled atmosphere storage. J. Amer. Soc. Hort. Sci. 113:564-569.
Leahy, M.M. and Reineccius, G.A. 1984. Comparison of methods for the isolation of volatile compounds from aqueous model systems. In, Analysis of Volatiles. Walter de Gruyter & Co., New York. NY. pp. 19-47.

185
Leland, J.V., Lahiff, M. and Reineccius, G.A. 1987. Predicting intensities of milk off-flavours by multivariate analysis of gas chromatography data. In, Flavour Science and Technology. Martens, M., Dalen, G.A. and Russwurm, H. Jr. (Ed.). John Wiley and Sons, New York, NY. pp. 453-467.
Li, C. and Kader, A.A. 1989. Residual effects of controlled atmospheres on postharvest physiology and quality of strawberries. J. Amer. Soc. Hort. Sci. 114:629-634.
Liardon, R. and Ott, U. 1984. Application of multivariate statistics for the classification of coffee headspace profiles. Lebensm-Wiss. Technol. 17:39-41.
Liardon, R., Ott, U. and Daget, N. 1984. Analysis of coffee headspace profiles by multivariate statistics. In, Analysis of volatiles. Walter de Gruyter and Co., New York, NY. pp. 447-458.
Lidster, P.D., Lightfoot, H.J and Rae, K.B. 1983. Production and regeneration of principal volatiles in apples stored in modified atmosphere and air. J. Food Sci. 48:400-402.
Likens, S.T. and Nickerson, G.B. 1964. Detection of certain hop oil constituents in brewing products. Proc. Amer. Soc. Brew. 5:1-13.
Luby, J.J., Munson, S.T. and Hoover, E.E. 1986. Sensory evaluation of fresh and frozen fruit from day-neutral strawberry cultivars. Adv. Strawberry Prod. 6:11-13.
MacLeod, G. and Ames, J.M. 1986. Comparative assessment of the artefact background on thermal desorption of Tenax-GC and Tenax-TA. J. Chromatogr. 355:393-398
Martens, M. 1986. Sensory and chemical/physical quality criteria of frozen peas studied by multivariate data analysis. J. Food Sci. 51:599-607.
Maxie, E.C., Sommer, N.F. and Mitchell, F.G. 1971. Infeasibility of irradiating fresh fruits and vegetables. HortScience 6:204-210.
Mazza, G., Le Maguer, M. and Hadziyev, D. 1980. Headspace sampling procedures for onions {Allium cepa L.). Can. Inst. Food Sci. Technol. J. 13:87-96.
McFadden, W.H., Teranish, R., Corse J., Black, D.R. and Mon, T.R. 1965. Volatiles from strawberries. II. Combined mass spectrometry and gas chromatography on complex mixtures. J. Chromatogr. 18:10-19.

186
McTigue, M.C., Koehler, H.H. and Silbernagel, M.J. 1989. Comparison of four sensory evaluation methods for assessing cooked dry bean flavor. J. Food Sci. 54:1278-1283.
Min, D.B. 1981. Correlation of sensory evaluation and instrumental gas chromatographic analysis of edible oils. J. Food Sci. 46:1453-1456.
Monning, A. 1983. Studies on the reaction of krebs cycle enzymes from apple tissue (cv. Cox orange) to increased levels of C02. Acta Hort. 138:113-119.
Nakhasi, S., Schlimme, D. and Solomos, T. 1991. Storage potential of tomatoes harvested at the breaker stage using modified atmosphere packaging. J. Food Sci. 56:55-59.
Noble, A.C, Williams, A.A. and Langron, S. 1984. Descriptive analysis and quality ratings of 1976 wines from four Bordeaux communes. J. Sci. Food Agric. 35:88-98.
Noble, A.C. and Shannon, M. 1987. Profiling Zinfandel wines by sensory and chemical analyses. Am. J. Enol. Vitic. 38:1-5.
Nunez, J., Bemelmans, J.M.H. and Maarse, H. 1984. Isolation methods for the volatile components of grapefruit juice. Distillation and solvent extraction methods. Chromatogr. 18:153-158.
Ohta, H., Kinjo, S. and Osajima, Y. 1987. Glass capillary gas chromatographic analysis of volatile components of canned Philippine pineapple juice. J. Chromatogr. 409:409-412.
Olafsdottir, G., Steinke, J.A. and Lindsay, R.C. 1985. Quantitative performance of a simple Tenax-GC adsorption method for use in analysis of aroma volatiles. J. Food Sci. 50:1431-1436.
O'Mahaony, M. 1985. Sensory Evaluation of Food. Statistical Methods and Procedures. Marcel Dekker, Inc. New York, NY.
Paillard, N. 1981. Factors influencing flavour formation in fruits. In, Volatile Analysis. Walter de Gruyter & Co. New York. NY. pp. 47 9-494.
Parliment, T.H. 1986. Sample preparation techniques for gas-liquid chromatographic analysis of biologically derived aromas. In, Biogeneration of Aromas. Parliment, T.H. and Croteau, R. (Ed). Amer. Chem. Soc. Washington, D.C. pp. 34-52.

187
Patterson, B.D., Hatfield, S.G.S. and Knee, M. 1974. Residual effects of controlled atmosphere storage on the production of volatile compounds by two varieties of apples. J. Sci. Food Agric. 25:843-849.
Pickenhagen, W., Velluz, A., Passerat, J. and Ohoff, G. 1981. Estimation of 2,5-dimethyl-4-hydroxy-3(2H)-furanone (FURNEOL) in cultivated and wild strawberries, pineapple and mangoes. J. Sci. Food Agric. 32:1132-1134.
Piggot, J.R. 1986. Statistical Procedures in Food Research. Elsevier Applied Science. New York, NY.
Piggot, J.R. and Jardine, S.P. 1979. Descriptive sensory analysis of flavor. J. Inst. Brew. 85:82-85.
Pino, J. 1982. Correlation between sensory and gas chromatographic measurements on orange volatiles. Acta Alimentaria 11:1-9.
Pino, J., Torricella, R. and Orsi, F. 1986a. Correlation between sensory and gas-chromatographic measurements on grapefruit juice volatiles. Acta Alimentaria 15:237-246.
Pino, J., Tapanes, R., Rosado, A. and Baluja, R. 1986b. Analysis of volatile components in 'Valencia' orange juice from Cuba. Acta Alimentaria 15:291-297.
Porrit, S.W. and Meheriuk, M. 1968. The influence of controlled atmosphere storage on quality of apples. J. Inst. Can. Techn. Aliment. 1:94-97.
Powers, J.J. and Ware, G.O. 1986. Discriminant analysis. In, Statistical Procedures in Food Research. Piggot, J.R. (Ed.) Elsevier Applied Science. New York, NY. pp. 161-162.
Powers, J.J. 1982. Techniques of analysis of flavors. Integration of sensory and instrumental methods. In, Food Flavors. Part A. Introduction. Morton, I.D. and Macleod, A.J. (Ed.) Elservier Science Publishing Co. Inc., New York, NY. pp. 121-167.
Prince, T.A. 1989. Modified atmosphere packaging of horticultural commodities. In, Controlled/Modified Atmosphere/Vacuum Packaging of Foods. Brody, A.L. (Ed). Food and Nutrition Press, Inc. Trumbull, CN. pp. 67-100.
Pritts, M.P., Bartsch, J.A., Worden, K.A. and Jorgensen, M.C. 1987. Factors influencing quality and shelf-life of strawberry cultivars in Eastern United States. Adv. Strawberry Prod. 6:14-17.

188
Pyysalo, T., Honkanen, E. and Hirvi, T. 1979. Volatiles of wild strawberries, Fragaria X ananassa cv. Senga Sengana. J. Agric. Food Chem. 27:19-22 .
Risse, L.A. and McDonald, R.E. 1990. Quality of supersweet corn film-overwrapped in trays. HortScience 25:322-324
Rogers, N.M., Bargmann, R.E. and Powers, J.J. 1986. Component and factor analysis applied to descriptors for tea sweetened with sucrose and saccharin. J. Sen. Stud. 1:137-148.
Rosen, J.C. and Kader, A.A. 1989. Postharvest physiology and quality maintenance of sliced pear and strawberry fruits. J. Food Sci. 54:656-659.
Salunkhe, D.K. and Do, J.Y. 1976. Biogenesis of aroma constituents of of fruit and vegetables. Crit. Rev. Food Sci. Nutr. 8:161-180.
Salunkhe, D.K. and Desai, B.B. 1980. Strawberries. In, Postharvest Biotechnology of Fruits. Vol. 1. CRC Press, Boca Raton, Fl. pp. 117-122.
SAS. 1985. SAS Users Guide: Statistics. SAS Institute, Inc., Cary, NC.
Schaefer, J. 1981. Comparison of adsorbents in head space sampling. In, Flavour Proceedings. Walter de Gruyter & Co. New York, NY. pp. 301-313.
Schreier, P. 1980. Quantitative composition of volatile constituents in cultivated strawberries, Fragaria ananassa cv. Senga Sengana, Senga Litessa and Senga Gourmella. J. Sci. Food Agric. 31:487-494.
Schreier, P., Drawert, F. and Abraham, K.O. 1980. Identification and determination of volatile constituents in Burgundy Pinot noir wines. Lebensm. Wiss. u Technol. 13:318-321.
Schreier, P. and Reiner, L. 1979. Characterisation and diferentiation of grape brandies by multiple discriminant analysis. J. Sci. Food Agric. 30:319-327.
Schutz, H. G. and Darmell, J.D. 1974. Prediction of hedonic ratings of rice by sensory analysis. J. Food Sci. 39:203-206.
Siriphanich, J. and Kader, A.A. 1986. Effects of C02 on cinnamic acid-4-hydroxylase in relation to phenolic metabolism in lettuce tissue. J. Amer. Soc. Hort. Sci. 110:33-335.

189
Sistrunk, W.A. and Moore, J.N. 1971. Strawberry quality studies in relation to new variety development. Agric. Exper. Station. Division of Agric. University of Arkansas, Fayetteville. Bulletin 761:3-31.
Skrede, G. 1983. Changes in sucrose, fructose and glucose content of frozen strawberries with thawing. J. Food Sci. 48:1094-1100.
Smith, W.H. 1963. The use of carbon dioxide in the transport and storage of fruits and vegetables. Adv. Food Res. 12:95-146.
Smith, S.M., Geeson, J.D., Browne, M. and Everson, H.P. 1987. Modified-atmosphere retail packaging of 'Discovery' apples. J. Sci. Food Agric. 40:165-169.
Smittle, D.A. and Miller, W.R. 1988. 'Rabbiteye' blueberry storage life and fruit quality in controlled atmospheres and air storage. J. Amer. Soc. Sci. 113:723-728.
Smock, R.M. 1979. Controlled atmosphere storage of fruits. Hort. Rev. 1:301-336.
Sommer, N.F, Fortlage, R.J., Mitchell, F.G. and Maxie, E.C. 1973. Reduction of postharvest losses of strawberry fruits from gray mold. J. Amer. Soc. Hort'. Sci. 98:285-288.
Spencer, M.D., Pangborn, R.M. and Jennings, W.G. 1978. Gas chromatographic and sensory analysis of volatiles from 'Cling' peaches. J. Agric. Food Chem. 26:725-732.
Steel,R.G.D. and Torrie,J.H. 1980. Principles and Procedures of Statistics. 2nd Edition. McGraw-Hill Book Co. New York, NY.
Stone, H., Sidel, J., Joel, 0., S., Woolsey, A. and Singleton, R.C. 1974. Sensory evaluation by quantitative descriptive analysis. Food Techn. 28 (11) : 24-34 .
Svircev, A.M., McKeen, W.E. and Berry, J.W. 1984. Sensitivity of Peronospora hyoscyami f.sp. tabacina to carbon dioxide, compared to that of Botrytis cinera and Aspergillus niger. Phytopath. 74:445-447.
Swartz, H.J., Popenoe, J. and Fiola, J.A. 1985. Yield component analysis of the 1984 Maryland-USDA replicated trials. Adv. Strawberry Prod. 4:45-52.
SYSTAT/SYGRAPH. 1989. The System for Statistics and Graphics for the PC. Systat, Inc. Evanston, IL.
Takeoka, G.R., Guntert, M., Flath, R.A., Wurz, R.E. and Jennings, W. 1986. Volatile constituents of Kiwi fruit {Actinidia chinensis Planch.). J. Agric. Food Chem. 34:576-578.

190
Tassan, C.G. and Russel, G.F. 1974. Sensory and gas chromatographic profile of coffee beverage headspace volatiles entrained on porous polymers. J. Food Sci. 39:64-68.
Teranishi, R., Corse, J.W., McFadden, W.H., Black, D.R. and Morgan, Jr., A.I. 1963. Volatiles from strawberries. I. Mass spectral identification of the more volatile components. J. Food Sci. 28:478-483.
Thomas, M. 1929. The production of ethyl alcohol and acetaldehyde by apples in relation to the injuries occuring in storage. Part 1. Injuries to apples occurring in the absence of oxygen and in certain mixtures of carbon dioxide and oxygen. Ann. Appl. Biol. 81:444-457.
Tressl, R. and Jennings, W.G. 1972. Production of volatile compounds in the ripening banana. J. Agric. Food Chem. 20:189-192.
Tressl, R. and Drawert, F. 1973. Biogenesis of banana volatiles. J. Agric. Food Chem. 21:560-565.
Tressl, R., Bahri, D., Holzer, M. and Kossa, T. 1977. Formation of flavor components in asparagus. 2. Formation of flavor components in cooked asparagus. J. Agric. Food Chem. 25:459-463.
Wang, S.M. and Dale, A. 1990. Evaluation of strawberry cultivars for frozen sugar pack. Adv. Strawberry Prod. 9:31-32.
Weast, R.C. 1984. CRC Handbook of Chemistry and Physics. 51st Edition. The Chemical Rubber Co. Ohio, pp F151.
Wells, J.M. and Uota, M. 1970. Germination and growth of five fungi in low-oxygen and high-carbon dioxide atmospheres. Phytopath. 60:50-53.
Weurman, C. 1961. Gas-liquid chromatographic studies on the enzymatic formation of volatile compounds in raspberries. Food Technol. 15(12):531-536.
Willaert, G.A., Dirinck, P.J., De Pooter, H.L. and Schamp, N.N. 1983. Objective measurement of aroma quality of 'Golden Delicious' apples as a function of controlled-atmosphere storage time. J. Agric. Food Chem. 31:809-813
Woodward, J.R. and Topping, A.J. 1972. The influence of controlled atmospheres on the respiration rates and storage behavior of strawberry fruits. J. Hort. Sci. 47:547-553.
Wrolstad, R.E., Lee, D.D. and Poei, M.S. 1980. Effect of microwave blanching on the color and composition of strawberry concentrate. J. Food Sci. 45:1573-1577.

191
Yabumoto, K. and Jennings, W.G. 1977. Volatile constituents of cantaloupe, Cucumis melon, and their biogenesis. J. Food Sci. 42:32-37.
Yahia, E.M., Liu, F.W. and Acree, T.E. 1990. Changes of some odor-active volatiles in controlled atmosphere-stored apples. J. Food Qual. 13:185-202.
Yamashita, I., Nemoto, Y. and Yoshikawa, S. 1975. Formation of volatile esters in strawberries. Agric. Biol. Chem. 39:2303-2307.
Yamashita, I., Nemoto, Y. and Yoshikawa, S. 197 6a. Formation of volatile alcohols and esters from aldehydes in strawberries. Phytochem. 15:1633-1637.
Yamashita, I. Nemoto, Y. and Yoshikawa, S. 1976b. NAD-dependent alcohol dehydrogenase and NADP-dependent alcohol dehydrogenase from strawberry seeds. Agric. Biol. Chem. 40:2231-2235.
Yamashita, I., lino, K., Nemoto, Y. and Yoshikawa. 1977. Studies on flavor development in strawberries. 4. Biosynthesis of volatile alcohol and esters from aldehyde during ripening. J. Agric. Food Chem. 25:1165-1168.
Yamashita, I., lino, K. and Yoshikawa. 1978a. Alcohol dehydrogenases from strawberry seeds. Agric. Biol. Chem. 42:1125-1132.
Yamashita, I., lino, K. and Yoshikawa, S. 1979. Substrate specificity in biosynthesis of volatile esters in strawberry fruit. Nippon Shokuhin Kogyo Gakkaishi 26:233-277.
Yamashita, I., lino, K. and Yoshikawa, S. 1982. Alcohol dehydrogenase in strawberry pulp. Studies on flavor development in strawberries. Part VIII. Nippon Shokuhin Kogyo Gakkaishi 29:78-84.
Yu, M., Olson, L.E. and Salunkhe, D.K. 1968. Precursors of volatile components in tomato fruit. III. Enzymatic reaction products. Phytochem. 7:561-565.
Zegota, H. 1988. Suitability of 'Dukat' strawberries for studying effects on shelf life of irradiation combined with cold storage. Z. Lebensm. Unters. Forsch. 187:111-114.