
Sensitivity of US air quality to mid-latitude cyclone ...
12
Atmos. Chem. Phys., 8, 7075–7086, 2008 www.atmos-chem-phys.net/8/7075/2008/ © Author(s) 2008. This work is distributed under the Creative Commons Attribution 3.0 License. Atmospheric Chemistry and Physics Sensitivity of US air quality to mid-latitude cyclone frequency and implications of 1980–2006 climate change E. M. Leibensperger, L. J. Mickley, and D. J. Jacob School of Engineering and Applied Sciences, Harvard University, Cambridge, Massachusetts, USA Received: 22 May 2008 – Published in Atmos. Chem. Phys. Discuss.: 24 June 2008 Revised: 29 September 2008 – Accepted: 29 October 2008 – Published: 6 December 2008 Abstract. We show that the frequency of summertime mid- latitude cyclones tracking across eastern North America at 40 ◦ –50 ◦ N (the southern climatological storm track) is a strong predictor of stagnation and ozone pollution days in the eastern US. The NCEP/NCAR Reanalysis, going back to 1948, shows a significant long-term decline in the number of summertime mid-latitude cyclones in that track starting in 1980 (-0.15 a -1 ). The more recent but shorter NCEP/DOE Reanalysis (1979–2006) shows similar interannual variabil- ity in cyclone frequency but no significant long-term trend. Analysis of NOAA daily weather maps for 1980–2006 sup- ports the trend detected in the NCEP/NCAR Reanalysis 1. A GISS general circulation model (GCM) simulation including historical forcing by greenhouse gases reproduces this de- creasing cyclone trend starting in 1980. Such a long-term de- crease in mid-latitude cyclone frequency over the 1980–2006 period may have offset by half the ozone air quality gains in the northeastern US from reductions in anthropogenic emis- sions. We find that if mid-latitude cyclone frequency had not declined, the northeastern US would have been largely compliant with the ozone air quality standard by 2001. Mid- latitude cyclone frequency is expected to decrease further over the coming decades in response to greenhouse warm- ing and this will necessitate deeper emission reductions to achieve a given air quality goal. 1 Introduction Regional pollution episodes in the eastern US develop under summertime stagnant conditions with clear skies, a situation associated with weak high-pressure systems (Logan, 1989; Correspondence to: E. M. Leibensperger ([email protected]) Vukovich, 1995; Hegarty et al., 2007). The pollution episode ends when the warm, stagnant air mass is pushed to the At- lantic by the cold front of a passing mid-latitude baroclinic cyclone and replaced with cooler, cleaner air (Merrill and Moody, 1996; Cooper et al., 2001; Dickerson et al., 1995; Li et al., 2005). We show here with 1980-2006 data that in- terannual variability in the frequency of these mid-latitude cyclones is a major predictor of the interannual variability of pollution episodes, as measured by indices for stagnation and elevated surface ozone. Greenhouse-driven climate change is expected to decrease mid-latitude cyclone frequency, and we present evidence that such a decrease may have already taken place over the 1980–2006 period. As we show, this would have major implications for pollution trends in the eastern US and significantly offset the benefits of decreasing anthro- pogenic emissions. Figure 1 illustrates the role of mid-latitude cyclones in ventilating the eastern US with an example from the sum- mer of 1988. That summer experienced the worst regional air quality of the 1980–2006 record (Lin et al., 2001). On 14 June, the daily maximum 8-h average ozone concentra- tions exceeded 100 ppb across most of the region, a result of accumulation over several days of stagnant high-pressure conditions. Over the next two days, a mid-latitude cyclone moved along a westerly track across southeastern Canada. The associated cold front swept the pollution eastward to the North Atlantic, leaving much cleaner air with lower ozone concentrations in its wake. The westerly track across south- eastern Canada illustrated in Fig. 1 is typical of mid-latitude cyclones traveling across North America. The frequency of these cyclones varies considerably from year to year (Zishka and Smith, 1980; Whittaker and Horn, 1981). General circulation model (GCM) simulations of greenhouse-forced 21st-century climate change indicate a poleward shift in the preferential storm tracks (Yin, 2005) and a decrease in the frequency of northern mid-latitude Published by Copernicus Publications on behalf of the European Geosciences Union.
Transcript of Sensitivity of US air quality to mid-latitude cyclone ...

Atmos. Chem. Phys., 8, 7075–7086, 2008www.atmos-chem-phys.net/8/7075/2008/© Author(s) 2008. This work is distributed underthe Creative Commons Attribution 3.0 License.
AtmosphericChemistry
and Physics
Sensitivity of US air quality to mid-latitude cyclone frequency andimplications of 1980–2006 climate change
E. M. Leibensperger, L. J. Mickley, and D. J. Jacob
School of Engineering and Applied Sciences, Harvard University, Cambridge, Massachusetts, USA
Received: 22 May 2008 – Published in Atmos. Chem. Phys. Discuss.: 24 June 2008Revised: 29 September 2008 – Accepted: 29 October 2008 – Published: 6 December 2008
Abstract. We show that the frequency of summertime mid-latitude cyclones tracking across eastern North America at40◦–50◦ N (the southern climatological storm track) is astrong predictor of stagnation and ozone pollution days inthe eastern US. The NCEP/NCAR Reanalysis, going back to1948, shows a significant long-term decline in the numberof summertime mid-latitude cyclones in that track starting in1980 (−0.15 a−1). The more recent but shorter NCEP/DOEReanalysis (1979–2006) shows similar interannual variabil-ity in cyclone frequency but no significant long-term trend.Analysis of NOAA daily weather maps for 1980–2006 sup-ports the trend detected in the NCEP/NCAR Reanalysis 1. AGISS general circulation model (GCM) simulation includinghistorical forcing by greenhouse gases reproduces this de-creasing cyclone trend starting in 1980. Such a long-term de-crease in mid-latitude cyclone frequency over the 1980–2006period may have offset by half the ozone air quality gains inthe northeastern US from reductions in anthropogenic emis-sions. We find that if mid-latitude cyclone frequency hadnot declined, the northeastern US would have been largelycompliant with the ozone air quality standard by 2001. Mid-latitude cyclone frequency is expected to decrease furtherover the coming decades in response to greenhouse warm-ing and this will necessitate deeper emission reductions toachieve a given air quality goal.
1 Introduction
Regional pollution episodes in the eastern US develop undersummertime stagnant conditions with clear skies, a situationassociated with weak high-pressure systems (Logan, 1989;
Correspondence to:E. M. Leibensperger([email protected])
Vukovich, 1995; Hegarty et al., 2007). The pollution episodeends when the warm, stagnant air mass is pushed to the At-lantic by the cold front of a passing mid-latitude barocliniccyclone and replaced with cooler, cleaner air (Merrill andMoody, 1996; Cooper et al., 2001; Dickerson et al., 1995;Li et al., 2005). We show here with 1980-2006 data that in-terannual variability in the frequency of these mid-latitudecyclones is a major predictor of the interannual variability ofpollution episodes, as measured by indices for stagnation andelevated surface ozone. Greenhouse-driven climate change isexpected to decrease mid-latitude cyclone frequency, and wepresent evidence that such a decrease may have already takenplace over the 1980–2006 period. As we show, this wouldhave major implications for pollution trends in the easternUS and significantly offset the benefits of decreasing anthro-pogenic emissions.
Figure 1 illustrates the role of mid-latitude cyclones inventilating the eastern US with an example from the sum-mer of 1988. That summer experienced the worst regionalair quality of the 1980–2006 record (Lin et al., 2001). On14 June, the daily maximum 8-h average ozone concentra-tions exceeded 100 ppb across most of the region, a resultof accumulation over several days of stagnant high-pressureconditions. Over the next two days, a mid-latitude cyclonemoved along a westerly track across southeastern Canada.The associated cold front swept the pollution eastward to theNorth Atlantic, leaving much cleaner air with lower ozoneconcentrations in its wake. The westerly track across south-eastern Canada illustrated in Fig. 1 is typical of mid-latitudecyclones traveling across North America. The frequency ofthese cyclones varies considerably from year to year (Zishkaand Smith, 1980; Whittaker and Horn, 1981).
General circulation model (GCM) simulations ofgreenhouse-forced 21st-century climate change indicate apoleward shift in the preferential storm tracks (Yin, 2005)and a decrease in the frequency of northern mid-latitude
Published by Copernicus Publications on behalf of the European Geosciences Union.

7076 E. M. Leibensperger et al.: Recent climate change and US air quality
Fig. 1. Evolution of surface ozone concentrations in the eastern US during the passage of a mid-latitude cyclone (14–17 June 1988). The toprow shows instantaneous sea-level pressure fields at 12Z from the NCEP/NCAR Reanalysis 1, while the bottom row shows daily maximum8-h average ozone concentrations from monitoring sites of the US Environmental Protection Agency (http://www.epa.gov/ttn/airs/airsaqs/),The contour interval for sea level pressure is 2 hPa. The ozone data have been averaged on a 2.5◦
×2.5◦ grid.
cyclones (Geng and Sugi, 2003; Yin, 2005; Lambert andFyfe, 2006; Meehl et al., 2007). These effects result froma shift and reduction of baroclinicity forced by weakenedmeridional temperature gradients (Geng and Sugi, 2003;Yin, 2005). One would expect an adverse effect on USair quality. A GCM simulation by Mickley et al. (2004)including pollution tracers found a 20% decrease in thefrequency of summertime mid-latitude cyclones ventilatingthe US by 2050 and an associated increase in the frequencyand intensity of pollution episodes. Two subsequent stud-ies of US air quality in 21st-century climates, using globalchemical transport models driven by GCM output, confirmedthe increase of ozone pollution episodes due to decreasedfrequency of mid-latitude cyclones (Murazaki and Hess,2006; Wu et al., 2008), but another study using a regionalclimate model did not (Tagaris, et al., 2007).
Decreasing trends in mid-latitude cyclones over the pastdecades have been identified in the observational record.A study by Zishka and Smith (1980) using observationalweather maps for North America found a significant de-crease of 4.9 cyclones per decade in July and 9.0 cyclonesper decade in December for 1950–1977. Another study byWang et al. (2006) using surface pressure data for 1953–2002identified a significant decreasing trend in cyclone activityalong eastern Canada during the winter. Similar trends havebeen found in studies using meteorological reanalyses (i.e.,assimilated meteorological data). Gulev et al. (2001) found adecrease of 12.4 cyclones per decade in the Northern Hemi-sphere and 8.9 cyclones per decade over the Atlantic Oceanduring winter 1958–1999. McCabe et al. (2001) found asignificant decrease in cyclones at mid-latitudes (30◦–60◦ N)
and an increase at high-latitudes (60◦–90◦ N) during winter1959–1997. Previous studies have generally focused on win-ter, the season with the strongest climate change signal. Inthis study we focus on summer, which is of most interestfrom an air quality standpoint.
A large number of statistical studies have related air qual-ity to local meteorological variables such as temperature, hu-midity, wind speed, or solar radiation, often with the goal ofremoving the effect of interannual meteorological variabil-ity in the interpretation of air quality trends (Zheng et al.,2007; Bloomfield et al., 1996; Thomspon et al., 2001; Ca-malier et al., 2007; Gego et al., 2007). Ordonez et al. (2005)found that the number of days since the last frontal passagewas a significant predictor of ozone air quality in Switzer-land. Hegarty et al. (2007) related the interannual frequencyand intensity of sea level pressure patterns over eastern NorthAmerica to ozone, CO, and particulate matter concentrations.Mid-latitude cyclone frequency is an attractive meteorolog-ical predictor for air quality on several accounts. First, itencapsulates to some extent the information in the local me-teorological predictors (temperature, solar radiation, windspeed), while additionally providing direct information onboundary layer ventilation. Second, it represents a non-localsingle metric to serve as explanatory variable for air qualityon a regional scale. Third, since mid-latitude cyclones are animportant aspect of the general circulation of the atmosphere,cyclone frequency can be expected to be robustly simulatedby GCMs and thus provide a useful and general metric forprobing the effect of climate change on air quality.
Atmos. Chem. Phys., 8, 7075–7086, 2008 www.atmos-chem-phys.net/8/7075/2008/

E. M. Leibensperger et al.: Recent climate change and US air quality 7077
30°N 60°N 90°NNCEP/NCAR Reanalysis 1Zishka and Smith [1980]
30°N 60°N 90°N
NCEP/DOE Reanalysis 230°N 60°N 90°N 30°N 60°N 90°N
GISS GCM
10 20 30 40 50 60Cyclones per 5ox5o grid square
Fig. 2. 28-year July climatologies of cyclone tracks across North America, counting all cyclone tracks that pass through 5◦×5◦ grid squares.
The Zishka and Smith (1980) climatology is for 1950–1977 and based on monthly compilations of 6-h weather maps; the data shown here areadapted from their Fig. 3. The NCEP/NCAR Reanalysis 1 and NCEP/DOE Reanalysis 2 climatologies are for 1950–1977 and 1979–2006,respectively. The GISS GCM climatology is for 1950–1977 in a transient-climate simulation including historical trends in greenhouse gasesand aerosols.
2 Data and methods
2.1 Detection and tracking of mid-latitude cyclones
Various metrics can be used to diagnose mid-latitude cycloneactivity, including eddy kinetic energy (Hu et al., 2004), tem-poral variability of sea-level pressure, temperature or merid-ional wind (Harnik and Chang, 2003), the meridional tem-perature gradient, and the Eady growth rate (Paciorek et al.,2002). Some studies have used the probability distributionof sea-level pressure as a diagnostic of cyclone frequency(Murazaki and Hess, 2006; Lin et al., 2008; Racherla andAdams, 2008). A problem with these metrics for applica-tion to air quality is that they potentially convolve cyclonefrequency and intensity, while air quality is most sensitive tocyclone frequency (i.e., the frequency of cold frontal pas-sages). For example, Owen et al. (2006) found that bothstrong and weak warm conveyor belts effectively ventilateUS pollution, although at different altitudes. In Sect. 3 wewill show that mid-latitude cyclone is an excellent predictorof pollution episodes.
We constructed long-term cyclone frequency statistics foreastern North America in June-August using two differ-ent methods and three different data sets: (1) daily ob-served weather maps for 1980–2006 from the NationalOceanic and Atmospheric Administration (NOAA) avail-
able from the NOAA Central Library (http://www.lib.noaa.gov) with labeled cyclones and cold fronts; (2) sea-levelpressure data from the National Centers for Environmen-tal Prediction/National Center for Atmospheric Research(NCEP/NCAR) Reanalysis 1 (http://www.cdc.noaa.gov/cdc/data.ncep.reanalysis.html) (Kalnay et al., 1996; Kistler et al.,2001) for 1948–2006 and from the NCEP/Department of En-ergy (NCEP/DOE) Reanalysis 2 (http://www.cdc.noaa.gov/cdc/data.ncep.reanalysis2.html) (Kanamitsu et al., 2002) for1979–2006. Reanalysis 2 is a newer version of Reanalysis1 incorporating updated physical parameterizations and var-ious error fixes, but it does not cover as long a period. Thereanalysis datasets have a spatial resolution of 2.5◦
×2.5◦ anda temporal resolution of six hours. The previously mentionedstudies of long-term mid-latitude cyclone trends (McCabe etal., 2001; Gulev et al., 2001; Geng and Sugi, 2001) all usedReanalysis 1.
We generate cyclone tracks in the meteorological reanal-yses by locating and following sea-level pressure minimafollowing the algorithm of Bauer and Del Genio (2006),which is an upgraded version of the scheme by Chandler andJonas (1999). For each 6-h time step the algorithm searchesfor sea-level pressure minima extending 720 km or more inradius. The low-pressure center is tracked through time byassuming that the strongest sea-level pressure minimum inthe next 6-h time step within 720 km is the same system. In
www.atmos-chem-phys.net/8/7075/2008/ Atmos. Chem. Phys., 8, 7075–7086, 2008

7078 E. M. Leibensperger et al.: Recent climate change and US air quality
Fig. 3. Mid-latitude cyclone tracks for June–August 1979–1981 in the NCEP/NCAR Reanalysis 1 (left) and NCEP/DOE Reanalysis 2 (right).The red box (70◦–90◦ W, 40◦–50◦ N) is used to diagnose the frequency of mid-latitude cyclones traveling along the southern climatologicalcyclone track. The green box (70◦–90◦ W, 50◦–60◦ N) is used for the northern climatological cyclone tracks.
1980 1985 1990 1995 2000 2005 2010Year
5
10
15
20
Num
ber o
f Mid
-Lat
itude
Cyc
lone
s NOAA Weather Map AnalysisNCEP/NCAR Reanalysis 1NCEP/DOE Reanalysis 2
Fig. 4. June-August 1980-2006 time series of the number of mid-latitude cyclones passing through the red box of Fig. 3, corre-sponding to the southern climatological cyclone track across NorthAmerica. Results are shown for three different data sets: NOAAdaily weather maps (black), NCEP/NCAR Reanalysis 1 (red) andNCEP/DOE Reanalysis 2 (green).
order to remove spurious minima, the system must be trackedfor at least 24 h and have a central pressure no higher than1020 hPa.
Figure 2 shows 28-year July climatologies of cyclone den-sity over North America. The compilation of Zishka andSmith (1980) for 1950–1977, produced from 6-h weathermaps, is compared to the climatologies produced by applyingthe algorithm of Bauer and Del Genio (2006) to Reanalysis1 (1950–1977) and Reanalysis 2 (1979–2006). Patterns and
magnitudes are in good agreement, showing that the cyclonetracking algorithm applied to the reanalysis data can repro-duce the observed large-scale climatological distribution ofmid-latitude cyclones. Inspection of 1979–2006 vs. 1950–1977 climatologies in Reanalysis 1 indicates no differencebetween these two periods in the large-scale cyclone patternsshown in Fig. 2, although there is a significant trend as dis-cussed in Sect. 4.
We see from Fig. 2 that cyclone density is maximum overeast-central Canada, corresponding to the two northern cli-matological cyclone tracks across North America previouslyidentified by Zishka and Smith (1980) and Whittaker andHorn (1981). These studies also identified a less intensesouthern climatological track that begins in the central USand moves northeastward along the US-Canada border be-fore merging with the northern tracks along the east coast ofCanada. As we will see, it is this southern climatologicaltrack that is of most interest for US air quality.
Figure 3 shows individual cyclone tracks for June–August1979–1981 over eastern North America in Reanalyses 1 and2. A cluster over the Great Lakes region represents the south-ern climatological cyclone track. We will show in Sect. 3 thatthe frequency of cyclones moving along this track, identifiedby the red box (70◦–90◦ W, 40◦–50◦ N), is a strong seasonalpredictor of the frequency of US pollution episodes. By con-trast, we find that the number of cyclones passing through thenorthern climatological tracks (70◦–90◦ W, 50◦–60◦ N, greenbox in Fig. 3) is not a successful predictor. We focus on thesouthern track in the rest of this paper.
Atmos. Chem. Phys., 8, 7075–7086, 2008 www.atmos-chem-phys.net/8/7075/2008/

E. M. Leibensperger et al.: Recent climate change and US air quality 7079
Fig. 5. Seasonal mean number of June–August stagnant days in the 1980–1998 records from NCEP/NCAR Reanalysis 1 (left) andNCEP/DOE Reanalysis 2 (right).
Figure 4 shows the time series of the 1980–2006 sum-mertime frequency of mid-latitude cyclones in the south-ern climatological cyclone track (number of cyclones track-ing through 70–90◦ W, 40–50◦ N) from Reanalyses 1 and 2as well as from our manual analysis of the NOAA weathermaps. We tallied a system as a cyclone in the NOAA weathermaps if it was marked as a “Low” on the map, containeda closed sea-level pressure contour, and was tracked for atleast 24 h. The three datasets have comparable climatolog-ical statistics (11.9±2.6 cyclones summer−1 in Reanalysis1, 11.8±2.7 in Reanalysis 2, 12.7±2.4 in NOAA weathermaps). Reanalysis 1 and the NOAA weather maps show asignificant decreasing trend for 1980–2006 but Reanalysis 2does not. We discuss these long-term trends in Sect. 4.
Figure 4 shows strong interannual correlations betweencyclone frequencies diagnosed from the three different datasets but also significant differences. Inspection of these dif-ferences for individual years shows that although the diagno-sis of cyclones in Reanalyses 1 and 2 generally follows thecyclone identification in the daily weather maps, there aresome differences in the intensity and position of the sea-levelpressure minima for the three different data sets. These dif-ferences can result in displacement of the cyclone relative tothe red box in Fig. 3 used to identify the southern climatolog-ical track, and can occasionally affect cyclone detection. Cy-clone identification using the NOAA weather maps is closestto the actual observations but is subject to case-by-case hu-man interpretation. The cyclone tracking algorithm appliedto the meteorological reanalyses is more objective and canbe applied to GCM fields (Sect. 4), but it is subject to er-rors both in the reanalyses and in the tracking algorithm. Wewill use the three datasets to overcome these problems in thereanalysis and weather map analyses.
2.2 Detection of stagnation episodes
We use stagnation frequency as a link to better understand thecorrelation between cyclone frequency and pollution events.The number of stagnant days was calculated from Reanaly-ses 1 and 2 data for June–August 1980–1998 with the met-ric described by Wang and Angell (1999), which is similarto the original version by Korshover and Angell (1982). Aday is considered stagnant if the daily mean sea-level pres-sure geostrophic wind is less than 8 m s−1, the daily mean500 hPa wind is less than 13 m s−1, and there is no pre-cipitation. Precipitation was identified with daily griddeddata (0.25◦×0.25◦) from the NOAA Climate Prediction Cen-ter (http://www.cdc.noaa.gov/cdc/data.unified.html) extend-ing to 1998. For our purposes, the 1980–1998 period is suffi-cient to show the relationship between stagnation and ozoneepisodes. Figure 5 shows the mean number of stagnant daysper summer for 1980–1998 from Reanalyses 1 and 2. Thefrequency of stagnant days in both datasets is highest in aband stretching from Texas to Ohio, as previously shown byWang and Angell (1999).
2.3 Surface ozone data
We generated time series of daily maximum 8-h aver-age ozone concentrations for June-August 1980–2006 fromhourly observations of ozone concentrations retrieved fromEPA’s Air Quality System (AQS,http://www.epa.gov/ttn/airs/airsaqs/), representing a network of over 2000 sites in thecontiguous US. The average number of sites providing ozonedata since 1980 is about 1000 per summer; this number hasincreased over time. The daily maximum 8-h average ozoneconcentrations from all AQS sites were averaged onto the2.5◦
×2.5◦ grid of the NCEP Reanalyses, producing a daily
www.atmos-chem-phys.net/8/7075/2008/ Atmos. Chem. Phys., 8, 7075–7086, 2008
7080 E. M. Leibensperger et al.: Recent climate change and US air quality
Summer 1980-2006 Mean Number of Ozone Pollution Days
Days0 2.5 5 7.5 10
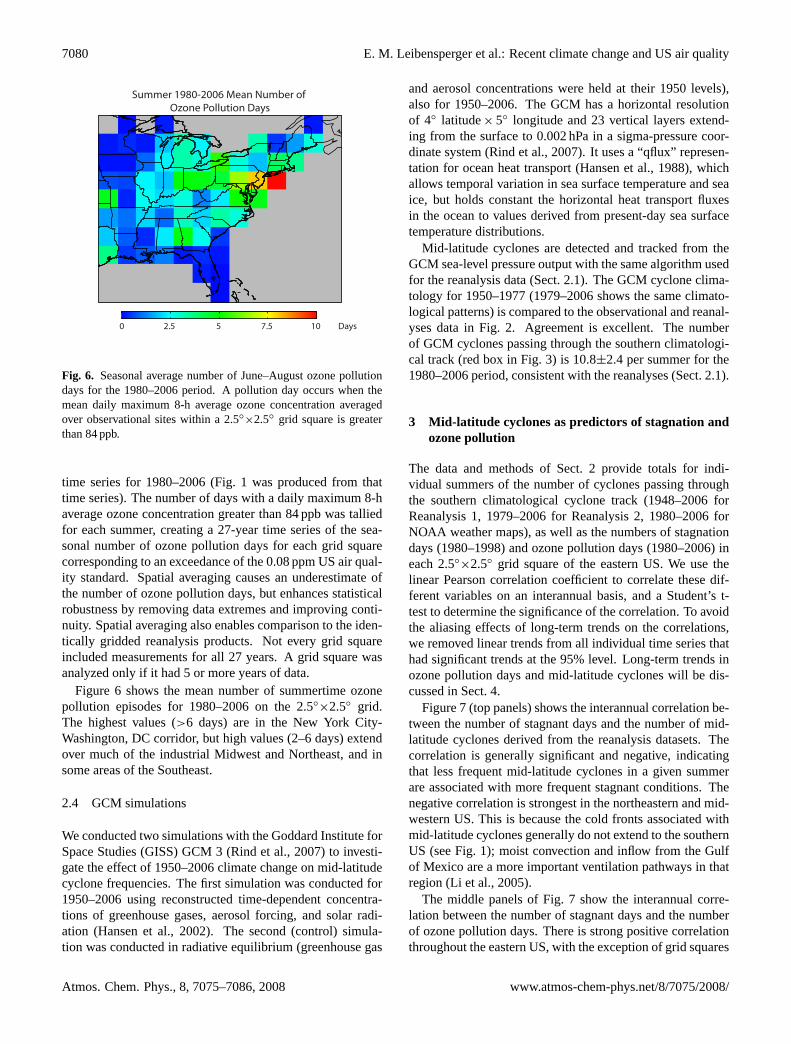
Fig. 6. Seasonal average number of June–August ozone pollutiondays for the 1980–2006 period. A pollution day occurs when themean daily maximum 8-h average ozone concentration averagedover observational sites within a 2.5◦
×2.5◦ grid square is greaterthan 84 ppb.
time series for 1980–2006 (Fig. 1 was produced from thattime series). The number of days with a daily maximum 8-haverage ozone concentration greater than 84 ppb was talliedfor each summer, creating a 27-year time series of the sea-sonal number of ozone pollution days for each grid squarecorresponding to an exceedance of the 0.08 ppm US air qual-ity standard. Spatial averaging causes an underestimate ofthe number of ozone pollution days, but enhances statisticalrobustness by removing data extremes and improving conti-nuity. Spatial averaging also enables comparison to the iden-tically gridded reanalysis products. Not every grid squareincluded measurements for all 27 years. A grid square wasanalyzed only if it had 5 or more years of data.
Figure 6 shows the mean number of summertime ozonepollution episodes for 1980–2006 on the 2.5◦
×2.5◦ grid.The highest values (>6 days) are in the New York City-Washington, DC corridor, but high values (2–6 days) extendover much of the industrial Midwest and Northeast, and insome areas of the Southeast.
2.4 GCM simulations
We conducted two simulations with the Goddard Institute forSpace Studies (GISS) GCM 3 (Rind et al., 2007) to investi-gate the effect of 1950–2006 climate change on mid-latitudecyclone frequencies. The first simulation was conducted for1950–2006 using reconstructed time-dependent concentra-tions of greenhouse gases, aerosol forcing, and solar radi-ation (Hansen et al., 2002). The second (control) simula-tion was conducted in radiative equilibrium (greenhouse gas
and aerosol concentrations were held at their 1950 levels),also for 1950–2006. The GCM has a horizontal resolutionof 4◦ latitude× 5◦ longitude and 23 vertical layers extend-ing from the surface to 0.002 hPa in a sigma-pressure coor-dinate system (Rind et al., 2007). It uses a “qflux” represen-tation for ocean heat transport (Hansen et al., 1988), whichallows temporal variation in sea surface temperature and seaice, but holds constant the horizontal heat transport fluxesin the ocean to values derived from present-day sea surfacetemperature distributions.
Mid-latitude cyclones are detected and tracked from theGCM sea-level pressure output with the same algorithm usedfor the reanalysis data (Sect. 2.1). The GCM cyclone clima-tology for 1950–1977 (1979–2006 shows the same climato-logical patterns) is compared to the observational and reanal-yses data in Fig. 2. Agreement is excellent. The numberof GCM cyclones passing through the southern climatologi-cal track (red box in Fig. 3) is 10.8±2.4 per summer for the1980–2006 period, consistent with the reanalyses (Sect. 2.1).
3 Mid-latitude cyclones as predictors of stagnation andozone pollution
The data and methods of Sect. 2 provide totals for indi-vidual summers of the number of cyclones passing throughthe southern climatological cyclone track (1948–2006 forReanalysis 1, 1979–2006 for Reanalysis 2, 1980–2006 forNOAA weather maps), as well as the numbers of stagnationdays (1980–1998) and ozone pollution days (1980–2006) ineach 2.5◦×2.5◦ grid square of the eastern US. We use thelinear Pearson correlation coefficient to correlate these dif-ferent variables on an interannual basis, and a Student’s t-test to determine the significance of the correlation. To avoidthe aliasing effects of long-term trends on the correlations,we removed linear trends from all individual time series thathad significant trends at the 95% level. Long-term trends inozone pollution days and mid-latitude cyclones will be dis-cussed in Sect. 4.
Figure 7 (top panels) shows the interannual correlation be-tween the number of stagnant days and the number of mid-latitude cyclones derived from the reanalysis datasets. Thecorrelation is generally significant and negative, indicatingthat less frequent mid-latitude cyclones in a given summerare associated with more frequent stagnant conditions. Thenegative correlation is strongest in the northeastern and mid-western US. This is because the cold fronts associated withmid-latitude cyclones generally do not extend to the southernUS (see Fig. 1); moist convection and inflow from the Gulfof Mexico are a more important ventilation pathways in thatregion (Li et al., 2005).
The middle panels of Fig. 7 show the interannual corre-lation between the number of stagnant days and the numberof ozone pollution days. There is strong positive correlationthroughout the eastern US, with the exception of grid squares
Atmos. Chem. Phys., 8, 7075–7086, 2008 www.atmos-chem-phys.net/8/7075/2008/

E. M. Leibensperger et al.: Recent climate change and US air quality 7081
Fig. 7. Interannual correlation coefficients (r) between the summer total numbers of mid-latitude cyclones, stagnation days, and ozonepollution days for 1980–1998 (top and middle panels) and 1980–2006 (bottom panels). The data are as described in Sect. 2. Numbers ofcyclones are from the NCEP/NCAR Reanalysis 1 (left), the NCEP/DOE Reanalysis 2 (middle), and NOAA daily weather maps (right).Numbers of stagnation events are from the reanalyses only.
on the edge of the domain where wind direction (i.e., advec-tion of pollution from upwind) is a more important predictor(Camalier et al., 2007).
The bottom panels of Fig. 7 show the interannual corre-lation between the number of ozone pollution days and thenumber of mid-latitude cyclones diagnosed from the reanal-yses and from the NOAA weather maps. There is widespreadnegative correlation, stronger in the Midwest and Northeastthan in the Southeast, consistent with the correlation of mid-latitude cyclones and stagnation days seen in the reanalyses.We thus see that there is a clear cause-to-effect link, at least inthe Midwest and Northeast, between mid-latitude cyclones,stagnation days, and ozone pollution days. The frequency ofmid-latitude cyclones can be used as an interannual predic-tor of air quality. An important implication, from a climatechange perspective, is that long-term trends in cyclone fre-quency may be expected to drive corresponding trends in airquality.
4 Long-term trends in mid-latitude cyclone frequencyand ozone pollution
Reanalysis 1 and the NOAA weather maps feature a sta-tistically significant decreasing trend of the number of cy-clones in the southern climatological track between 1980 and2006 (−0.15 a−1 for Reanalysis 1,−0.14 a−1 for the NOAAweather maps, both withp<0.01) (Fig. 4). Reanalysis 2does not show a significant trend. Previously derived trendsin mid-latitude cyclones have used the longer record of theReanalysis 1 data (McCabe et al., 2001; Gulev et al., 2001;Geng and Sugi, 2001). The consistent trend that we see herebetween the NOAA daily weather maps and Reanalysis 1provides important corroboration with the earlier studies.
We used the entire 1948–2006 extent of Reanalysis 1 toextend our trend analysis and compare to our GISS GCMsimulations of the same period. Results in Fig. 8 show thatthe trend in Reanalysis 1 is confined to 1980–2006. The1948–1980 period shows strong interannual variability butno trend. The GISS GCM simulation with historical changesin greenhouse gases, aerosols, and solar forcing shows a1980-2006 decreasing trend in the number of cyclones fre-quency (−0.16 a−1, p<0.01), consistent with Reanalysis 1
www.atmos-chem-phys.net/8/7075/2008/ Atmos. Chem. Phys., 8, 7075–7086, 2008
7082 E. M. Leibensperger et al.: Recent climate change and US air quality
Nu
mb
er o
f Mid
-Lat
itu
de
Cyc
lon
es
1950 2000199019801970196005
1015
51015
5101520
NCEP/NCAR Reanalysis 1
GISS GCM - Observed Forcings
GISS GCM - Equilibrium
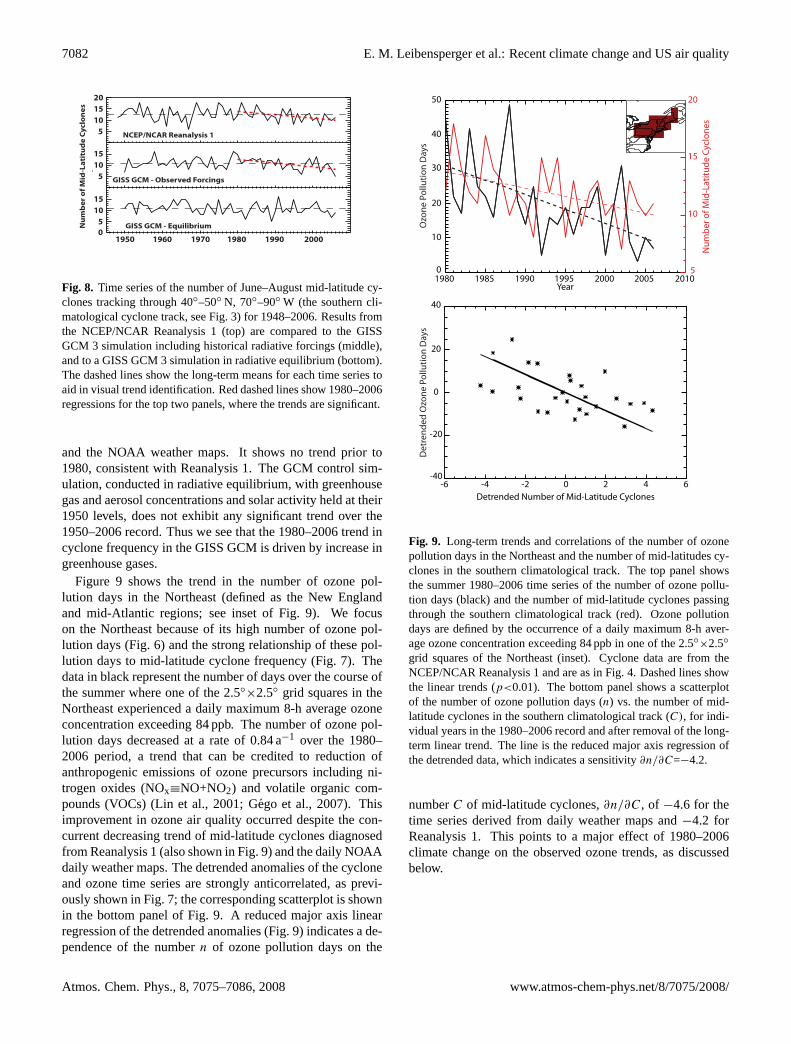
Fig. 8. Time series of the number of June–August mid-latitude cy-clones tracking through 40◦–50◦ N, 70◦–90◦ W (the southern cli-matological cyclone track, see Fig. 3) for 1948–2006. Results fromthe NCEP/NCAR Reanalysis 1 (top) are compared to the GISSGCM 3 simulation including historical radiative forcings (middle),and to a GISS GCM 3 simulation in radiative equilibrium (bottom).The dashed lines show the long-term means for each time series toaid in visual trend identification. Red dashed lines show 1980–2006regressions for the top two panels, where the trends are significant.
and the NOAA weather maps. It shows no trend prior to1980, consistent with Reanalysis 1. The GCM control sim-ulation, conducted in radiative equilibrium, with greenhousegas and aerosol concentrations and solar activity held at their1950 levels, does not exhibit any significant trend over the1950–2006 record. Thus we see that the 1980–2006 trend incyclone frequency in the GISS GCM is driven by increase ingreenhouse gases.
Figure 9 shows the trend in the number of ozone pol-lution days in the Northeast (defined as the New Englandand mid-Atlantic regions; see inset of Fig. 9). We focuson the Northeast because of its high number of ozone pol-lution days (Fig. 6) and the strong relationship of these pol-lution days to mid-latitude cyclone frequency (Fig. 7). Thedata in black represent the number of days over the course ofthe summer where one of the 2.5◦
×2.5◦ grid squares in theNortheast experienced a daily maximum 8-h average ozoneconcentration exceeding 84 ppb. The number of ozone pol-lution days decreased at a rate of 0.84 a−1 over the 1980–2006 period, a trend that can be credited to reduction ofanthropogenic emissions of ozone precursors including ni-trogen oxides (NOx≡NO+NO2) and volatile organic com-pounds (VOCs) (Lin et al., 2001; Gego et al., 2007). Thisimprovement in ozone air quality occurred despite the con-current decreasing trend of mid-latitude cyclones diagnosedfrom Reanalysis 1 (also shown in Fig. 9) and the daily NOAAdaily weather maps. The detrended anomalies of the cycloneand ozone time series are strongly anticorrelated, as previ-ously shown in Fig. 7; the corresponding scatterplot is shownin the bottom panel of Fig. 9. A reduced major axis linearregression of the detrended anomalies (Fig. 9) indicates a de-pendence of the numbern of ozone pollution days on the
1980 1985 1990 1995 2000 2005 2010Year
Ozo
ne P
ollu
tion
Day
s
0
30
10
20
40
50
Num
ber o
f Mid
-Lat
itude
Cyc
lone
s
5
10
15
20
Det
rend
ed O
zone
Pol
lutio
n D
ays
Detrended Number of Mid-Latitude Cyclones-6 -4 -2 0 2 4 6
-40
20
-20
0
40
Fig. 9. Long-term trends and correlations of the number of ozonepollution days in the Northeast and the number of mid-latitudes cy-clones in the southern climatological track. The top panel showsthe summer 1980–2006 time series of the number of ozone pollu-tion days (black) and the number of mid-latitude cyclones passingthrough the southern climatological track (red). Ozone pollutiondays are defined by the occurrence of a daily maximum 8-h aver-age ozone concentration exceeding 84 ppb in one of the 2.5◦
×2.5◦
grid squares of the Northeast (inset). Cyclone data are from theNCEP/NCAR Reanalysis 1 and are as in Fig. 4. Dashed lines showthe linear trends (p<0.01). The bottom panel shows a scatterplotof the number of ozone pollution days (n) vs. the number of mid-latitude cyclones in the southern climatological track (C), for indi-vidual years in the 1980–2006 record and after removal of the long-term linear trend. The line is the reduced major axis regression ofthe detrended data, which indicates a sensitivity∂n/∂C=−4.2.
numberC of mid-latitude cyclones,∂n/∂C, of −4.6 for thetime series derived from daily weather maps and−4.2 forReanalysis 1. This points to a major effect of 1980–2006climate change on the observed ozone trends, as discussedbelow.
Atmos. Chem. Phys., 8, 7075–7086, 2008 www.atmos-chem-phys.net/8/7075/2008/

E. M. Leibensperger et al.: Recent climate change and US air quality 7083
50
0
10
20
30
40
1980 201020052000199519901985Year
Num
ber o
f Ozo
ne P
ollu
tion
Day
sObserved Trend from Climate Change
Trend from Emission Reductions
50
0
10
20
30
40
1980 201020052000199519901985Year
Observed Trend from Climate Change
Trend from Emission Reductions
Mid-latitude Cyclone Frequency from NCEP/NCAR Reanalysis 1
Mid-latitude Cyclone Frequency from NOAA Daily Weather Maps
Fig. 10. 1980–2006 time series of the number of ozone pollution days in the northeast US (inset of Fig. 9). Observations are shown in blackand are as in Fig. 9. The red line shows the number of ozone pollution days predicted from the number of mid-latitude cyclones in the NOAAweather maps (right) and in the NCEP/NCAR Reanalysis 1 (left) if anthropogenic emissions had not changed over the period (i.e., from thedependence∂n/∂C derived in Sect. 4). Regression lines are shown and represent the observed trend (dn/dt,in black) and the trend expectedfrom climate change in the absence of change in anthropogenic emissions ([dn/dt]E , in red). The green dashed line shows the trend expectedfrom reductions in anthropogenic emissions in the absence of climate change, [dn/dt]C=dn/dt–[dn/dt]E .
5 Effect of 1980–2006 climate change on ozone air qual-ity
A long-term decreasing trend in mid-latitudes cyclones overthe 1980–2006 period, as indicated by Reanalysis 1, theNOAA daily weather maps, and the GISS GCM simulation,would imply increasing stagnation and thus a more favorablemeteorological environment for ozone pollution days. Thiscould have offset some of the gains from decreases in an-thropogenic emissions of ozone precursors, so that the returnfrom emission controls would have been less than expected.Understanding such an effect is of great importance for theaccountability of air quality policy (National Research Coun-cil, 2004).
We estimate here how the 1980–2006 trend in mid-latitude cyclones as indicated by Reanalysis 1 and the NOAAweather maps may have affected the 1980–2006 trend inozone air quality in the Northeast. The observed trend inthe number of ozone pollution days per summer,dn/dt , is−0.84 a−1 (Fig. 9). Let us assume that this observed trendis driven by trends in emissionsE and in the number of cy-clonesC. We can then decompose the observed total deriva-tive into partial derivatives:
dn
dt=
[dn
dt
]E
+
[dn
dt
]C
(1)
with[dn
dt
]E
=∂n
∂E
∂E
∂t(2)
[dn
dt
]C
=∂n
∂C
∂C
∂t(3)
where[dn/dt ]E describes the trend due to changing emis-sions in the absence of climate change, and[dn/dt ]C de-scribes the trend due to climate change in the absence ofchange in emissions. We previously derived∂n/∂C=−4.2from Reanalysis 1 (−4.6 for the weather map analysis) and∂C/∂t=−0.15 a−1 (−0.14 a−1) in Sect. 4. Thus the trendin number of ozone pollution days due to climate changeis [dn/dt ]C =0.63 a−1 (0.64 a−1). Replacing into Eq. (1)yields a trend in the number of ozone pollution days dueto changing anthropogenic emissions,[dn/dt ]E =−1.5 a−1
(−1.5 a−1). The analysis thus indicates that decreasing mid-latitude cyclone frequency over the 1980–2006 period hasoffset the benefit of emission controls almost by half.
Figure 10 shows this result graphically for the cyclonetrends from the NOAA weather maps and from Reanal-ysis 1. The time series of the number of ozone pol-lution days observed in the Northeast, as previously dis-played in Fig. 9, is shown in black with the correspond-ing regression linedn/dt=−0.84 a−1. The time series pre-dicted from the number of mid-latitude cyclones (Fig. 9)and the dependence,∂n/∂C=−4.2(−4.6), derived in Sect. 4is shown in red, with the corresponding regression line[dn/dt]C=0.63 a−1 (0.64 a−1) representing the expected trendin ozone pollution days from climate change had emissionsremained constant. We see that the frequency of ozone pol-lution days would have doubled over the 1980–2006 pe-riod as a result of climate change, were it not for concur-rent decreases in anthropogenic emissions. The green line in
www.atmos-chem-phys.net/8/7075/2008/ Atmos. Chem. Phys., 8, 7075–7086, 2008

7084 E. M. Leibensperger et al.: Recent climate change and US air quality
Fig. 10 shows the trend in ozone pollution days that wouldhave been realized from the decrease in anthropogenic emis-sions in the absence of climate change, i.e., [dn/dt]E=dn/dt–[dn/dt]C=−1.5 a−1 (−1.5 a−1). We see that the expectednumber of ozone pollution days would have dropped to zeroby 2001, instead of remaining a significant problem (ex-pected value of 10) by 2006.
6 Conclusions
We showed that the frequency of mid-latitudes cyclonestracking across eastern North America in the 40◦–50◦ N lat-itudinal band (southern climatological track) is a strong pre-dictor variable of the frequency of summertime pollutionepisodes in the eastern US. Cold fronts associated with thesecyclones effectively ventilate the US boundary layer. Weconstructed cyclone tracks using the algorithm of Bauer andDel Genio (2006) applied to assimilated meteorological datafrom the NCEP/NCAR Reanalysis 1 (1948–2006) and theNCEP/DOE Reanalysis 2 (1979–2006); the two reanalysesagree closely in the locations and frequencies of cyclonetracks, and also agree well with cyclone statistics constructeddirectly from NOAA weather maps. Statistical analysis of1980–2006 summer data shows large interannual variabil-ity in the number of cyclones in the southern climatologicaltrack (11.9±2.6 for Reanalysis 1) and reveals strong negativeinterannual correlations between the number of cyclones andboth the number of stagnation days and the number of ozonepollution days.
The frequency of mid-latitude cyclones in the 40◦–50◦ Nband is of particular interest as a predictor variable for US airquality. First, it encapsulates in a single synoptic-scale vari-able the effects of known local predictor variables includingtemperature, wind speed, and solar radiation. Second, mid-latitude cyclones are a feature of the general circulation ofthe atmosphere and are therefore amenable to trend analysisand prediction using GCMs. They can thus be used to di-agnose and project the effects of climate change on US airquality.
Greenhouse warming is expected to decrease mid-latitudecyclone frequencies (Geng and Sugi, 2003; Yin, 2005; Lam-bert and Fyfe, 2006; Meehl et al., 2007), and such a decreasehas been observed in climatological analyses of 1950–2000data (Zishka and Smith, 1980; Gulev et al., 2001; McCabe etal., 2001, Wang et al., 2006). We examined more specificallythe historical trend in the number of summer cyclones in theNorth American southern climatological track (40◦–50◦ N)responsible for ventilating the eastern US. The NCEP/NCARReanalysis 1 and the NOAA daily weather maps both showsignificant decreasing trends for 1980–2006, with consis-tent slopes (−0.15 a−1 and −0.14 a−1, respectively). TheNCEP/DOE Reanalysis 2 shows no significant trend.
The NCEP/NCAR Reanalysis 1 starts in 1948. Analysisof the complete 1948-2006 record shows no cyclone trendprior to 1980. We compared this result to a transient-climatesimulation for 1950–2006 with the GISS GCM 3 includinghistorical greenhouse and aerosol forcing. This simulationshows a decrease in the number of cyclones for 1980–2006(−0.16 a−1), and no trend prior to 1980, consistent with Re-analysis 1. A control GCM simulation for 1950–2006 withno greenhouse and aerosol forcing shows by contrast no trendover the whole period. The cyclone trend for the 1980–2006period can thus be attributed to greenhouse forcing.
A 1980-2006 decrease in cyclone frequency as indicatedby the NCEP/NCAR Reanalysis 1 and by the NOAA dailyweather maps has important implications for the success andaccountability of emission control strategies directed at im-proving US air quality. Our analysis of the surface ozonedata indicates a decrease in the observed number of summer-time ozone pollution days in the Northeast by 0.84 a−1 overthe 1980–2006 period, from an expected value of 31 (1980)to 10 (2006). This decrease can be credited to reductionof anthropogenic emissions, but we find that the benefit ofthese reductions may have been significantly offset by cli-mate change. Taking the relationship between the numberof summertime cyclones and the number of ozone pollutiondays from our correlation analysis, combined with the cy-clone trend derived from either Reanalysis 1 or the NOAAdaily weather maps, we deduce that the number of ozonepollution days would have doubled over the 1980–2006 pe-riod as a result of climate change if anthropogenic emissionshad remained constant. Correcting the observed decrease ofozone pollution days for this climate trend, we find that thenumber of ozone pollution days would have dropped to anexpected value of zero by 2001 in the absence of climatechange.
We conclude from this analysis that the decrease in mid-latitude cyclones over the 1980–2006 has offset half of theair quality gains in the Northeast US that should have beenachieved from reduction of anthropogenic emissions overthat period. This suggests that climate change has had al-ready a major effect on the accountability of emission controlstrategies over the past 2–3 decades, preventing achievementof the ozone air quality standard. It demonstrates the poten-tial of climate change to dramatically affect air quality ondecadal scales relevant to air quality policy. Future attentionto this issue is necessary in view of the consistent predictionsfrom GCMs that 21st-century climate change will decreasethe frequency of mid-latitude cyclones (Lambert and Fyfe,2006).
Our analysis has focused on ozone air quality because ofthe availability of long-term records with high spatial density.We would expect mid-latitude cyclone frequency to also be agood predictor of particulate matter (PM) air quality, whichis similarly affected by stagnation, but further analysis usingPM observational records is necessary. Also, our analysis hasfocused on the eastern US, but similar analyses would be of
Atmos. Chem. Phys., 8, 7075–7086, 2008 www.atmos-chem-phys.net/8/7075/2008/
E. M. Leibensperger et al.: Recent climate change and US air quality 7085
value for western Europe and China, where mid-latitudes cy-clones are also major agents for pollutant ventilation (Liu etal., 2003; Ordonez et al., 2005). We have found in the easternUS that although mid-latitude cyclone frequency is a goodpredictor of pollution episodes in the Northeast and Midwest,it is less effective in the South. Other large-scale meteorolog-ical metrics should be sought there and in the West to enableassessments of the effect of climate change on air quality.
Acknowledgements.This work was supported by the ElectricPower Research Institute (EPRI), the Environmental ProtectionAgency – Science To Achieve Results (EPA-STAR) Program, andan EPA-STAR Graduate Fellowship to Eric Leibensperger. TheEPA has not officially endorsed this publication and the viewsexpressed herein may not reflect those of the EPA. We thank MikeBauer for supplying and supporting the cyclone tracking procedureand Shiliang Wu for helpful discussions.
Edited by: A. Pszenny
References
Bauer, M. and Del Genio, A. D.: Composite analysis of winter cy-clones in a GCM: Influence on climatological humidity, J. Clim.,19, 1652–1672, 2006.
Bloomfield, P., Royle, J. A., Steinberg, L. J., and Yang, Q.: Ac-counting for meteorological effects in measuring urban ozonelevels and trends, Atmos. Environ., 30, 3067–3077, 1996.
Camalier, L., Cox, W., and Dolwick, P.: The effects of meteorologyon ozone in urban areas and their use in assessing ozone trends,Atmospheric Environment, 41, 7127–7137, 2007.
Chandler, M. and Jonas, J.: Atlas of extratropical storm tracks,http://data.giss.nasa.gov/stormtracks/, 1999.
Cooper, O. R., Moody, J. L., Parrish, D. D., Trainer, M., Ryerson,T. B., Holloway, J. S., Hubler, G., Fehsenfeld, F. C., Oltmans,S. J., and Evans, M. J.: Trace gas signatures of the airstreamswithin North Atlantic cyclones: Case studies from the North At-lantic Regional Experiment (NARE 1997) aircraft intensive, J.Geophys. Res.-Atmos., 106, 5437–5456, 2001.
Dickerson, R. R., Doddridge, B. G., Kelley, P., and Rhoads, K. P.:Large scale pollution of the atmosphere over the remote AtlanticOcean – Evidence from Bermuda, J. Geophys. Res.-Atmos., 100,8945–8952, 1995.
Gego, E., Porter, P. S., Gilliland, A., and Rao, S. T.: Observation-based assessment of the impact of nitrogen oxides emissions re-ductions on ozone air quality over the eastern United States, J.Appl. Meteorol. Climatol., 46, 994–1008, 2007.
Geng, Q. Z. and Sugi, M.: Variability of the North Atlantic cycloneactivity in winter analyzed from NCEP-NCAR reanalysis data, J.Clim., 14, 3863–3873, 2001.
Geng, Q. Z. and Sugi, M.: Possible change of extratropical cycloneactivity due to enhanced greenhouse gases and sulfate aerosols– Study with a high-resolution AGCM, J. Clim., 16, 2262–2274,2003.
Gulev, S. K., Zolina, O., and Grigoriev, S.: Extratropical cy-clone variability in the Northern Hemisphere winter from theNCEP/NCAR reanalysis data, Clim. Dynam., 17, 795–809,2001.
Hansen, J., Fung, I., Lacis, A., Rind, D., Lebedeff, S., Ruedy, R.,Russell, G., and Stone, P.: Global climate changes as forecastby Goddard Institute for Space Studies 3-Dimensional model, J.Geophys. Res.-Atmos., 93, D8, 9341–9364, 1988.
Hansen, J., Sato, M., Nazarenko, L., Ruedy, R., Lacis, A., Koch, D.,Tegen, I., Hall, T., Shindell, D., Santer, B., Stone, P., Novakov,T., Thomason, L., Wang, R., Wang, Y., Jacob, D., Hollandsworth,S., Bishop, L., Logan, J., Thompson, A., Stolarski, R., Lean,J., Willson, R., Levitus, S., Antonov, J., Rayner, N., Parker, D.,and Christy, J.: Climate forcings in Goddard Institute for SpaceStudies SI2000 simulations, J. Geophys. Res.-Atmos, 107, D18,doi:10.1029/2001JD001143, 2002.
Harnik, N. and Chang, E. K. M.: Storm track variations as seen inradiosonde observations and reanalysis data, J. Clim., 16, 480–495, 2003.
Hegarty, J., Mao, H., and Talbot, R.: Synoptic controls on summer-time surface ozone in the northeastern United States, J. Geophys.Res.-Atmos., 112, D14306, doi:10.1029/2006JD008170, 2007.
Hu, Q., Tawaye, Y., and Feng, S.: Variations of the Northern Hemi-sphere atmospheric energetics: 1948–2000, J. Clim., 17, 1975–1986, 2004.
Kalnay, E., Kanamitsu, M., Kistler, R., Collins, W., Deaven, D.,Gandin, L., Iredell, M., Saha, S., White, G., Woollen, J., Zhu, Y.,Chelliah, M., Ebisuzaki, W., Higgins, W., Janowiak, J., Mo, K.C., Ropelewski, C., Wang, J., Leetmaa, A., Reynolds, R., Jenne,R., and Joseph, D.: The NCEP/NCAR 40-year reanalysis project,B. Am. Meteorol. Soc., 77, 437–471, 1996.
Kanamitsu, M., Ebisuzaki, W., Woollen, J., Yang, S. K., Hnilo, J. J.,Fiorino, M., and Potter, G. L.: NCEP-DOE AMIP-II reanalysis(R-2), B. Am. Meteorol. Soc., 83, 1631–1643, 2002.
Kistler, R., Kalnay, E., Collins, W., Saha, S., White, G., Woollen,J., Chelliah, M., Ebisuzaki, W., Kanamitsu, M., Kousky, V., vanden Dool, H., Jenne, R., and Fiorino, M.: The NCEP-NCAR 50-year reanalysis: Monthly means CD-ROM and documentation,B. Am. Meteorol. Soc., 82, 247–267, 2001.
Korshover, J. and Angell, J. K.: A review of air stagnation cases inthe eastern United States during 1981 – Annual Summary, Mon.Weather Rev., 110, 1515–1518, 1982.
Lambert, S. J. and Fyfe, J. C.: Changes in winter cyclone frequen-cies and strengths simulated in enhanced greenhouse warmingexperiments: results from the models participating in the IPCCdiagnostic exercise, Clim. Dynam. 26, 713–728, 2006.
Li, Q. B., Jacob, D. J., Park, R., Wang, Y. X., Heald, C. L., Hudman,R., Yantosca, R. M., Martin, R. V., and Evans, M.: North Ameri-can pollution outflow and the trapping of convectively lifted pol-lution by upper-level anticyclone, J. Geophys. Res.-Atmos. 110,D10301, doi:10.1029/2004JD005039, 2005.
Lin, C. Y. C., Jacob, D. J., and Fiore, A. M.: Trends in exceedancesof the ozone air quality standard in the continental United States,1980–1998, Atmos. Environ., 35, 3217–3228, 2001.
Lin, J.-T., Patten, K. O., Hayhoe, K., Liang, X.-Z., and Wuebbles,D. J.: Effects of future climate and biogenic emissions changeson surface ozone over the United States and China, J. Appl. Me-teorol. Climatol., 47, 1888–1909, 2008.
Liu, H. Y., Jacob, D. J., Bey, I., Yantosca, R. M., Duncan, B. N., andSachse, G. W.: Transport pathways for Asian pollution outflowover the Pacific: Interannual and seasonal variations, J. Geophys.Res.-Atmos., 108, D20, 2003.
www.atmos-chem-phys.net/8/7075/2008/ Atmos. Chem. Phys., 8, 7075–7086, 2008

7086 E. M. Leibensperger et al.: Recent climate change and US air quality
Logan, J. A.: Ozone in rural areas of the United States, J. Geophys.Res.-Atmos., 94, D6, 8511–8532, 1989.
McCabe, G. J., Clark, M. P., and Serreze, M. C.: Trends in NorthernHemisphere surface cyclone frequency and intensity, J. Clim.,14, 2763–2768, 2001.
Meehl, G. A., Stocker, T. F., Collins, W. D., Friedlingstein, P., Gaye,A. T., Gregory, J. M., Kitoh, A., Knutti, R., Murphy, J. M., Noda,A., Raper, S. C. B., Watterson, I. G., Weaver, A. J., and Zhao,Z.-C.: Global Climate Projections, in: Climate Change 2007:The Physical Science Basis, edited by: Solomon, S., Qin, D.,Manning, M., Chen, Z., Marquis, M., Averyt, K. B., Tignor, M.,and Miller, H. L., Cambridge University Press, Cambridge, UK,747–846, 2007.
Merrill, J. T. and Moody, J. L.: Synoptic meteorology and transportduring the North Atlantic Regional Experiment (NARE) inten-sive: Overview, J. Geophys. Res.-Atmos., 101, 28 903–28 921,1996.
Mickley, L. J., Jacob, D. J., Field, B. D., and Rind, D.:Effects of future climate change on regional air pollutionepisodes in the United States, Geophys. Res. Lett., 31, L24103,doi:10.1029/2004GL021216, 2004.
Murazaki, K. and Hess, P.: How does climate change contribute tosurface ozone change over the United States?, J. Geophys. Res.-Atmos., 111, D05301, doi:10.1029/2005JD005873, 2006.
National Research Council: Air Quality Management in the UnitedStates, National Academies Press, Washington, DC, 2004.
Ordonez, C., Mathis, H., Furger, M., Henne, S., Huglin, C., Stae-helin, J., and Prevot, A. S. H.: Changes of daily surface ozonemaxima in Switzerland in all seasons from 1992 to 2002 and dis-cussion of summer 2003, Atmos. Chem. Phys., 5, 1187–1203,2005,http://www.atmos-chem-phys.net/5/1187/2005/.
Owen, R. C., Cooper, O. R., Stohl, A., and Honrath, R. E.: An anal-ysis of the mechanisms of North American pollutant transportto the central North Atlantic lower free troposphere, J. Geophys.Res.-Atmos., 111, D23S58, doi:10.1029/2006JD007062, 2006.
Paciorek, C. J., Risbey, J. S., Ventura, V., and Rosen, R. D.: Mul-tiple indices of Northern Hemisphere cyclone activity, winters1949–1999, J. Clim., 15, 1573–1590, 2002.
Racherla, P. N. and Adams, P. J.: The response of surface ozoneto climate change over the Eastern United States, Atmos. Chem.Phys., 8, 871–885, 2008,http://www.atmos-chem-phys.net/8/871/2008/.
Rind, D., Lerner, J., Jonas, J., and McLinden, C.: Ef-fects of resolution and model physics on tracer transportsin the NASA Goddard Institute for Space Studies generalcirculation models, J. Geophys. Res.-Atmos., 112, D09315,doi:10.1029/2006JD007476, 2007.
Tagaris, E., Manomaiphiboon, K., Liao, K. J., Leung, L. R., Woo,J. H., He, S., Amar, P., and Russell, A. G.: Impacts of globalclimate change and emissions on regional ozone and fine partic-ulate matter concentrations over the United States, J. Geophys.Res.-Atmos., 112, D14312, doi:10.1029/2006JD008262, 2007.
Thompson, M. L., Reynolds, J., Cox, L. H., Guttorp, P., and Samp-son, P. D.: A review of statistical methods for the meteorologi-cal adjustment of tropospheric ozone, Atmos. Environ., 35, 617–630, 2001.
Vukovich, F. M.: Regional scale boundary layer ozone variations inthe eastern United States and their association with meteorologi-cal variations, Atmos. Environ., 29, 2259–2273, 1995.
Wang, J. X. L. and Angell, J. K.: Air Stagnation Climatology forthe United States, NOAA/Air Resource Laboratory ATLAS No.1, 1999.
Wang, X. L., Wan, W. H., and Swail, V. R.: Observed changes incyclone activity in Canada and their relationships to major circu-lation regimes, J. Clim., 19, 896–915, 2006.
Whittaker, L. M. and Horn, L. H.: Geographical and seasonaldistribution of North American cyclogenesis, 1958–1977, Mon.Weather Rev., 109, 2312–2322, 1981.
Wu, S., Mickley, L. J., Leibensperger, E. M., Jacob, D. J., Rind,D., and Streets, D. G.: Effects of 2000–2050 global change onozone air quality in the United States, J. Geophys. Res.-Atmos.,113, D06302, doi:10.1029/2007JD008917, 2008.
Yin, J. H.: A consistent poleward shift of the storm tracks in sim-ulations of 21st century climate, Geophys. Res. Lett., L18701,doi:10.1029/2005GL023684, 2005.
Zheng, J., Swall, J. L., Cox, W. M., and Davis, J. M.: Interannualvariation in meteorologically adjusted ozone levels in the easternUnited States: A comparison of two approaches, Atmos. Envi-ron., 41, 705–716, 2007.
Zishka, K. M., and Smith, P. J.: The climatology of cyclones andanticyclones over North America and surrounding ocean envi-rons for January and July, 1950–1977, Mon. Weather Rev., 108,387–401, 1980.
Atmos. Chem. Phys., 8, 7075–7086, 2008 www.atmos-chem-phys.net/8/7075/2008/