Sensitivity of Pavement ME Design Predicted Distresses to ...
15
1 Sensitivity of Pavement ME Design Predicted Distresses to Asphalt Materials Inputs Saman Esfandiarpour Ph.D candidate, Department of Civil Engineering University of Manitoba E3-386 EITC, 15 Gillson Street, Winnipeg, MB R3T 5V6 E-mail: [email protected] M. Alauddin Ahammed, Ph.D., P.Eng. Pavement Design Engineer, Manitoba Infrastructure and Transportation (MIT) Adjunct Professor, Department of Civil Engineering, University of Manitoba 920- 215 Garry Street, Winnipeg, MB R3C 3P3 Tel. (204) 792- 1338, Fax. (204) 945-2229 E-mail: [email protected] Ahmed Shalaby, Ph.D., P.Eng. Professor and Head, Department of Civil Engineering University of Manitoba E1-368 EITC, 15 Gillson Street, Winnipeg, MB R3T 5V6 Tell: (204) 474-6818 Email: [email protected] Tara Liske, M.Sc., P.Eng. Surfacing Materials Engineer Manitoba Infrastructure and Transportation (MIT) 920- 215 Garry Street, Winnipeg, MB R3C 3P3 Tel: (204) 612-7598, Fax: (204) 945-2229 E-mail: [email protected] Said Kass, M.Eng., P.Eng. Director, Materials Engineering Branch Manitoba Infrastructure and Transportation (MIT) 920- 215 Garry Street, Winnipeg, MB R3C 3P3 Tel: (204) 945-2279, Fax: (204) 945-2229 Email: [email protected] Paper prepared for presentation at the Pavement Design Innovations to Implementation (AASHTOWare Pavement ME Design Case Studies) Session of the 2013 Conference of the Transportation Association of Canada Winnipeg, Manitoba
Transcript of Sensitivity of Pavement ME Design Predicted Distresses to ...

1
Sensitivity of Pavement ME Design Predicted Distresses to Asphalt Materials Inputs
Saman Esfandiarpour Ph.D candidate, Department of Civil Engineering
University of Manitoba E3-386 EITC, 15 Gillson Street,
Winnipeg, MB R3T 5V6 E-mail: [email protected]
M. Alauddin Ahammed, Ph.D., P.Eng.
Pavement Design Engineer, Manitoba Infrastructure and Transportation (MIT) Adjunct Professor, Department of Civil Engineering, University of Manitoba
920- 215 Garry Street, Winnipeg, MB R3C 3P3 Tel. (204) 792- 1338, Fax. (204) 945-2229
E-mail: [email protected]
Ahmed Shalaby, Ph.D., P.Eng. Professor and Head, Department of Civil Engineering
University of Manitoba E1-368 EITC, 15 Gillson Street,
Winnipeg, MB R3T 5V6 Tell: (204) 474-6818
Email: [email protected]
Tara Liske, M.Sc., P.Eng.
Surfacing Materials Engineer Manitoba Infrastructure and Transportation (MIT) 920- 215 Garry Street, Winnipeg, MB R3C 3P3
Tel: (204) 612-7598, Fax: (204) 945-2229 E-mail: [email protected]
Said Kass, M.Eng., P.Eng.
Director, Materials Engineering Branch Manitoba Infrastructure and Transportation (MIT) 920- 215 Garry Street, Winnipeg, MB R3C 3P3
Tel: (204) 945-2279, Fax: (204) 945-2229 Email: [email protected]
Paper prepared for presentation
at the Pavement Design Innovations to Implementation (AASHTOWare Pavement ME Design Case Studies) Session
of the 2013 Conference of the Transportation Association of Canada Winnipeg, Manitoba

2
ABSTRACT
AASHTO's Pavement ME Design software implements the new mechanistic empirical pavement design and analysis method. Agencies adopting Pavement ME Design require appropriate input values corresponding to local material specifications, traffic loading and environmental conditions. Based on the quality of the input data, there are three levels (Levels 1 to 3) of local materials data that can be used in the Pavement ME program. For the most reliable design and analysis, Level 1 data is recommended. The Level 1 materials data can only be obtained from laboratory tests. On the other hand, Level 3 materials data can be obtained from default or typical values and are considered the least reliable.
In order to adopt the Pavement ME Design procedure, Manitoba Infrastructure and Transportation (MIT) engaged the Pavement Research Group at the University of Manitoba to develop Level 1 asphalt materials inputs through a comprehensive material characterization program. Testing of asphalt mixes for Level 1 inputs such as the dynamic modulus, creep compliance, indirect tensile (IDT) strength and Poisson’s ratio are being conducted on material samples collected from different project sites in Manitoba. This paper presents a comparison of Pavement ME Design predicted distresses using Manitoba Level 3 and Manitoba Level 1 asphalt mix properties. The information presented in this paper is expected to assist Manitoba and other agencies to assess the significance of the advanced testing program, to make an informed decision regarding the use of the test results and to determine the requirements for future testing.
INTRODUCTION
Background of Flexible Pavement Design For many years, AASHTO 1993 Pavement Design Guide (AASHTO Guide for Design of Pavement Structures) was the common approach for pavement structural design. The AASHTO 1993 design is based on empirical models. The empirical models were developed based on limited data and pavement structure. The new Mechanistic-Empirical Pavement Design Guide (MEPDG) was introduced in 2007 by the National Cooperative Highway Research Program (NCHRP, Project 1-37A) as an improved methodology of pavement design and analysis. The new guide incorporates climate data, traffic loads and material characteristics that can have an effect on pavement design [1]. The DARWin-ME (recently named as the AASHTOWare Pavement ME) Design program uses the MEPDG to design and analyze flexible and rigid pavement structures. Different design traffic loadings, climate data and material properties are used as inputs into this software to predict future pavement distresses. The flexible pavement distresses included in this software are mainly surface roughness, total permanent deformation (rutting), asphalt layer permanent deformation, asphalt bottom-up fatigue cracking, asphalt top-down fatigue cracking and asphalt thermal cracking. The distress prediction models require inputs to be defined by the user. The user defined inputs include asphalt, base, subbase and subgrade materials characteristics, traffic loading (include truck volume, truck traffic growth rate, truck class distribution and temporal variations, etc.), and climate data for a proposed/trial pavement structure. DARWin-ME Design

3
program has options for three levels of inputs. Level 1 has the highest level of accuracy and generally needs site specific data and material properties obtained through laboratory testing. It is usually used for heaviest traffic load or places where there is safety issue and/or where an early failure should be avoided. Level 2 has the intermediate level of accuracy. Level 2 inputs are obtained through a shorter than Level 1 testing program and/or correlation. Level 2 inputs are used for routine pavement design. Level 3 has the lowest level of accuracy since the typical agency data or software default data are used [2]. Experience of Other Agencies Many agencies in North America are working and gaining knowledge in the process of adopting this new design method. Some agencies have shown a significant advancement to implement the MEPDG and to develop an appropriate database for calibrating the MEPDG distress prediction models. Baus and Stires (2010) presented a summary of the MEPDG implementation in some states in the United States. Florida Department of Transportation (FDOT) evaluated the sensitivity of typical flexible and rigid pavement structures to the predicted distresses based on local climate condition and traffic load. Results indicated that the predicted distresses are highly sensitive to asphalt concrete (AC) dynamic modulus, layer thickness, base and subgrade modulus, coefficient of thermal expansion of portland cement concrete (PCC), PCC joint spacing, dowel bar diameter and PCC compressive strength. In Maryland, different climatic locations consisting of different temperatures and precipitation levels and three levels of traffic were used to investigate the sensitivity of the MEPDG input parameters to the predicted distresses. Results indicated that the longitudinal cracking model is not reliable. Based on Maryland Department of Transportation’s (Maryland DOT) report, increased base thickness resulted in a small decrease of fatigue cracking and a very slight change in rutting. However, increased asphalt thickness resulted in decrease in both fatigue cracking and rutting. Fatigue cracking and rutting increased when the content of asphalt binder was increased. Maryland DOT results also showed that the influence of ground water table location is negligible. Minnesota Department of Transportation (MnDOT) reported that the longitudinal cracking is highly sensitive to asphalt layer thickness and soil type. Transverse cracking is highly sensitive to three important parameters: climate, asphalt layer thickness and asphalt binder. New Jersey Department of Transportation (NJDOT) stated that the predicted rutting and alligator cracking by the MEPDG software are highly sensitive to number of axles per truck. However, NJDOT indicated that IRI is insensitive to traffic inputs. In Wisconsin, nineteen pavement structures throughout the state were used to evaluate the sensitivity of different pavement thicknesses. The MEPDG and Wisconsin Department of Transpiration (WisDOT) design methods were compared. Results indicated that pavements that fail to pass the MEPDG criteria do not essentially fail to WisDOT design method [2-8]. Iowa Department of Transportation reported that change in asphalt layer thickness does not show significant influence on alligator cracking, transverse cracking and IRI. Also, the MEPDG predicted results showed that alligator cracking, longitudinal cracking, and rutting are highly sensitive to truck volume [9]. Manitoba Infrastructure Transportation (MIT), like many other highway agencies, is planning to implement the DARWin-ME Design program. For this purpose, a comprehensive material

4
characterization program has been assigned developed and contracted to the Pavement Research Group at the University of Manitoba. This paper discusses the sensitivity of the DARWin ME predicted distresses to some of the asphalt material inputs that are obtained through this advance testing program.
OBJECTIVES AND SIGNIFICANCE
The main objective of this study is to compare the predicted distresses based on Manitoba Level 3 and Manitoba Level 1 asphalt mix properties. DARWin-ME Design program was used to investigate the performance of typical flexible pavement and to evaluate the sensitivity of different inputs parameters of asphalt mixes to the predicted distresses. The outcome from this analysis is expected to assist MIT and other agencies to assess the significance of the advanced testing to make an informed decision regarding the use of the test results and to determine the requirements for further testing.
PROJECT DESCRIPTION AND INPUTS DATA
Several asphalt mix samples have been collected to determine the material properties required as Level 1 inputs. To develop Level 1 inputs data, a comprehensive material characterization program was required. Therefore, MIT engaged the University of Manitoba Pavement Research Group to test typical Manitoba asphalt mix, base and subgrade materials. Various tests such as the resilient modulus, dynamic modulus, creep compliance, and indirect tensile strength tests were conducted on asphalt samples according to ASTM D7369, AASHTO T342, and AASHTO T 322, respectively. All the samples were collected from the highway construction projects in Manitoba. Also, the complex shear modulus and phase angle of the asphalt binder for each corresponding project (from where the asphalt samples were collected) were determined using the dynamic shear rehometer (DSR) test according to AASHTO T 315. For the analysis presented in this paper, three different asphalt mix designs (A, B and C) were selected to evaluate their performance as predicted by the DARWin-ME Design program. Mix B has 50% Reclaimed Asphalt Pavement (RAP) while mix A and C contain no RAP. Mix A and C contain 5% asphalt binder and Mix B contains 5.2% asphalt binder (4% virgin asphalt binder and 1.2 % RAP binder). The design example presented in this paper assumes a two-lane two-way highway with annual average daily truck traffic (AADTT) of 500, 50% trucks in the design direction and 100% trucks of each direction is on the design lane. The design life of the pavement is assumed to be 20 years. Winnipeg was selected as the project environmental condition and its historical climate data was used in all analysis. The structural thicknesses were estimated based on subgrade strength and traffic level used in this paper. In order to evaluate the asphalt mix performance, the thicknesses for all layers were kept unchanged. MATERIALS PROPERTIES

5
Unbound materials inputs In order to compare the impact of Manitoba Level 3 and Level 1 inputs for asphalt concrete mix, typical properties of Manitoba unbound materials were used for all the analysed levels. Table 1 shows the subgrade, subbase and base material properties and their layer thicknesses. Asphalt binder and asphalt mixture inputs Three asphalt mixes with different binder grade and properties were evaluated in this research. Binder and asphalt mixture properties are presented in Table 2. Table 1: Unbound materials properties
Properties Subgrade Subbase Base
Materials Type High Plastic Clay (A-7-6)
Crushed lime stone C-base
Crushed lime stone A-base
Thickness (mm) - 300 200 Resilient Modulus (MPa) 60 120 140 Moisture Content (%) 28.3 9 10.8 Liquid limit 84 NP NP Plasticity Index 56 NP NP Maximum Dry Density (Kg/𝑚3) 1,437 2,219 2,051

6
Table 2: Binder and asphalt mixture properties from the mix designs
Mix design Layer thickness (mm)
Binder properties Asphalt mixture properties
Binder performance grade
Complex shear modulus (𝐺∗) and phase angle (𝛿)
Maximum aggregate size (mm)
Air void (%)
VMA (%)
Unit weight (kg/𝑚3)
A 150 52-34 Provided 19 4 13.5 2,409 B 150 52-28 - 19 3.8 12.4 2,425 C 150 52-34 Provided 19 4.9 13.9 2,364 Complex shear modulus (𝐺∗) and phase angle (𝛿) for mix A and C were measured by using DSR. Binder superpave performance grade inputs are shown in Table 3. Table 3: Binder complex shear modulus (𝐺∗) and phase angle (𝛿) Mix design Temperature
(degree C) Complex shear modulus, 𝐺∗ (Pa)
Phase angle, 𝛿 (degree)
A
15 2,230,000 60.8 35 86,000 73.3 52 3,370 83.6 58 1,530 85.4
C
15 1,680,000 61.8 35 77,500 73.1 52 3,280 83 58 1,530 85
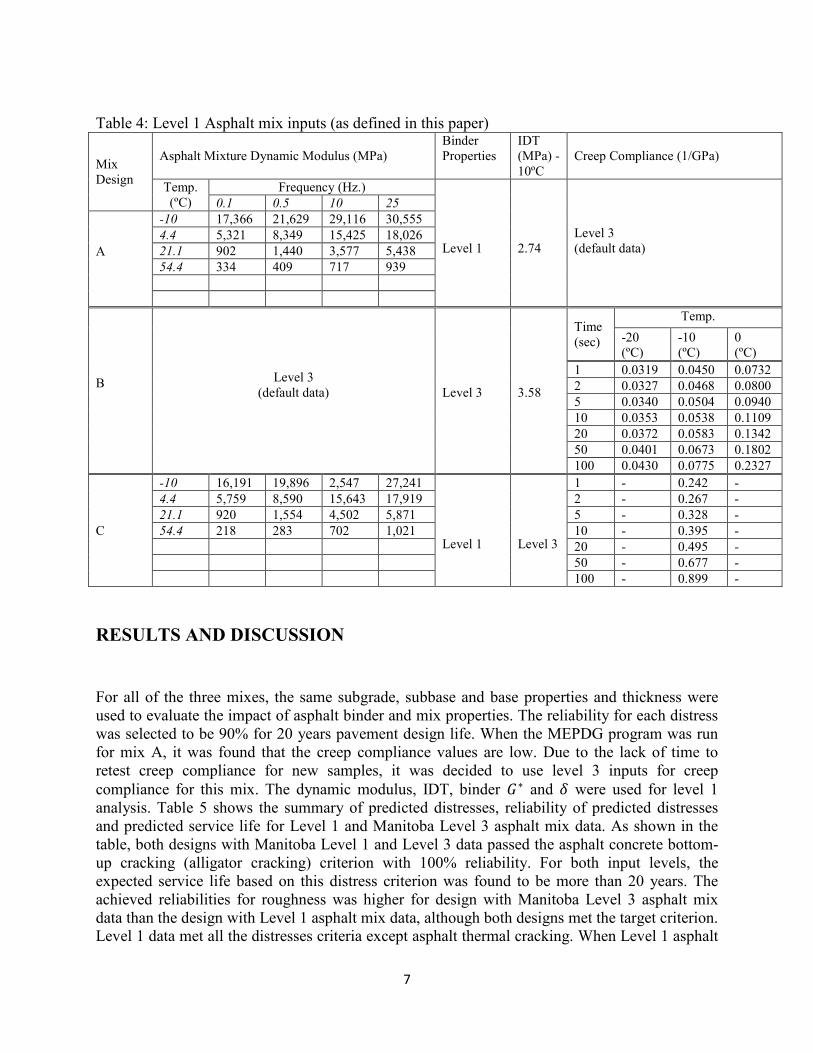
Table 4 presents the summary of asphalt mixture input details for three Manitoba Level 1 mix designs.
7
Table 4: Level 1 Asphalt mix inputs (as defined in this paper)
Mix Design
Asphalt Mixture Dynamic Modulus (MPa) Binder Properties
IDT (MPa) -10ºC
Creep Compliance (1/GPa)
Temp. (ºC)
Frequency (Hz.) Level 1
2.74
Level 3 (default data)
0.1 0.5 10 25
A
-10 17,366 21,629 29,116 30,555 4.4 5,321 8,349 15,425 18,026 21.1 902 1,440 3,577 5,438 54.4 334 409 717 939
B
Level 3 (default data)
Level 3
3.58
Time (sec)
Temp. -20 (ºC)
-10 (ºC)
0 (ºC)
1 0.0319 0.0450 0.0732 2 0.0327 0.0468 0.0800 5 0.0340 0.0504 0.0940 10 0.0353 0.0538 0.1109 20 0.0372 0.0583 0.1342 50 0.0401 0.0673 0.1802 100 0.0430 0.0775 0.2327
C
-10 16,191 19,896 2,547 27,241 Level 1
Level 3
1 - 0.242 - 4.4 5,759 8,590 15,643 17,919 2 - 0.267 - 21.1 920 1,554 4,502 5,871 5 - 0.328 - 54.4 218 283 702 1,021 10 - 0.395 - 20 - 0.495 - 50 - 0.677 - 100 - 0.899 -
RESULTS AND DISCUSSION
For all of the three mixes, the same subgrade, subbase and base properties and thickness were used to evaluate the impact of asphalt binder and mix properties. The reliability for each distress was selected to be 90% for 20 years pavement design life. When the MEPDG program was run for mix A, it was found that the creep compliance values are low. Due to the lack of time to retest creep compliance for new samples, it was decided to use level 3 inputs for creep compliance for this mix. The dynamic modulus, IDT, binder 𝐺∗ and 𝛿 were used for level 1 analysis. Table 5 shows the summary of predicted distresses, reliability of predicted distresses and predicted service life for Level 1 and Manitoba Level 3 asphalt mix data. As shown in the table, both designs with Manitoba Level 1 and Level 3 data passed the asphalt concrete bottom-up cracking (alligator cracking) criterion with 100% reliability. For both input levels, the expected service life based on this distress criterion was found to be more than 20 years. The achieved reliabilities for roughness was higher for design with Manitoba Level 3 asphalt mix data than the design with Level 1 asphalt mix data, although both designs met the target criterion. Level 1 data met all the distresses criteria except asphalt thermal cracking. When Level 1 asphalt

8
mix inputs were used, the predicted pavement service life was 9 years at the design reliability based on the thermal cracking criterion. Conversely, pavement service life was more than 20 years at the design reliability when Level 3 input data was used. Figure 1 shows the predicted pavement service life based on thermal cracking for both input levels. As shown in Table 5 and Figure 1, DARWin ME underestimates the thermal cracking when Level 3 asphalt mix and asphalt binder inputs are used as compared to the Level 1 inputs. Table 5 also shows that when Manitoba Level 3 asphalt mix data was used as inputs, asphalt layer rutting did not meet the target. The achieved reliability was found to be 88.22% for level 3 asphalt mix inputs while the reliability was 97.65% for level 1 inputs.
Figure 1: Thermal cracking and pavement life for mix A (Level 1 on left hand side and Level 3 on right hand side)

9
Table 5: MEPDG output for mix design A
Distresses
Input data Manitoba Level 3
Manitoba Level 1
Terminal IRI
Target (m/Km) 2.7 2.7
Predicted (m/Km) 2.52 2.68
Reliability predicted (%) 94.98 90.5
Acceptance Pass Pass
Predicted life at 90% reliability (yrs) >20 20
AC Surface Down Cracking
Target (m/Km) 378.8 378.8
Predicted (%) 294.69 245.5
Reliability predicted (%) 95.11 97.66
Acceptance Pass Pass
Predicted life at 90% reliability (yrs) >20 >20
AC Bottom Up Cracking
Target (%) 25 25
Predicted (%) 1.7 1.63
Reliability predicted (%) 100 100
Acceptance pass Pass
Predicted life at 90% reliability (yrs) >20 >20
AC Thermal Fracture
Target (m/Km) 189.4 189.4
Predicted (m/Km) 9.23 344.30
Reliability predicted (%) 100 35.17
Acceptance Pass Fail
Predicted life at 90% reliability (yrs) >20 9
Permanent Deformation (AC Rutting only)
Target (mm) 6 6
Predicted (mm) 6.14 5.1
Reliability predicted (%) 88.22 97.65
Acceptance Fail Pass
Predicted life at 90% reliability (yrs) - -
Permanent Deformation (Total Pavement Rutting)
Target (mm) 19 19
Predicted (mm) 14.76 13.23
Reliability predicted (%) 99.93 100
Acceptance Pass Pass
Predicted life at 90% reliability (yrs) >20 >20

10
The second mix design had 50% RAP which is identified as mix B. Since the testing for binder properties of this mix design could not be completed, only the creep compliance and IDT strength were used as measured Level 1 input data. Default values for dynamic modulus of asphalt mix and superpave binder properties were used (although the testing for the dynamic modulus was complete, the DARWin ME Design program does not allow entering the dynamic modulus without entering the binder 𝐺∗ and 𝛿 values). Table 6 presents the summary of the predicted distresses for the designs with two levels of inputs for Mix B. As shown in the table, the achieved reliabilities for all of the predicted distresses are almost the same except the asphalt concrete thermal cracking. It indicates that the MEPDG program results are sensitive to dynamic modulus and binder properties. The designs for both input levels did not meet the roughness and thermal cracking criteria. When Manitoba Level 3 inputs data was used, the predicted thermal cracking was 608.57 m/km. Alternatively, the predicted thermal cracking was 491.04 m/km when Manitoba Level 1 creep compliance and IDT strength data were used. For this asphalt mix design trials the thermal cracking was shown to be very sensitive to creep compliance. Table 6 shows that the reliability for the predicted thermal cracking was 9.78% for Level 3 input but only 0.15% for the Level 1 input although the predicted thermal cracking value was lower for the Level 1 input as compared to the Level 3 input. The predicted reliability appeared to be erroneous for this trial design. The MEPDG predicted pavement service life was found to be 18 years at the design reliability based on roughness criterion for both levels of asphalt material inputs for Mix B. It should be noted that MEPDG roughness prediction can be influenced by the predicted cracking. It is expected that if the design meets thermal cracking criterion, it will change the predicted roughness as well.

11
Table 6: MEPDG output for mix design B
Distresses
Input data Manitoba Level 3
Manitoba Level 1
Terminal IRI
Target (m/Km) 2.7 2.7 Predicted (m/Km) 2.83 2.82 Reliability predicted (%) 85.32 85.68 Acceptance Fail Fail Predicted life at 90% reliability (yrs) 18 18
AC Surface Down Cracking
Target (m/Km) 378.8 378.8 Predicted (%) 266.22 266.22 Reliability predicted (%) 96.66 96.66 Acceptance Pass Pass Predicted life at 90% reliability (yrs) >20 >20
AC Bottom Up Cracking
Target (%) 25 25 Predicted (%) 1.64 1.64 Reliability predicted (%) 100 100 Acceptance Pass Pass Predicted life at 90% reliability (yrs) >20 >20
AC Thermal Fracture
Target (m/Km) 189.4 189.4 Predicted (m/Km) 608.57 491.04 Reliability predicted (%) 9.78 0.15 Acceptance Fail Fail Predicted life at 90% reliability (yrs) 2 <2
Permanent Deformation (AC Rutting only)
Target (mm) 6 6 Predicted (mm) 4.78 4.78 Reliability predicted (%) 98.92 98.92 Acceptance Pass Pass Predicted life at 90% reliability (yrs) - -
Permanent Deformation (Total Pavement Rutting)
Target (mm) 19 19 Predicted (mm) 12.93 12.93 Reliability predicted (%) 100 100 Acceptance Pass Pass Predicted life at 90% reliability (yrs) >20 >20

12
Table 7 shows the summary of the MEPDG predicted pavement distresses for mix design C. All the inputs data for this mix and binder were obtained from laboratory testing (Level 1 data) except the creep compliance and the IDT strength. Since the creep compliance data only for -10ºC was available, Level 2 was selected for the creep compliance input. For the IDT strength, Level 3 input was used since the IDT strength at -10 ºC was not available. When Level 1 input data was used for Mix C, the design met the all distresses criteria. The predicted pavement service life at 90% reliability was found to be more than 20 years. Manitoba Level 3 data was used for this mix as well. Results indicated that the top-down cracking (longitudinal cracking) and the permanent deformation in asphalt layer (AC layer rutting) do not meet the targets. Figure 2 shows the predicted longitudinal cracking for the design with Level 3 inputs for the asphalt mix and asphalt binder. In general, the predicted reliabilities for Level 1 inputs were found to be higher than Level 3 inputs.
Figure 2: Predicted longitudinal cracking and pavement life for mix C - Level 3
The results presented in Tables 5 and 7 indicate that the permanent deformation in asphalt layer (rutting) was higher than the target for both mixes A and C when Level 3 input data was used. However, both mix designs met the AC rutting criterion, when the measured Manitoba Level 1 data was used. This indicates that MEPDG program underestimates stiffness of asphalt mixture if Level 3 inputs are used.

13
Table 7: MEPDG output for mix design C
Distresses
Input data Manitoba Level 3
Manitoba Level 1
Terminal IRI
Target (m/Km) 2.7 2.7 Predicted (m/Km) 2.56 2.47 Reliability predicted (%) 94.03 95.89 Acceptance Pass Pass Predicted life at 90% reliability (yrs) >20 >20
AC Surface Down Cracking
Target (m/Km) 378.8 378.8 Predicted (%) 388.27 305.18 Reliability predicted (%) 89.41 94.5 Acceptance Fail Pass Predicted life at 90% reliability (yrs) 19.5 >20
AC Bottom Up Cracking
Target (%) 25 25 Predicted (%) 1.95 1.75 Reliability predicted (%) 100 100 Acceptance Pass Pass Predicted life at 90% reliability (yrs) >20 >20
AC Thermal Fracture
Target (m/Km) 189.4 189.4 Predicted (m/Km) 54.95 13.65 Reliability predicted (%) 100 100 Acceptance Pass Pass Predicted life at 90% reliability (yrs) >20 >20
Permanent Deformation (AC Rutting only)
Target (mm) 6 6 Predicted (mm) 6.13 4.44 Reliability predicted (%) 88.27 99.62 Acceptance Fail Pass Predicted life at 90% reliability (yrs) - -
Permanent Deformation (Total Pavement Rutting)
Target (mm) 19 19 Predicted (mm) 14.59 12.42 Reliability predicted (%) 99.95 100 Acceptance Pass Pass Predicted life at 90% reliability (yrs) >20 >20

14
SUMMARY AND CONCLUSIONS
Manitoba Infrastructure Transportation (MIT) is evaluating the prediction models of the DARWin-ME Design program. In order to adopt the MEPDG procedure, Level 1 asphalt materials inputs are required to be developed through a comprehensive material characterization program. The Pavement Research Group, University of Manitoba was engaged to develop Level 1 asphalt materials inputs. This paper presents the comparison of the predicted distresses based on Manitoba Level 3 and measured Level 1 asphalt properties. Three different mixes were selected to evaluate their performance. In order to examine the influence of asphalt mixes, layer thickness and properties of subgrade, subbase and base were kept the same for all the mix design trials. The design trials showed that: 1. The first mix (mix A) did not meet the thermal cracking criterion when Level 1 data was
used. When Level 3 input data was used, this mix met the thermal cracking criterion but it did not meet the asphalt permanent deformation (rutting) criterion. DARWin ME was shown to underestimates the thermal cracking when Level 3 asphalt mix and asphalt binder inputs was used as compared to the Level 1 inputs.
2. For mix design B, Level 1 and Level 3 input data showed almost the same performance, except the thermal cracking. Predicted reliability for thermal cracking was found to be very low when Level 1 was used. For this mix, the thermal cracking was found to be very sensitive to the creep compliance.
3. Mix design C met all distress criteria, when the measured Level 1 data was used. However,
the AC surface-down cracking (longitudinal cracking) and permanent deformation did not meet pavement service life when Level 3 data was used. It indicates that the MEPDG program underestimates stiffness of asphalt mixture when Level 3 data is used.
A limited number of samples or inputs were evaluated in this paper. Further analysis using more samples with a wide range of material properties and traffic loads is recommended.
References
1. Wu, Z., Evaluation of Current Louisiana Flexible Pavement Structure Using PMS Data and New Mechanistic-Empirical Pavement Design Guide, Louisiana Transportation research center, April 2012.
2. Momin, S. A., Local Calibration of Mechanistic Empirical Pavement Design Guide for North
Eastern United States, Master of Science in Civil Engineering, the University Of Texas at Arlington, August 2011.

15
3. Baus, R. L. and Stires, N. R., Mechanistic-Empirical Pavement Design Guide Implementation, Department of Civil and Environmental Engineering, University of South Carolina, July 2010, Report No. GT06-10.
4. Fernando, F. G., Oh, J., and Ryu, D., Phase I of MEPDG Program Implementation in Florida,
Report D04491/PR15281-1, Texas Transportation Institute, College Station, TX, 2007. 5. Schwartz, C., Implementation of the NCHRP 1-37A Design Guide, Maryland State Highway
Administration, Lutherville, MD, 2007, Report No.SP0077B41. 6. Velasquez, R., Hoegh, K., Yut, I., Funk, N., Cochran, G., Marasteanu, M., and Khazanovich,
L., Implementation of the MEPDG for New and Rehabilitated Pavement Structures for Design of Concrete and Asphalt Pavements in Minnesota, Minnesota Department of Transportation, St. Paul, MN, 2009, Report MN/RC 2009-06.
7. Pavement Resource Program Quarterly Progress Report, Center for Advanced Infrastructure
& Transportation, Rutgers, the State University of New Jersey, 2006.
8. Ahammed, M. A., Kass, S., Hilderman, S., Tang, W. K. S., MEPDG Implementation: Manitoba Experience, Annual Conference of the Association of Canada Edmonton, Alberta, 2011.
9. Ceylan1, H., Coree, B., and Gopalakrishnan, K., Evaluation of the Mechanistic -
Empirical Pavement Design Guide for Implementation in Iowa, The Baltic Journal of Road and Bridge Engineering, Vol. 4(1):12, 2009.