Sensitivity of mesoscale models to scale dependent UCP ... · Urban thermofluid dynamics,...
25
Neophytou, Gowardan, Brown (2011) Sensitivity of mesoscale models to scale dependent UCP inputs: Urban thermofluid dynamics, multi-scale interactions, multi-scale models, and scale-adaptive representations M.Neophytou, University of Cyprus, CYPRUS P.Mouzourides, University of Cyprus, CYPRUS A.Kyprianou, University of Cyprus, CYPRUS R.Choudhary, University of Cambridge, UK J.Ching, University of North Carolina, U.S.A. 1 9 th International Conference on Urban Climate, 20 th -24 th July 2015, Toulouse, France
Transcript of Sensitivity of mesoscale models to scale dependent UCP ... · Urban thermofluid dynamics,...

Neophytou, Gowardan, Brown (2011)
Sensitivity of mesoscale models to scale dependent UCP inputs:
Urban thermofluid dynamics,
multi-scale interactions, multi-scale models, and
scale-adaptive representations
M.Neophytou, University of Cyprus, CYPRUS P.Mouzourides, University of Cyprus, CYPRUS
A.Kyprianou, University of Cyprus, CYPRUS R.Choudhary, University of Cambridge, UK
J.Ching, University of North Carolina, U.S.A.
1
9th International Conference on Urban Climate, 20th -24th July 2015, Toulouse, France
Urban Fluid Dynamics in Context...
Urban Fluid Dynamics
Indoor Air Quaity
Urban Air Pollution
Dispersion Wind Energy
Heat stress and thermal
comfort
Wind loading on structures
Wind Energy
Road vehicle emissions
Building Heating and
Cooling
Transport and Mobility
HEALTH
ENERGY
SMART MOBILITY
INFRASTRUCTURE
2
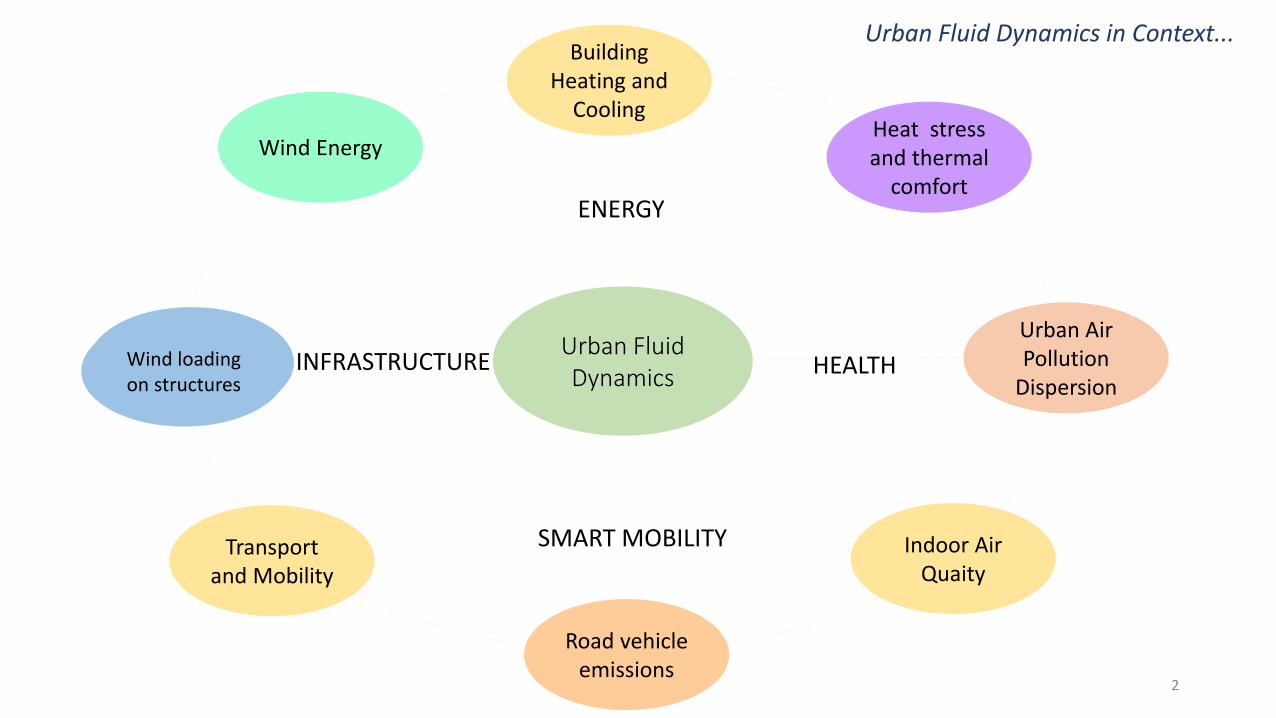
106 100 10-6
103 10-3 [m]
On the Nature of Urban Fluid Dynamics
Multi-scale phenomena and interactions
Weather-Climate community Engineering community Urban fluid dynamics
3
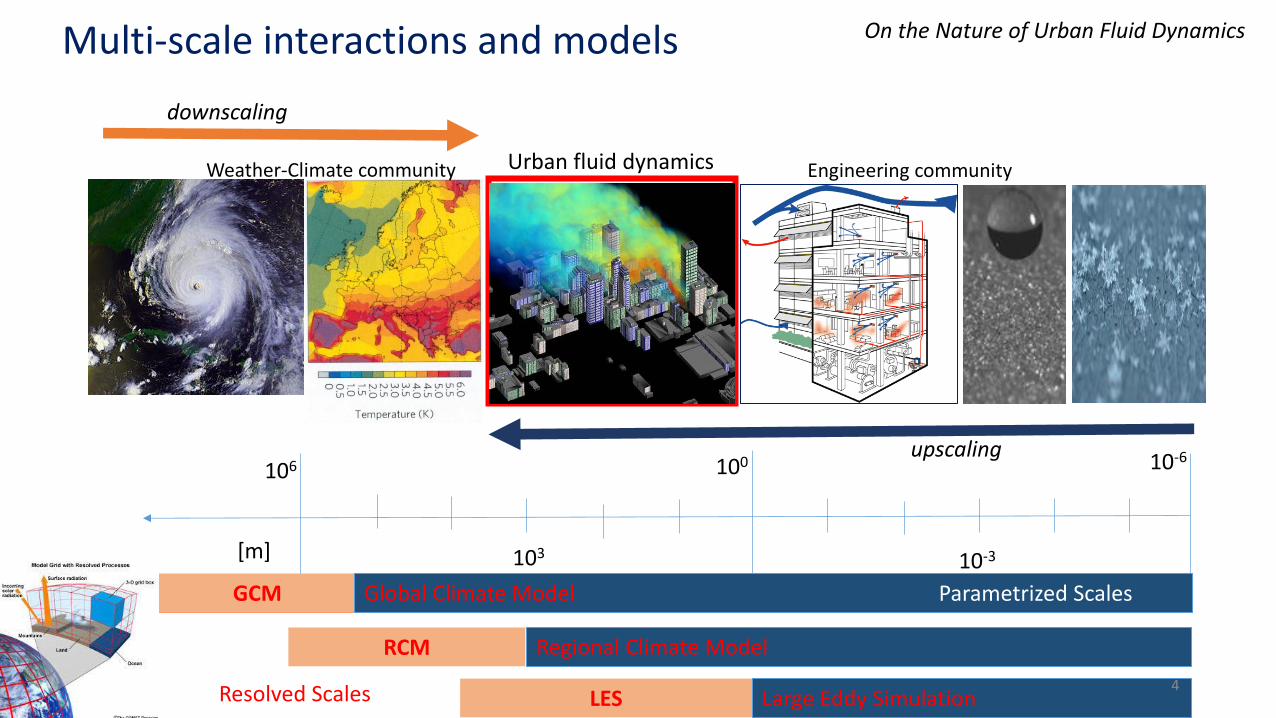
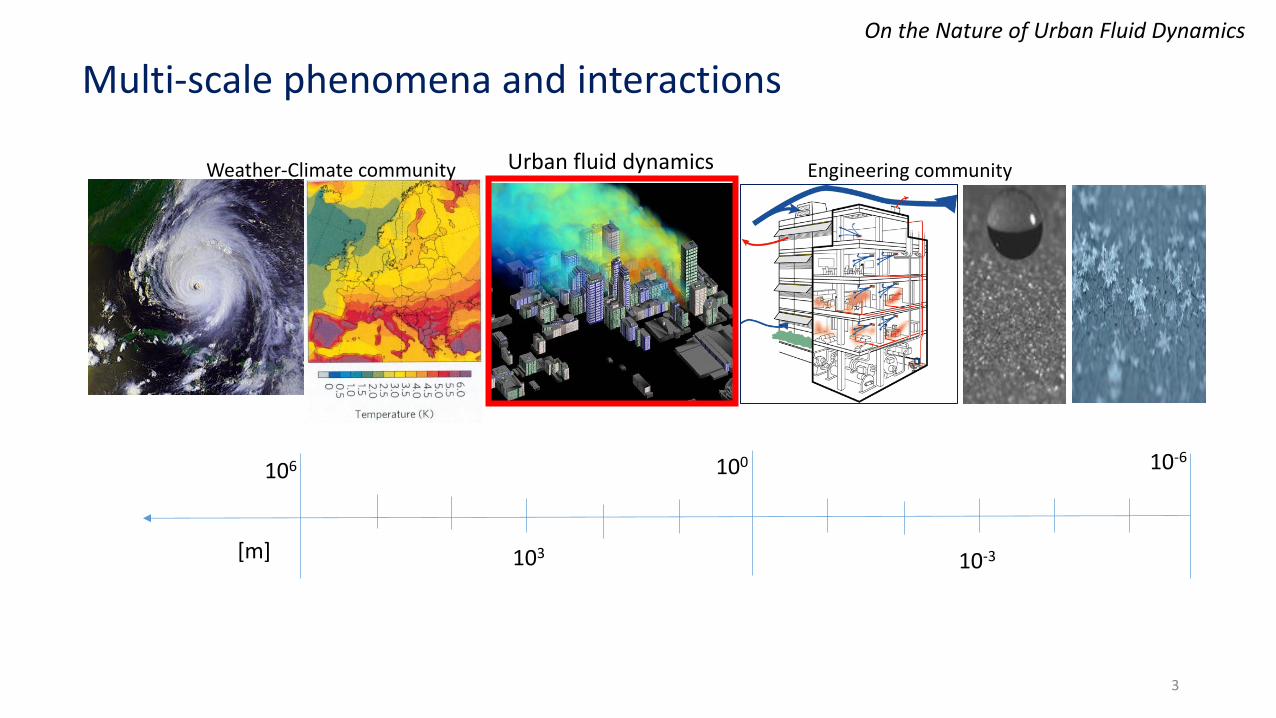
106 100 10-6
103 10-3 [m]
upscaling
On the Nature of Urban Fluid Dynamics Multi-scale interactions and models
Weather-Climate community Engineering community Urban fluid dynamics
Parametrized Scales Resolved Scales GCM Global Climate Model Parametrized Scales
RCM Regional Climate Model
LES Large Eddy Simulation Resolved Scales
downscaling
4

5
WUDAPT, a worldwide urban database & access portal tools for climate and environmental modeling,
Innovation concepts to reality, Implications for integrated modeling Jason Ching, Gerald Mills, Linda See and collaborators
5
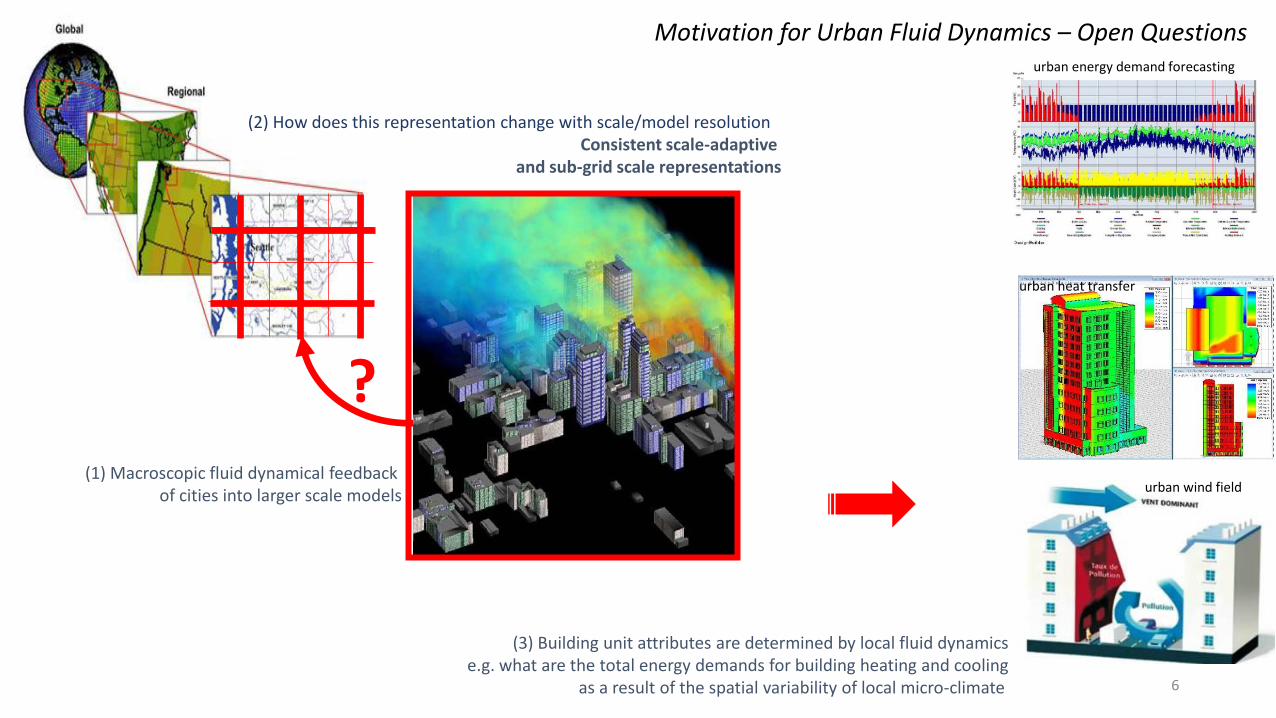
(1) Macroscopic fluid dynamical feedback of cities into larger scale models
?
Motivation for Urban Fluid Dynamics – Open Questions
(3) Building unit attributes are determined by local fluid dynamics e.g. what are the total energy demands for building heating and cooling
as a result of the spatial variability of local micro-climate
urban energy demand forecasting
urban heat transfer
urban wind field
(2) How does this representation change with scale/model resolution Consistent scale-adaptive
and sub-grid scale representations
6
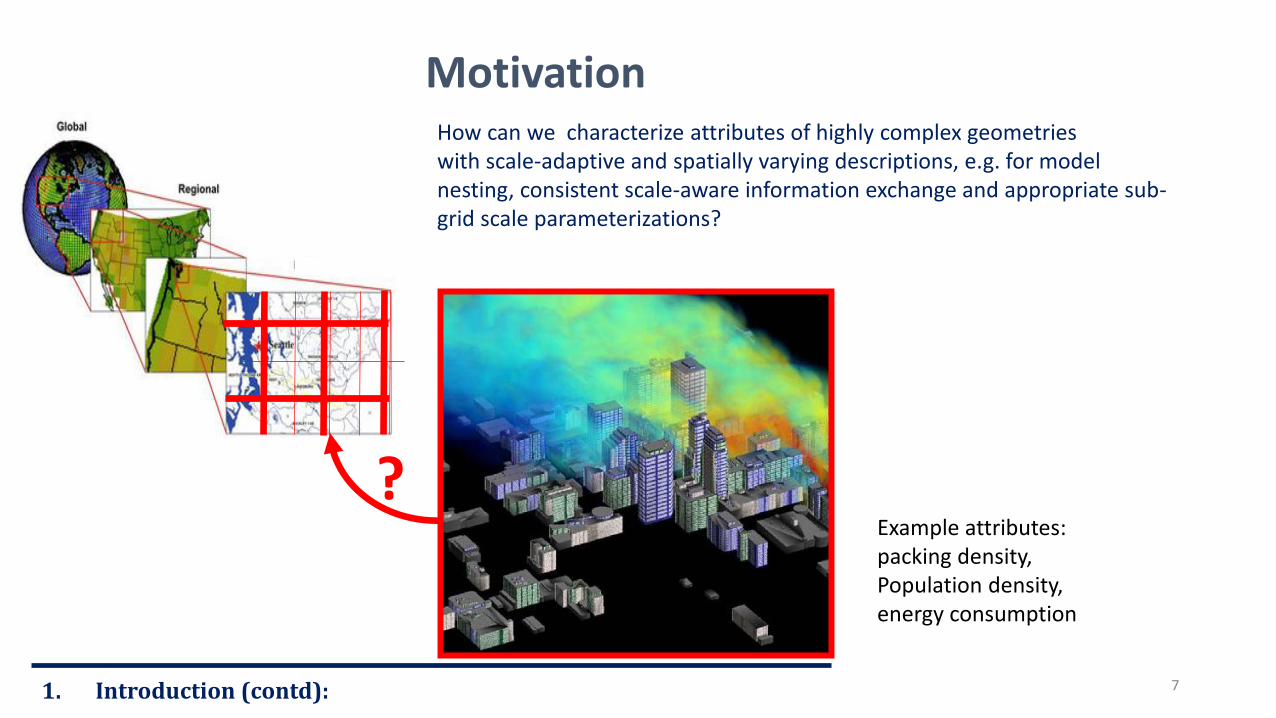
Motivation
?
How can we characterize attributes of highly complex geometries with scale-adaptive and spatially varying descriptions, e.g. for model nesting, consistent scale-aware information exchange and appropriate sub-grid scale parameterizations?
Example attributes: packing density, Population density, energy consumption
7 1. Introduction (contd):

Presentation Overview
1. Introduction: Background, Motivation, Nature, Context
2. Theory & Methodology: brief overview
3. Preliminary Results
4. Concluding Remarks & Future Work and Challenges
8

2. Theory & Methodology – brief overview
Multi-Resolution Analysis (Mallat, 2009)
can produce different levels of approximation of an (urban) database,
by decomposing iteratively the “urban signal” into an approximation and a detail
enabling at all times full recovery of the original signal
Approximation Low pass filter
Details High pass filter
S = A1 + D1
= A2 + D2+ D1
= A3 + D3 + D2+ D1
9
Mouzourides, Kyprianou, Neophytou (2013). A scale-adaptive approach for spatially-varying urban morphology characterization in the boundary layer parameterization using Multi-Resolution Analysis. Int. Journal of Boundary-Layer Meteorology, DOI : 10.1007/s10546-013-9848-4
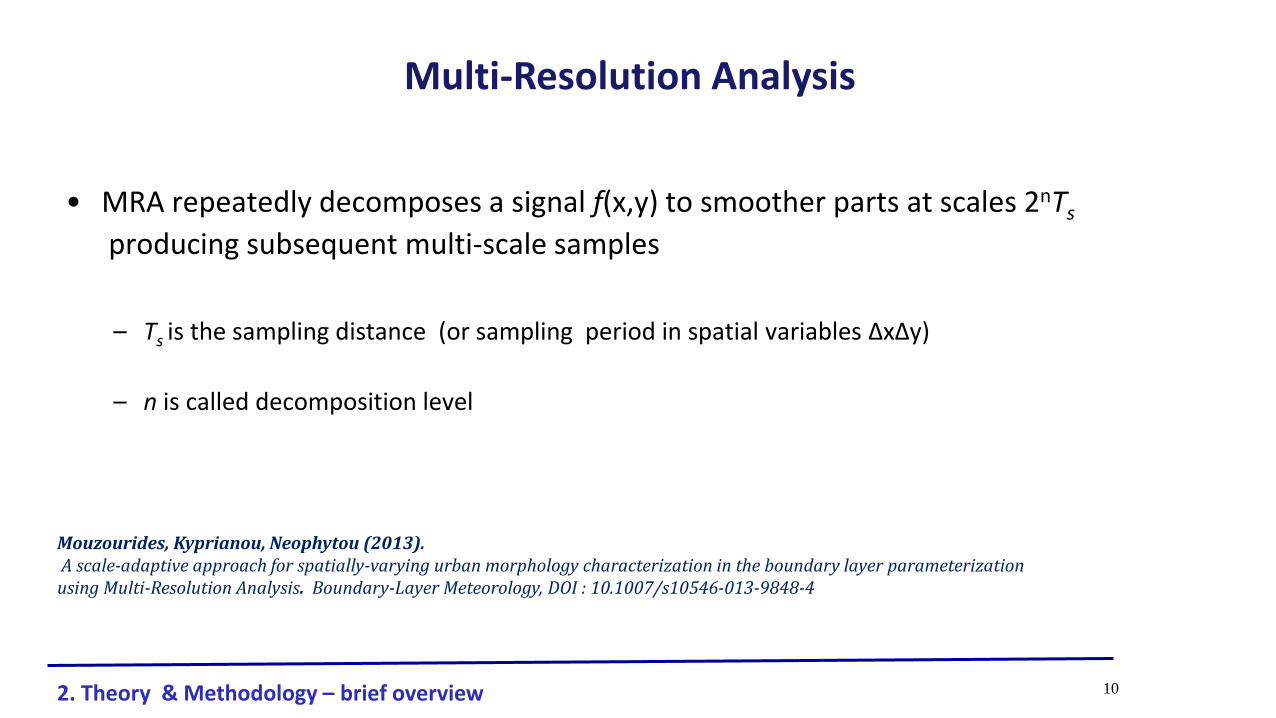
• MRA repeatedly decomposes a signal f(x,y) to smoother parts at scales 2nTs
producing subsequent multi-scale samples
– Ts is the sampling distance (or sampling period in spatial variables ΔxΔy)
– n is called decomposition level
Multi-Resolution Analysis
Mouzourides, Kyprianou, Neophytou (2013). A scale-adaptive approach for spatially-varying urban morphology characterization in the boundary layer parameterization using Multi-Resolution Analysis. Boundary-Layer Meteorology, DOI : 10.1007/s10546-013-9848-4
2. Theory & Methodology – brief overview 10
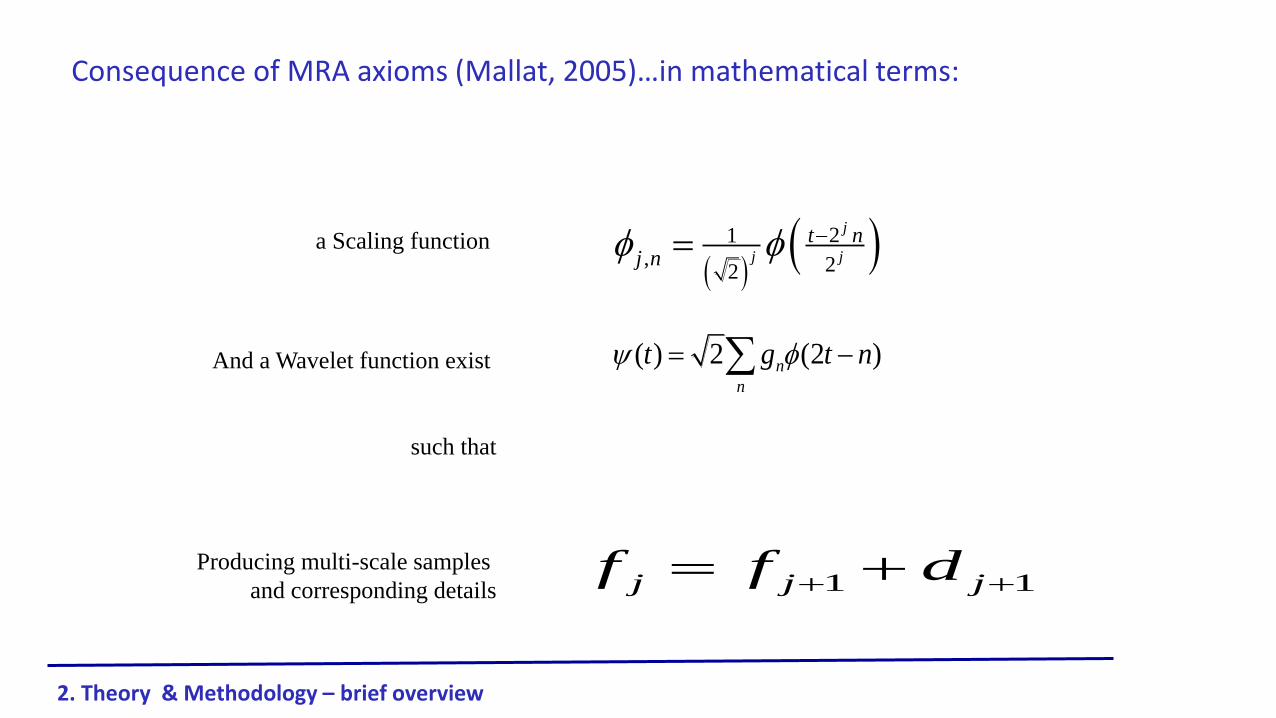
Consequence of MRA axioms (Mallat, 2005)…in mathematical terms:
21
, 22
j
j j
t nj n
And a Wavelet function exist
such that
Producing multi-scale samples
and corresponding details
a Scaling function
1 1j j jf f d
( ) 2 (2 )n
n
t g t n
2. Theory & Methodology – brief overview

Methodology – Example from a building data set Oklahoma City
Apply 2D MRA to an urban database with building height information, h=f(x,y)
A mesoscale grid cell Of size ~1X1 km Digitized within-cell signal (height)
Initial/Original resolution: 1 pixel – 1 m2
Oklahoma City (Google image)
(Ts )
2. Theory & Methodology – brief overview
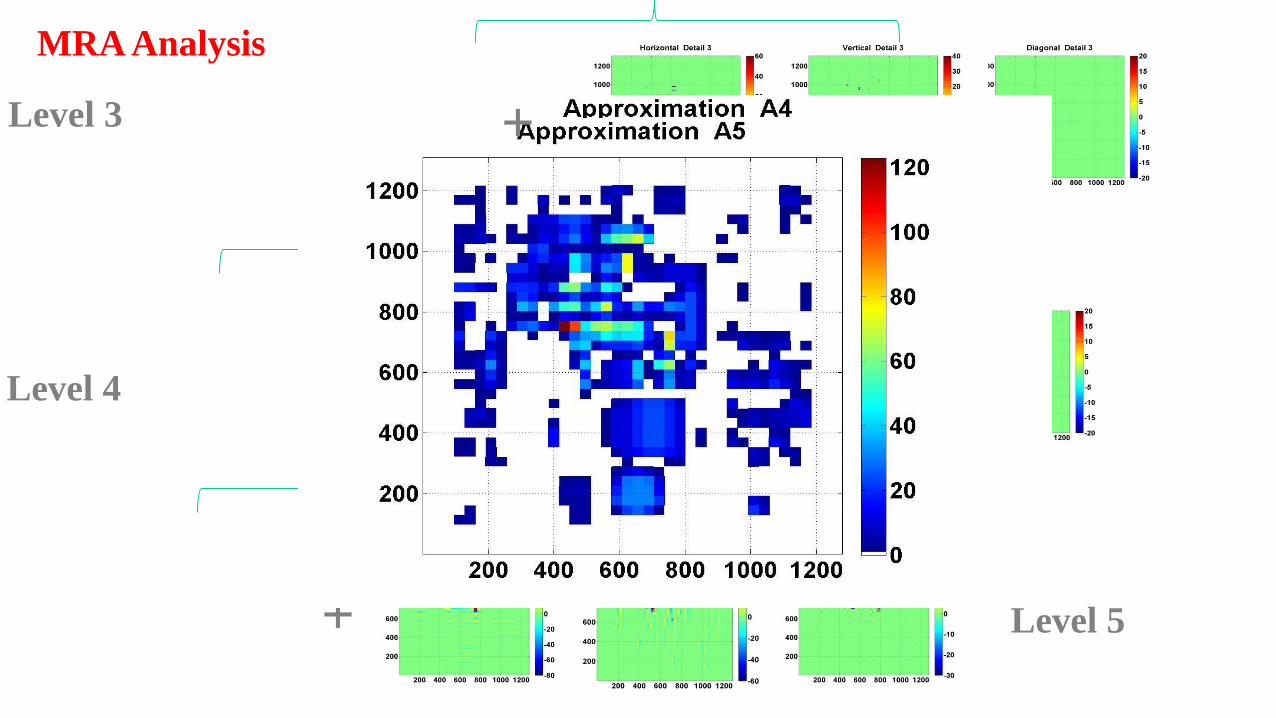
+ Level 5
MRA Analysis
+ Level 4
Level 3 +
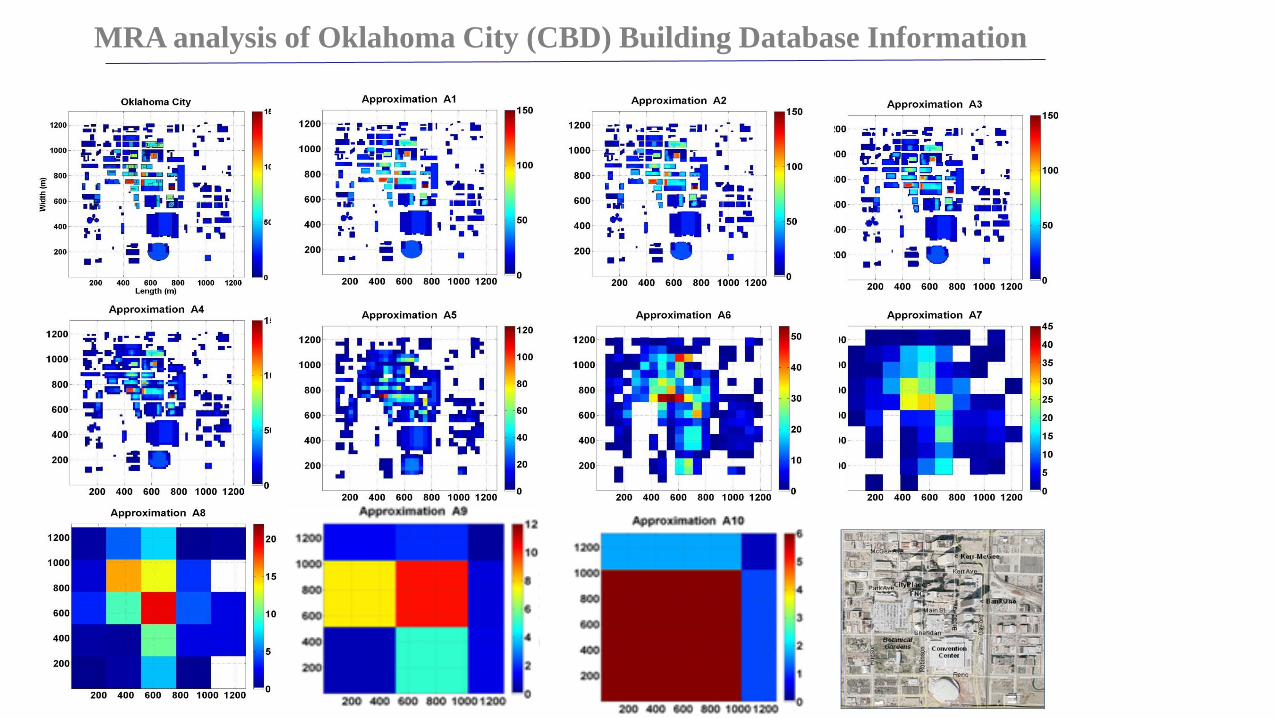
MRA analysis of Oklahoma City (CBD) Building Database Information
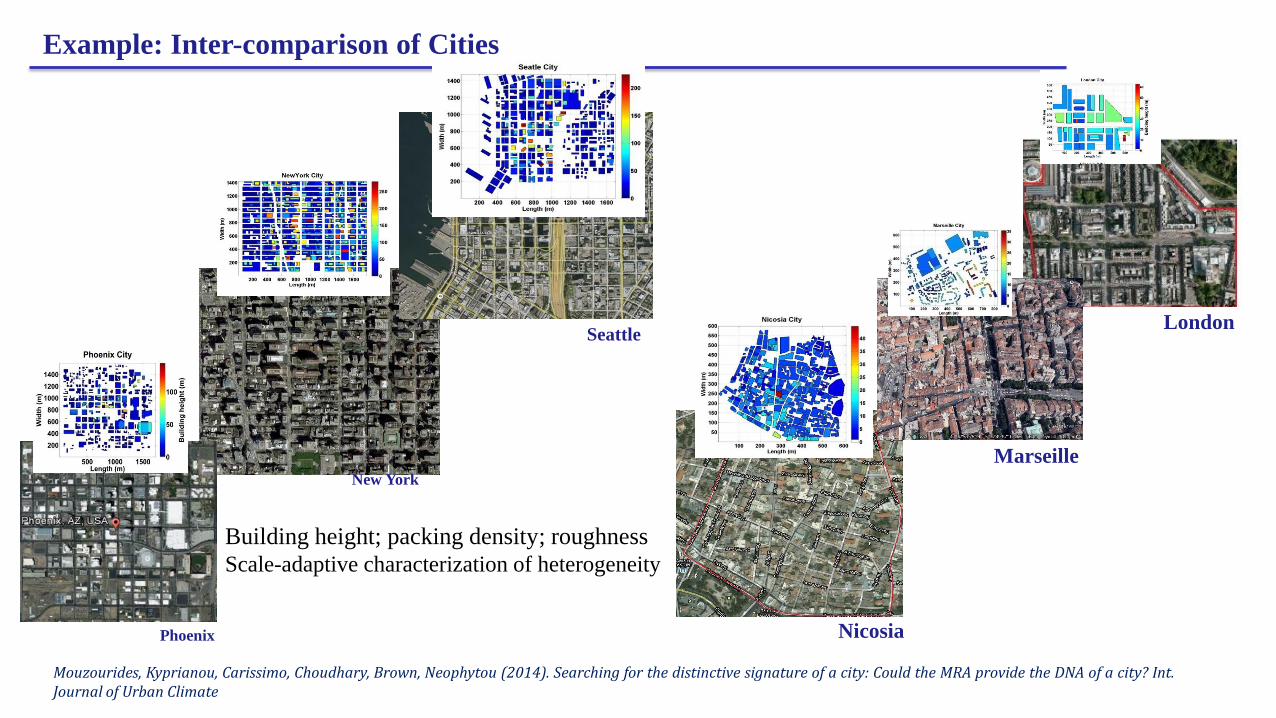
Phoenix
New York
Seattle
Nicosia
4. Results
15
Example: Inter-comparison of Cities
Mouzourides, Kyprianou, Carissimo, Choudhary, Brown, Neophytou (2014). Searching for the distinctive signature of a city: Could the MRA provide the DNA of a city? Int. Journal of Urban Climate
Marseille
London
Building height; packing density; roughness
Scale-adaptive characterization of heterogeneity

Distinctive capacity MRA deduced results
Building/Floor height, H (m)
Planar packing density, λp
Calculated results (based on Kastner-Klein and Rotach (2004)
model)
4.30 0.32
3.83 0.48

Heating Demands/Energy Consumption at 4pm Employment Density Population Density
Scaling and Wavelet functions within MRA analysis
-Depending on the nature to be captured
e.g. mean or peak characteristics
- Time-dependent characteristics
London (UK) and Westminster City Council Data

18
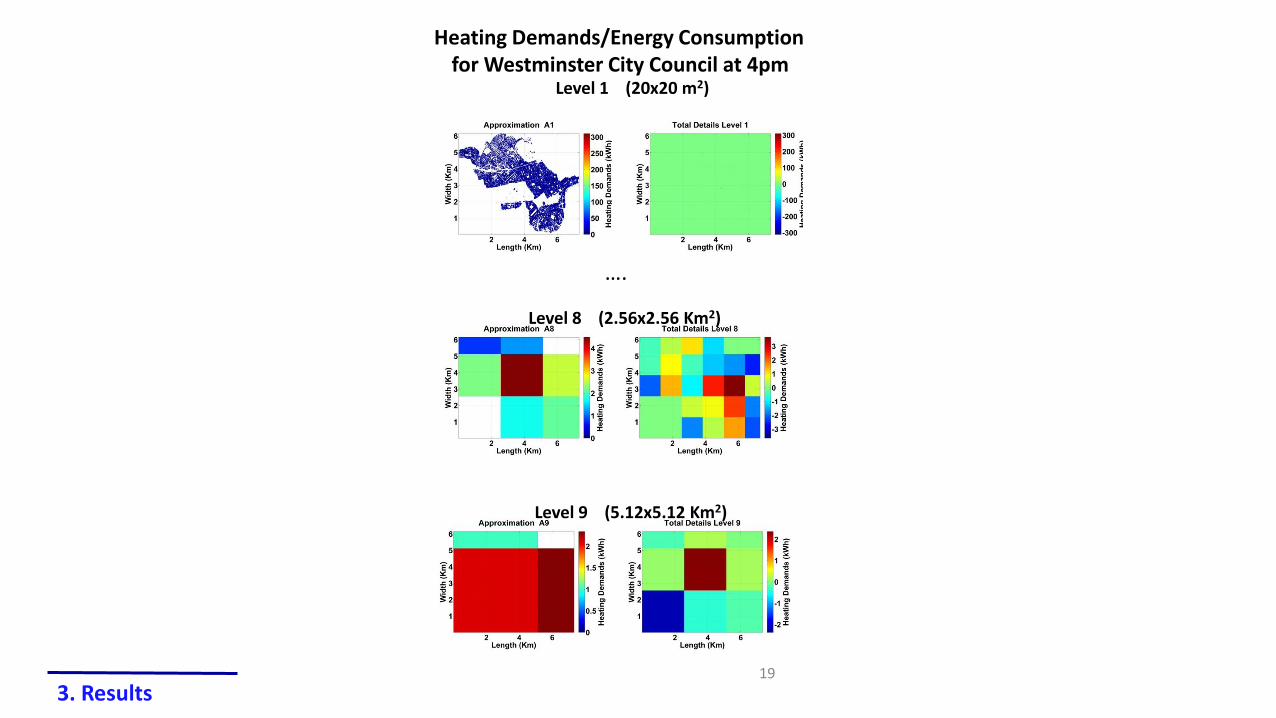
3. Results
Approximation Detail
Heating Demands/Energy Consumption
for Westminster City Council at 4am
19
Level 1 (20x20 m2)
….
Heating Demands/Energy Consumption for Westminster City Council at 4pm
Level 8 (2.56x2.56 Km2)
Level 9 (5.12x5.12 Km2)
3. Results
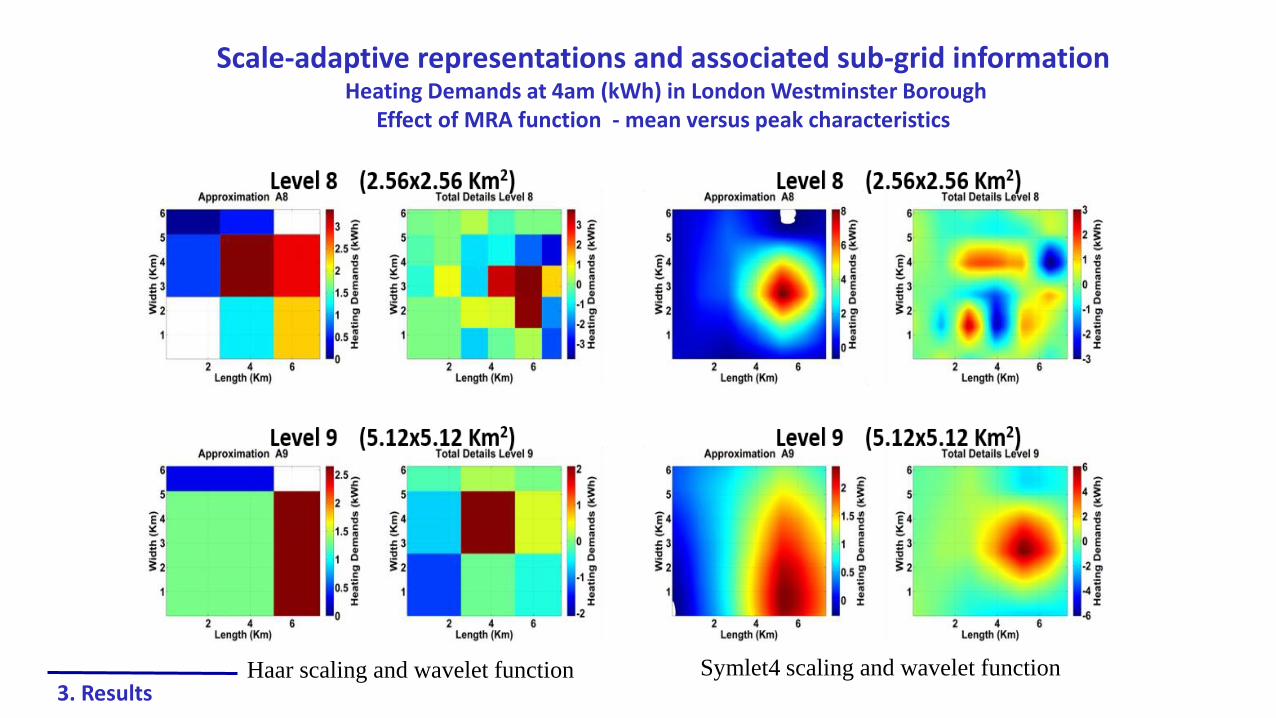
Scale-adaptive representations and associated sub-grid information Heating Demands at 4am (kWh) in London Westminster Borough
Effect of MRA function - mean versus peak characteristics
Haar scaling and wavelet function Symlet4 scaling and wavelet function 3. Results
-Rigorous and consistent scale-adaptive representations are obtained -Spatial inhomogeneity is enabled -Different natures (mean vs peak values) can be captured
- the analysis enables a city (or urban database) to retain its distinctive signature/identity
hence the DNA of a city!
4. Conclusions & Future Work
Mouzourides, Kyprianou, Neophytou (2013). A scale-adaptive approach for spatially-varying urban morphology characterization in the boundary layer parameterization using Multi-Resolution Analysis. Int. Journal of Boundary-Layer Meteorology, DOI : 10.1007/s10546-013-9848-4
4. Conclusions & Future Work
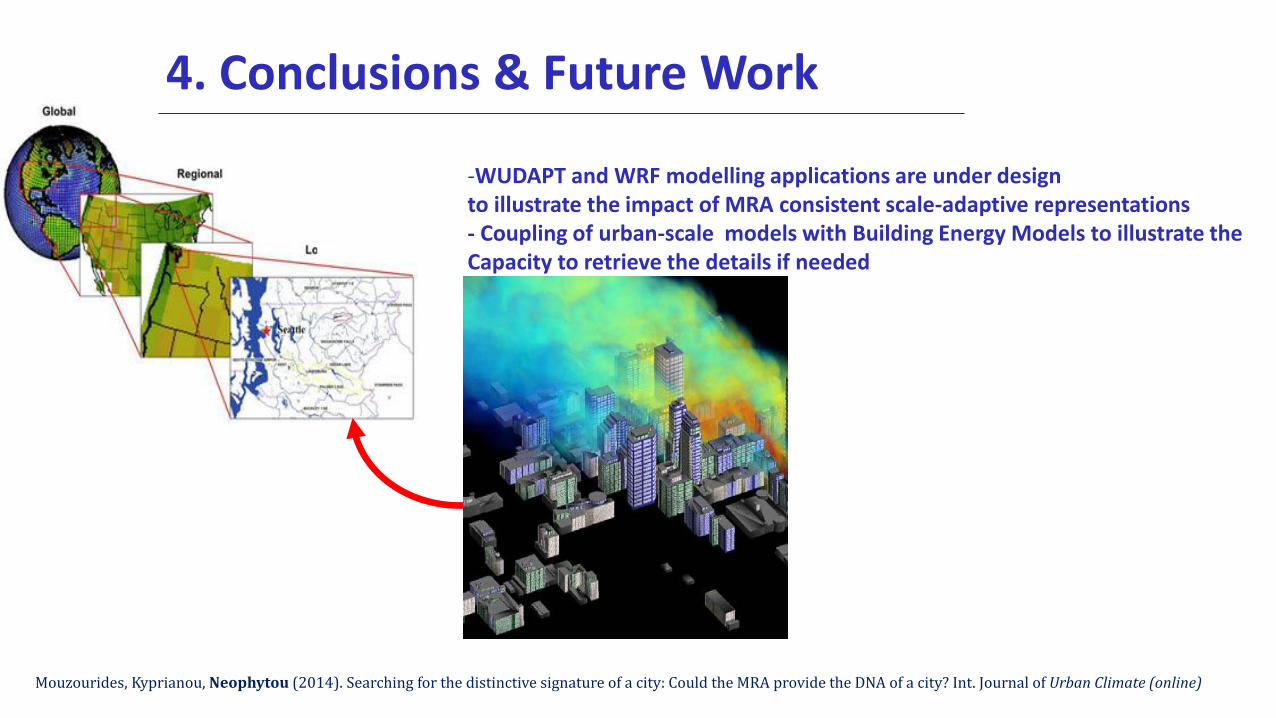
Mouzourides, Kyprianou, Neophytou (2014). Searching for the distinctive signature of a city: Could the MRA provide the DNA of a city? Int. Journal of Urban Climate (online)
-WUDAPT and WRF modelling applications are under design to illustrate the impact of MRA consistent scale-adaptive representations - Coupling of urban-scale models with Building Energy Models to illustrate the Capacity to retrieve the details if needed

Neophytou, Markides, Fokaides (2014): An experimental study of the flow through and over two dimensional rectangular roughness elements: Deductions for urban boundary layer parameterizations and exchange processes. Physics of Fluids 26, 086603
23
Extraction of dynamic characteristics: e.g. exchange and breathability variation with packing density
Further applications: coupling knowledge from idealized lab experiments
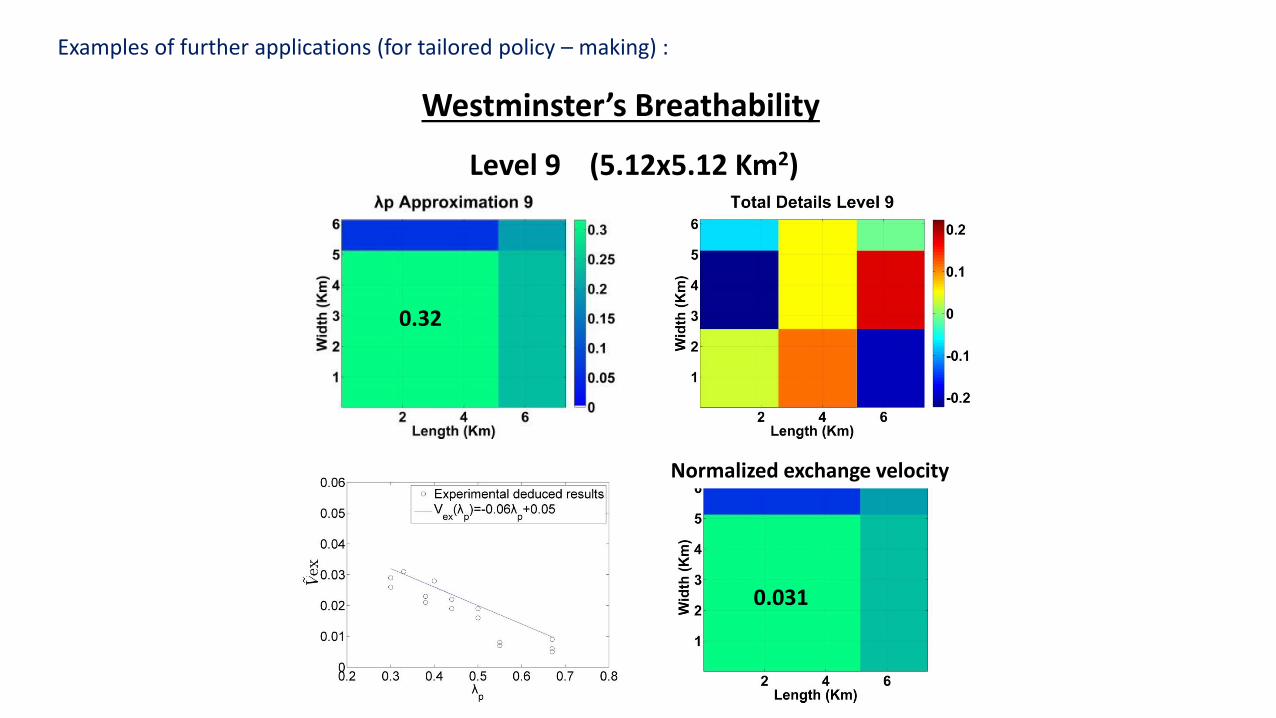
Westminster’s Breathability
Level 9 (5.12x5.12 Km2)
0.32
0.031
Normalized exchange velocity
Examples of further applications (for tailored policy – making) :

25
Thank you!