SENSITIVITY ANALYSIS WITHIN COST BENEFIT ANALYSIS … analysis CBA... · Project N°: 036992 ....
19
Project N°: 036992 ACRONYM : Science Policy Integration for Coastal Systems Assessment REPORT SENSITIVITY ANALYSIS WITHIN COST BENEFIT ANALYSIS Hadley, D. January, 2011 University of East Anglia CSERGE, Norwich How to cite: Hadley, D. (2011), Sensitivity analysis within cost benefit analysis, Spicosa Project Report, University of East Anglia CSERGE, Norwich. Integrated Project funded by The European Community Under the Sixth Framework Programme Priority 1.1.6.3 Global Change and Ecosystems 1
Transcript of SENSITIVITY ANALYSIS WITHIN COST BENEFIT ANALYSIS … analysis CBA... · Project N°: 036992 ....
Project N°: 036992
ACRONYM : Science Policy Integration for Coastal Systems Assessment
REPORT
SENSITIVITY ANALYSIS WITHIN COST BENEFIT ANALYSIS
Hadley, D.
January, 2011
University of East Anglia CSERGE, Norwich
How to cite: Hadley, D. (2011), Sensitivity analysis within cost benefit analysis, Spicosa Project Report, University of East Anglia CSERGE, Norwich.
Integrated Project funded by The European Community Under the Sixth Framework Programme
Priority 1.1.6.3 Global Change and Ecosystems
1
Abstract This report is accompanied by an interactive spreadsheet. Both the report and the spreadsheet are concerned with a case study of coastal management scenarios for flood defence in the Humber Estuary in the UK and are based on work that has been previously been published as the following:
Turner, R. K., Burgess, D., Hadley, D., Coombes, E. and Jackson, N. (2007) A cost-benefit appraisal of coastal managed realignment policy. Global Environmental Change 17, 397-407.
Data from this paper is used to illustrate how sensitivity analysis can be used within cost-benefit analysis (CBA) in order to explore how the values of the benefits from ecosystem services influence the results of the overall analysis. Stakeholders may have ethical or other objections to placing monetary valuations upon ecosystem services, however, the advantage of doing so using CBA is that the trade-offs involved are made more explicit. Conventional CBA uses various methodologies for valuing ecosystem services and ‘plugs’ these values into the analysis. The approach suggested here uses the framework of CBA to ‘discover’ what the values of ecosystem services would need to be in order to influence the overall result of the analysis. It is also suggested that this approach would most usefully operate in close cooperation with stakeholders in a deliberative process.
2
1 Introduction
1.1 What this document is about This report uses a case study of managed realignment options for the Humber Estuary in the UK to illustrate how ecosystem services can be incorporated into an economic evaluation of management options for a coastal environment. Additionally, it will focus on how cost benefit analysis can be used as a framework within which the valuation of those ecosystem services can be explored. Valuation of ecosystem services is a methodologically complex and resource intensive exercise. In addition this can also be a contentious area of research which stakeholders may find ethically difficult. We propose using sensitivity analysis within CBA to explore the range of possible values that ecosystem services could take which would influence the overall result of the analysis. For this particular example this means evaluating the benefits, in terms of enhanced ecosystem services (habitat provision and carbon sequestration), of various managed realignment options and then comparing the overall costs and benefits of these options to the costs and benefits of an option of ‘holding the line’, i.e. maintaining the current hard sea defences within the estuary. The main advantage of using CBA as a tool for economic assessment is that it provides a well understood framework and procedure within which projects and policies can be compared against each other. This framework allows those who use the results of the analysis to explicitly see the trade-offs that are involved in pursuing a particular project and policy (as long as the analysis is carried out as completely and rigorously as is possible). Of course, where the CBA includes non-marketed goods and services (such as many of those provided by ecosystems) the results of any analysis will only be as robust as the monetary valuations placed upon them. This can be problematic in the presence of uncertainties and/or if there ethical or other objections to valuing ecosystem goods and services, and additionally because some methodologies for valuing ecosystem goods and services are complex and susceptible to a range of possible biases. However, these problems are only critical when CBA is used as the only tool of evaluation, i.e. when decisions about projects or policies solely depend upon them having a positive net present value. In practice this is unlikely to be the case; indeed we would advocate that this should never be the case. CBA should be included in a suite of evaluation tools since alone it cannot include all possible dimensions of an issue. Instead of using CBA as a decision-making tool it can be used in a much more heuristic manner, where sensitivity analysis is employed in order to explore elements of the analysis which may be uncertain or controversial. In this example, we use sensitivity analysis to explore the possible ranges of values that the ecosystem services of carbon sequestration and created habitat would have to take in order to change the outcome of a CBA for various managed realignment options for the Humber Estuary. The ultimate objective of this exercise would be to then present the results of the sensitivity analysis to stakeholders to illustrate to them how much these ecosystem goods and services would have to be valued to influence the overall result in the context of this situation. The difference between this deliberative approach and a more conventional approach is
3

that the latter ‘hands over’ the results of a CBA to the end user as a fait accompli, whereas the former intends to involve the end user in a more deliberative process, where they are asked to judge for themselves whether the values the analysis throws up are worth the trade-offs involved. There is a subtle, but a very fundamental distinction, between the two approaches. The deliberative approach uses the framework of CBA to explore the trade-offs and uncertainties inherent in any policy or project that impacts ecosystem services and does this without placing a specific value on those services – it merely highlights what that value would need to be to make a difference to the result. The conventional approach uses a variety of different methodologies in order to establish the value of ecosystem services and then plugs these values into the analysis (although any good analysis should use sensitivity analysis to see how sensitive the results are to changes in these values). The former presents values as, “they would need to be”, the latter presents values as, “they are”.
1.2 The interactive spreadsheet The main element of this deliverable is not this report, but the spreadsheet that accompanies it Sensitivity analysis Sensitivity Analysis CBA_interactive spreadsheet.xls. This spreadsheet includes all the data necessary to perform a simplified version of the CBA undertaken in the paper from which the data is drawn and to manipulate key variables within this analysis in order to ‘discover’ the range of valuations for ecosystem services that will influence the outcome of the overall analysis.
1.3 Contents of this document Chapter 2 provides background information on the case study in terms of context, location and an outline of the methodology used. Chapter 3 briefly describes the spreadsheet and how it can be used.
4
2 Case Study Background
2.1 Introduction This report and the accompanying spreadsheet are based upon material which has been published in the following paper:
Turner, R. K., Burgess, D., Hadley, D., Coombes, E. and Jackson, N. (2007) A cost-benefit appraisal of coastal managed realignment policy. Global Environmental Change 17, 397-407.
The background information needed to understand the case study and facilitate use of the spreadsheet follows in the rest of this chapter.
2.2 The Humber Estuary The macro-tidal Humber estuary is one of the largest in the UK, fed by two principal river systems, the Ouse and the Trent. With a maximum tidal length of 147 km from Cromwell Weir on the Trent to the Humber’s mouth, and maximum width of 15 km, it is comparable with the Thames and Severn Estuaries (Andrews et al., 2000). Draining over a fifth of the land area of England (24,000Km2), the Humber estuary is the largest source of freshwater (approximately 250 m3sec-1) into the North Sea from all the British rivers (Jarvie et al., 1997). Much of the land surrounding the Estuary is the result of historical land reclamation, created from the enclosure of salt marshes and mudflats. For example, Davidson et al. (1991) estimated that 4,600 hectares of intertidal habitat was reclaimed in the Humber between 1600 and 1850. Consequently, approximately 90,000 hectares of land surrounding the Humber Estuary is below high spring tide level and is currently protected by 235 km of flood and coastal defences (405 km including those defences along the tidal reaches of the Rivers Trent and Ouse) (Winn et al., 2003). This area is comprised of mainly agricultural land (85%), limited housing (8%) and commercial or industrial activities (3%). The Humber Estuary is of international importance for wildlife, particularly birds, with a large area of intertidal habitat of between 10-11,000 hectares (Environment Agency 1998; Andrews et al., 2000), of which around 90% consists of mudflats and sandflats with the remainder being mainly saltmarsh (Winn et al., 2003). This intertidal habitat plays an important role within the estuary, through the recycling of nutrients within the estuary, and their role as soft sea defences, dissipating wave energy. They are highly productive biologically in terms of bird species - the Humber is recognised internationally for its breeding, passage and wintering birds. The entire estuary has been proposed as a marine ‘Special Area of Conservation’ while the Humber Flats are designated a ‘Special Protection Area’, ‘Site of Special Scientific Interest’ and Ramsar site.
5
However, through land-claim, the Humber estuary has an uncharacteristically low extent of saltmarsh for an English Estuary (Davidson and Buck, 1997). Jickells et al. (2000) have estimated that more than 90% of the intertidal area and sediment accumulation capacity of the Humber estuary has been lost over the last 300 years with protected areas becoming threatened. In areas with extensive seawalls and commercial development, such as around Grimsby and Hull, tidal flats are narrow (<100m wide) or absent. The natural succession of marine to terrestrial environments has been truncated by the construction of seawalls. Before extensive human involvement the vegetation succession probably incorporated much wider tracts of saltmarsh, progressing to less saline fen and carr environments, it now ends at mature saltmarsh. These types of marginal marine-terrestrial environments are no longer present in the Humber system (Andrews et al., 2000).
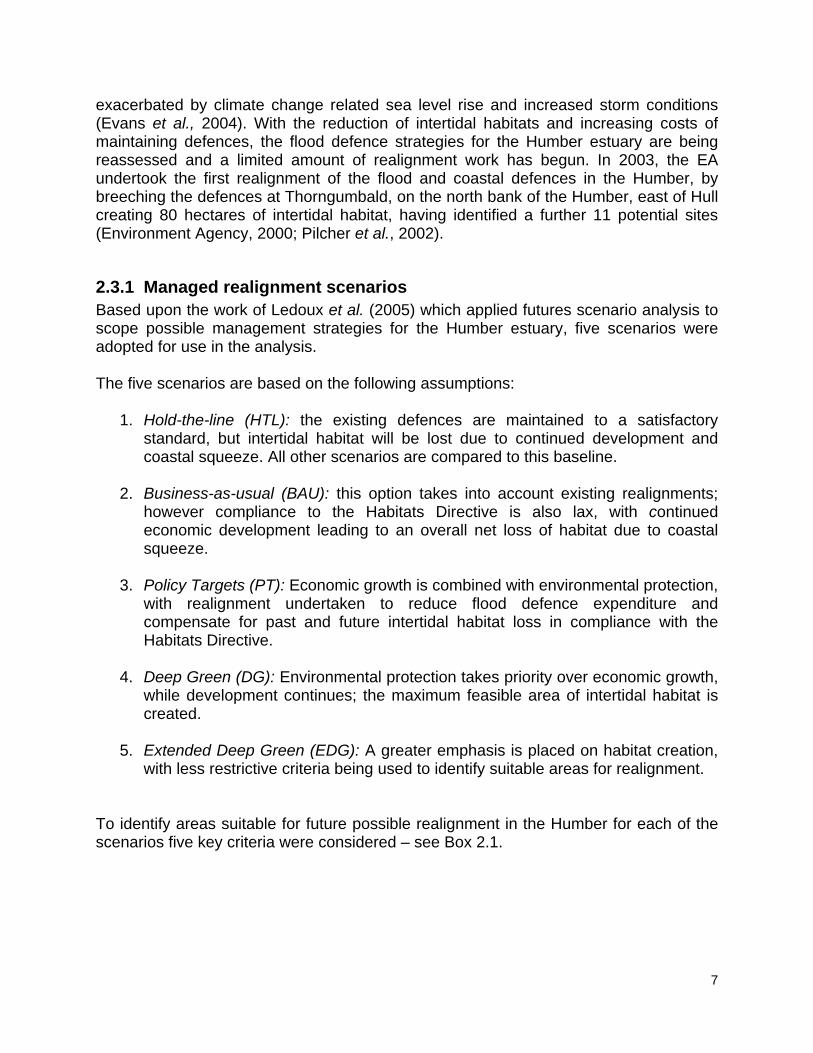
2.3 Managed realignment The term ‘managed realignment’, also referred to as ‘managed retreat’ or ‘coastal setback’ (Reed et al., 1999), involves deliberately breaching engineered defences to allow the coastline to recede to a new line of defence further inland, see Figure 2.1. Managed realignment schemes generally aim to realign defences in a manner that will not only reduce the length of defence required, but will also increase the overall area of intertidal habitat. Figure 2.1: Managed realignment
Managed realignment has been adopted in a number of countries, however motivations for this approach can vary with coastal defence being the primary objective in the UK, while US realignments are driven by conservation policy to create inter-tidal habitat (Pethick, 2002). Managed realignment in the Humber Estuary is motivated by concerns over the loss of intertidal habitats through reclamation and coastal squeeze, and also regarding the state of traditional sea defences (Ledoux et al., 2005). As many of the defences in the estuary were built following the 1953 flooding disaster on the East Coast, they are now reaching the end of their design life and are currently unsatisfactory and in need of repair or replacing (Environment Agency, 2000). Both of these problems are likely to be
6
exacerbated by climate change related sea level rise and increased storm conditions (Evans et al., 2004). With the reduction of intertidal habitats and increasing costs of maintaining defences, the flood defence strategies for the Humber estuary are being reassessed and a limited amount of realignment work has begun. In 2003, the EA undertook the first realignment of the flood and coastal defences in the Humber, by breeching the defences at Thorngumbald, on the north bank of the Humber, east of Hull creating 80 hectares of intertidal habitat, having identified a further 11 potential sites (Environment Agency, 2000; Pilcher et al., 2002).
2.3.1 Managed realignment scenarios Based upon the work of Ledoux et al. (2005) which applied futures scenario analysis to scope possible management strategies for the Humber estuary, five scenarios were adopted for use in the analysis. The five scenarios are based on the following assumptions:
1. Hold-the-line (HTL): the existing defences are maintained to a satisfactory standard, but intertidal habitat will be lost due to continued development and coastal squeeze. All other scenarios are compared to this baseline.
2. Business-as-usual (BAU): this option takes into account existing realignments;
however compliance to the Habitats Directive is also lax, with continued economic development leading to an overall net loss of habitat due to coastal squeeze.
3. Policy Targets (PT): Economic growth is combined with environmental protection,
with realignment undertaken to reduce flood defence expenditure and compensate for past and future intertidal habitat loss in compliance with the Habitats Directive.
4. Deep Green (DG): Environmental protection takes priority over economic growth,
while development continues; the maximum feasible area of intertidal habitat is created.
5. Extended Deep Green (EDG): A greater emphasis is placed on habitat creation,
with less restrictive criteria being used to identify suitable areas for realignment. To identify areas suitable for future possible realignment in the Humber for each of the scenarios five key criteria were considered – see Box 2.1.
7
Box 2.1: GIS – based realignment site location criteria Criterion 1 – The Area below the High Spring Tide Level The high spring tide level is the highest point at the coastline that is reached by the sea during a spring tide. The area below the high spring tide level illustrates the maximum area of intertidal habitat that could be created, before other factors are considered. Criterion 2 – The Present Land Use of the Area In all the managed realignment scenarios, i.e. BAU, PT, DG and EDG, it was not considered appropriate to carry out realignment where protected flora or fauna or historical/cultural assets would be put at risk. Therefore Sites of Special Scientific Interest, Special Areas of Conservation and other similarly protected areas together with historically significant buildings were excluded from the realignment areas. Criterion 3 – The Infrastructure of the Area For all of the scenarios, the transport network – including roads, railway lines and canals – were taken into account. Criterion 4 – The Historical Context of the Area The BAU, PT and DG scenarios considered the historical context of the potential areas for realignment. This constraint dropped for the EDG scenario. Criterion 5 – The Spatial Context of the Areas SIZE: The BAU, PT and DG scenarios considered that it would only be cost effective to realign areas that are greater than 5 ha in size (Pilcher et al., 2002), while EDG scenario did not comply with this restriction, considering the creation of any intertidal habitat to be beneficial. SHAPE: The BAU, PT and DG scenarios considered that the optimum shape for realignment areas can be considered as a trade-off between creating a wide intertidal area to maximise benefits, while ensuring that the length of realigned defences to protect the surrounding land is no greater than those which already exist (Pilcher et al., 2002). This limitation was relaxed in the EDG scenario. ELEVATION: All of the scenarios favoured retreat to an elevation above the high spring tide level where possible. PROXIMITY TO EXISTING INTERTIDAL HABITATS: All of the scenarios considered that it is preferable to create intertidal habitats where they will fit in with the overall vegetation succession to facilitate the movement of species between habitats (Bergstrom et al., 1996).
8

Details of the areas that were identified as suitable for realignment, for each of the scenarios, are illustrated in Table 2.1. The table shows the implications of realignment on defence length, the amount of habitat that could be created and the subsequent impacts on carbon sequestration. Figure 2.2 illustrates the extent of the area of habitat that could be created under each of the scenarios. Table 2.1: Details of areas suitable for realignment Scenarios HTL BAU PT DG EDG Length of defences before realignment (km) 405.3 405.3 405.3 405.3 405.3 Length of defences after realignment (km) 405.3 396.8 361.6 318.2 284.5 Length of realigned defences (km) 0.0 7.0 30.8 69.0 102.7 Length of unsatisfactory defences after realignment (km)
64.6 61.9 42.2 38.2 34.0
Amount of intertidal habitat created by realignment (ha) a 0.0 80.0 1320.9 2332.4 7493.6 Estimated tonnes of Carbon stored each year b,c 0 38.4 634.1 1119.4 3597.1
a Due to uncertainty over the loss of intertidal habitat due to coastal squeeze over the next 50 years, it is assumed that no further coastal squeeze takes place. Therefore, the HTL scenario as the baseline scenario assumes no loss of intertidal habitat and no carbon sequestration, and that habitat creation and sequestration in the other scenarios are relative to this base. b Estimates of the carbon storage capacity of newly created inter-tidal habitat are derived from Andrews et al (2000). c Intensively managed arable land is a net source of carbon (Renwick, Ball and Pretty, 2002) and we assume that the agricultural land that is sacrificed to realignment is managed in this way. Note, however, that minimal, or no-till management practices can reduce carbon emissions from agricultural soils or even convert them to carbon sinks on a scale that is equivalent to, or greater than, the carbon storage potential of intertidal habitat.
9

Figure 2.2: Areas suitable for managed realignment in the Humber Estuary under the various scenarios
10
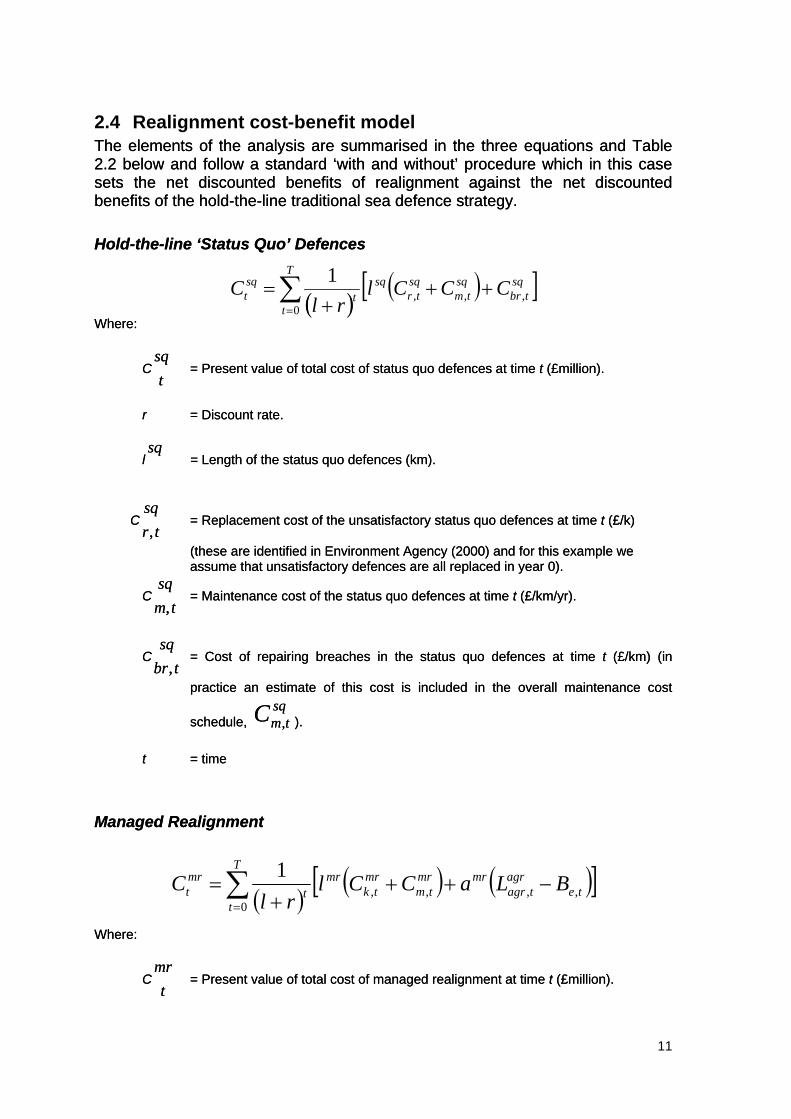
2.4 Realignment cost-benefit model The elements of the analysis are summarised in the three equations and Table 2.2 below and follow a standard ‘with and without’ procedure which in this case sets the net discounted benefits of realignment against the net discounted benefits of the hold-the-line traditional sea defence strategy.
The elements of the analysis are summarised in the three equations and Table 2.2 below and follow a standard ‘with and without’ procedure which in this case sets the net discounted benefits of realignment against the net discounted benefits of the hold-the-line traditional sea defence strategy.
Hold-the-line ‘Status Quo’ Defences Hold-the-line ‘Status Quo’ Defences
Where: Where:
C = Present value of total cost of status quo defences at time t (£million). C = Present value of total cost of status quo defences at time t (£million). tsqtsq
r = Discount rate. r = Discount rate.
l = Length of the status quo defences (km). l = Length of the status quo defences (km). sqsq
C = Replacement cost of the unsatisfactory status quo defences at time t (£/k)
(these are identified in Environment Agency (2000) and for this example we assume that unsatisfactory defences are all replaced in year 0).
C = Replacement cost of the unsatisfactory status quo defences at time t (£/k)
(these are identified in Environment Agency (2000) and for this example we assume that unsatisfactory defences are all replaced in year 0).
trsq, tr
sq,
C = Maintenance cost of the status quo defences at time t (£/km/yr). C = Maintenance cost of the status quo defences at time t (£/km/yr). tm
sq, tm
sq,
C = Cost of repairing breaches in the status quo defences at time t (£/km) (in
practice an estimate of this cost is included in the overall maintenance cost
schedule, ).
C = Cost of repairing breaches in the status quo defences at time t (£/km) (in
practice an estimate of this cost is included in the overall maintenance cost
schedule, ).
tbrsq
, tbrsq
,
sqtmC ,
sqtmC ,
t = time t = time
Managed Realignment Managed Realignment
Where: Where:
C = Present value of total cost of managed realignment at time t (£million). C = Present value of total cost of managed realignment at time t (£million). t
mrt
mr
( )( )[ ( ) ]∑
=
+++
=T
t
sqtbr
sqtm
sqtr
sqt
sqt CCCl
rlC
0,,,
1
( )( ) ( )[ ]∑
=
−+++
=T
tte
agrtagr
mrmrtm
mrtk
mrt
mrt BLaCCl
rlC
0,,,,
1
11
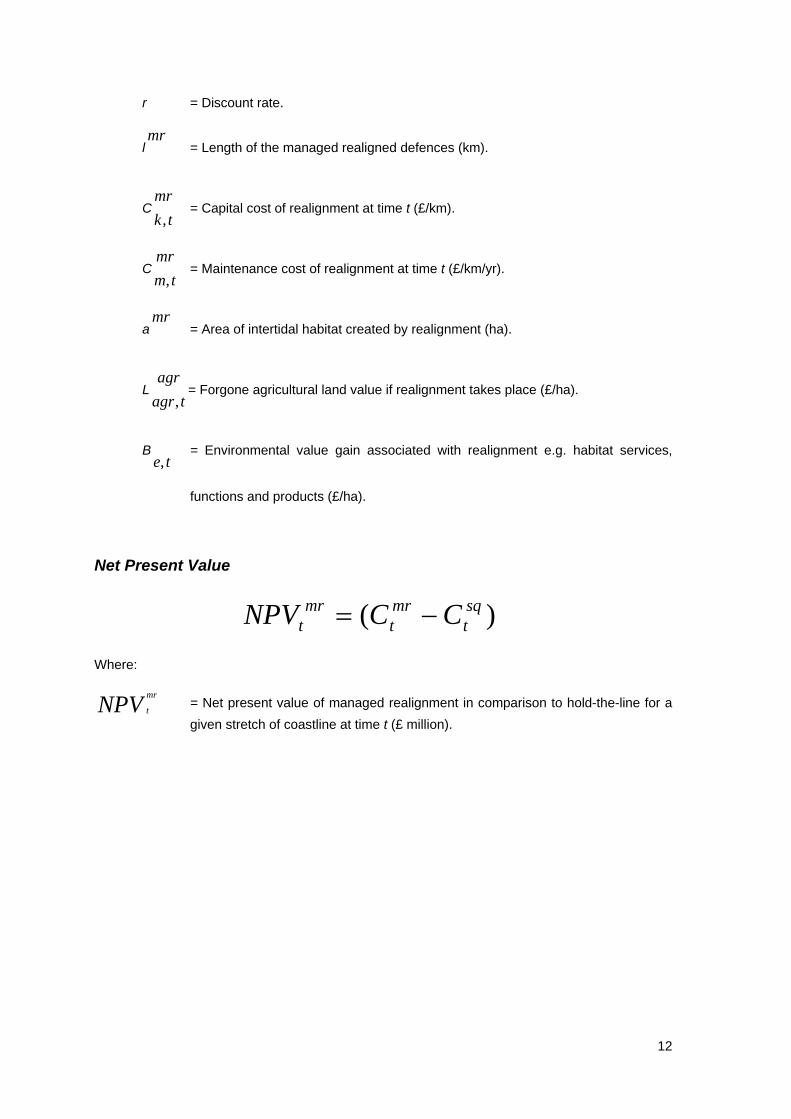
r = Discount rate.
l = Length of the managed realigned defences (km). mr
C = Capital cost of realignment at time t (£/km). tk
mr,
C = Maintenance cost of realignment at time t (£/km/yr). tm
mr,
a = Area of intertidal habitat created by realignment (ha). mr
L = Forgone agricultural land value if realignment takes place (£/ha). tagr
agr,
B = Environmental value gain associated with realignment e.g. habitat services,
functions and products (£/ha).
te,
Net Present Value
)( sqt
mrt
mrt CCNPV −=
Where:
NPV mr
t = Net present value of managed realignment in comparison to hold-the-line for a
given stretch of coastline at time t (£ million).
12
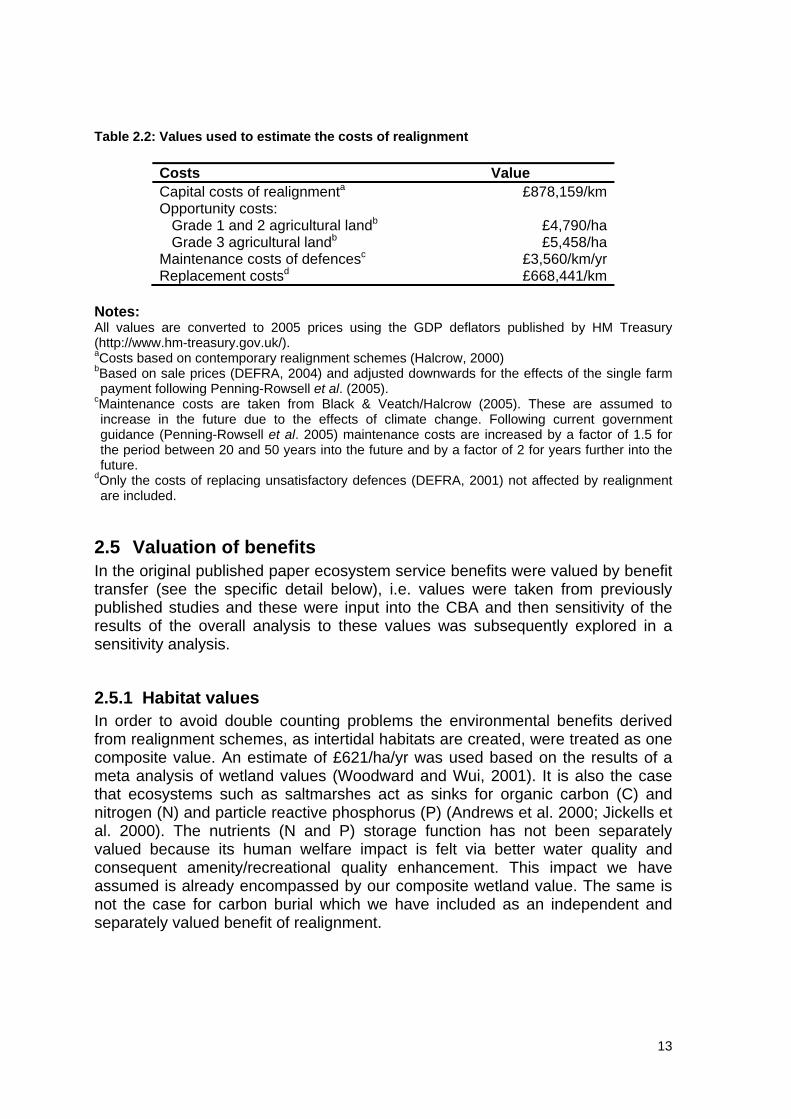
Table 2.2: Values used to estimate the costs of realignment
Costs Value Capital costs of realignmenta £878,159/km Opportunity costs: Grade 1 and 2 agricultural landb
£4,790/ha
Grade 3 agricultural landb £5,458/ha Maintenance costs of defencesc £3,560/km/yr Replacement costsd £668,441/km
Notes: All values are converted to 2005 prices using the GDP deflators published by HM Treasury (http://www.hm-treasury.gov.uk/). aCosts based on contemporary realignment schemes (Halcrow, 2000) bBased on sale prices (DEFRA, 2004) and adjusted downwards for the effects of the single farm payment following Penning-Rowsell et al. (2005).
cMaintenance costs are taken from Black & Veatch/Halcrow (2005). These are assumed to increase in the future due to the effects of climate change. Following current government guidance (Penning-Rowsell et al. 2005) maintenance costs are increased by a factor of 1.5 for the period between 20 and 50 years into the future and by a factor of 2 for years further into the future.
dOnly the costs of replacing unsatisfactory defences (DEFRA, 2001) not affected by realignment are included.
2.5 Valuation of benefits In the original published paper ecosystem service benefits were valued by benefit transfer (see the specific detail below), i.e. values were taken from previously published studies and these were input into the CBA and then sensitivity of the results of the overall analysis to these values was subsequently explored in a sensitivity analysis.
2.5.1 Habitat values In order to avoid double counting problems the environmental benefits derived from realignment schemes, as intertidal habitats are created, were treated as one composite value. An estimate of £621/ha/yr was used based on the results of a meta analysis of wetland values (Woodward and Wui, 2001). It is also the case that ecosystems such as saltmarshes act as sinks for organic carbon (C) and nitrogen (N) and particle reactive phosphorus (P) (Andrews et al. 2000; Jickells et al. 2000). The nutrients (N and P) storage function has not been separately valued because its human welfare impact is felt via better water quality and consequent amenity/recreational quality enhancement. This impact we have assumed is already encompassed by our composite wetland value. The same is not the case for carbon burial which we have included as an independent and separately valued benefit of realignment.
13
14
2.5.2 Carbon values Various approaches exist for estimating the monetary value of carbon storage. In this study we based the monetary estimate on the environmental damage done per tonne of carbon dioxide (or equivalent) emitted into the atmosphere – the “damage cost avoided” by storing rather than releasing a given quantity of carbon dioxide equivalent units. A recent meta-analysis undertaken by Tol (2005), using only peer reviewed studies, estimated that the mean marginal damage cost of carbon dioxide emissions was $50/tC (in 1995 US$, equivalent to about £45 in 2005) and this value is used in the CBA.
3 Using the spreadsheet
3.1 Introduction The spreadsheet is simple to use and users need only use and view the opening worksheet (although other worksheets are open to scrutiny and modification).
3.2 Net Present Values Worksheet This is the first worksheet in the workbook. It is also where users can change certain variables and where they can see the results of these changes on the outcome of the CBA.
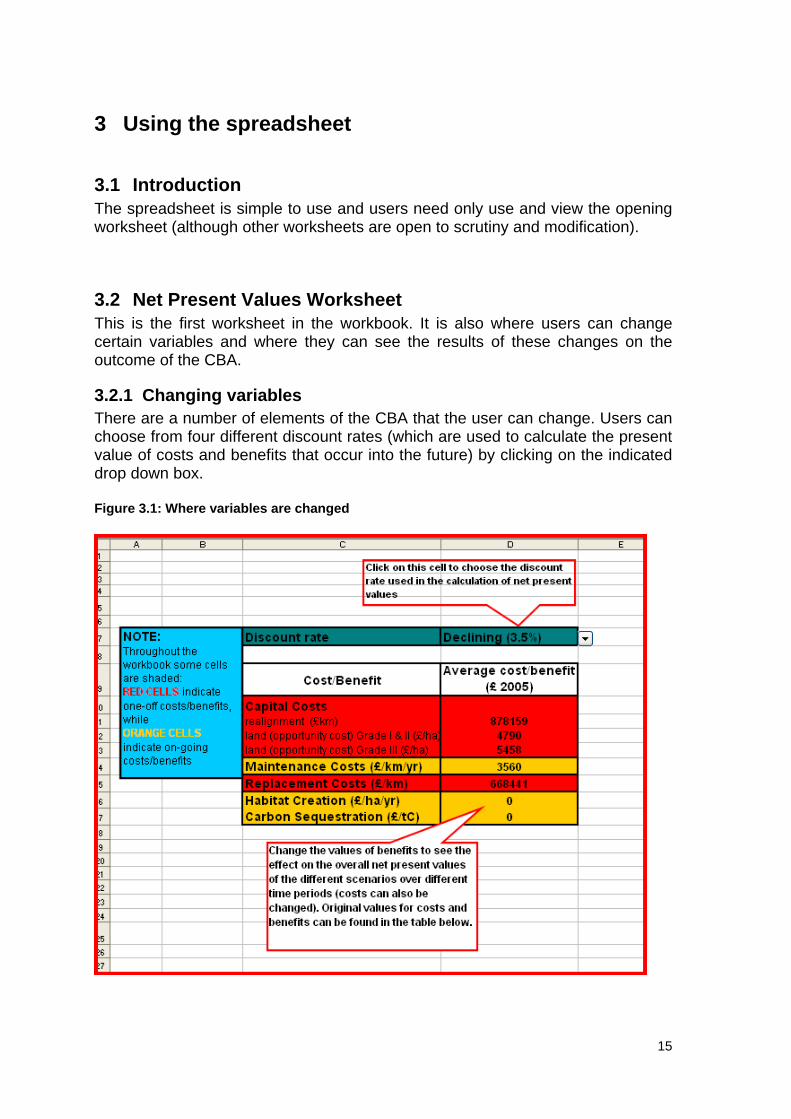
3.2.1 Changing variables There are a number of elements of the CBA that the user can change. Users can choose from four different discount rates (which are used to calculate the present value of costs and benefits that occur into the future) by clicking on the indicated drop down box. Figure 3.1: Where variables are changed
15
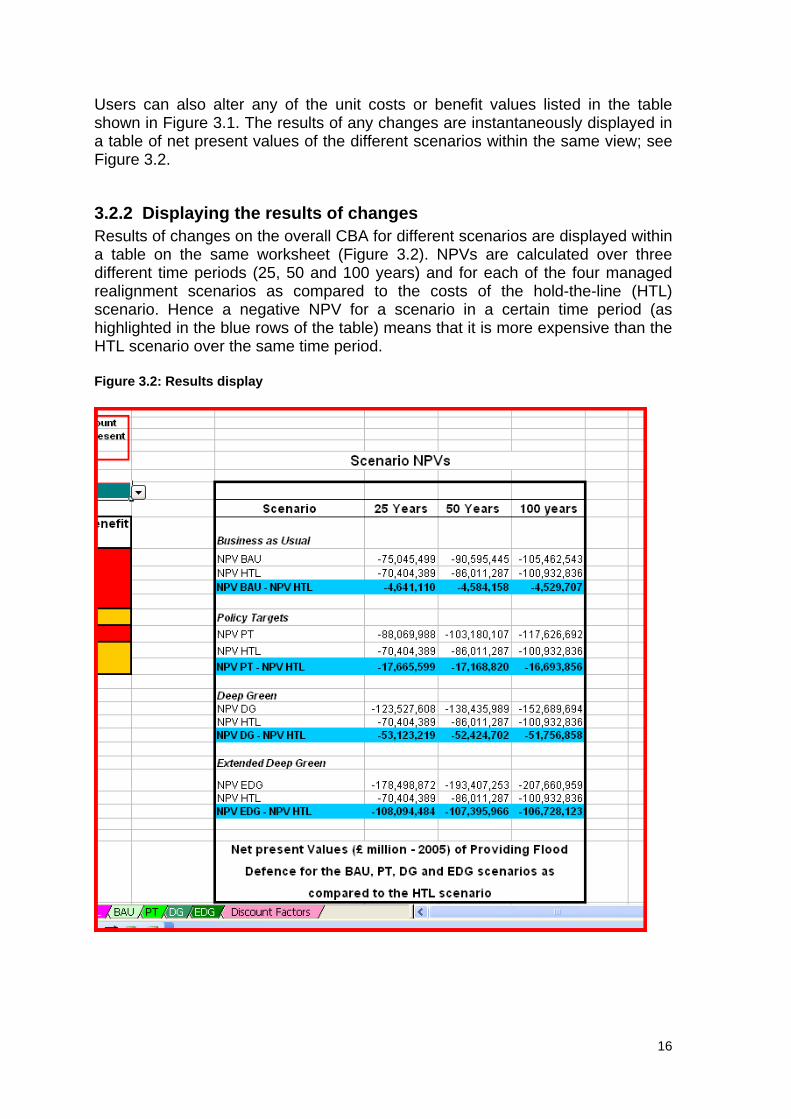
Users can also alter any of the unit costs or benefit values listed in the table shown in Figure 3.1. The results of any changes are instantaneously displayed in a table of net present values of the different scenarios within the same view; see Figure 3.2.
3.2.2 Displaying the results of changes Results of changes on the overall CBA for different scenarios are displayed within a table on the same worksheet (Figure 3.2). NPVs are calculated over three different time periods (25, 50 and 100 years) and for each of the four managed realignment scenarios as compared to the costs of the hold-the-line (HTL) scenario. Hence a negative NPV for a scenario in a certain time period (as highlighted in the blue rows of the table) means that it is more expensive than the HTL scenario over the same time period. Figure 3.2: Results display
16
17
3.2.3 Exploring benefit values Note that no managed realignment scenarios are less expensive than HTL unless the benefits of managed realignment (creation of new habitat and carbon sequestration services) are included in the analysis. This can be explored by entering values into either (or both) of the benefit categories shown in the table in Figure 3.1 and seeing how these change the NPVs of scenarios at different time periods. For reference, the values used for the benefits (and the costs) in the original paper are given in a table on the same worksheet – but below the opening view.
3.3 Other worksheets There are seven other worksheets in the workbook which either provide summary data, perform calculations or contain the discount factors used for calculating NPVs. These are designed to be reasonably self-explanatory and all are open to modification by users.
References Andrews, J. E., Samways, G., Dennis, P. F. and Maher, B. A., 2000. Origin, abundance
and storage of organic carbon and sulphur in the Holocene Humber Estuary: emphasising human impact on storage changes. In Shennan, I. and J. Andrews, J. (Eds), Holocene Land-Ocean Interaction and Environmental Change around the North Sea. Geological Society Publishing House, Bath, UK. Geol. Soc. Spec. Publ. 166: 145-170.
Bergstrom, J. C., Boyle, K. J., Job, C. A. and Kealy, M. J., 1996. Assessing the Economic
Benefits of Groundwater for Environmental Policy Decisions. Water Resources Bulletin 32(2), 279-291.
Davidson, N.C. & Buck, A.L., 1997. An Inventory of UK Estuaries. I. Introduction and
Methodology. Joint Nature Conservation Committee, Peterborough, UK. Davidson, N. C., Laffoley, D. D. A., Doody, J. P., Way, L. S., Gordon, J., Key, R., Drake,
C. M., Pienkowski, M. W., Mitchell, R., and Duff, K. L., 1991. Nature Conservation and Estuaries in Great Britain. Nature Conservancy Council, Peterborough, UK.
Defra, 2001. FCDPAG3 Flood and Coastal Defence Project Appraisal Guidance:
Economic Appraisal. Defra, 2004. Agricultural Land Sales and Prices in England Quarterly. On-line edition
(16/06/04), http://statistics.defra.gov.uk/esg/statnot/alp.xls. Environment Agency, 1998. Humber Estuary: State of the Environment Report.
Environment Agency. Environment Agency, 2000. Planning for Rising Tides: The Humber Estuary Shoreline
Management Plan. Environment Agency. Evans, E., Ashley, R., Hall, J., Penning-Rowsell, E., Saul, A., Sayers, P., Thorne, C. and
Watkinson, A., 2004. Foresight. Future Flooding. Scientific Summary: Volume I - Future risks and their drivers. Office of Science and Technology, London.
Halcrow UK, 2000. Humber Estuary Tidal Defences, Urgent Works 1 - Little Humber to
Thorngumbald Clough. Engineer's Report prepared for the Environment Agency. HMT, 2003. Green Book: Appraisal and Evaluation in Central Government. HMSO,
London. Jarvie, H., Neal, C. and Robson, A., 1997. The geography of the Humber catchment.
Science of the Total Environment, 194-195, 87-99. Jickells, T., Andrews, J., Samways, G., Sanders, R., Malcolm, S., Sivyer, D., Parker, R.,
Nedwell, D., Trimmer, M. and Ridgway, J., 2000. Nutrient Fluxes through the Humber Estuary - Past, Present and Future. Ambio 29(3), 130-135.
Ledoux, L., Beaumont, N., Cave, R., and Turner, R. K., 2005. Scenarios for integrated
river catchment and coastal zone management. Regional Environmental Change 5, 82-96.
18
19
Penning-Rowsell, E.C., Johnson, C., Tunstall, S., Tapsell, S., Morris, J., Chatterton, J. and Green, C., 2005. The Benefits of Flood and Coastal Risk Management: A Handbook of Assessment Techniques. Middlesex University Press, London.
Pethick, J., 2002. Estuarine and Tidal Wetland Restoration in the United Kingdom: Policy
Versus Practice. Restoration Ecology 10(3), 431-437. Pilcher, R., Burston, P. and Davis, R., 2002. Seas of Change. Royal Society for the
Protection of Birds, Sandy, Bedfordshire. Reed, D. J., Spencer, T., Murray, A. L., French, J. R. and Leonard, L. 1999. Marsh
surface sediment deposition and the role of tidal creeks: implications for created and managed coastal marshes. Journal of Coastal Conservation 5, 81-90.
Renwick, A., Ball, A. S. and Pretty, J. N., 2002. Economic, biological and policy
constraints on the adoption of carbon farming in temperate regions. Philosophical Transactions of the Royal Society of London Series a-Mathematical Physical and Engineering Sciences 360, 1721-1740.
Tol, R. S. J., 2005. The marginal damage costs of carbon dioxide emissions: an
assessment of the uncertainties. Energy Policy 33, 2064-2074 Winn, P. J. S., Young, R. M. and Edwards, A. M. C., 2003. Planning for the rising tides:
the Humber Estuary Shoreline Management Plan. The Science of The Total Environment 314-316, 13-30.
Woodward R.T. and Wui Y-S., 2001. The economic value of wetland services: a meta
analysis. Ecological Economics 37, 257-270.